Article

Enhanced Structural and Electrochemical Performance of LiNi0.5Mn1.5O4 Cathode Material by PO43−/Fe3+ Co-Doping

1
Shandong Goldencell Electronics Technology Co., Ltd., Zaozhuang 277100, China
2
School of Materials Science and Engineering, Hebei University of Technology, Tianjin 300401, China
*
Authors to whom correspondence should be addressed.
Batteries 2024, 10(10), 341; https://doi.org/10.3390/batteries10100341
Submission received: 8 August 2024 / Revised: 17 September 2024 / Accepted: 24 September 2024 / Published: 26 September 2024

Abstract

Series of PO43−/Fe3+ co-doped samples of LiNi0.5Mn1.5-5/3xFexP2/3xO4 (x = 0.01, 0.02, 0.03, 0.04, 0.05) have been synthesized by the coprecipitation–hydrothermal method, along with high-temperature calcination using FeSO4 and NaH2PO4 as Fe3+ and PO43− sources, respectively. The effects of the PO43−/Fe3+ co-doping amount on the crystal structure, particle morphology and electrochemical performance of LiNi0.5Mn1.5O4 are intensively studied. The results show that the PO43−/Fe3+ co-doping amount exerts a significant influence on the crystal structure and particle morphology, including increased crystallinity, lowered Mn3+ content, smaller primary particle size with decreased agglomeration and the exposure of high-energy (110) and (311) crystal surfaces in primary particles. The synergy of the above factors contributes to the obviously ameliorated electrochemical performance of the co-doped samples. The LiNi0.5Mn1.45Fe0.03P0.02O4 sample exhibits the best cycling stability, and the LiNi0.5Mn1.4333Fe0.04P0.0267O4 sample displays the best rate performance. The electrochemical properties of LiNi0.5Mn1.5-5/3xFexP2/3xO4 can be regulated by adjusting the PO43−/Fe3+ co-doping amount.

1. Introduction

At present, lithium-ion batteries (LIBs) are widely adopted in portable electronic products, electric vehicles and energy storage equipment due to the advantages of high energy density, a long cycle life and high safety [1]. The capacity, energy density and cycling performance of LIBs mainly depend on the cathode material [2]. The current mainstream commercial cathode materials include LiCoO2, LiMn2O4, LiFePO4 and LiNixCoyMnzO2 (x + y + z = 1) ternary material. The low energy density of LiMn2O4, the complex preparation technology of LiFePO4 and the high cost of Co for LiCoO2 and ternary material limit their further application in electric vehicles and energy storage equipment. Therefore, there is an urgent need to develop a cathode material with a higher energy density, higher safety and lower cost. As is well known, the energy density of LIBs is directly affected by that of the cathode material, which is the product of its specific discharge capacity and operation voltage. Therefore, finding a cathode material with a higher specific capacity or operation voltage can effectively improve the energy density of LIBs.
Spinel LiNi0.5Mn1.5O4 (LNMO) has been regarded as a promising next-generation cathode material due to its high operation voltage of 4.7 V (vs. Li/Li+), high energy density of 650 Wh kg−1, fast Li+ insertion/extraction kinetics and abundant raw materials [3,4]. However, LNMO usually exhibits rapid capacity fading, mainly originating from irreversible structure change, transition metal ion dissolution and side reactions with liquid electrolytes [3]. Many endeavors have been undertaken to alleviate the above problems, such as surface coating and element doping. A surface coating using oxide [5], fluoride [6], phosphate [7] and other compounds (LaFeO3 [8], Li0.35La0.55TiO3 [9], etc.) has been applied to reduce side reactions with an electrolyte. Element doping is believed to be a cost-effective method to improve the structural stability and rate capability of a cathode material. In previous works, cations (Na+ [10], Mg2+ [11], Cr3+ [12], Ru4+ [13], etc.) and anions (F [14], S2− [15], Cl [16], etc.) have been used to dope into the LNMO lattice to improve the electrochemical performance. Presently, much attention has been paid to cation or anion single-doping, which can only improve the specific aspect of electrochemical performance. Therefore, in consideration of the integrated advantages of cation and anion doping, the cation and anion co-doping strategy has been proposed to regulate the spinel structure of LNMO material.
On the other hand, because the polyanion bonds are stronger than TM-O (TM = Ni, Mn) bonds, polyanion doping (PO43−, BO45−, SiO44−, etc.) has been used to enhance the electrochemical performance of Ni-rich and Li-rich cathode materials [17,18,19]. However, until now, there are few reports on polyanion doping modification on LiNi0.5Mn1.5O4 material. In our previous work [20], it was found that a PO43−/Fe3+ co-doped sample exhibited better electrochemical performance than un-doped and single-doped samples. Herein, a series of PO43−/Fe3+ co-doped samples of LiNi0.5Mn1.5-5/3xFexP2/3xO4 (x = 0.01, 0.02, 0.03, 0.04, 0.05) were synthesized via the coprecipitation–hydrothermal method together with two-step calcinations using FeSO4 as an Fe3+ source and NaH2PO4 as a PO43− source. The influence of the PO43−/Fe3+ co-doping amount on the structure, particle morphology and electrochemical properties of LiNi0.5Mn1.5O4 are intensively studied.

2. Materials and Methods

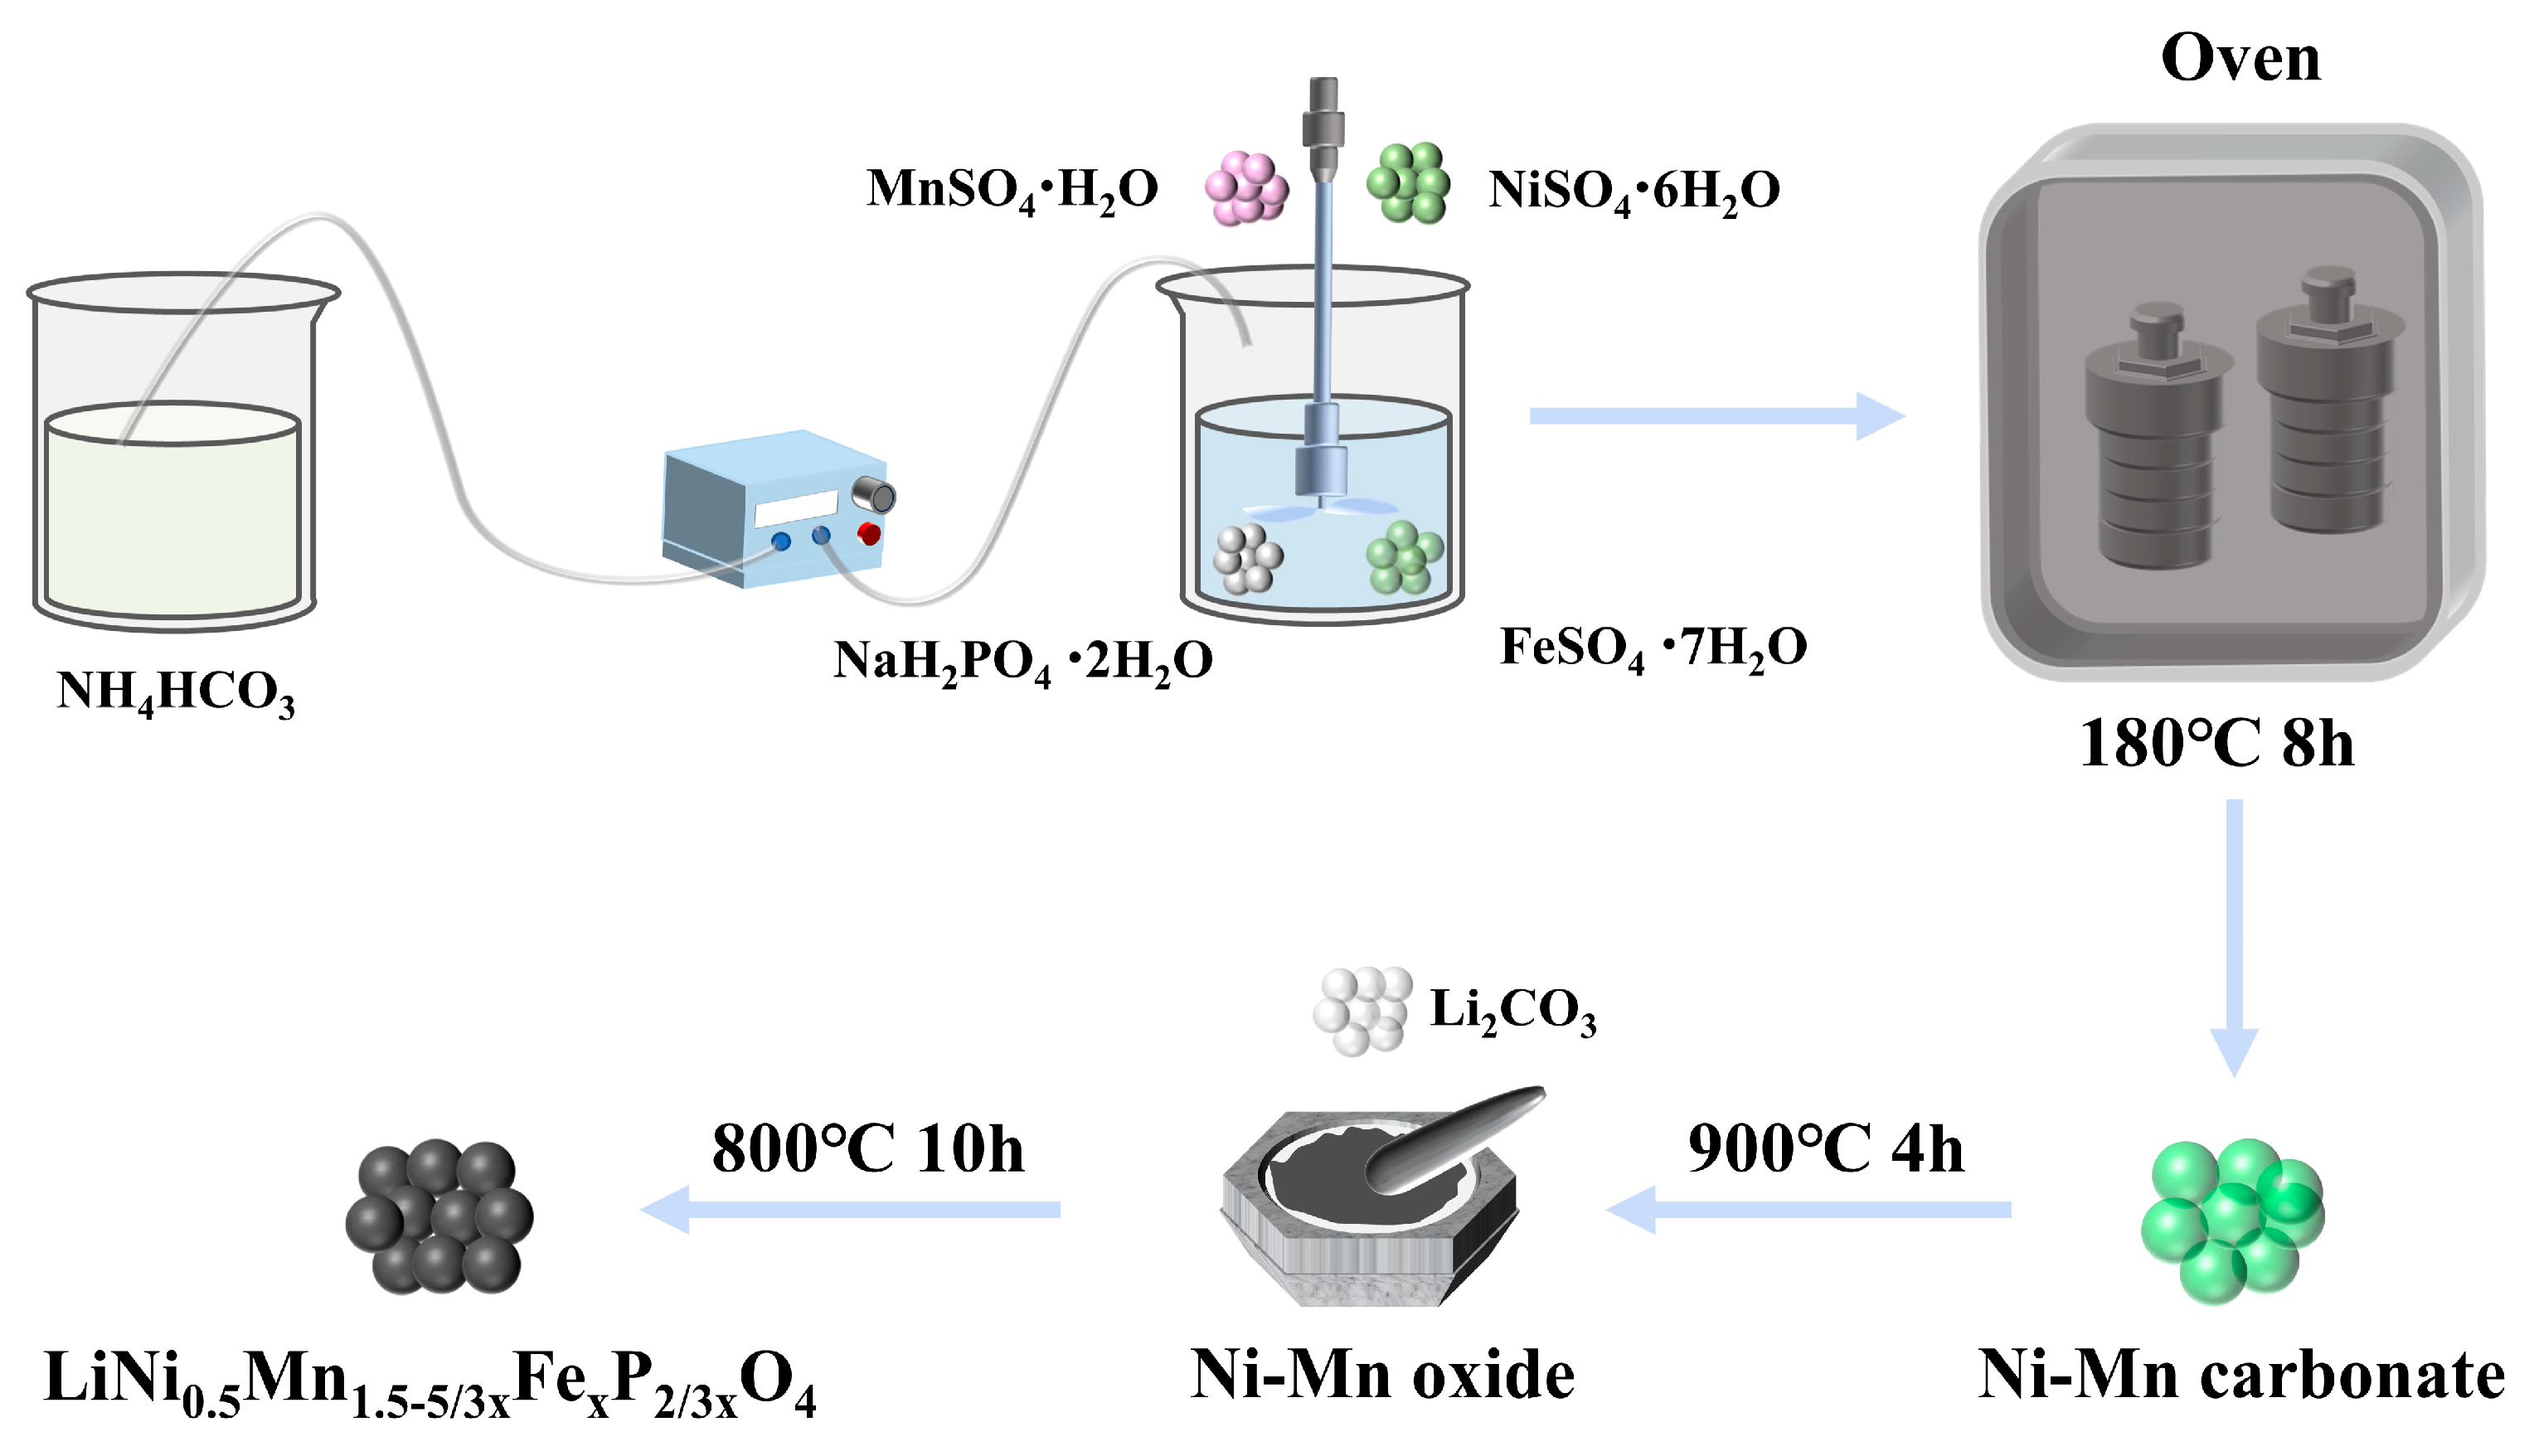
2.1. Material Synthesis

The preparation process of a PO43−/Fe3+ co-doped sample is illustrated in Scheme 1. Firstly, a coprecipitation–hydrothermal method was adopted to prepare a PO43−/Fe3+ co-doped carbonate precursor by using FeSO4 and NaH2PO4 as Fe3+ and PO43− sources, respectively. To be specific, according to the formula LiNi0.5Mn1.5-5/3xFexP2/3xO4 (x = 0.01, 0.02, 0.03, 0.04, 0.05), 0.6 mmol FeSO4·7H2O (99.0%, ShengAo, Tianjin, China) and 0.4 mmol NaH2PO4·2H2O (99.0%, BoDi, Tianjin, China) were added to a mixture of deionized water (160 mL) and ethylene glycol (80 mL). After 30 min of stirring, NiSO4·6H2O (15 mmol, 99%, DaMao) and MnSO4·H2O (45 mmol, 99%, GuangFu, Tianjin, China) were added and stirred for 30 min to obtain a metal salt solution. NH4HCO3 (300 mmol, 99%, FuChen, Tianjin, China) was totally dissolved in deionized water (160 mL), and the obtained solution was added to the above metal salt solution via a peristaltic pump. After stirring for 30 min, the resulting suspension was placed into a Teflon-lined stainless-steel autoclave and maintained at 180 °C for 8 h in a blast oven. After cooling, repeated filtering and washing, the resultant PO43−/Fe3+ co-doped carbonate powder was pre-sintered in a muffle furnace at 900 °C for 4 h to obtain a black oxide powder, which was uniformly blended with 5 wt.% excess Li2CO3 and sintered at 800 °C for 10 h. After sieving through a 325-mesh sieve the final LiNi0.5Mn1.5-5/3xFexP2/3xO4 (x = 0.01, 0.02, 0.03, 0.04, 0.05) products were achieved and named as LNMO-FeP0.01, LNMO-FeP0.02, LNMO-FeP0.03, LNMO-FeP0.04, LNMO-FeP0.05, respectively. For comparison, the un-doped LNMO sample was synthesized based on the above process but with the absence of FeSO4·7H2O and NaH2PO4·2H2O.

2.2. Material Characterization

The crystal structure was analyzed using an X-ray diffractometer (XRD, Smartlab 9KW, Rigaku, Japan) using CuKα radiation in the range of 2θ = 10–80° and Fourier transform infrared spectroscopy (FT-IR, V80, Bruker, Germany) in the range of 700–400 cm−1. Scanning electron microscopy (SEM, JSM-7610F, Japan) was used to observe the particle morphology.

2.3. Electrochemical Tests

CR2032 coin-type cells were assembled in an Ar-filled glove box, which consists of a cathode sheet, lithium metal anode, Celgard 2400 microporous membrane and commercial electrolyte purchased from Tinci Company. The cathode sheet was prepared as follows: LNMO powder, polyvinylidene fluoride (PVDF) and Super P (weight ratio 8:1:1) were mixed uniformly in N-methyl-2-pyrrolidone (NMP) to obtain a slurry, which was casted on aluminum foil using a doctor blade. After vacuum desiccation, the resultant Al foil was cut into 12 mm diameter round sheets. The constant-current charge/discharge tests were measured between 3.5 and 4.95 V at 25 °C on a Land battery test system (CT2001A, Wuhan, China). Cyclic voltammetry (CV) and electrochemical impedance spectroscopy (EIS) tests were conducted on the electrochemical workstation (CHI660E, Chenhua, Shanghai, China) using a two-electrode system. An EIS test was conducted in the frequency range of 100 kHz–100 mHz with a 5 mV amplitude.

3. Results and Discussion

Figure 1a shows the XRD patterns of the pristine LNMO and co-doped LiNi0.5Mn1.5-5/3xFexP2/3xO4 samples. For all samples, the diffraction peaks can be ascribed to an Fd3m cubic spinel LiNi0.5Mn1.5O4 (PDF #80-2162), and the sharp and narrow diffraction peaks suggest a well-crystallized spinel structure for all samples. The absence of impurity diffraction peaks also suggests that the Fe3+ and PO43− ions have been successfully doped into the spinel lattice without changing the crystal structure of the LNMO material. The high phase purity contributes to less side reactions and the ameliorated electrochemical performance of the LNMO material. In contrast, the peak intensities of the co-doped samples are obviously increased in comparison with the un-doped sample, implying enhanced crystallinity after PO43−/Fe3+ co-doping, which also benefits the electrochemical performance of the co-doped samples.
Jade 6.5 software was adopted to refine the XRD patterns, and the refined lattice constants a for the LNMO, LNMO-FeP0.01, LNMO-FeP0.02, LNMO-FeP0.03, LNMO-FeP0.04 and LNMO-FeP0.05 samples are 8.1804 Å, 8.1738 Å, 8.1640 Å, 8.1625 Å, 8.1597 Å and 8.1574 Å, respectively. It is evident that the lattice constants show a gradually decreasing trend with the PO43−/Fe3+ co-doping amount increasing. This is primarily attributed to the P-O (410 kJ mol−1, 298 K) and Fe-O (409 kJ mol−1, 298 K) bonds being stronger than the Ni-O (392 kJ mol−1, 298 K) and Mn-O (402 kJ mol−1, 298 K) bonds, which can reduce oxygen evaporation during the calcination process, thus generating less Mn3+ ions to keep the charge neutrality. In consideration of the smaller ionic radius of Mn4+ (0.530 Å) compared with Mn3+ (0.645 Å), the increasing co-doping amount leads to the gradually decreased Mn3+ content, thereby inducing the gradually decreasing lattice constants. Figure 1b shows the magnified pattern of the (111) peak, where we observe that the (111) peak gradually shifts to higher angles along with the increase in the co-doping amount, in good correspondence with the gradually decreasing lattice constants. The shift of the (111) peak after PO43−/Fe3+ co-doping also suggests their successful incorporation into the spinel lattice.
As mentioned previously, for LiNi0.5Mn1.5O4 materials, the higher the I311/I400 peak intensity ratio is, the better the structural stability is [21]. According to Figure 1a, the calculated I311/I400 intensity ratios for the LNMO, LNMO-Fe0.01, LNMO-FeP0.02, LNMO-FeP0.03, LNMO-FeP0.04 and LNMO-FeP0.05 samples are 1.071, 1.104, 1.170, 1.181, 1.142 and 1.084, respectively. That is, the enhanced I311/I400 ratios of the co-doped samples imply improved structural stability and cycling stability after PO43−/Fe3+ co-doping, mainly due to the higher bonding strength of the Fe-O and P-O bonds. Among the co-doped samples, the LNMO-FeP0.03 sample has the highest I311/I400 ratio, suggesting that it has the best cycling capability However, further increasing the co-doping amount to x = 0.05 leads to a decrease in the I311/I400 ratio, maybe due to the lattice distortion resulting from the excessive doping of PO43−/Fe3+ ions.
In addition, the relative peak intensity in the XRD pattern can reflect the relative exposure of crystal planes [22]. In order to analyze the changes in the exposed crystal planes of samples, the relevant diffraction peaks were normalized to the (111) peak to explore the effect of PO43−/Fe3+ co-doping on the selective growth of the (440) and (311) planes, and the obtained I440/I111 and I311/I111 intensity ratios are listed in Table 1. It is found that appropriate PO43−/Fe3+ co-doping (x ≤ 0.04) can enhance the I440/I111 and I311/I111 intensity ratios, whereas overmuch co-doping (x = 0.05) decreases the ratios again. That is, appropriate PO43−/Fe3+ co-doping can increase the proportion of exposed (110) and (311) crystal planes. The changes in exposed crystal planes after PO43−/Fe3+ co-doping can also be observed from Figure 2.
LiNi0.5Mn1.5O4 material generally displays two different crystal structures, including a disordered Fd3m structure and an ordered P4332 structure [23], which can be distinguished by means of FT-IR, and the corresponding spectra are shown in Figure 1c. Generally, the ordered structure usually has eight absorption peaks, while the disordered one only has five broadened absorption peaks [24]. From Figure 1c, all samples exhibit five broadened absorption peaks at 625, 580, 555, 503 and 465 cm−1, manifesting the dominant disordered Fd3m structure. As is widely accepted, the disordered structure usually exhibits higher electronic conductivity than the ordered one because of the presence of Mn3+ [25]. In addition, from Figure 1c, the 625 cm−1 absorption peak is stronger than the 580 cm−1 absorption peak, also suggesting a dominant disordered Fd3m structure [21]. At the same time, the Ni/Mn disordering degree can be evaluated by the ratio of the 625 cm−1 peak to the 580 cm−1 peak (I625/I580), and a higher I625/I580 ratio usually means a higher degree of Ni/Mn disordering [26]. According to Figure 1c, the I625/I580 intensity ratios of the LNMO, LNMO-Fe0.01, LNMO-FeP0.02, LNMO-FeP0.03, LNMO-FeP0.04 and LNMO-FeP0.05 samples are 1.193, 1.143, 1.054, 1.021, 1.020 and 1.018, respectively. In other words, the degree of Ni/Mn disordering (Mn3+ content) gradually decreases with the co-doping amount. In our previous work [20], the XPS analysis results of un-doped LNMO and co-doped LNMO-FeP0.02 samples also verify the decreased Mn3+ content in the LNMO-FeP0.02 sample. In addition, the XPS results imply that Fe3+ and PO43− ions have been successfully doped into the LNMO-FeP0.02 lattice.
Figure 2 shows SEM images of the un-doped and co-doped samples. From Figure 2a,g, we observe that un-doped LNMO displays a secondary microspherical structure constituted by truncated octahedral primary particles with poor crystallinity and severe agglomeration, which may affect the Li+ ion insertion/extraction process, which is detrimental to the electrochemical properties of the LNMO material.
From Figure 2b,h, LNMO-FeP0.01 shows a similar particle morphology to un-doped LNMO but with improved crystallinity and reduced agglomeration. At a co-doping amount of x = 0.02 (Figure 2c,i), the particle morphology and size of the LNMO-FeP0.02 sample change greatly, and most microsphere particles are replaced by dispersed small particles with greatly decreased primary particle sizes. Besides the (111) and (100) planes, a (110) plane also appears. The emergence of small dispersed particles with high-energy (110) crystal planes is mainly attributed to the enhanced crystal stability caused by the stronger Fe-O and P-O bonds, which allows the particles to exist as small dispersed particles with additional (110) planes.
When x = 0.03 and 0.04, the primary particle size becomes smaller, as shown in Figure 2j,k. However, differently from LNMO-FeP0.02, the primary particles of LNMO-FeP0.03 and LNMO-FeP0.04 agglomerate together to reduce the total surface energy. And as seen from Figure 2j,k, the primary particles even exhibit a (311) plane besides the (111), (100) and (110) planes, which is induced by the synergistic effect of PO43−/Fe3+ co-doping. When x further increases to 0.05, as shown in Figure 2f,l, primary LNMO-FeP0.05 particles agglomerate into the secondary microsphere structure, and the (311) and (110) planes decrease or even disappear. This may be due to the fact that excessive PO43−/Fe3+ doping may cause lattice distortion, which in turn destroys the stability of the crystal structure.
Figure 3a shows the first-cycle charge/discharge curves of the un-doped and co-doped samples at a 0.2 C rate. The first specific discharge capacities at the 0.2 C rate are 120.0, 131.4, 134.5, 134.6, 145.2 and 130.6 mAh g−1, respectively, for LNMO, LNMO-Fe0.01, LNMO-FeP0.02, LNMO-FeP0.03, LNMO-FeP0.04 and LNMO-FeP0.05. That is, the first specific discharge capacities are increased after co-doping because of the improved crystallinity, decreased primary particle size and agglomeration, as well as the appearance of high-energy crystal planes. The emergence of high-energy (110) and (311) crystal planes contribute to LNMO-FeP0.04 having the highest first discharge capacity.
In addition, the ~4.7 V and ~4.0 V plateaus in the charge/discharge curves of all samples can be separately ascribed to Ni2+/Ni4+ and Mn3+/Mn4+ redox couples. The presence of a ~4.0 V plateau also confirms the dominant disordered structure, consistent with the above FT-IR results. In addition, the relative Mn3+ contents can be evaluated by the discharge capacity between 3.8 and 4.25 V divided by the total discharge capacity according to the first-cycle discharge curves [27], which are 14.83%, 11.47%, 9.37%, 9.21%, 8.92% and 8.03%, respectively, for LNMO, LNMO-Fe0.01, LNMO-FeP0.02, LNMO-FeP0.03, LNMO-FeP0.04 and LNMO-FeP0.05. That is, the Mn3+ content gradually decreases with the co-doping amount, due to the fact that that the stronger Fe-O and P-O bonds reduce oxygen loss during calcination and then result in the formation of fewer Mn3+ ions.
Figure 3b shows the rate capability curves of the un-doped and co-doped samples, with five cycles at 0.2 C, 1 C, 2 C, 5 C and 10 C rates and then back to 0.2 C. The discharge capacities at each rate are enhanced after co-doping, suggesting that the rate performance is improved after co-doping. The 10 C discharge capacities for LNMO, LNMO-Fe0.01, LNMO-FeP0.02, LNMO-FeP0.03, LNMO-FeP0.04 and LNMO-FeP0.05 are 111.7, 116.4, 125.2, 132.3, 134.6 and 122.8 mAh g−1. That is, LNMO-FeP0.04 displays the optimal rate capability among the co-doped samples. When x ≤ 0.04, the gradually improved rate capability is mainly induced by the smaller primary particles, higher crystallinity, lower agglomeration and exposure of high-energy (110) and (311) crystal planes. The smaller primary particles may enlarge the electrode/electrolyte contact area and make the Li+ ions’ diffusion path shorter. The increased exposure of high-energy (110) and (311) crystal planes is more conductive to Li+ ion diffusion [12]. The optimal rate capability of the LNMO-FeP0.04 sample is mainly attributed to the greater exposure of the (110) and (311) crystal planes. As x further increases to 0.05, the rate performance deteriorates adversely due to the lower Mn3+ content and the reduction or disappearance of the (311) and (110) crystal planes.
The cycling performance test was conducted on the un-doped and co-doped samples at 1 C and 25 °C, as shown in Figure 3c. The gradual decrease in discharge capacities with the cycle number is mainly ascribed to interfacial side reactions between the electrode and electrolyte and the accompanying continual growth of a CEI (Cathode–Electrolyte Interphase) layer on the electrode surface. The capacity retention rates are 76.7%, 80.9%, 85.9%, 88.8%, 83.1% and 78.6%, respectively, for LNMO, LNMO-Fe0.01, LNMO-FeP0.02, LNMO-FeP0.03, LNMO-FeP0.04 and LNMO-FeP0.05 after 200 cycles. It is evident that the cycling performance is obviously improved after PO43−/Fe3+ co-doping. The LNMO-FeP0.03 sample exhibits the optimal cycling performance. When the co-doping amount x ≤ 0.03, the cycling performance is gradually enhanced because of the reduced Mn3+ content and the decreased (111) crystal plane. A lower Mn3+ content may reduce the Jahn–Teller effect and Mn2+ dissolution during cycling [22]. In addition, the crystal planes contacting the electrolyte greatly affect the cycling capability of the LNMO material [28]. The (111) crystal plane has been reported to accelerate Mn2+ dissolution and demonstrate unstable interface behaviors at a high voltage, thereby adversely affecting the cycling capability of the LNMO material [28,29]. Therefore, increased exposure of the (111) crystal plane is disadvantageous to the cycling performance of the LNMO material. On the other hand, stronger Fe-O and P-O bonds can make the crystal structure more stable and reduce lattice stress during cycling, which is also conductive to the cycling performance of the LNMO material. However, a further increase in the co-doping amount leads to a decline in the cycling capability of LNMO-FeP0.04 and LNMO-FeP0.05, probably because of the lattice distortion caused by excessive doping disrupting the crystal structure stability. Additionally, the increased agglomeration and decreased Mn3+ content are also detrimental to the cycling performance of the LNMO-FeP0.04 and LNMO-FeP0.05 samples.
Figure 4 shows the CV curves obtained at different scan rates. Due to the limitations of Li+ diffusion dynamics, the oxidation/reduction peaks of all electrodes shift towards higher and lower potentials, respectively, as the scan rate increases. As shown in the insets of Figure 4a–f, the peak current (ip) of the oxidation/reduction peaks exhibits a linear relation with the square root of the scan rate (ν1/2). The Li+ diffusion coefficient (DLi) for each redox peak can be obtained based on the Randles–Sevcik equation [30]:
ip = (2.69 × 10⁵)n3/2ADLi1/2ν1/2C0
where ip is peak current (mA), n is 1, A is the electrode surface area (~1.13 cm2), ν is the voltage scan rate (mV s−1), and C0 is the initial Li+ ion concentration in the cathode (mol cm−3), which can be calculated according to the equation C0 = 8/(NA·V), where NA is 6.02 × 10²³, and V is the refined lattice volume from the XRD pattern. The average Li+ diffusion coefficient (Da) was obtained by averaging the four DLi values, as shown in Table 2. The Da values are 1.084 × 10⁻¹⁰, 2.251 × 10⁻¹⁰, 3.609 × 10⁻¹⁰, 4.011 × 10⁻¹⁰, 4.582 × 10⁻¹⁰ and 2.594 × 10⁻¹⁰ cm2 s−1, respectively, for LNMO, LNMO-Fe0.01, LNMO-FeP0.02, LNMO-FeP0.03, LNMO-FeP0.04 and LNMO-FeP0.05. Evidently, all the co-doped samples exhibit higher Li+ diffusion coefficients than the un-doped ones, which is attributable to improved crystallinity, reduced agglomeration, smaller primary particle size and a higher proportion of exposed (110) and (311) crystal planes. Compared to the (111) and (110) planes, the (110) and (311) planes expedite Li+ ion diffusion during the cycling process [28], leading to a better rate capability of LNMO materials with more (110) and (311) planes, which accounts for the largest Li+ ion diffusion coefficient of LNMO-FeP0.04. However, when x = 0.05, the Li+ diffusion coefficient decreases significantly, possibly due to the disappearance of the (110) and (311) planes and increased agglomeration.
To further determine the improved cycling capability of the co-doped samples, the EIS was tested to observe the impedance change after 50, 100, 150 and 200 cycles. Figure 5 shows the obtained Nyquist plots and fitting curves. All plots comprise two semicircles and a sloping line, representing the resistance of Li+ ions passing through the electrode surface film (Rsf), charge transfer resistance (Rct) and Warburg resistance associated with Li+ ion diffusion in the electrode bulk (Zw). Manthiram et al. [31] pointed out that Rsf and Rct include surface film and charge transfer resistances from the cathode and Li anode. Because the Li anode goes through the same electrochemical process before the EIS test, the obtained Rsf and Rct values can roughly represent the resistances from the cathode. Table 3 lists the fitted Rsf and Rct values, obtained using ZView2 software, according to the equivalent circuit in the inset of Figure 5. For all electrodes, the gradual increase in Rsf with the cycle number may be caused by the continual side reactions and CEI growth. However, after different cycle numbers, the Rsf of co-doped samples is decreased compared to the un-doped sample, implying the effectively inhibited side reactions and CEI growth after co-doping. On one hand, stronger Fe-O and P-O bonds have a strong inhibitory effect on lattice distortion during cycling. On the other hand, the exposed crystal planes also affect interfacial side reactions. The exposure of more (110) and (311) crystal planes could reduce interfacial side reactions, thereby decreasing interfacial impedance. Additionally, when the co-doping amount x = 0.03, the LNMO-FeP0.03 sample exhibits the lowest Rsf values due to its higher proportion of exposed (110) and (311) planes and moderate agglomeration. However, when x ≥ 0.04, the particle agglomeration rates of the samples increase, and the (110) and (311) crystal planes gradually decrease until their disappearance at x = 0.05, thus leading to increased side reactions. Consequently, LNMO-FeP0.04 and LNMO-FeP0.05 exhibit higher Rsf values than LNMO-FeP0.03.
In addition, the Rct values after 50, 100, 150 and 200 cycles are also compared in Table 3, showing a gradually increasing trend with cycling. Among them, the LNMO-FeP0.03 electrode displays smaller Rct values during the whole cycle process, suggesting its faster electrochemical kinetics, maybe due to the fewer interfacial side reactions.

4. Conclusions

LiNi0.5Mn1.5O4 materials with different PO43−/Fe3+ co-doping amounts have been synthesized using a combined coprecipitation–hydrothermal method along with high-temperature calcination. The results reveal that the Ni/Mn disordering degree and Mn3+ content gradually decrease with the co-doping amounts. SEM observations show that the particle morphology of the samples is influenced significantly by the co-doping amounts. The aggregation degree first decreases and then increases with the co-doping amounts. Additionally, when the co-doping amount x ≤ 0.04, high-energy (110) and (311) crystal planes gradually increase with increasing co-doping amounts. However, when the co-doping amount increases to x = 0.05, the (311) and (110) crystal planes gradually decrease or even disappear. Electrochemical tests demonstrate that the LiNi0.5Mn1.45Fe0.03P0.02O4 sample (x = 0.03) exhibits the best cycling stability, and the LiNi0.5Mn1.4333Fe0.04P0.0267O4 (x = 0.04) sample exhibits the optimal rate performance. This co-doping strategy can also be adopted to other cathode materials to achieve an intriguing electrochemical performance.

Author Contributions

Y.W. and S.F. contributed equally to this work. Conceptualization, methodology and software, S.F.; formal analysis, Y.W.; data curation, X.D.; resources, D.W.; writing—review and editing, J.Z. and L.W.; funding acquisition, L.W.; supervision, G.L. All authors have read and agreed to the published version of the manuscript.

Funding

This research was funded by the National Natural Science Foundation of China, grant number [No. 51802074].

Data Availability Statement

The raw data supporting the conclusions of this article will be made available by the authors on request.

Conflicts of Interest

Authors Yong Wang, Xianzhen Du, Dong Wei, Jingpeng Zhang and Guangchuan Liang were employed by the company Shandong Goldencell Electronics Technology Co., Ltd. The remaining authors declare that the research was conducted in the absence of any commercial or financial relationships that could be construed as a potential conflict of interest.

References

  1. Qian, H.; Ren, H.; Zhang, Y.; He, X.; Li, W.; Wang, J.; Hu, J.; Yang, H.; Sari, H.M.K.; Chen, Y.; et al. Surface doping vs. bulk doping of cathode materials for lithium-ion batteries: A review. Electrochem. Energy Rev. 2022, 5, 2. [Google Scholar] [CrossRef]
  2. Yi, H.; Liang, Y.; Qian, Y.; Feng, Y.; Li, Z.; Zhang, X. Low-cost Mn-based cathode materials for lithium-ion batteries. Batteries 2023, 9, 246. [Google Scholar] [CrossRef]
  3. Wu, W.; Zuo, S.; Zhang, X.; Feng, X. Two-step solid state synthesis of medium entropy LiNi0.5Mn1.5O4 cathode with enhanced electrochemical performance. Batteries 2023, 9, 91. [Google Scholar] [CrossRef]
  4. Wang, B.; Son, S.-B.; Badami, P.; Trask, S.E.; Abraham, D.; Qin, Y.; Yang, Z.; Wu, X.; Jansen, A.; Liao, C. Understanding and mitigating the dissolution and delamination issues encountered with high-voltage LiNi0.5Mn1.5O4. Batteries 2023, 9, 435. [Google Scholar] [CrossRef]
  5. Ma, C.; Wen, Y.; Qiao, Q.; He, P.; Ren, S.; Li, M.; Zhao, P.; Qiu, J.; Tang, G. Improving electrochemical performance of high-voltage spinel LiNi0.5Mn1.5O4 cathodes by silicon oxide surface modification. ACS Appl. Energy Mater. 2021, 4, 12201–12210. [Google Scholar] [CrossRef]
  6. Yu, C.; Dong, L.; Zhang, Y.; Du, K.; Gao, M.; Zhao, H.; Bai, Y. Promoting electrochemical performances of LiNi0.5Mn1.5O4 cathodes via YF3 surface coating. Solid State Ion. 2020, 357, 115464. [Google Scholar] [CrossRef]
  7. Wu, Y.; Ben, L.; Zhan, Y.; Yu, H.; Qi, W.; Zhao, W.; Huang, X. Binding Li3PO4 to spinel LiNi0.5Mn1.5O4 via a surface Co-containing bridging layer to improve the electrochemical performance. Energy Technol. 2021, 9, 2100147. [Google Scholar] [CrossRef]
  8. Mou, J.R.; Deng, Y.L.; He, L.H.; Zheng, Q.J.; Jiang, N.; Lin, D.M. Critical roles of semi-conductive LaFeO3 coating in enhancing cycling stability and rate capability of 5 V LiNi0.5Mn1.5O4 cathode materials. Electrochim. Acta 2018, 260, 101–111. [Google Scholar] [CrossRef]
  9. Mereacre, V.; Stüble, P.; Trouillet, V.; Ahmed, S.; Volz, K.; Binder, J.R. Coating versus doping: Understanding the enhanced performance of high-voltage batteries by the coating of spinel LiNi0.5Mn1.5O4 with Li0.35La0.55TiO3. Adv. Mater. Interfaces 2023, 10, 2201324. [Google Scholar] [CrossRef]
  10. Wang, J.; Chen, D.; Wu, W.; Wang, L.; Liang, G. Effects of Na+ doping on crystalline structure and electrochemical performances of LiNi0.5Mn1.5O4 cathode material. Trans. Nonferrous Met. Soc. China 2017, 27, 2239–2248. [Google Scholar] [CrossRef]
  11. Liang, G.; Wu, Z.; Didier, C.; Zhang, W.; Cuan, J.; Li, B.; Ko, K.-Y.; Hung, P.-Y.; Lu, C.-Z.; Chen, Y.; et al. A long cycle-life high-voltage spinel lithium-ion battery electrode achieved by site-selective doping. Angew. Chem. Int. Ed. 2020, 59, 10594–10602. [Google Scholar] [CrossRef] [PubMed]
  12. Hsiao, Y.-S.; Huang, J.-H.; Cheng, T.-H.; Hu, C.-W.; Wu, N.-J.; Yen, C.-Y.; Hsu, S.-C.; Weng, H.C.; Chen, C.-P. Cr-doped LiNi0.5Mn1.5O4 derived from bimetallic Ni/Mn metal-organic framework as high-performance cathode for lithium-ion batteries. J. Energy Storage 2023, 68, 107686. [Google Scholar] [CrossRef]
  13. Zhou, D.; Li, J.; Chen, C.; Lin, F.; Wu, H.; Guo, J. A hydrothermal synthesis of Ru-doped LiMn1.5Ni0.5O4 cathode materials for enhanced electrochemical performance. RSC Adv. 2021, 11, 12549. [Google Scholar] [CrossRef]
  14. Luo, Y.; Li, H.; Lu, T.; Zhang, Y.; Mao, S.S.; Liu, Z.; Wen, W.; Xie, J.; Yan, L. Fluorine gradient-doped LiNi0.5Mn1.5O4 spinel with improved high voltage stability for Li-ion batteries. Electrochim. Acta 2017, 238, 237–245. [Google Scholar] [CrossRef]
  15. Kim, D.-W.; Zettsu, N.; Shiiba, H.; Sánchez-Santolino, G.; Ishikawa, R.; Ikuhara, Y.; Teshima, K. Metastable oxysulfide surface formation on LiNi0.5Mn1.5O4 single crystal particles by carbothermal reaction with sulfur-doped heterocarbon nanoparticles: New insight into their structural and electrochemical characteristics, and their potential applications. J. Mater. Chem. A 2020, 8, 22302–22314. [Google Scholar]
  16. Kim, W.-K.; Han, D.-W.; Ryu, W.-H.; Lim, S.-J.; Eom, J.-Y.; Kwon, H.-S. Effects of Cl doping on the structural and electrochemical properties of high voltage LiMn1.5Ni0.5O4 cathode materials for Li-ion batteries. J. Alloys Compd. 2014, 592, 48–52. [Google Scholar] [CrossRef]
  17. Chen, T.; Li, X.; Wang, H.; Yan, X.; Wang, L.; Deng, B.; Ge, W.; Qu, M. The effect of gradient boracic polyanion-doping on structure, morphology, and cycling performance of Ni-rich LiNi0.8Co0.15Al0.05O2 cathode material. J. Power Sources 2018, 374, 1–11. [Google Scholar] [CrossRef]
  18. Yang, G.; Pan, K.; Lai, F.; Wang, Z.; Chu, Y.; Yang, S.; Han, J.; Wang, H.; Zhang, X.; Li, Q. Integrated co-modification of PO43- polyanion doping and Li2TiO3 coating for Ni-rich layered LiNi0.6Co0.2Mn0.2O2 cathode material of lithium-ion batteries. Chem. Eng. J. 2021, 421, 129964. [Google Scholar] [CrossRef]
  19. Zhang, H.-Z.; Li, F.; Pan, G.-L.; Li, G.-R.; Gao, X.-P. The effect of polyanion-doping on the structure and electrochemical performance of Li-rich layered oxides as cathode for lithium-ion batteries. J. Electrochem. Soc. 2015, 162, A1899–A1904. [Google Scholar] [CrossRef]
  20. Fu, S.; Zhang, Y.; Bian, Y.; Xu, J.; Wang, L.; Liang, G. Effect of Fe3+ and/or PO43− doping on the electrochemical performance of LiNi0.5Mn1.5O4 cathode material for Li-ion batteries. Ind. Eng. Chem. Res. 2023, 62, 1016–1028. [Google Scholar] [CrossRef]
  21. Lan, L.; Li, S.; Li, J.; Lu, L.; Lu, Y.; Huang, S.; Xu, S.; Pan, C.; Zhao, F. Enhancement of the electrochemical performance of the spinel structure LiNi0.5−xGaxMn1.5O4 cathode material by Ga doping. Nanoscale Res. Lett. 2018, 13, 251. [Google Scholar] [CrossRef] [PubMed]
  22. Gong, J.; Fu, S.; Zhang, Y.; Yan, S.; Lang, Y.; Guo, J.; Wang, L.; Liang, G. Enhanced electrochemical performance of 5V LiNi0.5Mn1.5−xZrxO4 cathode material for lithium-ion batteries. ChemistrySelect 2021, 6, 7202–7212. [Google Scholar] [CrossRef]
  23. Liu, D.; Hamel-Paquet, J.; Trottier, J.; Barray, F.; Gariépy, V.; Hovington, P.; Guerfi, A.; Mauger, A.; Julien, C.M.; Goodenough, J.B.; et al. Synthesis of pure phase disordered LiMn1.45Cr0.1Ni0.45O4 by a post-annealing method. J. Power Sources 2012, 217, 400–406. [Google Scholar] [CrossRef]
  24. Kunduraci, M.; Amatucci, G.G. Synthesis and characterization of nanostructured 4.7 V LixMn1.5Ni0.5O4 spinels for high-power lithium-ion batteries. J. Electrochem. Soc. 2006, 153, A1345–A1352. [Google Scholar] [CrossRef]
  25. Kim, J.-H.; Myung, S.-T.; Yoon, C.S.; Kang, S.G.; Sun, Y.-K. Comparative study of LiNi0.5Mn1.5O4−δ and LiNi0.5Mn1.5O4 cathodes having two crystallographic structures: Fd3m and P4332. Chem. Mater. 2004, 16, 906–914. [Google Scholar] [CrossRef]
  26. Zheng, X.; Liu, W.; Qu, Q.; Zheng, H.; Huang, Y. Bi-functions of titanium and lanthanum co-doping to enhance the electrochemical performance of spinel LiNi0.5Mn1.5O4 cathode. J. Mater. 2019, 5, 156–163. [Google Scholar] [CrossRef]
  27. Zeng, Y.-P.; Wu, X.-l.; Mei, P.; Cong, L.-N.; Yao, C.; Wang, R.-S.; Xie, H.-M.; Sun, L.-Q. Effect of cationic and anionic substitutions on the electrochemical properties of LiNi0.5Mn1.5O4 spinel cathode materials. Electrochim. Acta 2014, 138, 493–500. [Google Scholar] [CrossRef]
  28. Liu, H.; Wang, J.; Zhang, X.; Zhou, D.; Qi, X.; Qiu, B.; Fang, J.; Kloepsch, R.; Schumacher, G.; Liu, Z.; et al. Morphological evolution of high-voltage spinel LiNi0.5Mn1.5O4 cathode materials for lithium-ion batteries: The critical effects of surface orientations and particle size. ACS Appl. Mater. Interfaces 2016, 8, 4661–4675. [Google Scholar] [CrossRef]
  29. Chen, Z.; Zhao, R.; Du, P.; Hu, H.; Wang, T.; Zhu, L.; Chen, H. Polyhedral LiNi0.5Mn1.5O4 with excellent electrochemical properties for lithium-ion batteries. J. Mater. Chem. A 2014, 2, 12835–12848. [Google Scholar] [CrossRef]
  30. Liu, W.; Li, X.; Xiong, D.; Hao, Y.; Li, J.; Kou, H.; Yan, B.; Li, D.; Lu, S.; Koo, A.; et al. Significantly improving cycling performance of cathodes in lithium ion batteries: The effect of Al2O3 and LiAlO2 coatings on LiNi0.6Co0.2Mn0.2O2. Nano Energy 2018, 44, 111–120. [Google Scholar] [CrossRef]
  31. Liu, J.; Manthiram, A. Understanding the improved electrochemical performances of Fe-substituted 5 V spinel cathode LiMn1.5Ni0.5O4. J. Phys. Chem. C 2009, 113, 15073–15079. [Google Scholar] [CrossRef]
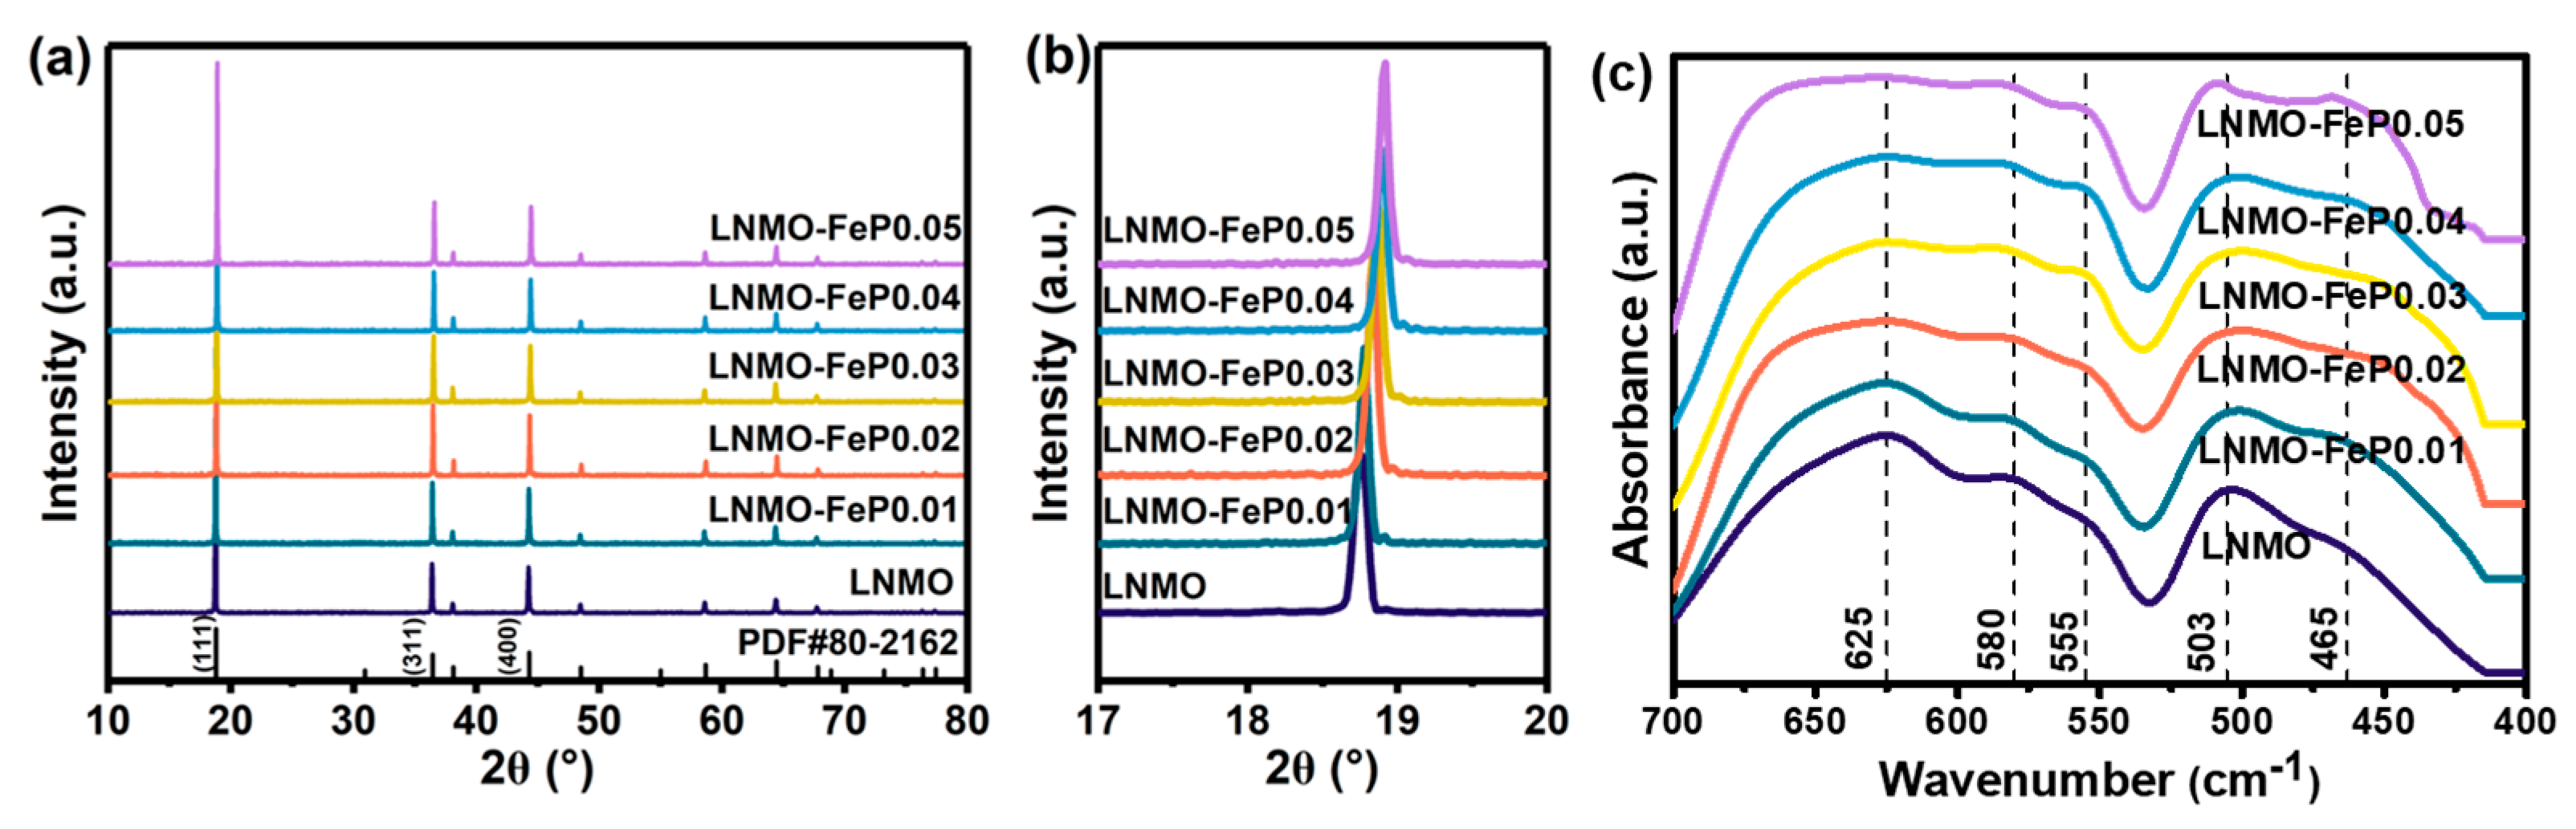
Scheme 1. Illustration of preparation process for PO43−/Fe3+ co-doped sample.
Batteries 10 00341 sch001
Figure 1. XRD patterns (a) and magnified pattern of (111) peak (b) and FT-IR spectra (c) of all samples.
Batteries 10 00341 g001
Figure 2. SEM images of all samples: (a,g) LNMO, (b,h) LNMO-FeP0.01, (c,i) LNMO-FeP0.02, (d,j) LNMO-FeP0.03, (e,k) LNMO-FeP0.04, (f,l) LNMO-FeP0.05.
Batteries 10 00341 g002
Figure 3. First-cycle charge/discharge curves at 0.2 C rate (a), rate capability curves (b) and cycling and coulombic efficiency curves (c) for all samples.
Batteries 10 00341 g003
Figure 4. CV curves obtained at different scan rates and linear relationship between peak current and square root of scan rates for un-doped and co-doped samples: (a) LNMO, (b) LNMO-FeP0.01, (c) LNMO-FeP0.02, (d) LNMO-FeP0.03, (e) LNMO-FeP0.04, (f) LNMO-FeP0.05.
Batteries 10 00341 g004
Figure 5. Nyquist plots and fitting lines after different cycle numbers for un-doped and co-doped samples: (a) LNMO, (b) LNMO-FeP0.01, (c) LNMO-FeP0.02, (d) LNMO-FeP0.03, (e) LNMO-FeP0.04, (f) LNMO-FeP0.05.
Batteries 10 00341 g005
Table 1. I440/I111 and I311/I111 intensity ratios for un-doped and co-doped samples.
SampleI440/I111I311/I111
LNMO0.08570.312
LNMO-FeP0.010.08620.313
LNMO-FeP0.020.08710.314
LNMO-FeP0.030.08950.321
LNMO-FeP0.040.09670.328
LNMO-FeP0.050.08700.309
Table 2. Li+ ions diffusion coefficients (DLi) for un-doped and co-doped samples.
SampleDLi (×10−10 cm2 s−1)Da
(×10−10 cm2 s−1)
O1R1O2R2
LNMO0.4971.6941.3270.8171.084
LNMO-FeP0.011.9473.9332.0271.0982.251
LNMO-FeP0.022.0392.9596.1363.3023.609
LNMO-FeP0.033.6656.5022.6063.2694.011
LNMO-FeP0.041.6946.0586.8503.7254.582
LNMO-FeP0.051.5654.7451.4102.6572.594
Table 3. Fitted Rsf and Rct values according to Figure 5a–f.
SampleResistance
(Ω)
After 50 CyclesAfter 100 CyclesAfter 150 CyclesAfter 200 Cycles
LNMORsf38.5668.1679.7091.11
Rct65.2272.16123.70136.20
LNMO-FeP0.01Rsf30.6049.2672.2597.14
Rct49.3768.3478.0192.70
LNMO-FeP0.02Rsf21.7536.3644.3446.70
Rct34.5436.0443.8648.64
LNMO-FeP0.03Rsf12.4818.8424.0925.71
Rct15.6024.3841.5743.21
LNMO-FeP0.04Rsf38.7457.5266.3974.19
Rct26.6545.7952.7865.52
LNMO-FeP0.05Rsf39.1044.7372.2878.66
Rct70.3277.6284.31114.50
Disclaimer/Publisher’s Note: The statements, opinions and data contained in all publications are solely those of the individual author(s) and contributor(s) and not of MDPI and/or the editor(s). MDPI and/or the editor(s) disclaim responsibility for any injury to people or property resulting from any ideas, methods, instructions or products referred to in the content.

