Article

Study of Solar Energetic Particle Events with Ulysses, ACE Observations and Numerical Simulations †

1
School of Science, Harbin Institute of Technology, Shenzhen 518055, China
2
College of Physics, Hebei Normal University, Shijiazhuang 050024, China
*
Authors to whom correspondence should be addressed.
This paper is an extended version of our paper published in Lian, L.; Qin, G.; Wang, Y.; Cui, S. Observations and numerical simulations of gradual SEP events with Ulysses and ACE. In Proceedings of the 37th International Cosmic Ray Conference, ICRC 2021, Berlin, Germany 12–13 July 2021; Volume 395, p. 1351.
Magnetochemistry 2023, 9(4), 96; https://doi.org/10.3390/magnetochemistry9040096
Submission received: 23 February 2023 / Revised: 13 March 2023 / Accepted: 14 March 2023 / Published: 30 March 2023
(This article belongs to the Special Issue Magnetodynamics of Space Plasmas)

Abstract

:
We study the latitudinal extent of the near-relativistic electron events of 10 June 2000 and 26 December 2001, observed by both Ulysses and ACE. From the observations it is shown that the intensity of ACE was quite different from that of Ulysses. Through the numerical simulations, we obtain the SEPs time-intensity profiles, which generally fit well to the observations. To compare the observations we obtained the best fit parameters for the simulations. We suggest that the transport effects, especially the perpendicular diffusion effect, can cause the difference between the intensity profiles of ACE and Ulysses, which is dominated by particle transport at a large radial distance and high-latitude when a spacecraft has poor magnetic connection to the particle source. Furthermore, we present the particle source from the best fit parameters to show that the start and peak times of the particle sources are between the onset and max times of a flare in all the energy channels. Moreover, we propose models for the peak intensity and half width of the particle source, and the time interval from the flare onset to the particle source peak time. We show that the models generally agree with the best fit parameters.

1. Introduction

Solar energetic particle (SEP), including ions and electrons, observations in the heliosphere provide fundamental information on the SEP acceleration, injection and transport conditions. According to the composition, spectra, and temporal behaviour, SEP events can be typically grouped into two classes: the impulsive events and gradual events [1,2]. Generally speaking, impulsive events are believed to be flare-associated and therefore show a short duration, low intensity, and richness in electrons (electron-dominated), 3 He, and heavy ions. In contrast, gradual events are often associated with coronal mass ejection (CME)-driven shocks and exhibit long duration, high intensity, and richness in protons (proton-dominated). In addition, mixed events of these two types of events also exist [3,4]. However, recently, it is suggested that SEPs are related to both flares and CMEs according to observations [5,6,7], so the above classification of SEP events is not widely acknowledged anymore, but it can still be used as a guide to the possible origin of specific events. With statistics from observations, Wang et al. [8] found that most solar energetic electron events are impulsive and have a 3 He/ 4 He value much higher than that in solar coronal or background solar winds, and in vary rare cases, solar energetic electron events are gradual without the high 3 He/ 4 He value.
The near-relativistic (NR) ( E > 30 keV) electron observed in interplanetary (IP) space is one of the common types of SEP emission. NR electron events detected at a single spacecraft can be used to infer the mechanisms of electron acceleration (see [9], for a review). Multi-spacecraft measurements for a single SEP event can also reveal the information of NR electron injection and the propagation conditions of SEPs [10]. CMEs and flares are forms of energy release in the solar corona, during which particles are accelerated, plasma is heated, and waves and shocks are generated. The shock can be indicated by several signals [11,12], such as chromospheric Moreton waves, extreme-ultraviolet waves, and type II radio bursts. Type II bursts are the longest known signatures of shocks in the solar corona [13], which can be used as the method for tracking the shock propagation (e.g., [14,15]).
It is generally suggested that the NR electron acceleration occurs mainly at the Sun or in the corona, (e.g., [16]). Some researchers proposed that NR electrons can be accelerated mainly in flares, rather than in the shock (e.g., [17]). However, other authors presented evidence that CMEs or CME-driven shocks near the Sun are the main acceleration mechanisms of NR electrons (e.g., [18,19,20]). Moreover, there are some views that NR electrons are accelerated by both flares and shock waves (e.g., [21]). With respect to the propagation of NR electrons for the modelling work, Dröge et al. [22] assumed that the NR electrons are accelerated in a relatively small flare-associated region even for gradual events, and these particles would escape from the source region before the formation of the major disturbances caused by the coronal shock.
Researchers have used SEP time-intensity profiles simultaneously observed by multi-spacecraft at different locations of IP space, to investigate the acceleration and transport of energetic particles in the heliosphere (e.g., [23,24,25,26,27]). Observations of many spacecraft in the ecliptic at different longitudes, e.g., Helios, STEREO, ACE, SOHO, and IMP-8, are usually used to study the source region of SEP events [28,29], the effect of perpendicular diffusion [27,30], and the physics underlying the longitudinal extent of SEP events [31,32]. Furthermore, some research has investigated the acceleration and propagation processes of SEPs by using spacecraft at different radial distances and latitudes, e.g., ACE, Ulysses, and MESSENGER [19,20,33,34,35,36]. Dalla et al. [37] used velocity dispersion analysis to study Ulysses and near-Earth spacecraft (Wind and SOHO) observations of SEP events to suggest that the SEPs observed by the Ulysses spacecraft at high latitudes was released relatively late, possibly related to the latitudinal difference between the flare and spacecraft footpoint. Furthermore, multiple spacecraft observations are important to investigate the IP environment, e.g., Malandraki et al. [38] studied the large-scale structure and topology of the interplanetary magnetic field (IMF) embedded within IP coronal mass ejections (ICMEs), and Weygand et al. [39,40] studied the solar wind magnetic turbulence. In addition, the multiple spacecraft observations are essential for the study of energetic particle transport, e.g., it is suggested that local structures of background magnetic field can influence the transport of energetic particles [41,42,43].
Furthermore, numerical simulations and their comparison with observations are another important way to promote understanding the particle transport and acceleration processes in the heliosphere [10,22,44,45,46,47,48,49,50,51,52,53,54,55,56,57]. Through numerical simulations, the reservoir phenomenon of SEP events can be reproduced in the ecliptic plane at nearly 1 AU by considering different mechanisms, e.g., perpendicular diffusion, adiabatic cooling, and the source effect (e.g., [45,48]). In addition, some research obtained the perpendicular and parallel diffusion coefficients with simulations and observations in different longitudes and radial distances (e.g., [22,51,54,58,59]). Furthermore, Wu and Qin [60] studied the effects of the magnetic cloud (MC) and sheath region on lower-energy SEPs during a ground-level enhancement (GLE) event using numerical simulations and their comparison with observations. Their results inferred that the enhanced turbulence level and varied magnetic field in sheath–MC can depress the proton intensity of SEP events.
In the past, the majority of numerical studies on SEPs and their correlation with observational data are based on spacecraft located at different longitudes and radial distances, e.g., [22,54,61]. Nevertheless, researchers have performed simulations and analyses for spacecraft observations positioned at varying latitudes. In 2001 Agueda et al. [10] ran simulations without perpendicular diffusion for three large events with NR electrons observed by ACE and Ulysses, in the comparable IP conditions. They suggested that the heliospheric current sheet (HCS) could affect the features of the electron injection profiles.
SEP propagation in the IP space can be divided into two types, the field-aligned (parallel direction) propagation and the cross-field (perpendicular direction) propagation. Energetic charged particles would be subject to parallel and perpendicular diffusion because of the magnetic turbulence in solar wind [62,63]. There are complicated results to indicate both large and small perpendicular diffusion from the analysis of observations (e.g., [51,64,65]), which are also demonstrated by test particle simulations [66,67] and theoretical investigations [63,68]. As is usually shown that SEP events are observed by multiple widely separated spacecraft, one can try to explain the phenomenon by several physical processes. On the one hand, it is suggested that SEPs may be injected over a wide range by some mechanisms, e.g., particle acceleration by CME-driven shocks [50,57,69,70,71,72], or widely separated solar eruptions as SEP sources [73,74,75,76]. On the other hand, it is assumed that SEPs may be spread over a wide range during the propagation by some mechanisms. The first mechanism is the complexity of the magnetic field configurations [41,77,78], which may be caused by random walk of the magnetic field [79]. The second mechanism is perpendicular diffusion in IP space [22,48,80] or in the corona [81].
In different SEP events, one can find various perpendicular diffusion coefficients, which significantly influence the transport of SEPs, especially when the observers are not connected to the particle source [48,49,82,83]. The radial evolution of the perpendicular and parallel diffusion coefficients in IMF are important to simulate SEP events. According to simulations with multiple spacecraft observations of SEP events, the ratio of perpendicular to parallel diffusion κ / κ is a constant typically taken to be in the range 0.005–0.1 [22,52,54,59], which basically agrees with the theoretical results (e.g., [63,84]) with parameters for turbulence from solar wind observations, e.g., a composite geometry magnetic field composed of a 20% slab component and an 80% two-dimensional component [85].
Generally, the particle source of SEP events can be divided into two categories, i.e., the CME-driven shocks and solar flares. On the one hand, some gradual SEP events are assumed to originate from the coronal or IP shocks. To model the energetic particles accelerated by an IP shock, the source can be treated as a moving one [45,50,86,87,88,89,90]. On the other hand, impulsive SEP events can be related to the X-ray or EUV flares [91,92,93,94,95], so to model such kinds of SEPs one may use flares as the source of particles (e.g., [96]).
In this work, we investigated the SEPs transport in IP space by analysing two SEP events involving electrons with energies >53 keV, which were simultaneously observed by ACE, a near-Earth spacecraft, and Ulysses, a high-latitude spacecraft. The effects of transport processes and injection sources on the intensities of SEPs were examined based on a comparison between our simulations and observations from multiple spacecraft. The structure of this paper is as follows. Section 2 presents the observation of SEP events and the associated solar flares, type II radio bursts and CMEs. Section 3 describes the SEP transport and source models. Section 4 shows the simulation results and their comparison with the multiple spacecraft observations. Section 5 investigates the best fit parameters of the SEP source and provides models. Finally, Section 6 provides the summary and discussion.

2. Observations

We select electron events with the following criteria: (1) The SEP events observed simultaneously by ACE and Ulysses should have the same active region as the source; (2) The associated flare information, such as onset time, max time, location and peak intensity, is available; (3) The SEP events are not significantly affected by shocks. In addition, due to the limitations of our model, not all events that meet the above criteria can be fitted. Applying all the above criteria we chose two SEP events on the 10 June 2000 (DOY 162) and 26 December 2001 (DOY 360). These events were observed by both ACE and Ulysses spacecraft with varying longitudes, latitudes, and radial distances. For each event, we studied the different particle intensities observed by the two spacecraft.
We used NR electron observational data from the Electron Proton and Alpha Monitor (EPAM) on board ACE [97] and the Heliosphere Instrument for Spectra Composition and Anisotropy at Low Energies (HISCALE) instrument on board Ulysses at high latitude [98]. The design of ACE/EPAM inherited that of the flight-space unit of the Ulysses/HISCALE instrument, so we can directly use them for comparison [36]. The deflected electron (DE) telescopes of ACE/EPAM and Ulysses/HISCALE are pure electron channels in the energy range of 38–315 keV, which is divided into four differential energy channels referred to as DE1: 38–53 keV, DE2: 53–103 keV, DE3: 103–175 keV, and DE4: 175–315 keV. In this paper, we use SEP data from DE2, DE3, and DE4 with the geometrical mean energies 74, 134, and 235 keV, respectively. The intensity profiles of low-energy particles are easily affected by IP local structures, but local structures are not included in our theoretical model. In order to compare the observed and simulated results, we ignore the low-energy channel of DE1 in the SEP events. We study the energetic electron intensities from ACE and Ulysses with 5-min and 1-hour average data, respectively. In order to reduce the influence of the radioisotope thermoelectric generator on Ulysses, following Lario [99], we subtract a constant value of eight electrons cm 2 s sr MeV 1 in DE4, to ensure that the two spacecraft have the same background intensities. Similarly, we subtract constant values of 78 and 28 electrons cm 2 s sr MeV 1 to the Ulysses intensities in DE2 and DE3, respectively. Furthermore, solar wind speed data can be obtained from ACE/SWEPAM [100] and Ulysses/SWOOPS [101].

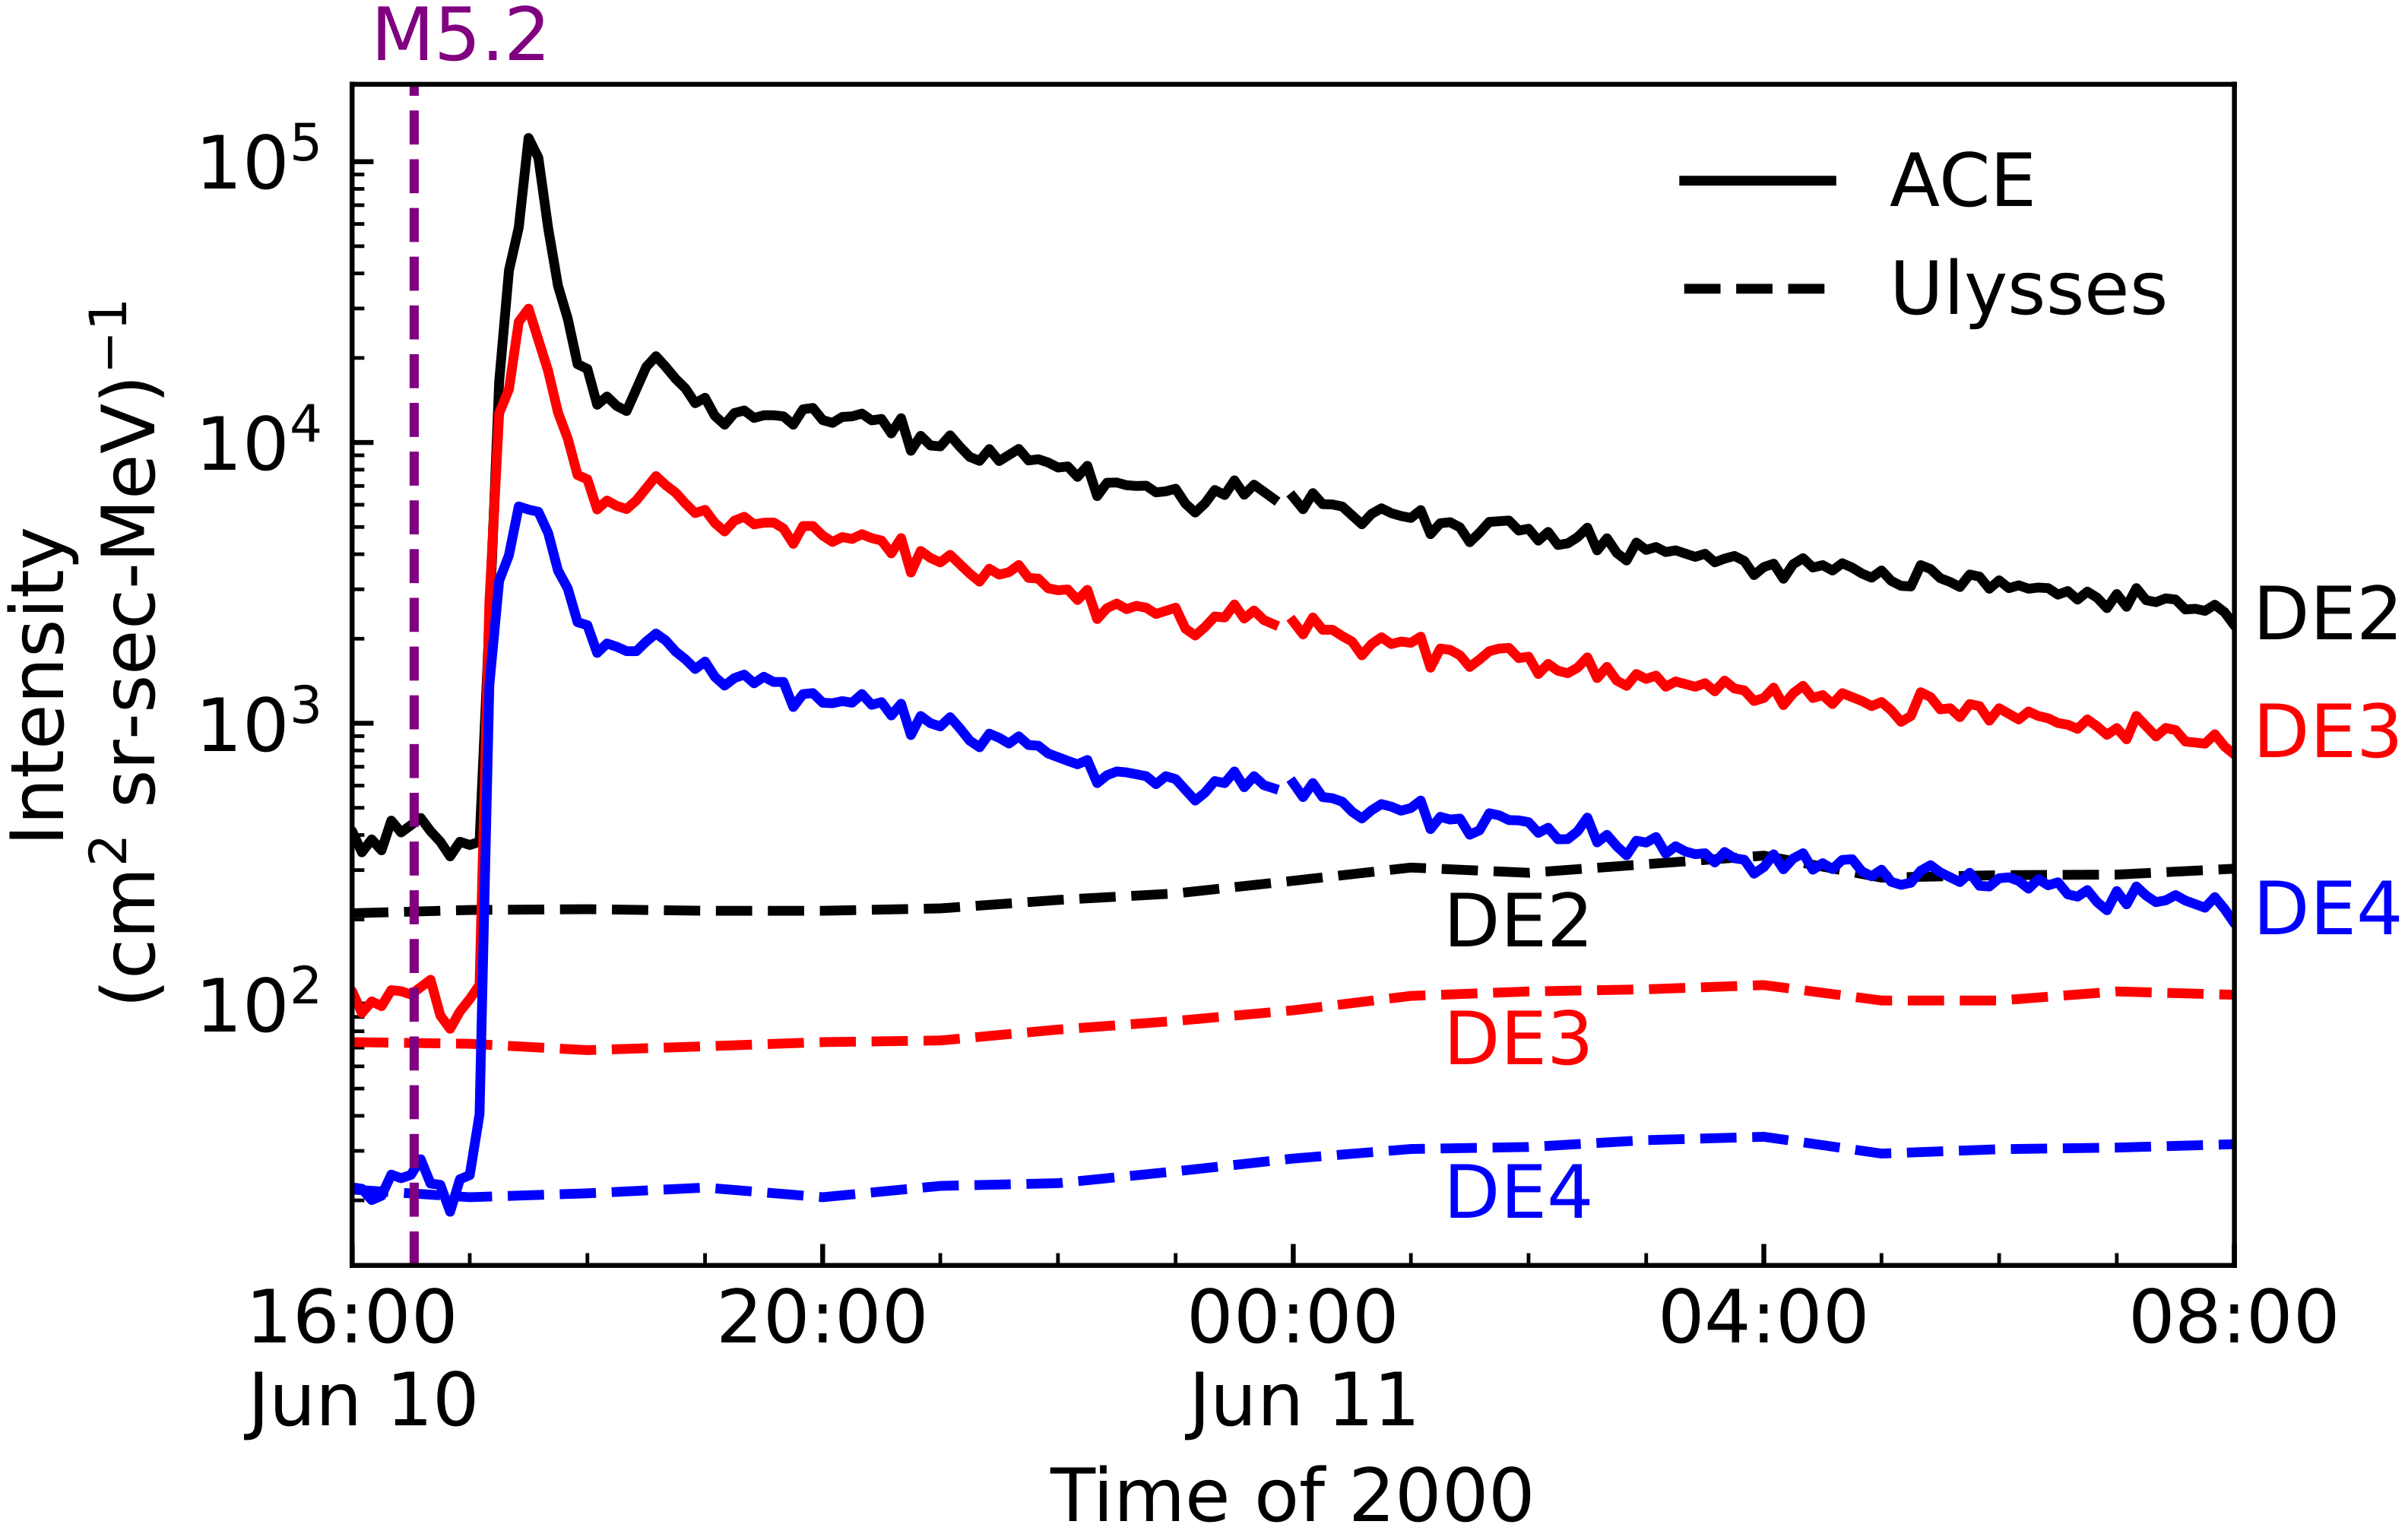
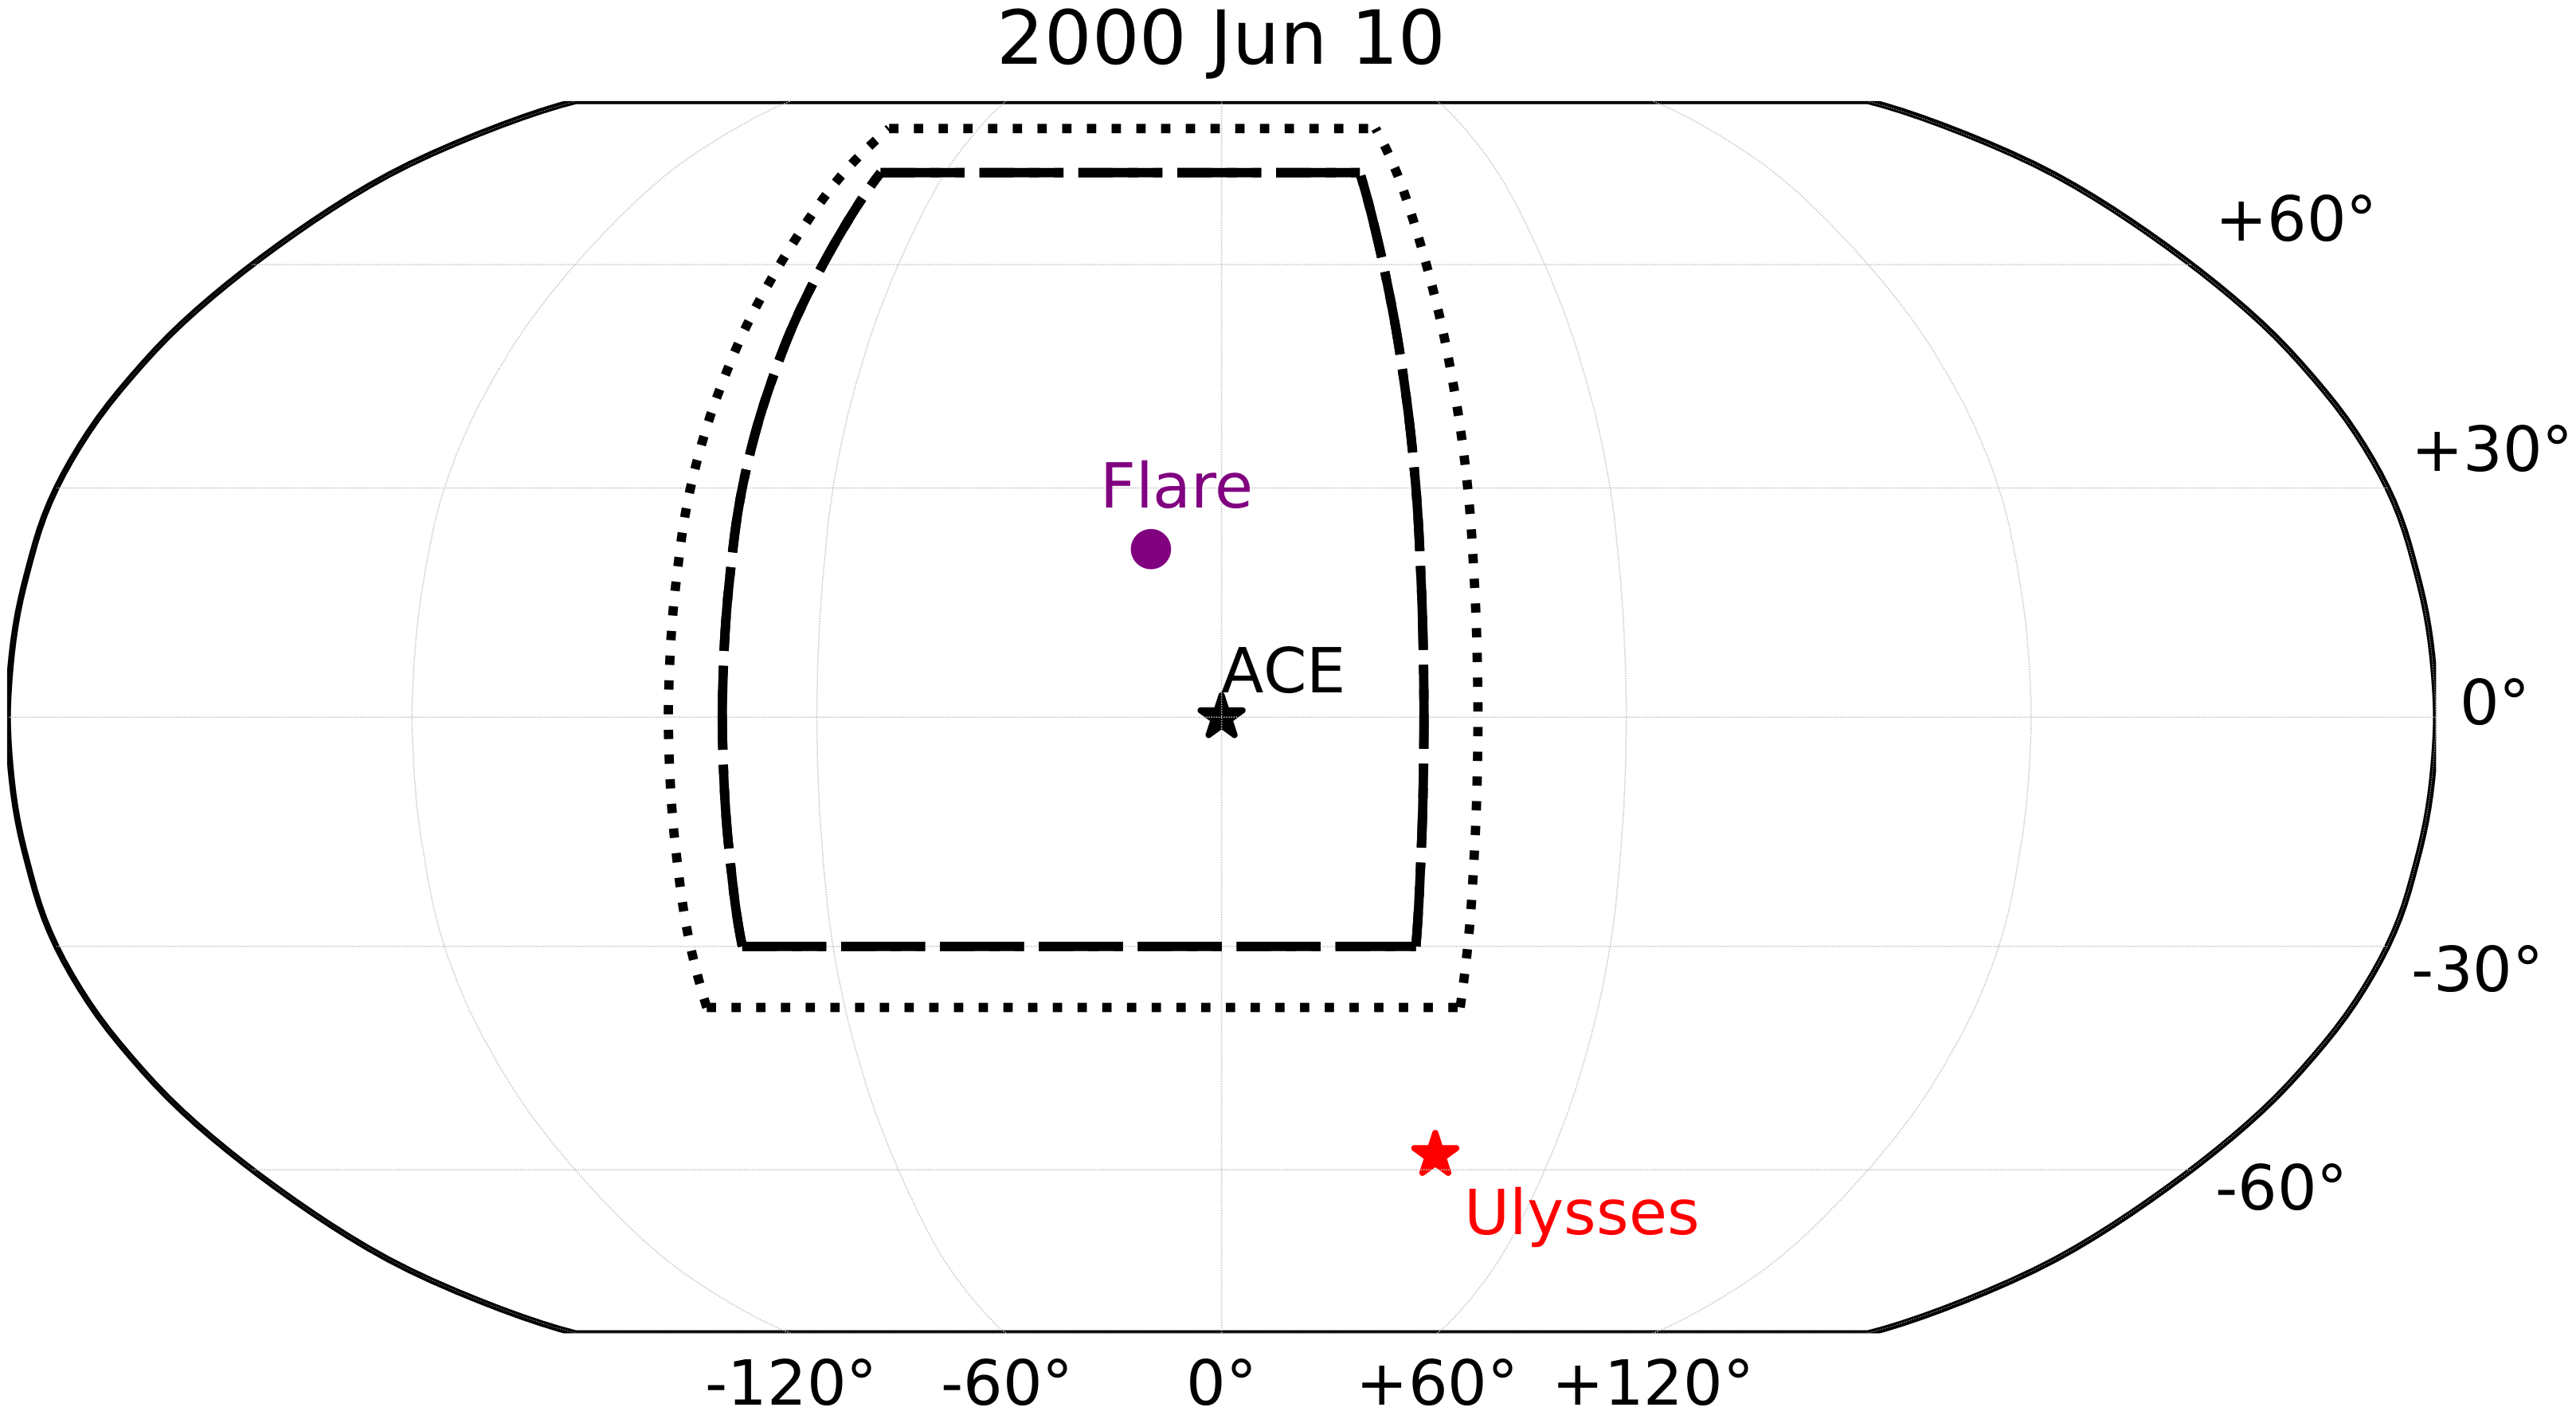
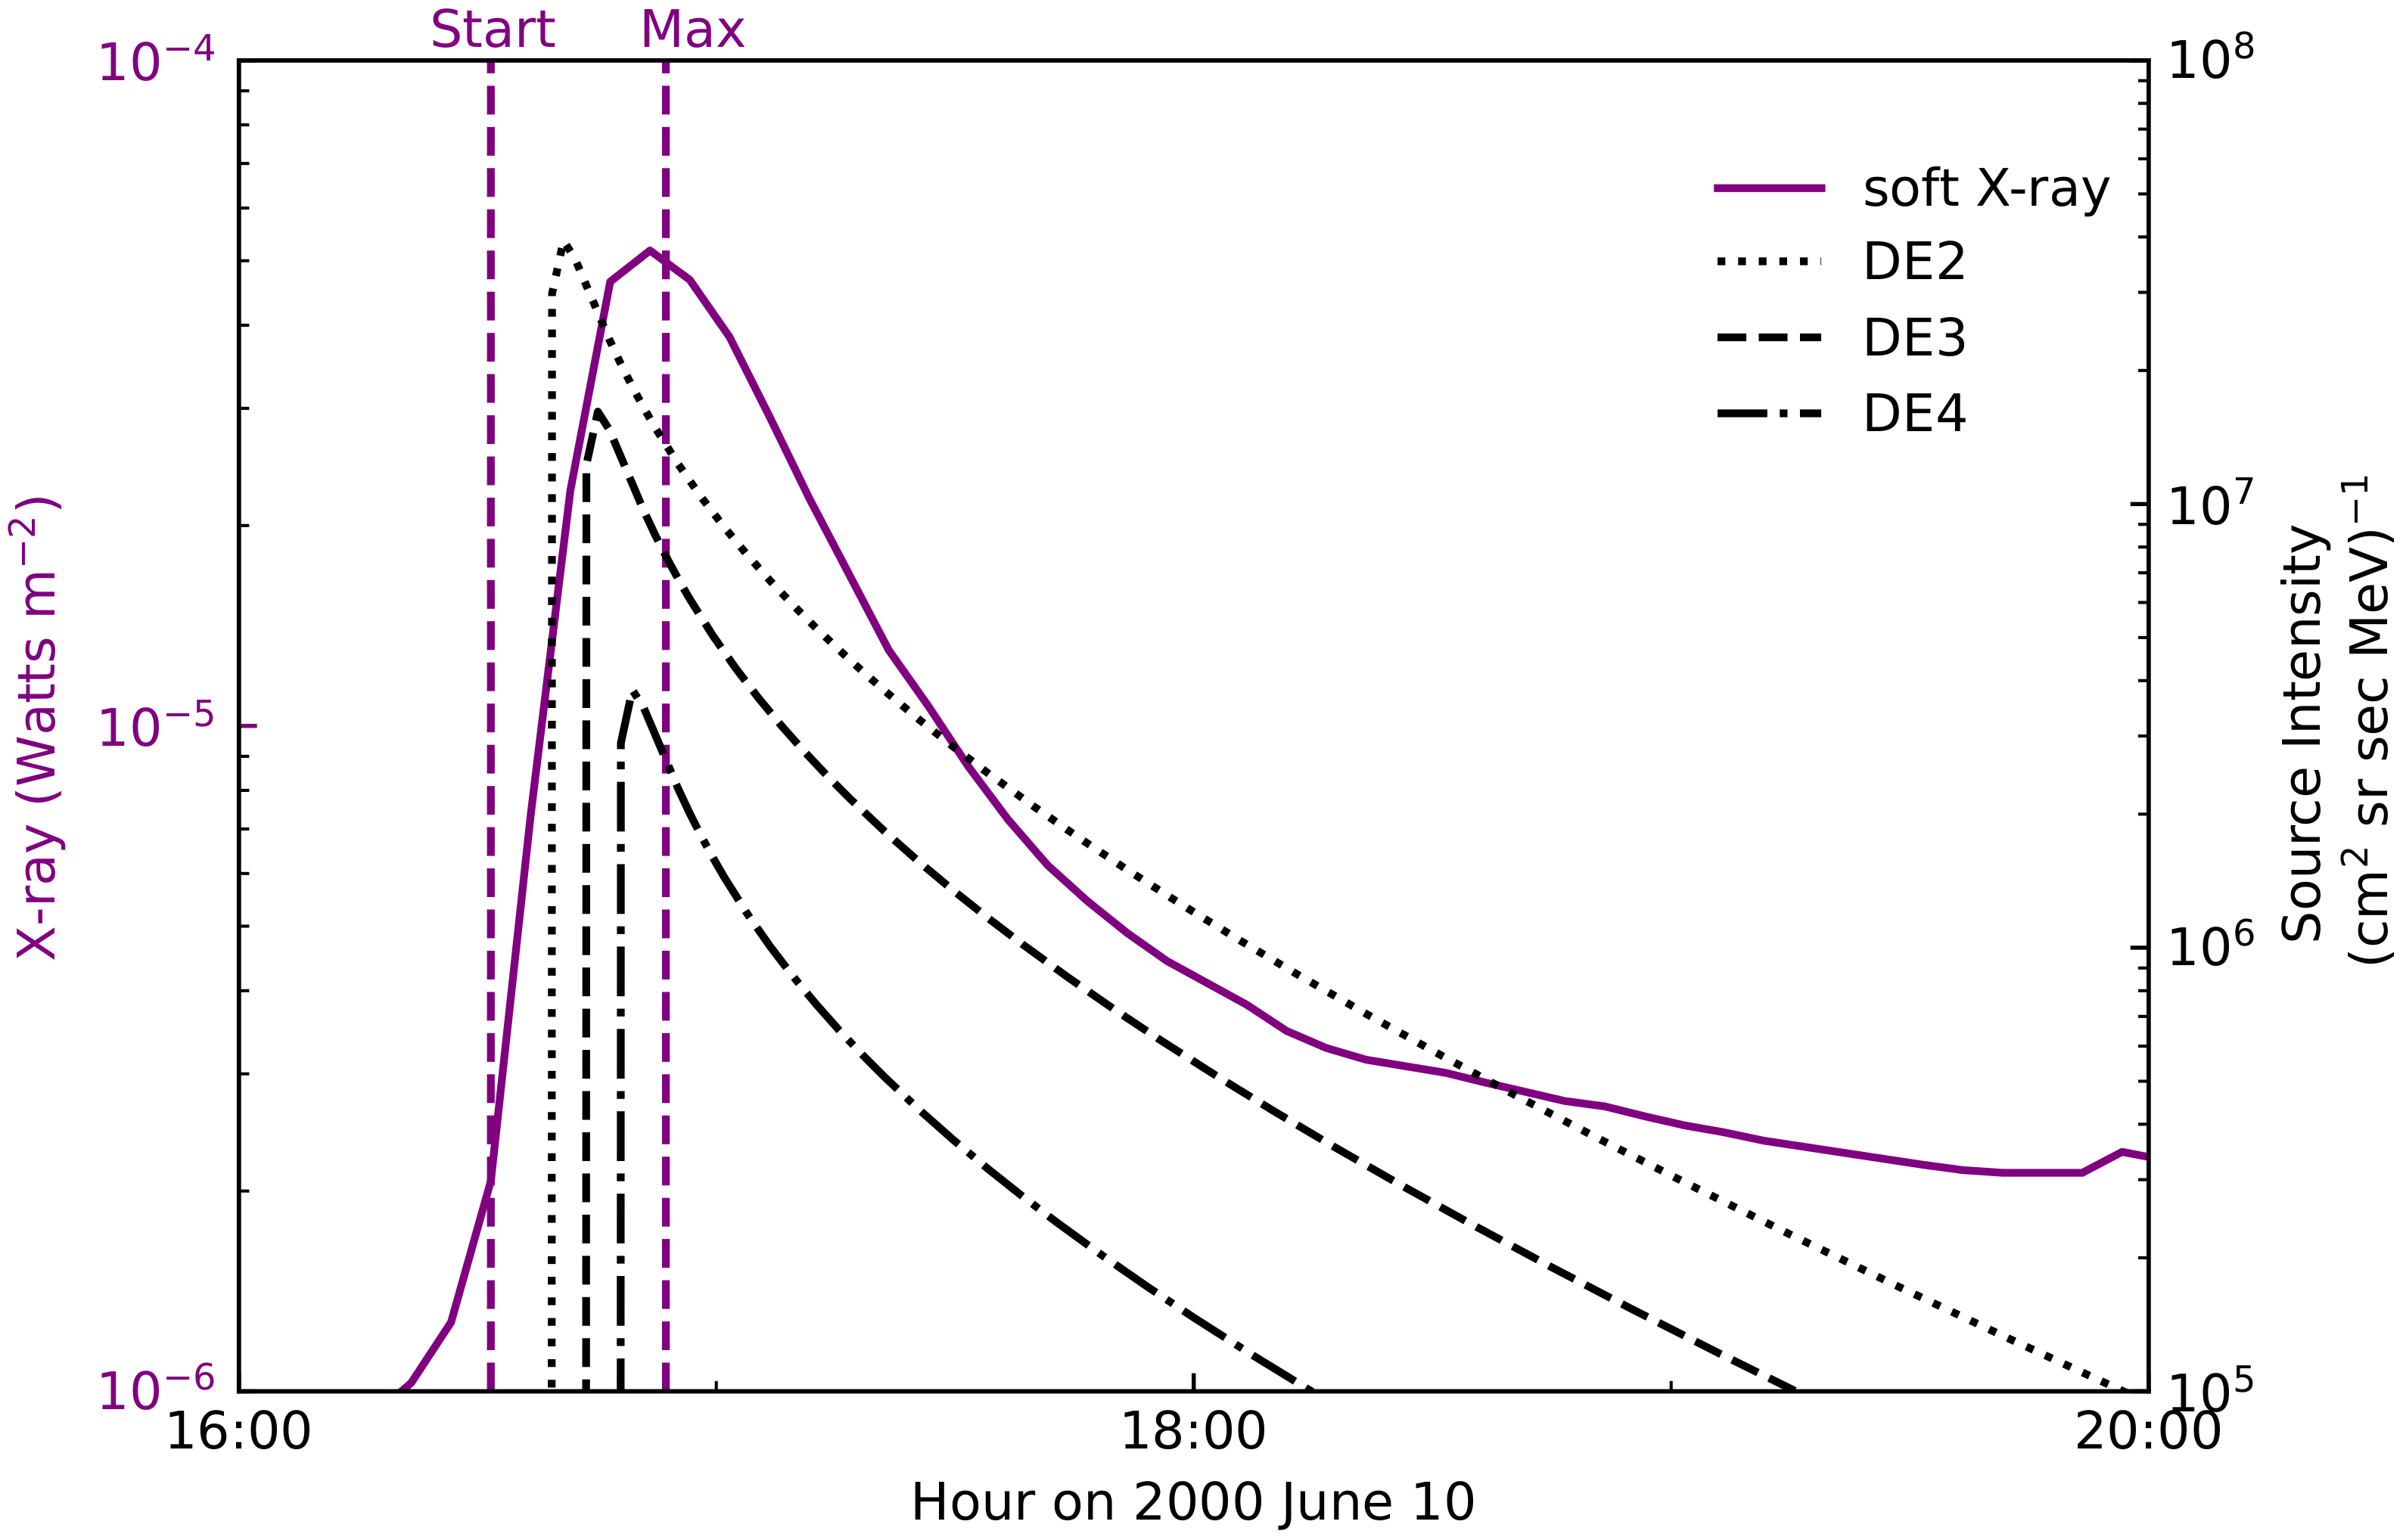
2.1. The Observation of the 10 June 2000 SEP Event

The solar origin of the 10 June 2000 SEP event has been associated with an intense M5.2 flare, in the NOAA active region (AR) 9026 at N22W38, with a start time and the peak time at 16:40 and 17:02 UT, respectively (https://www.ngdc.noaa.gov/stp/space-weather/solar-data/solar-features/solar-flares/x-rays/goes/xrs, accessed on 1 May 2022), and a 1108 km s 1 halo CME in the CDAW CME catalogue (http://cdaw.gsfc.nasa.gov/CME_list/, accessed on 20 February 2023). In addition, a type II radio burst was detected at Wind/WAVES from 17:15 to 18:45 UT (https://cdaw.gsfc.nasa.gov/CME_list/radio/waves_type2.html, accessed on 20 February 2023). For the event, the ACE spacecraft was in the ecliptic at 1 AU, and Ulysses was at location with R, the heliocentric distance, being 3.37 AU, and E87S58 relative to the Earth. The solar wind speeds observed by ACE and Ulysses were V A C E SW = 505 km s 1 and V U l y s s e s SW = 475 km s 1 , respectively. In Table 1, we summarize the site, class, peak intensity, onset and max time of flares, which were observed by GOES in the 0.1–0.8 nm wavelength band, and spacecraft information for the event.
Figure 1 represents the NR electron intensities measured by the ACE (solid) and Ulysses (dashed) spacecraft in the DE2 (black), DE3 (red), and DE4 (blue) energy channels. Additionally, the onset of the flare, adjusted to an ∼8 minute light travel time from the Sun to 1 AU, is marked with the vertical line. Figure 2 shows on the solar surface the magnetic footpoints of the ACE and Ulysses with black and red asterisks, respectively, as well as the flare location with a purple circle during the event, using the footpoint of the ACE as the coordinate origin. We assume the flare location as the centre of the particle source. The longitudes of the footpoints are calculated using the nominal Parker spiral magnetic field model with a solar wind speed measured by the respective spacecraft at the flare onset. We use the latitudes of the spacecraft to indicate that of the footpoints. In addition, we use positive and negative longitude values to indicate that the footpoint is west or east of the Sun–Earth line, respectively. As shown in Figure 2, the ACE footpoint and the source region were separated by 11 in longitude, in contrast, the Ulysses footpoint was separated from the source region by 50 in longitude and 80 in latitude.
From Figure 1 it is indicated that particle intensity enhancements were detected by both spacecraft in the DE2–DE4 energy channels, despite the Ulysses footpoint being distant from the particle source centre. ACE observed a rapid increase in the particle intensities in these energy channels immediately after the solar flare eruption, whereas Ulysses detected a slow increase. In addition, ACE reached the peak intensity earlier than Ulysses. The particle intensity of ACE and Ulysses decreased as the energy increased. Moreover, Table 2 shows that the intensity of these energy channels at ACE was about two orders of magnitude greater than that of Ulysses. At the same time, it is shown that the observational intensity of ACE decays faster than that of Ulysses during the decay phase.

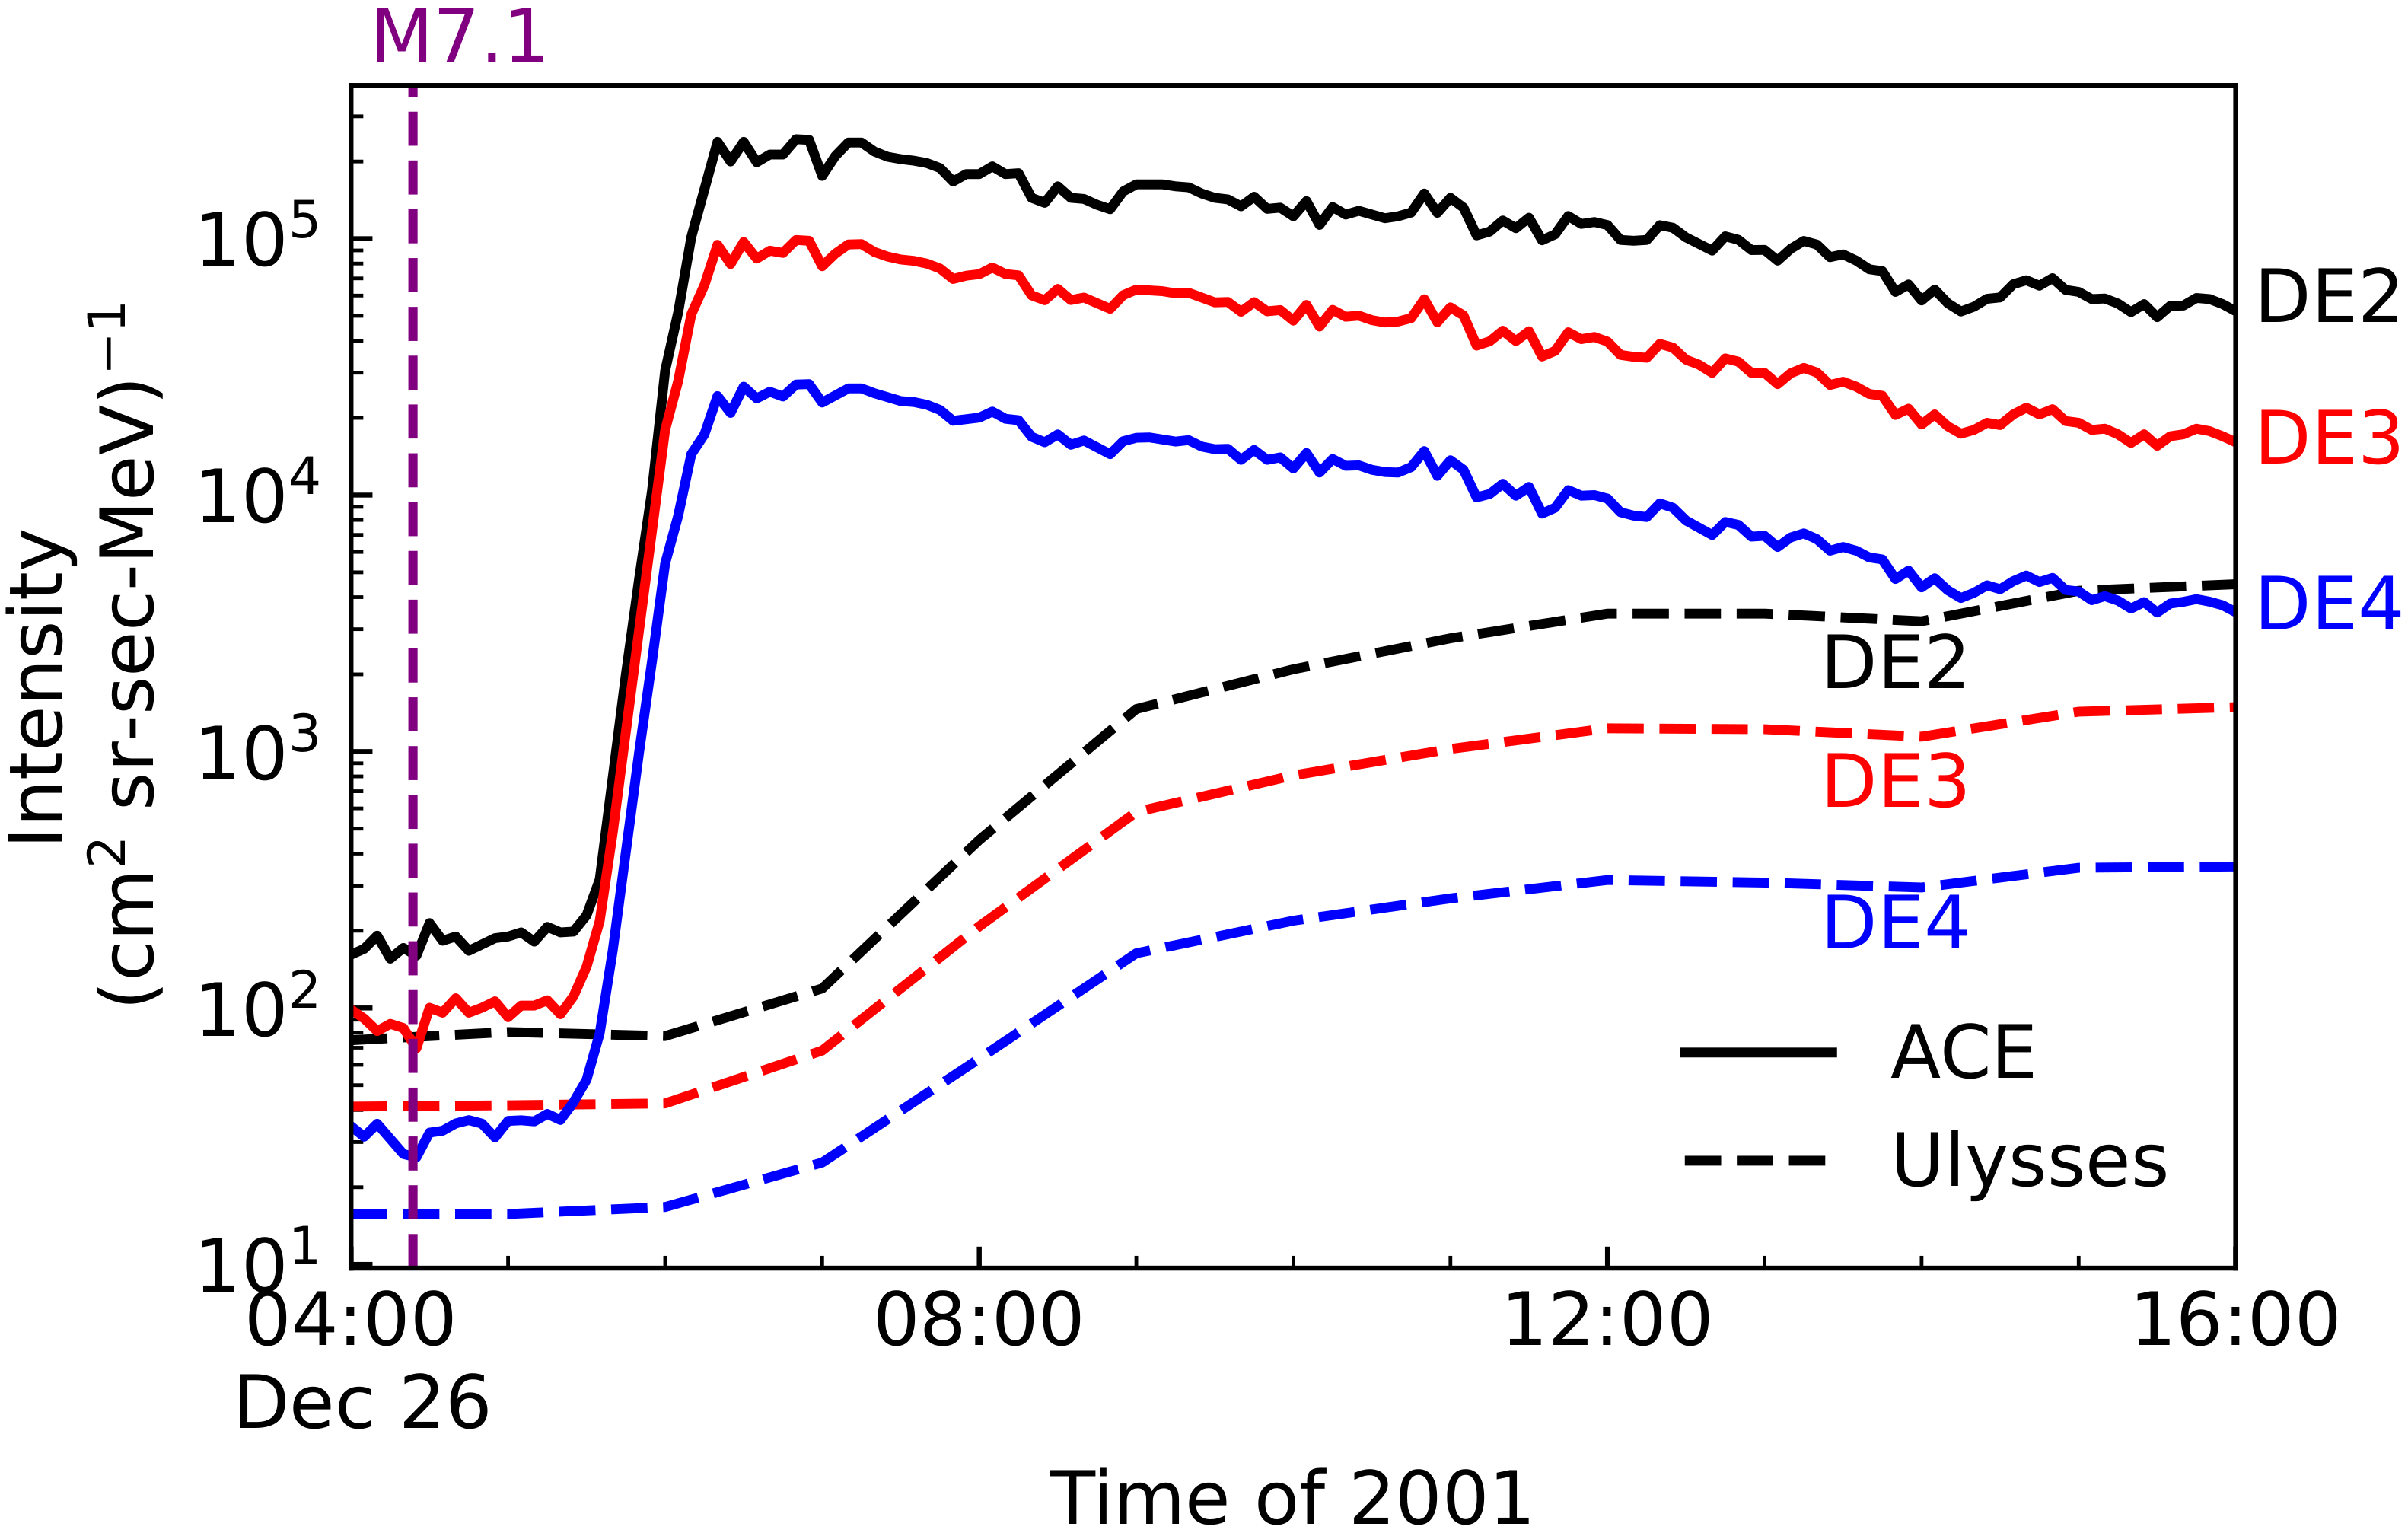
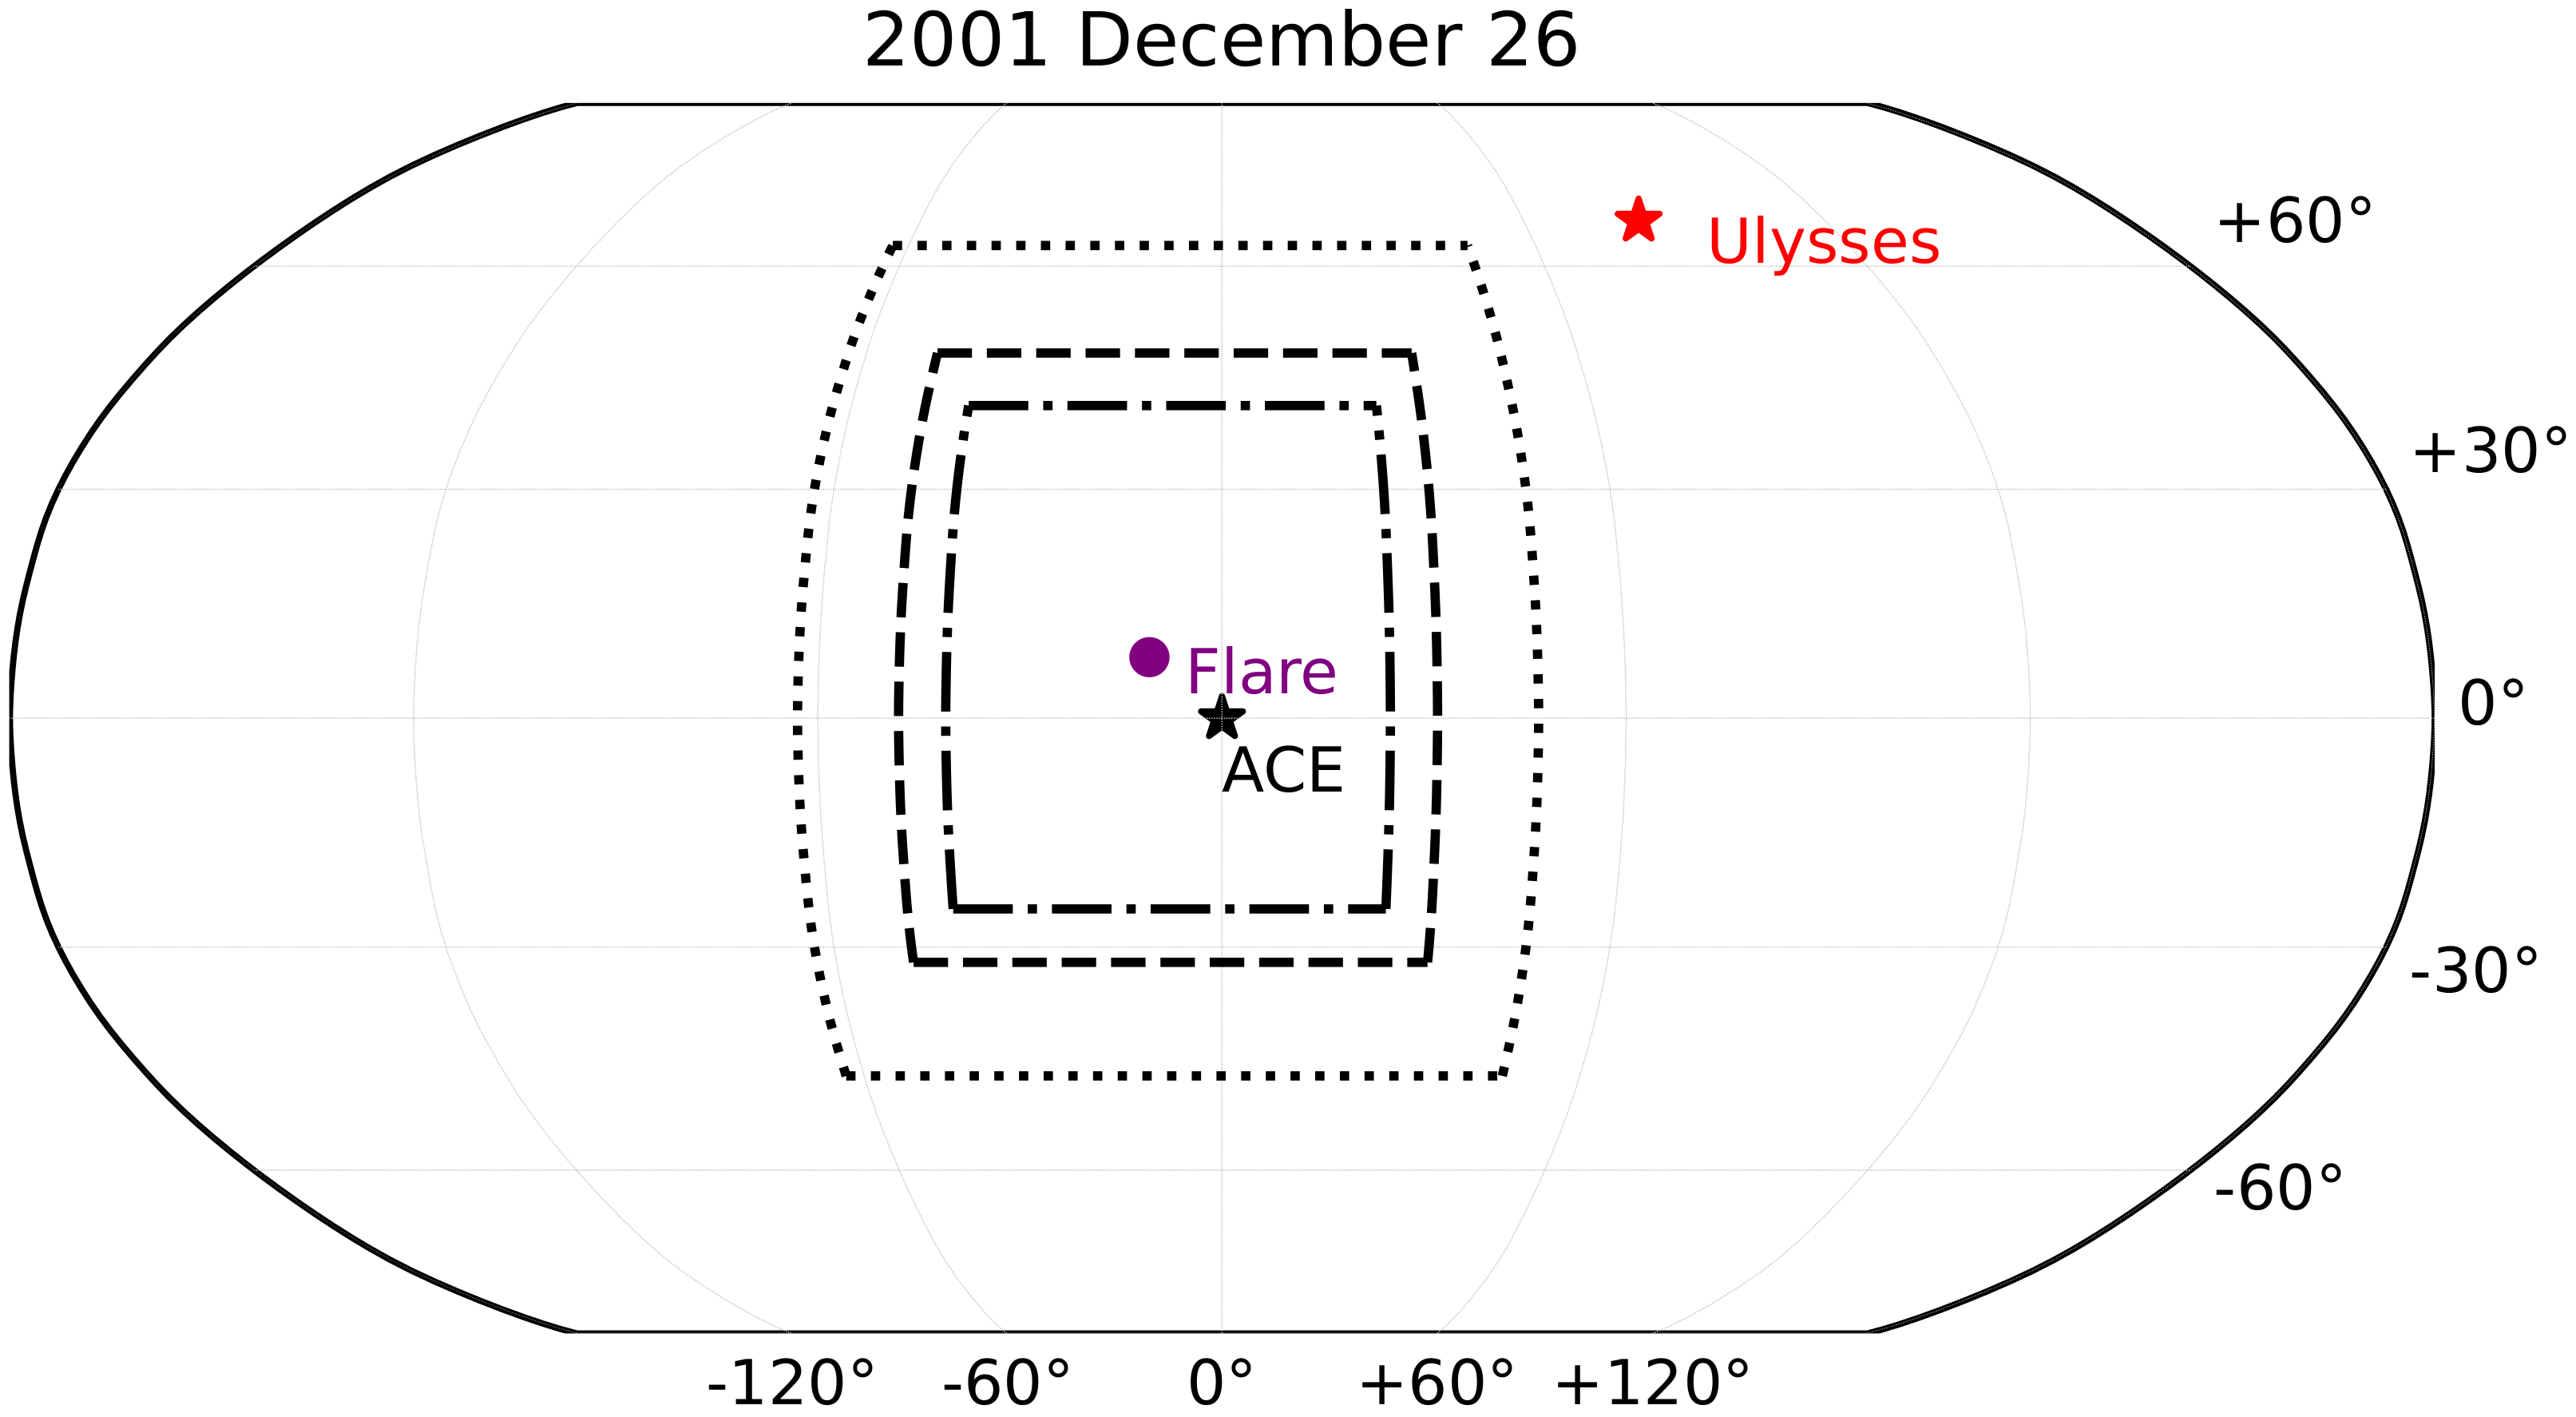
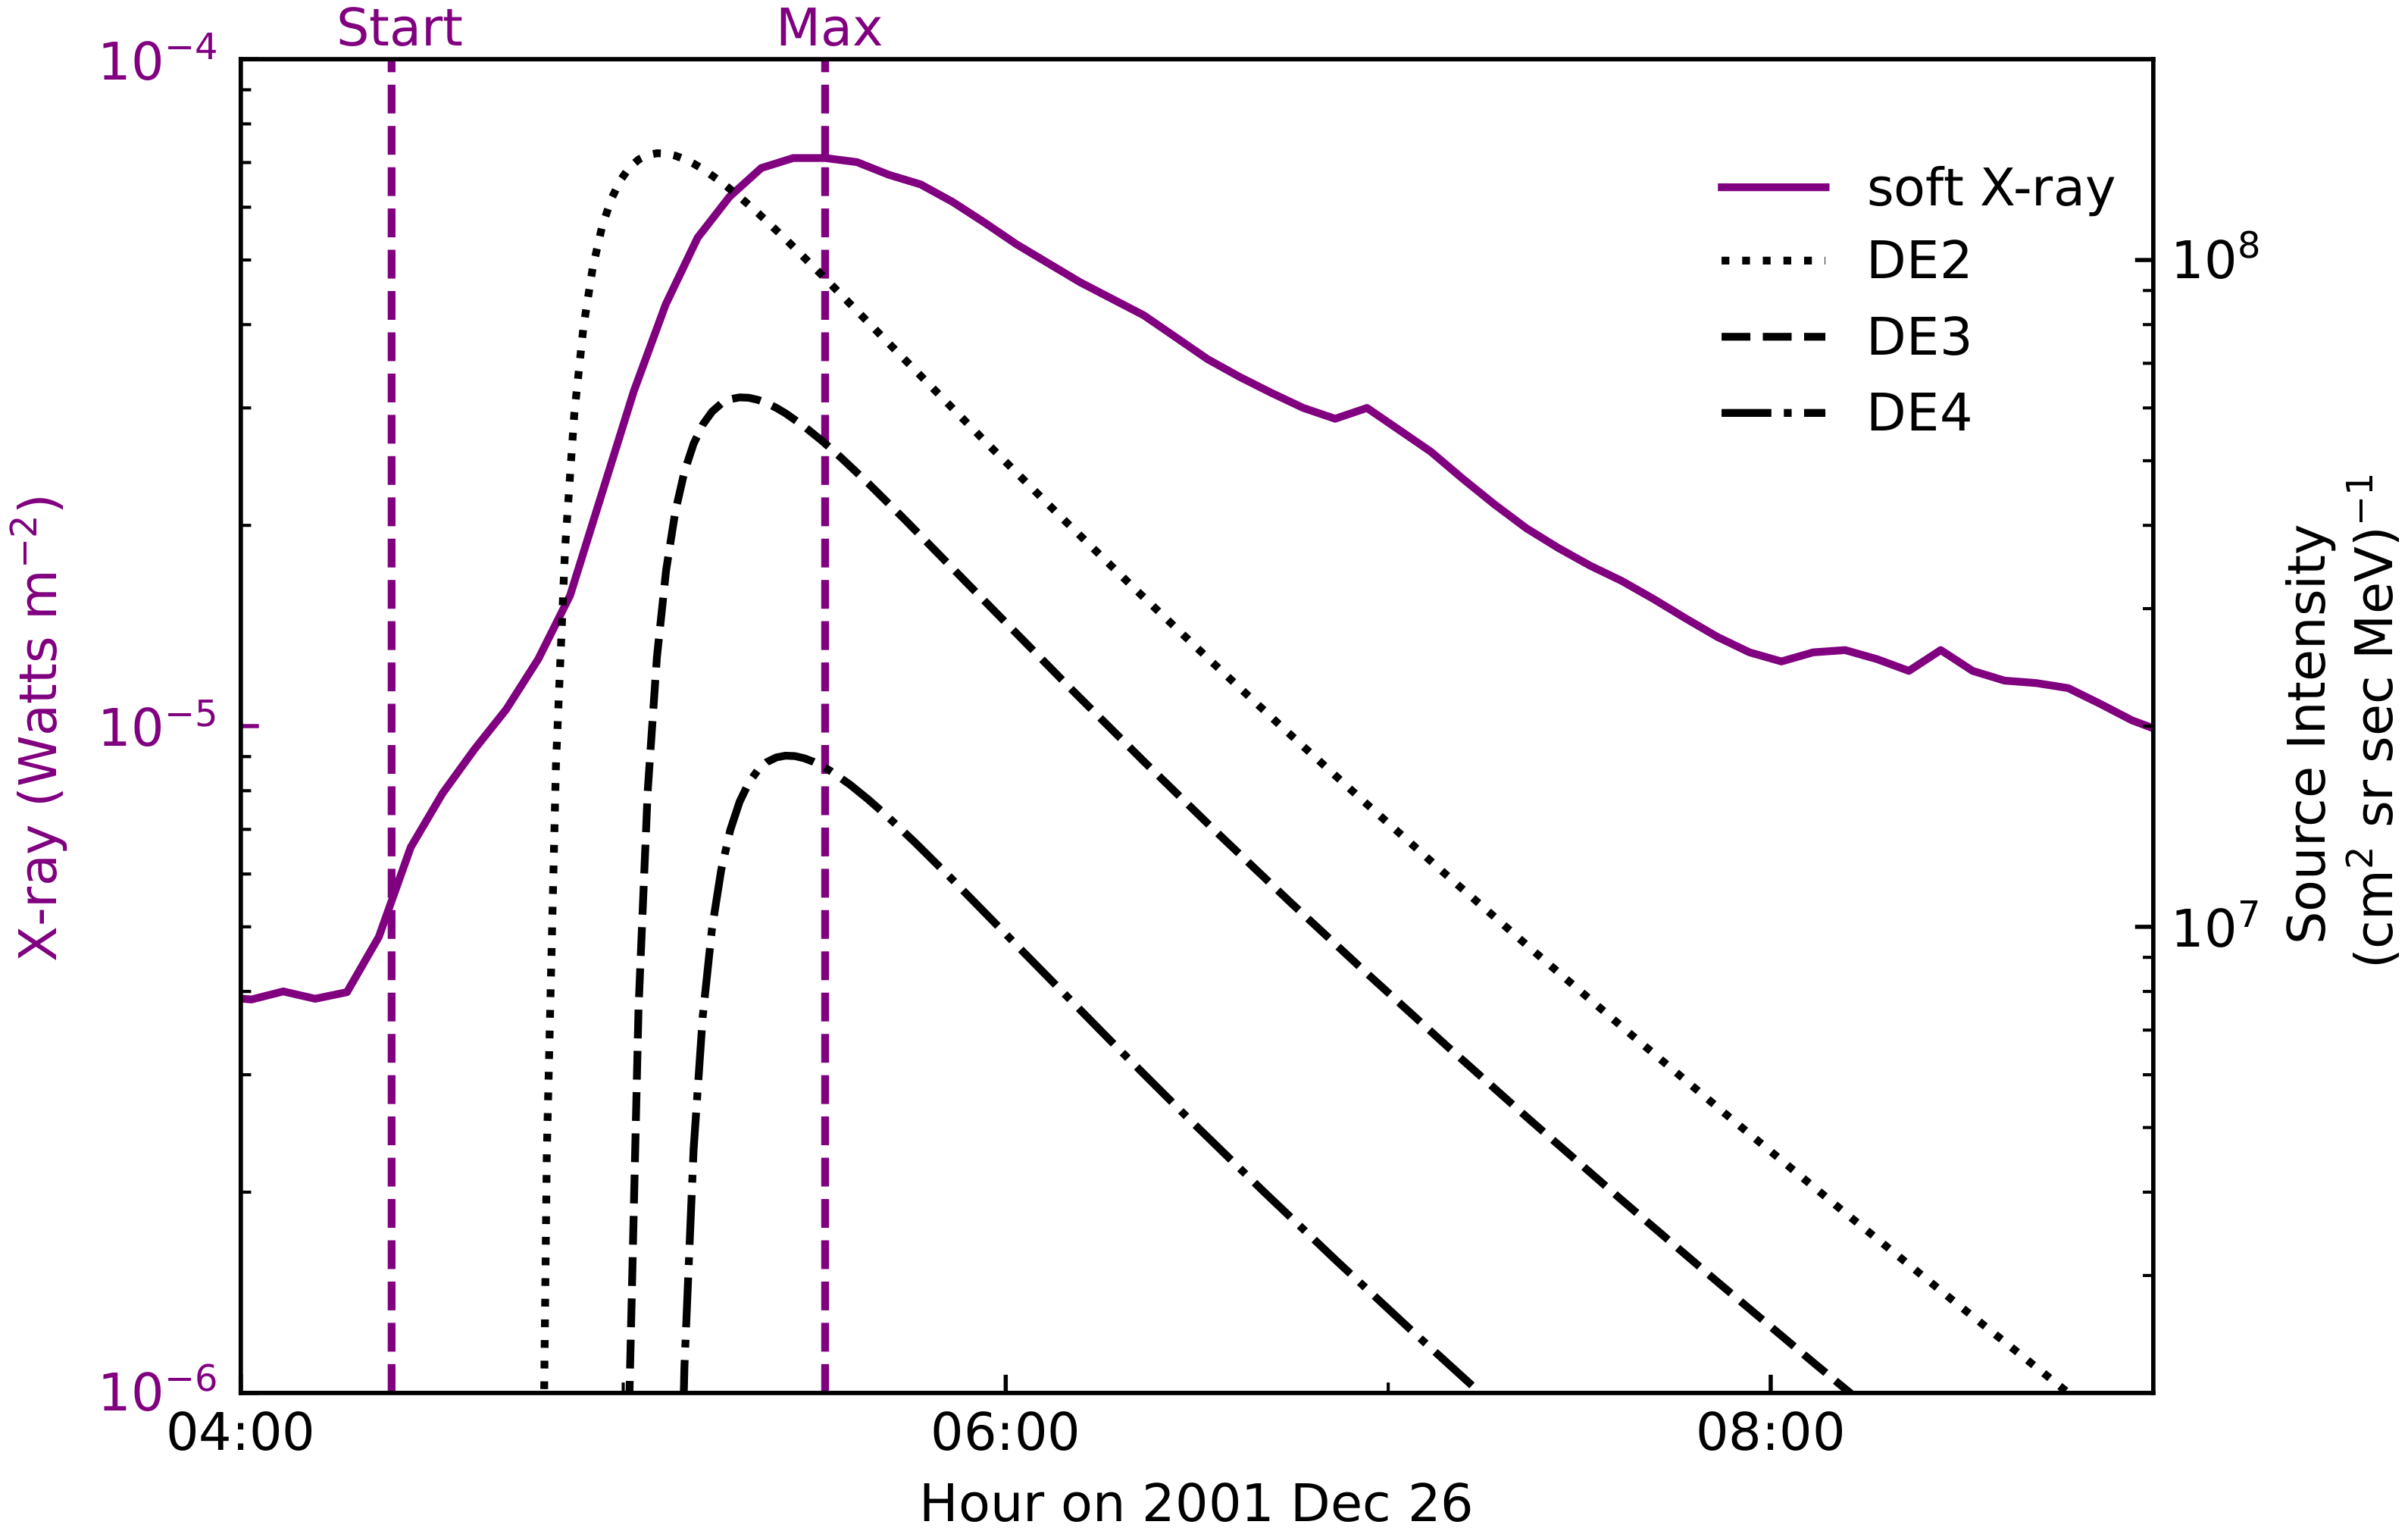
2.2. The Observation of the 26 December 2001 SEP Event

The 26 December 2001 SEP event was related to both an intense M7.1 X-ray flare and a high-speed CME. The flare was at N08W54 (AR9742) with an onset time of 04:32 UT and a peak time of 05:40 UT, and the CME was observed by LASCO with a plane-of-sky speed > 1446 km s 1 and an angular width > 212 . A type II radio burst was detected by Wind/WAVES at 05:20 UT. In addition, Ulysses was located at the position with the heliocentric distance R being 2.54 AU, latitude being N69, and longitude being 39 to the west with respect to the Earth. The solar wind speeds observed by ACE and Ulysses were V A C E SW = 380 km s 1 and V U l y s s e s SW = 575 km s 1 , respectively. Similar to the 10 June 2000 event, for the 26 December 2001 event, we also summarize the SXR flare properties and spacecraft information in Table 1.
Figure 3 shows, using the same format as Figure 1, the time series of SEP fluxes in DE2–DE4 energy channels for the 26 December 2001 event. We show the magnetic footpoints for ACE and Ulysses as well as the flare location on the solar surface in Figure 4. From this figure we can see that ACE was magnetically connected very close to the source region. In contrast, the footpoint of the nominal Parker spiral IMF line connecting Ulysses with the Sun was 94 west of the source site.
Despite being separated by a large longitude distance of 94 between Ulysses and the flare, both spacecraft detected a significant increase in particle intensity during this event. Figure 3 shows that the electron intensity of ACE (solid lines) begins to increase shortly after the solar flare. However, it took about an hour for the NR electrons of Ulysses (dashed lines) to start increasing, and the increase was gradual in comparison to ACE’s observations. Compared to ACE, the peak intensity of Ulysses was much smaller and observed several hours later. The particle intensity of ACE and Ulysses also decreased as the energy increased. Meanwhile, the ACE peak intensities were about an order of magnitude greater than that of the Ulysses in the DE2–DE4 energy channels, as shown in Table 2.

2.3. Summary of the SEP Events

Multiple spacecraft measurements show that SEPs are often observed over wide ranges of longitude, latitude, and radial distance. For the two selected events, we find some similar features as follows. Both ACE and Ulysses were able to observe the event even though the two spacecraft located in positions with large differences in latitude, longitude, and radial distance. Furthermore, the SEP fluxes observed by ACE were larger than by Ulysses by several orders of magnitude, and the start and peak times of flux observed by ACE were earlier than by Ulysses. As can be seen, the electron intensity observed by ACE shows a fast rise in comparison to the intensity by Ulysses which exhibits a gradual rise. This phenomenon can be attributed to the fact that the source site is nearer to the footpoint of ACE, while it is further away from the footpoint of Ulysses. One may suggest that the difference of electron time-intensity profile between ACE and Ulysses was probably due to the different magnetic connection of the individual spacecraft to the particle source on the Sun. When the observer is directly connected to the particle source, the SEP fluxes are larger and the start time and peak flux are earlier, compared to when the observer is far away from the source. In addition, this phenomenon suggests that the particles arriving at Ulysses underwent some transport effects, e.g., perpendicular diffusion, and source effects.
However, compared with the 26 December 2001 event, during the 10 June 2000 event, for Ulysses, the location of the footpoint is closer to the particle source centre, but the radial distance is larger. In addition, both the selected SEP events are associated with intense SXR flares, type II radio bursts and CMEs, but the flare of the 10 June 2000 event is weaker than the 26 December 2001 event.

3. Models

Our model is based on solving a three-dimensional focused transport equation following the previous research (e.g., [48,50,58,102,103]). The focused transport equation of SEPs can be written as [44,48,104,105]
f t = · κ · f + μ D μ μ f μ v μ b + V SW · f + p 1 μ 2 2 · V SW b b : V SW + μ 2 b b : V SW f p 1 μ 2 2 v L + μ · V SW 3 b b : V SW f μ ,
where f ( x , μ , p , t ) is a gyrophase-averaged distribution function, x is the position in a non-rotating heliographic coordinate system, μ , v and p are the particles’ pitch angle cosine, speed, and momentum, respectively, in the solar wind frame, t is the time, κ is the perpendicular diffusion coefficient, D μ μ is pitch angle diffusion coefficient, b is a unit vector along the local magnetic field, V SW is the solar wind velocity in the radial direction, and L = b · ln B 0 1 is the magnetic focusing length, with B 0 being the magnitude of the background IMF set as the Parker field. In this equation, almost all important particle transport mechanisms are involved, such as particles streaming along the field line, convection, adiabatic cooling in the expanding solar wind, magnetic focusing in the diverging IMF, and the pitch angle diffusion and perpendicular diffusion.
We adopt the model of pitch angle diffusion coefficient from Beek and Wibberenz [106] (see also, [102])
D μ μ ( μ ) = δ B slab B 0 2 π ( s 1 ) 4 s v l slab R L l slab s 2 | μ | s 1 + h 1 μ 2 ,
where δ B slab is the slab component of the magnetic turbulence, s = 5 / 3 is a typical Kolmogorov spectral index of the magnetic field turbulence in the inertial range, l slab = 0.031 AU is the correlation scale of slab turbulence, R L = p c / ( | q | B 0 ) is the maximum particle Larmor radius, B 0 is set as 5 nt at 1 AU in the ecliptic, and the constant h is chosen as a small value 0.01 for the non-linear effect of th emagnetic turbulence on pitch angle diffusion at μ = 0 [107,108]. It is noted that the effect of h on the pitch angle diffusion coefficient is small if h is small.
The parallel mean free path (MFP) λ under the diffusion approximation for nearly isotropic pitch-angle distribution can be written as [62,109,110]
λ = 3 v 8 1 + 1 ( 1 μ 2 ) 2 D μ μ d μ ,
and the parallel diffusion coefficient κ can be defined by
κ = v λ 3 .
Matthaeus et al. [63] developed the non-linear guiding centre (NLGC) theory of the perpendicular diffusion, the analytic approximation of which was later given by Shalchi et al. [111], Shalchi et al. [112] as
κ = 1 3 v δ B 2 D B 0 2 3 π s 1 2 s Γ s 2 + 1 Γ s 2 + 1 2 l 2 D 2 / 3 × λ 1 / 3 I b b ,
where δ B 2 D is the 2D component of magnetic turbulence and l 2 D is the correlation length, Γ is the gamma function, and I is a unit tensor. In addition, we set the correlation scale ratio of slab to 2D, l slab / l 2 D = 2.6 , so that l 2 D = 0.012 AU. The ratio of turbulence energy between the slab component and 2D component is set δ B slab 2 : δ B 2 D 2 = 1 : 4 . It is noted that l slab and l 2 D can be obtained from observations with theories (e.g., [39,40,85,113,114]). Here, we set them with simple forms for simplicity (e.g., [63]). In addition, the level of magnetic turbulence, defined as
δ B B 0 δ B slab 2 + δ B 2 D 2 B 0 ,
varies with radial and latitudinal position in IP space (e.g., [115,116]). However, since the observational data are limited, for simplicity we set a constant for the magnetic turbulence level in this work. Note that the diffusion coefficients in our model vary with solar radius and latitudes, although the turbulence level is set as constant. By changing the value of the magnetic turbulence, δ B / B 0 , one can vary the values of the parallel and perpendicular diffusion coefficients.
Using a Reid–Axford time profile [117], we assume that electrons are injected at z 0.05 AU according to a source function (e.g., [44])
Q ( z 0.05 au , E k , θ , φ , t ) = C t E k γ p 2 exp τ c t t τ L ξ ( θ , φ ) ,
where E k is the particle’s kinetic energy, γ is the spectral index of the source particles and is set to 3.0 , and τ c and τ L are the rise and decay timescales of the source injection profile, respectively. ξ ( θ , φ ) indicates the distribution of the SEP source strength
ξ ( θ , φ ) = a ( θ , φ ) θ θ 0 Δ θ and ϕ ϕ 0 Δ φ , 0 otherwise ,
where a ( θ , φ ) indicates that the SEP source strength is related to the longitude φ and co-latitude θ , Δ φ and Δ θ are half widths of the SEP source in longitude and co-latitude, respectively, and ( θ 0 , φ 0 ) is the flare location. In our work, we set a ( θ , φ ) = 1 , and Δ φ = Δ θ . In addition, the outer boundary is set to 50 AU. The inner boundary is set as 0.05 AU, or about 10 solar radii, which is relatively high for the SEP source. However, since the details of particle acceleration, release, and the subsequent transport near the Sun are very complicated, for simplification we set such a value of the inner boundary to avoid the difficulty (e.g., [56,102]).
Zhang [118] introduced the time-backwards Markov stochastic process method to solve the cosmic ray transport equation, adopted by Qin et al. [44] to solve SEP transport equations and compare with spacecraft observations. Here, we use the method to numerically solve the transport equation (Equation (1)). The initial boundary value problem of the SEP transport equation can be reformulated with a set of stochastic differential equations, so that it can be solved by a Monte Carlo simulation of a Markov stochastic process, and the SEP distribution function can be derived finally. In this method, only the SEPs that are traced back to the initial time in the source region contribute to the statistics. The details of this method can be found in Zhang [118] and Qin et al. [44].

4. The SEP Simulation Results and Comparison with Observations

In this paper, we simulate the SEP events that occurred on 10 June 2000 and 26 December 2001 simultaneously observed by the ACE and Ulysses spacecraft. The time-intensity profiles of the SEPs with different energies for positions of different spacecraft are obtained with numerical simulations. For numerical simulations, some input parameters, such as particle energy, flare position, satellite position, etc., are obtained from the observations, but some other input parameters, such as the magnetic turbulence level and particle source parameters, cannot be obtained from observations. We use different parameters of the magnetic turbulence levels and particle source parameters in the code to obtain different simulation results. We compare the simulation results with observations to obtain the best fitting parameters with simulation results that best agree with the observations. By comparing the numerical results and observations, we investigate the effects of the particle source and transport on the SEPs’ time profiles in IP space with different latitudes, longitudes, and heliocentric distances in SEP events.
We assume that the IMF is a Parker spiral field and the inner and outer boundaries are 0.05 AU and 50 AU, respectively. In the simulations to obtain the flux observed by ACE and Ulysses, we set the solar wind speed to the value observed by the respective spacecraft. The fitting parameters used in the simulations are as follows. δ B / B 0 is the turbulence level (cf., Equation (6)). τ c and τ L are the rise and decay timescales of the source injection profile, respectively. Δ θ indicates the half width of the particle source in the longitude and latitude. J max is the maximum value of the particle source intensity. Δ T 1 corresponds to the time interval from the onset time of the flare to the peak time of the particle source. We have used various combinations of the modelling parameters to obtain the simulation results for each SEP event, which are compared with ACE and Ulysses observations at different positions. Therefore, we obtain the best fit parameters listed in Table 3. With the best fit parameters δ B / B 0 using Equations (2) and (3) we can obtain the parallel MFP, λ , at 1 AU. In addition, with Equations (4) and (5) we can obtain the parallel and perpendicular diffusion coefficients, κ and κ , respectively, at 1 AU in the ecliptic. Therefore, the ratio, κ / κ , at 1 AU in the ecliptic is obtained. We list the values of λ and κ / κ at 1 AU in the ecliptic for different energy channels in the two SEP events for the best parameters δ B / B 0 in Table 4.

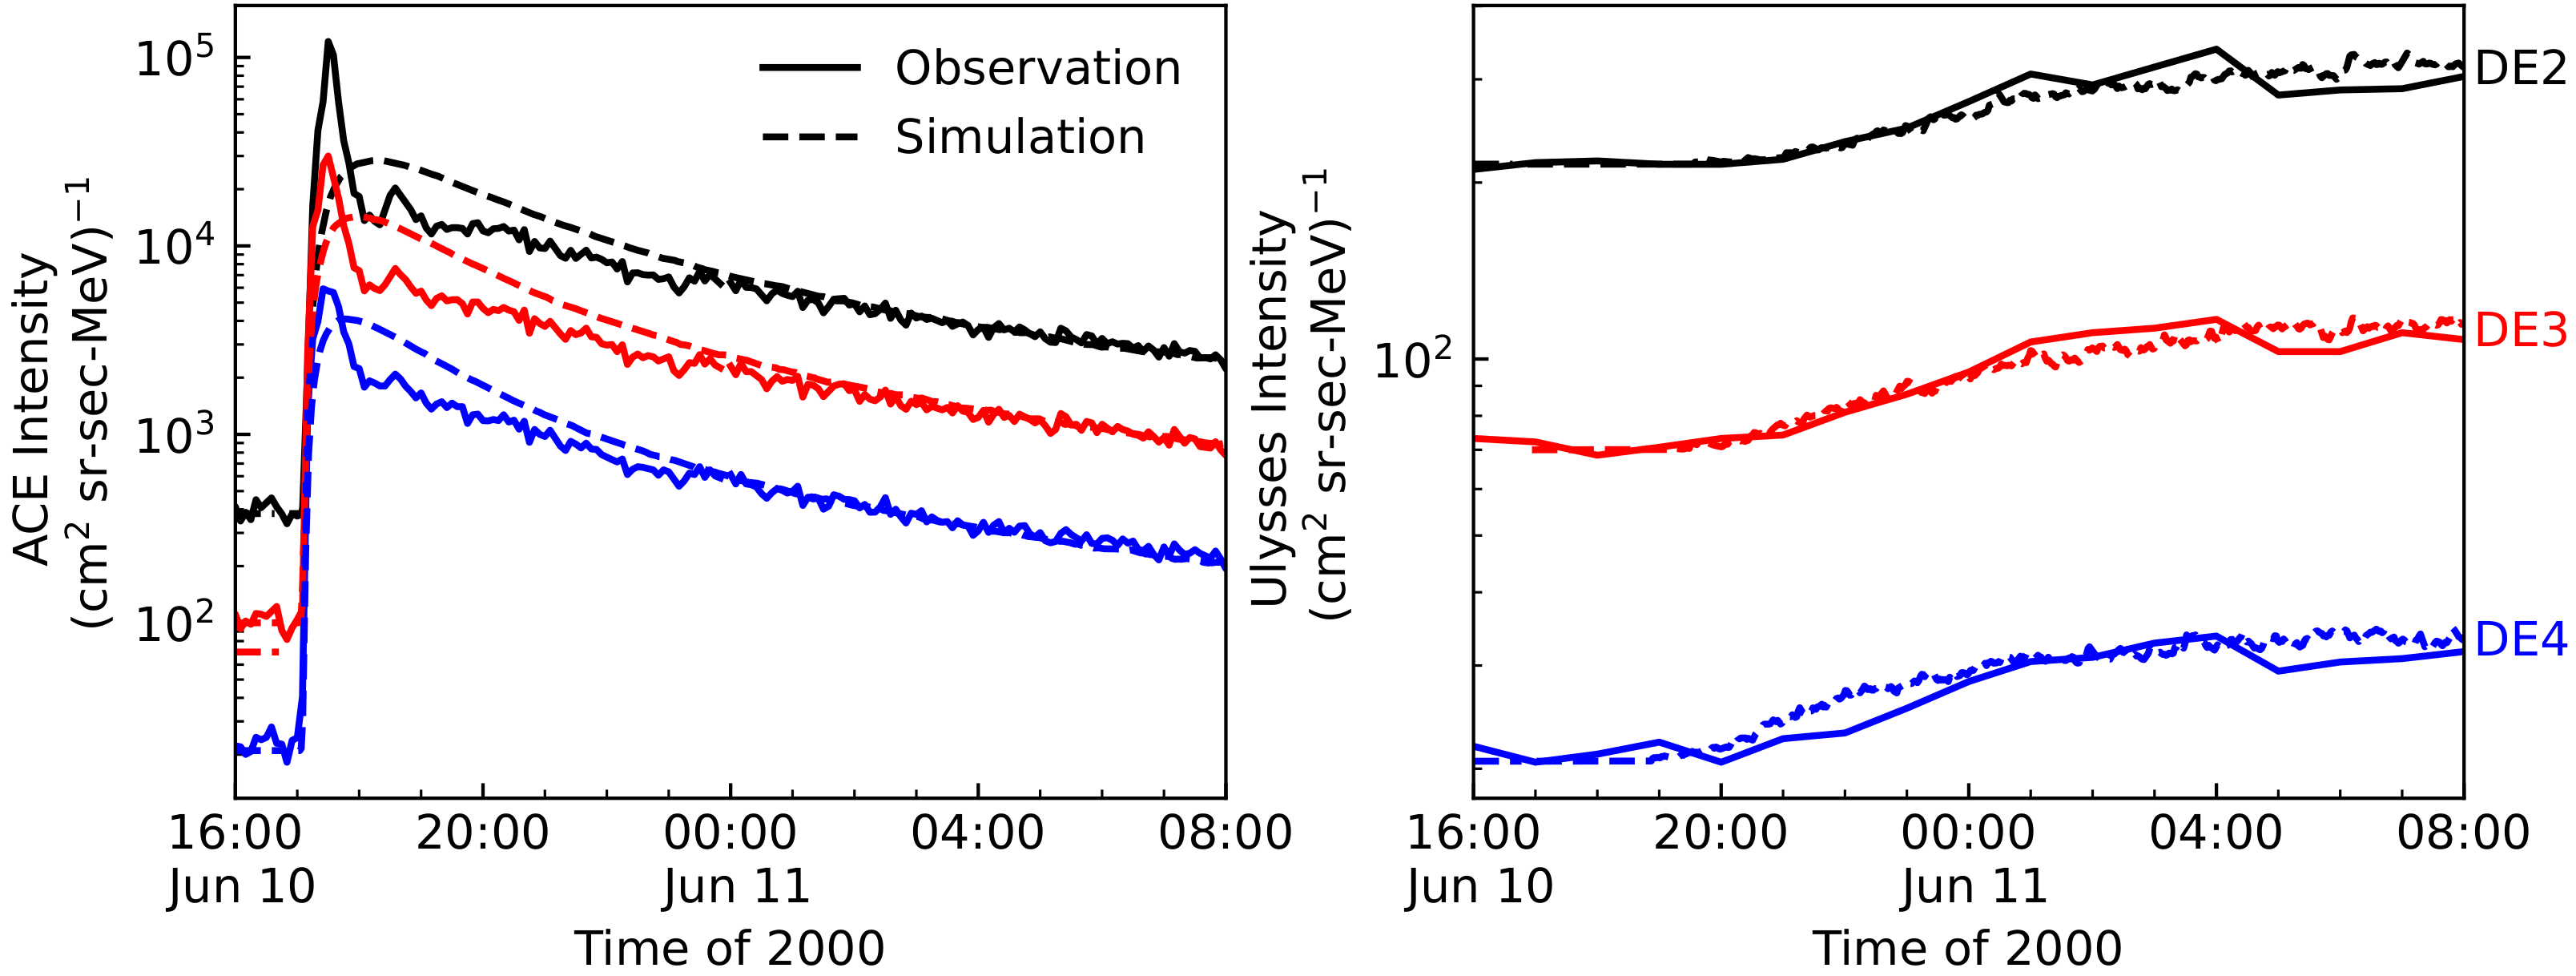
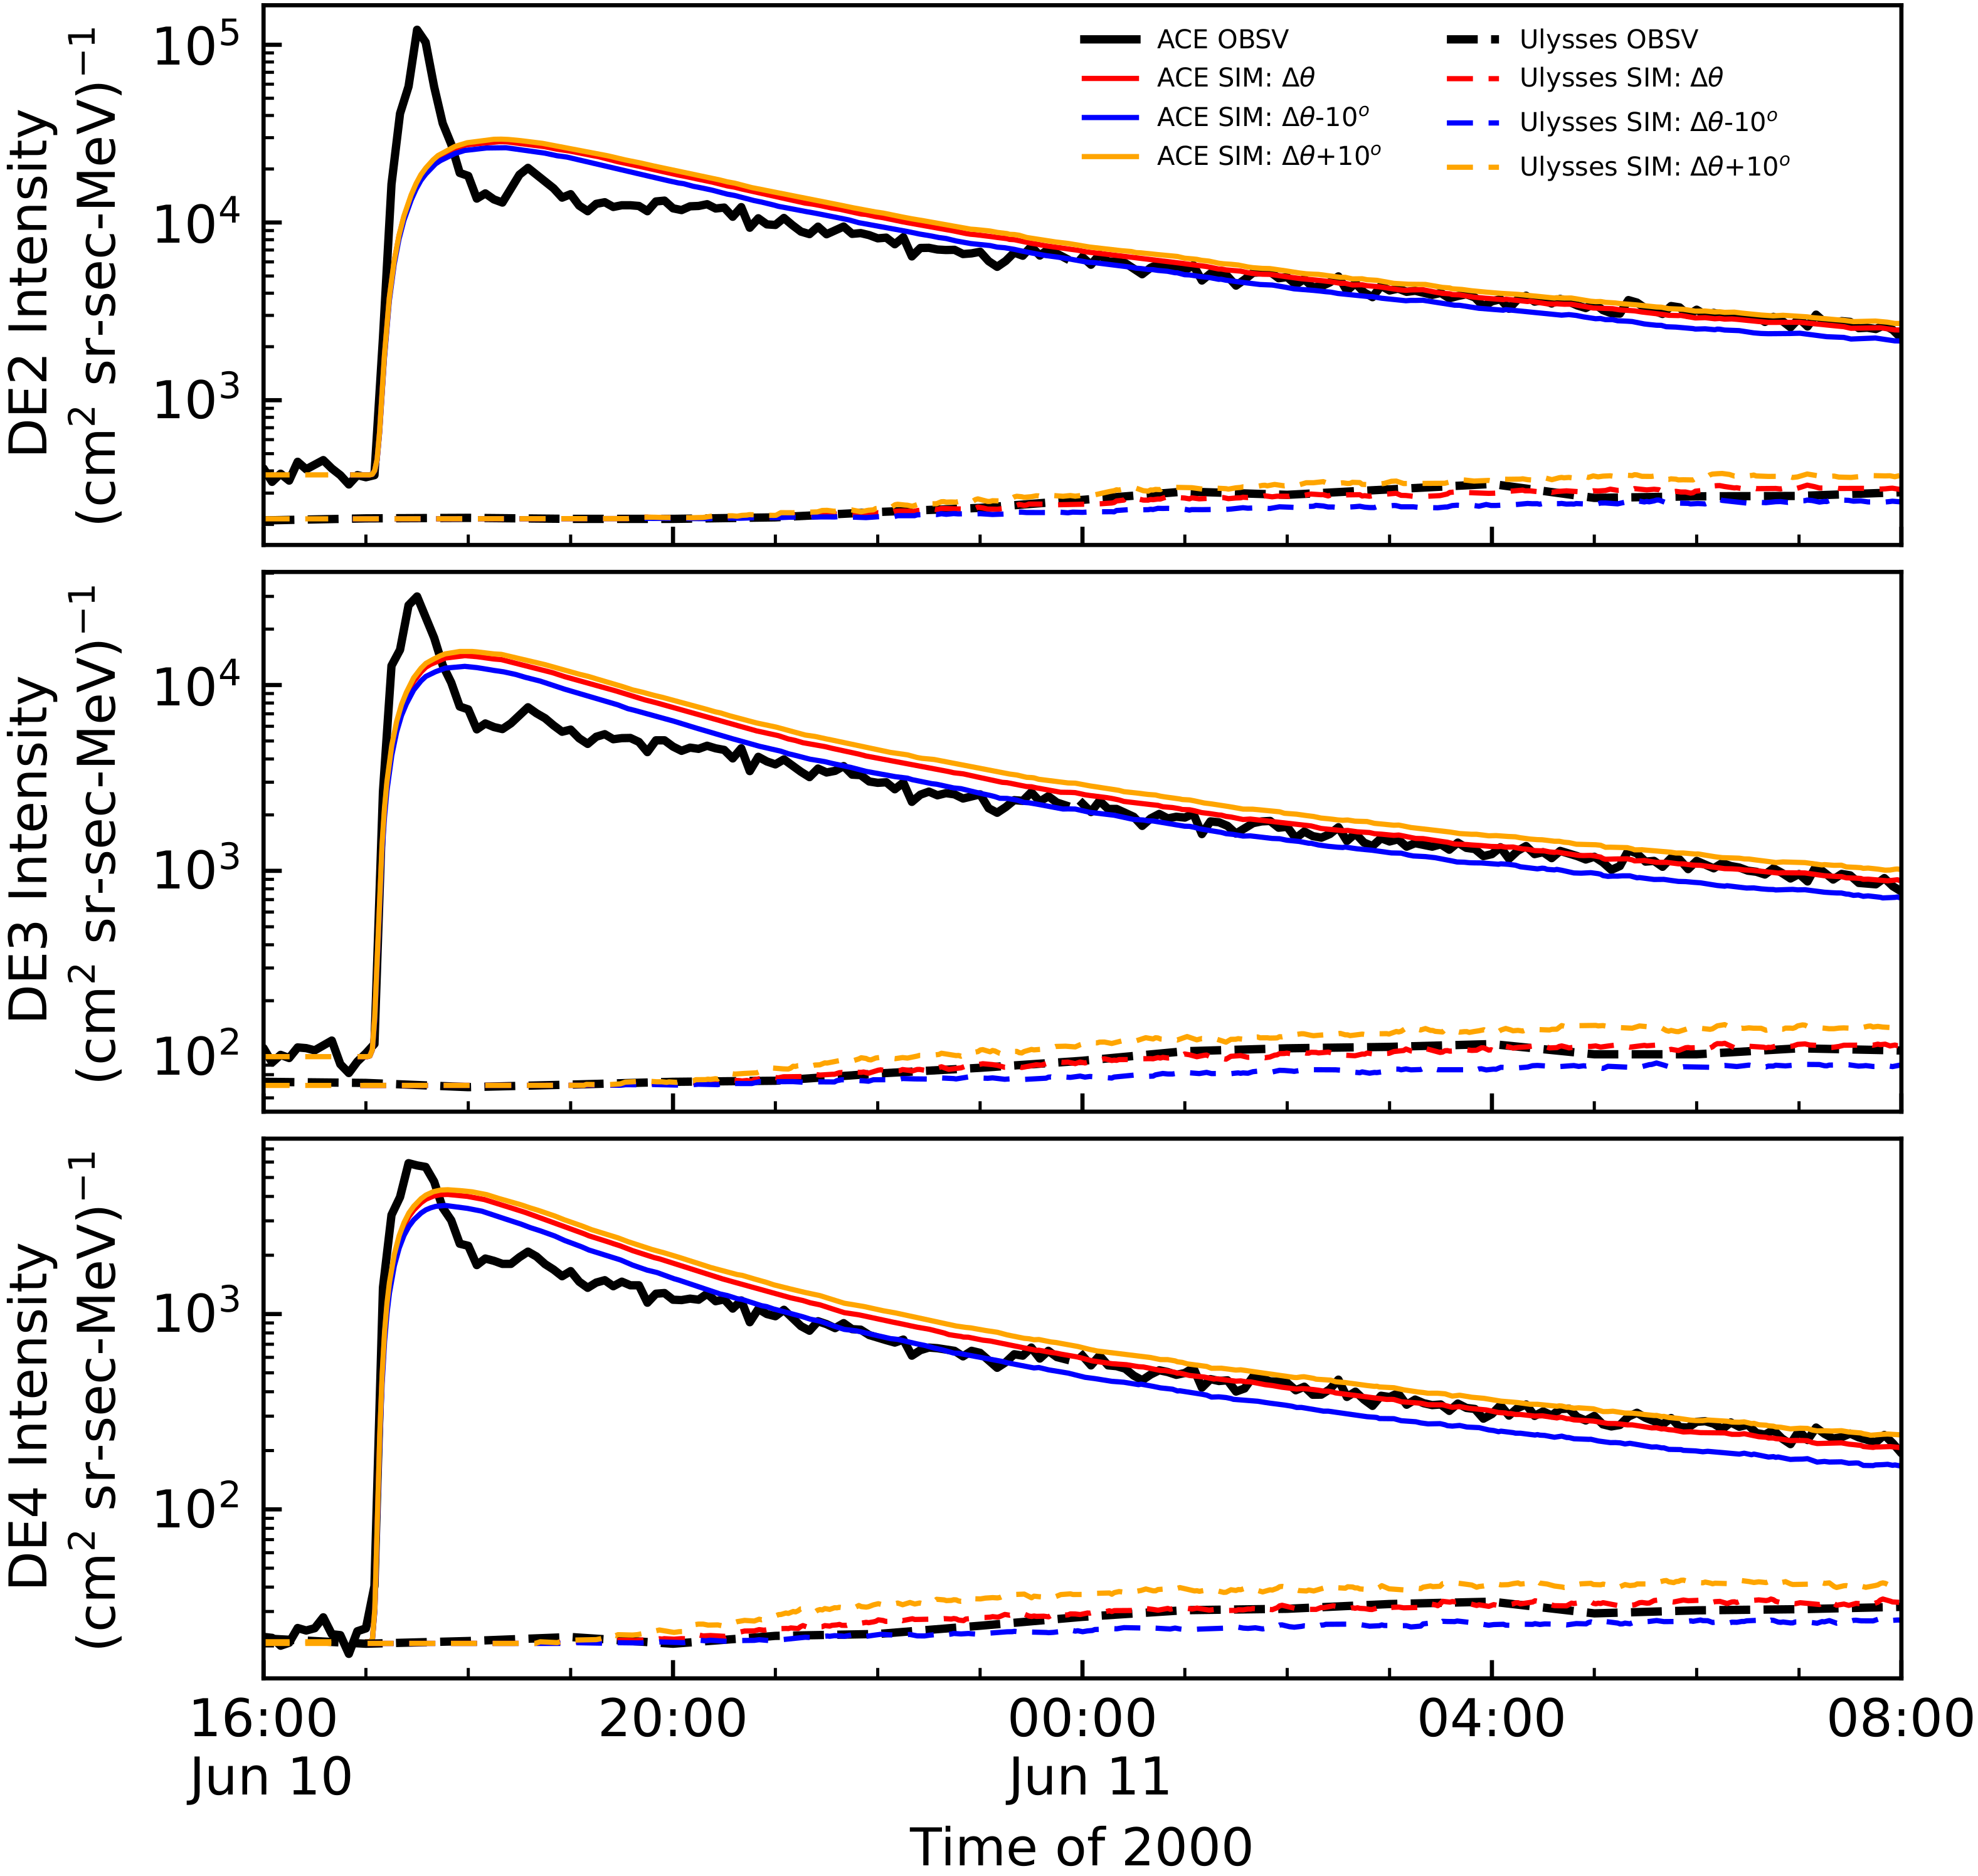
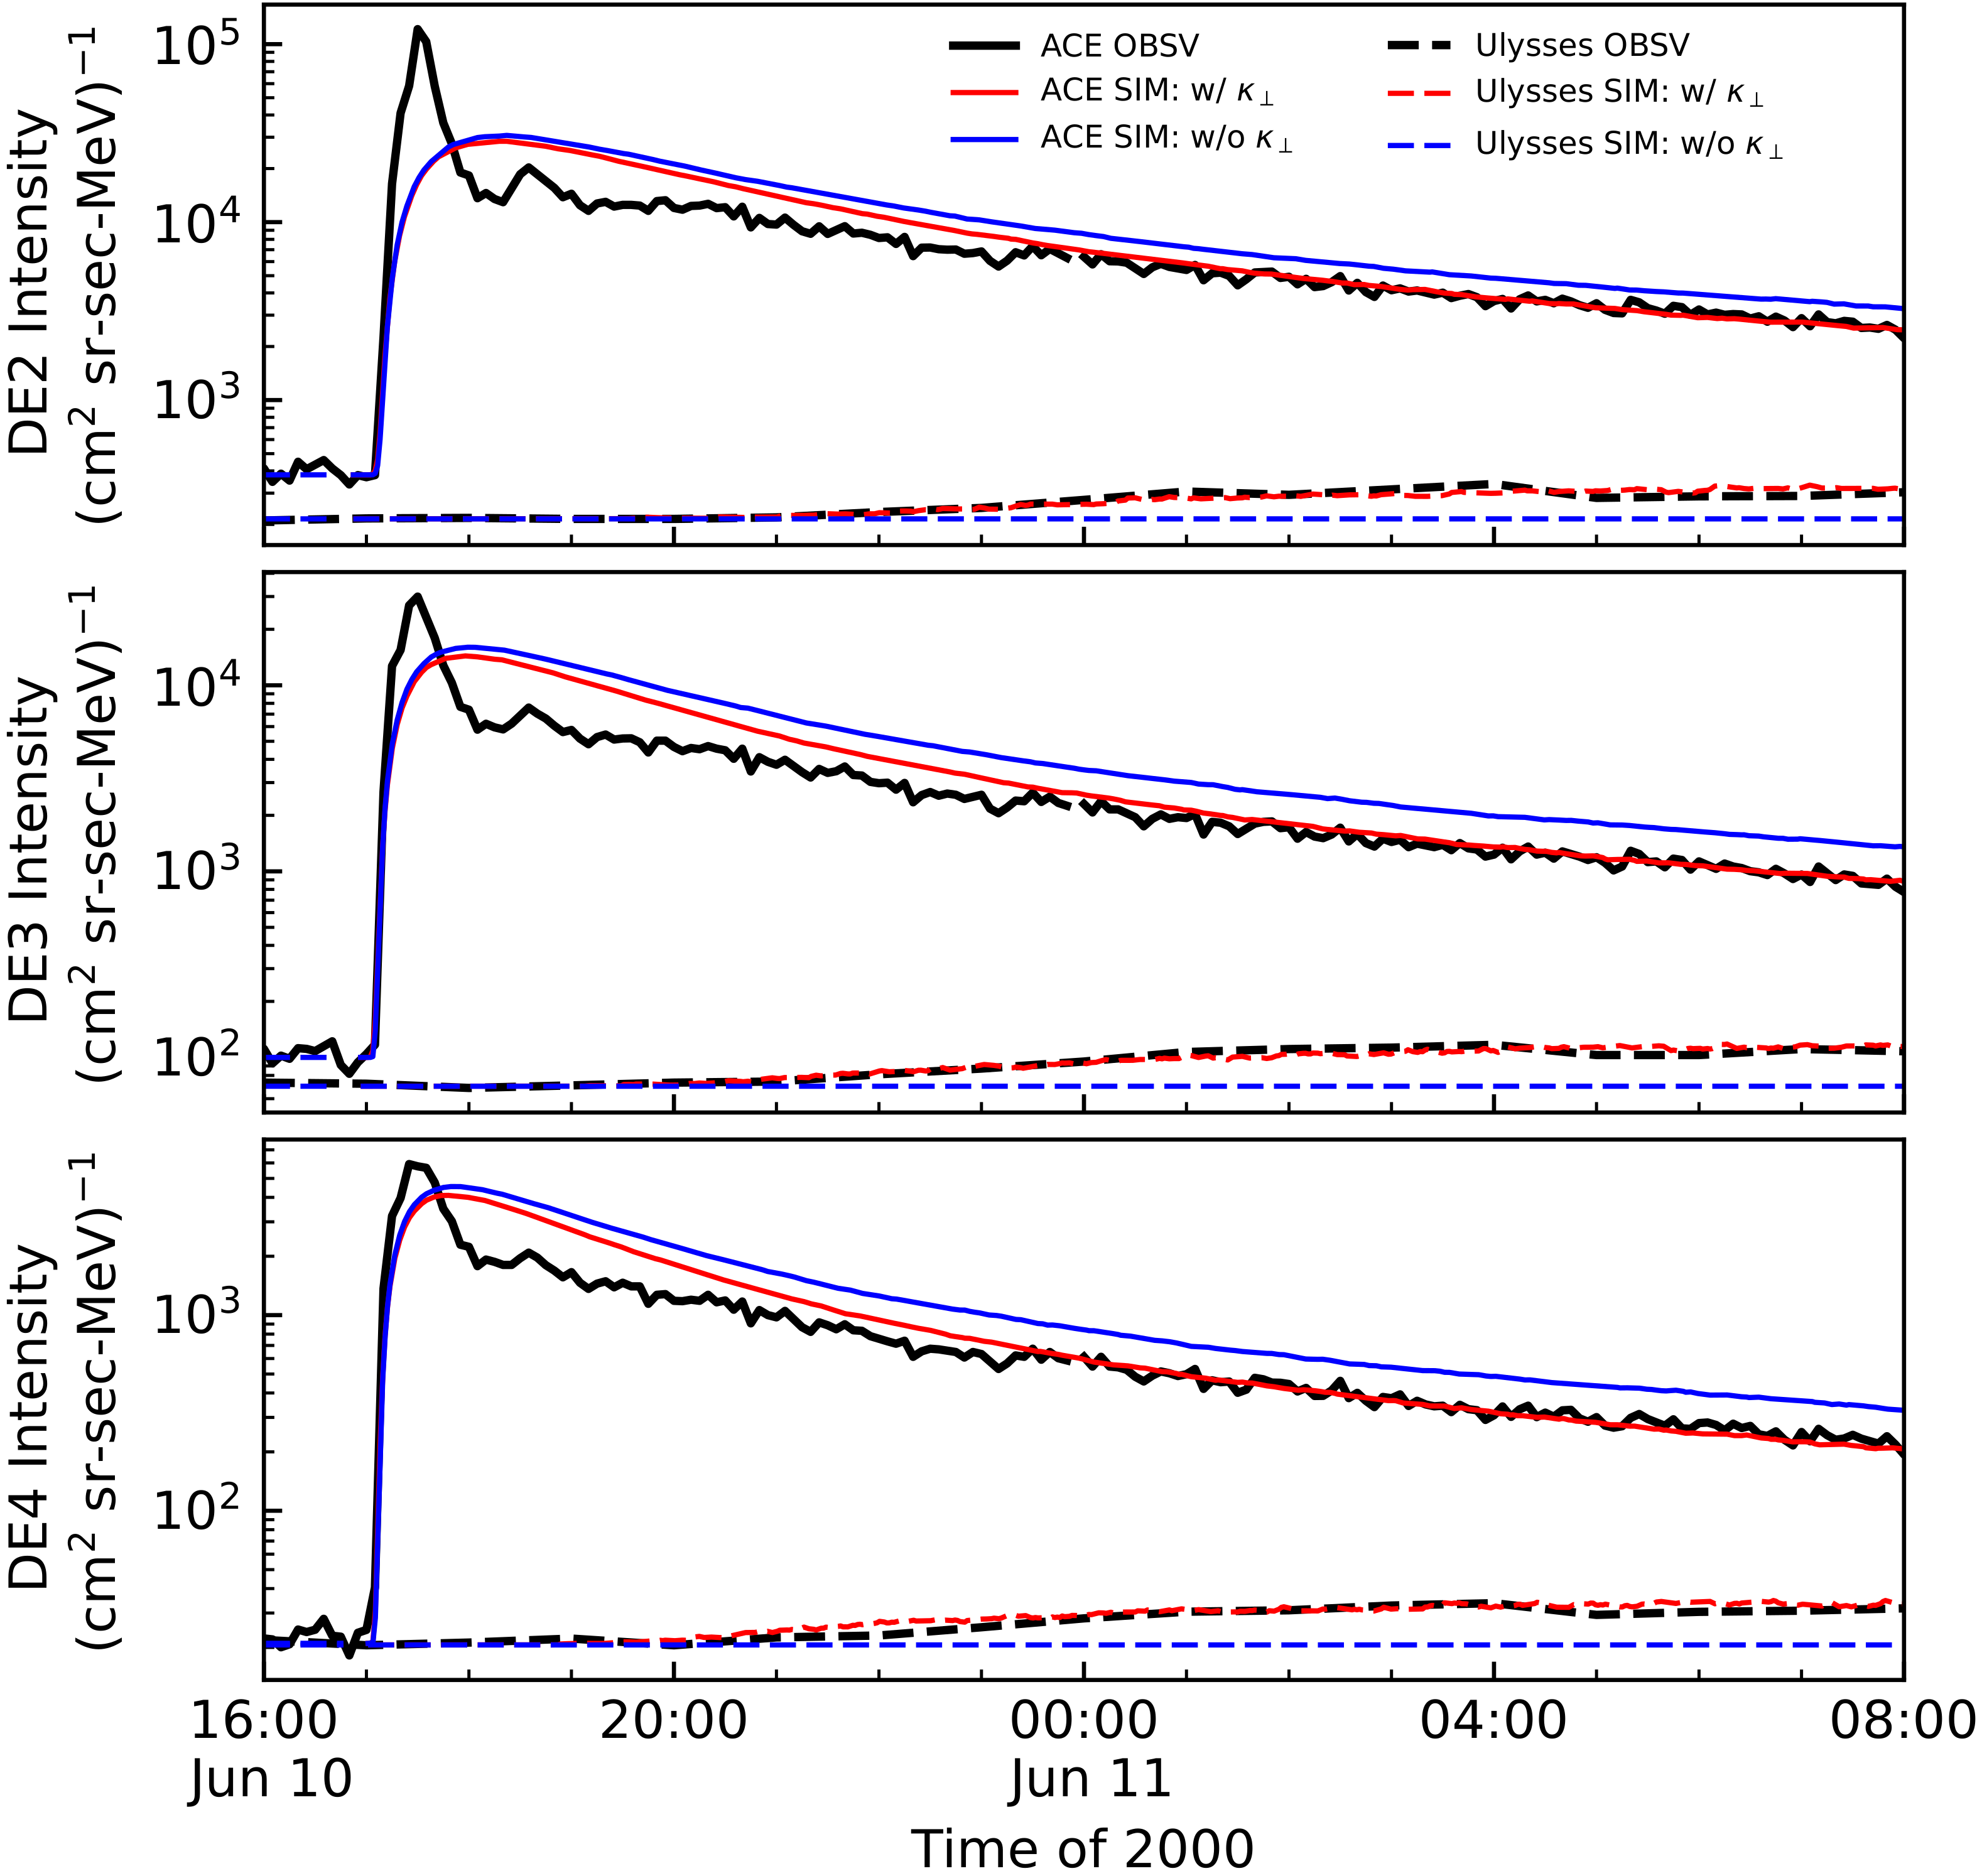
4.1. Study of the 10 June 2000 SEP Event through Simulations and a Comparison with Observations

With the SEP event observed in 10 June 2000, we obtain the best fit parameters by fitting the simulations with the observations. We show the best fit parameters in Table 3. Using these best fit parameters and the particle source model described in Equation (7), we generated time-intensity profiles of the particle sources in the different energy channels DE2, DE3, and DE4 shown with dotted, dashed, and dash-dot lines, respectively, in Figure 5. In addition, purple line shows the SXR flare intensity observed by GOES in the 0.1–0.8 nm wavelength band during the SEP event, and vertical lines show the onset and max times of the flare, where the ∼8 minutes of light travel time has been corrected. The time interval between the two vertical lines, i.e., flare impulsiveness time (onset-to-rise time), Δ T d , is 22 min. We may use this observation for the time analysis of the flare in this paper.
As seen in Figure 5, the start and peak times of the particle source in DE2–DE4 were all between the onset and max times of the flare. From Table 3 we can see that the time interval from the onset time of the flare to the peak time of the particle source, Δ T 1 , increases with the increase in energy, which indicates that it takes a long time for high-energy particles to be accelerated and released from the source. Actually, we do cannot confirm the specific mechanism of energy build-up, its conversion and/or release (thermal vs. non-thermal). This is an interesting topic that we may study in the future. The best fit maximum particle source intensities J max decrease with the increase in energy, indicating that it is more difficult to accelerate particles to higher energies.
Furthermore, the best fit half width of the particle source Δ θ is 60 in DE2 and 53 in DE3 and DE4, with the source boundaries indicated by dotted and dashed lines, respectively, in Figure 2. The footpoint of ACE and the flare were separated by 11 in longitude, so the footpoint of ACE was located in the particle source on the solar surface according to the best fit half width of the source. In contrast to the ACE spacecraft, the magnetic footpoint of Ulysses was significantly further away from the particle source region. The turbulence level δ B / B 0 is equal to 0.353 in the DE2–DE4 energy channels. It can be seen from Table 4 that as the energy increases, the parallel MFP λ increases and the ratio κ / κ decreases for electrons at 1 AU in the ecliptic.
Figure 6 shows the electron time-intensity profiles from observations and simulations for the energy channels of DE2–DE4, where solid and dashed lines are used to distinguish between the observation and simulation results, respectively. The black, red, and blue lines indicate the energy channels of DE2, DE3, and DE4, respectively. The left panel is the result of ACE, and the right panel is the result of Ulysses.
In this work, the simulated energies were set to the geometrical mean energies, which are 74, 134, and 235 keV in the energy channels DE2, DE3, and DE4, respectively. As depicted in Figure 6, the simulations were able to effectively reproduce most of the features observed in the DE2–DE4 energy channels. The best fit parameters used in the simulations are shown in Table 3. Our simulations do not fit well with the initial ACE peak observation for this event. This may be considered a sign of the nearly-free-streaming for electrons. However, if we modify the modelling parameters, for example, the Reid–Axford profile parameters, the simulation results fit well to the initial peak rather than the later phase. In this work, we pay more attention to the fitting of the later phase. It is noted that some assumptions are not realistic in our model, e.g., we assume a simple Reid–Axford profile of the electron source, and the the magnetic turbulence spectrum with a single index 5/3 without the dissipation range in the parallel diffusion coefficient, so the modelling results do not agree with the observations for this event and we fail to find a set of parameters for the numerical results to agree with the observations for both the early and late phases.
In order to show how the half width of the source affects the SEP profiles, we compare the simulation results with the different half widths with other parameters set as the best fit parameters, as shown in Table 3. In the top, middle, and bottom panels of Figure 7, NR electron intensities measured in three different energy channels, DE2, DE3, and DE4, respectively, are plotted. Solid and dashed lines, indicate the ACE and Ulysses spacecraft, respectively. The black lines indicate electron intensities as measured by the spacecraft, and red lines indicate the numerical simulation results with the best fit parameters. In addition, blue and orange lines are added to indicate simulations with the half width of sources 10 smaller or larger than the best fit parameter, i.e., Δ θ 10 and Δ θ + 10 , respectively. From the figure we can see that the simulations with the best fit source half width Δ θ fit observations of ACE and Ulysses well, but the intensity of the simulation results with the source half width 10 smaller or larger than the best fit are lower or higher than the best fit source half width, respectively.
Furthermore, we study the transport effects, i.e., perpendicular diffusion, on the simulations compared with the observations. In order to identify how the perpendicular diffusion affects the SEP profiles, we compare the simulation results with and without perpendicular diffusion with the best fit parameters, as shown in Table 3. Figure 8 is similar to Figure 7, except that blue lines are added to indicate simulations without perpendicular diffusion, where particles only propagate along magnetic field lines. When there is no perpendicular diffusion ACE intensities would decrease slowly with time in the decay phase and the peak intensities would be higher compared to the cases with perpendicular diffusion. The fact that ACE intensities are smaller with perpendicular diffusion than without is from the cross-field line motion of particles from the magnetic field line connected with ACE to other field lines. On the other hand, in a model without perpendicular diffusion, the SEPs would never reach Ulysses, since the magnetic footpoint of Ulysses is assumed to not be connected to the particle source.

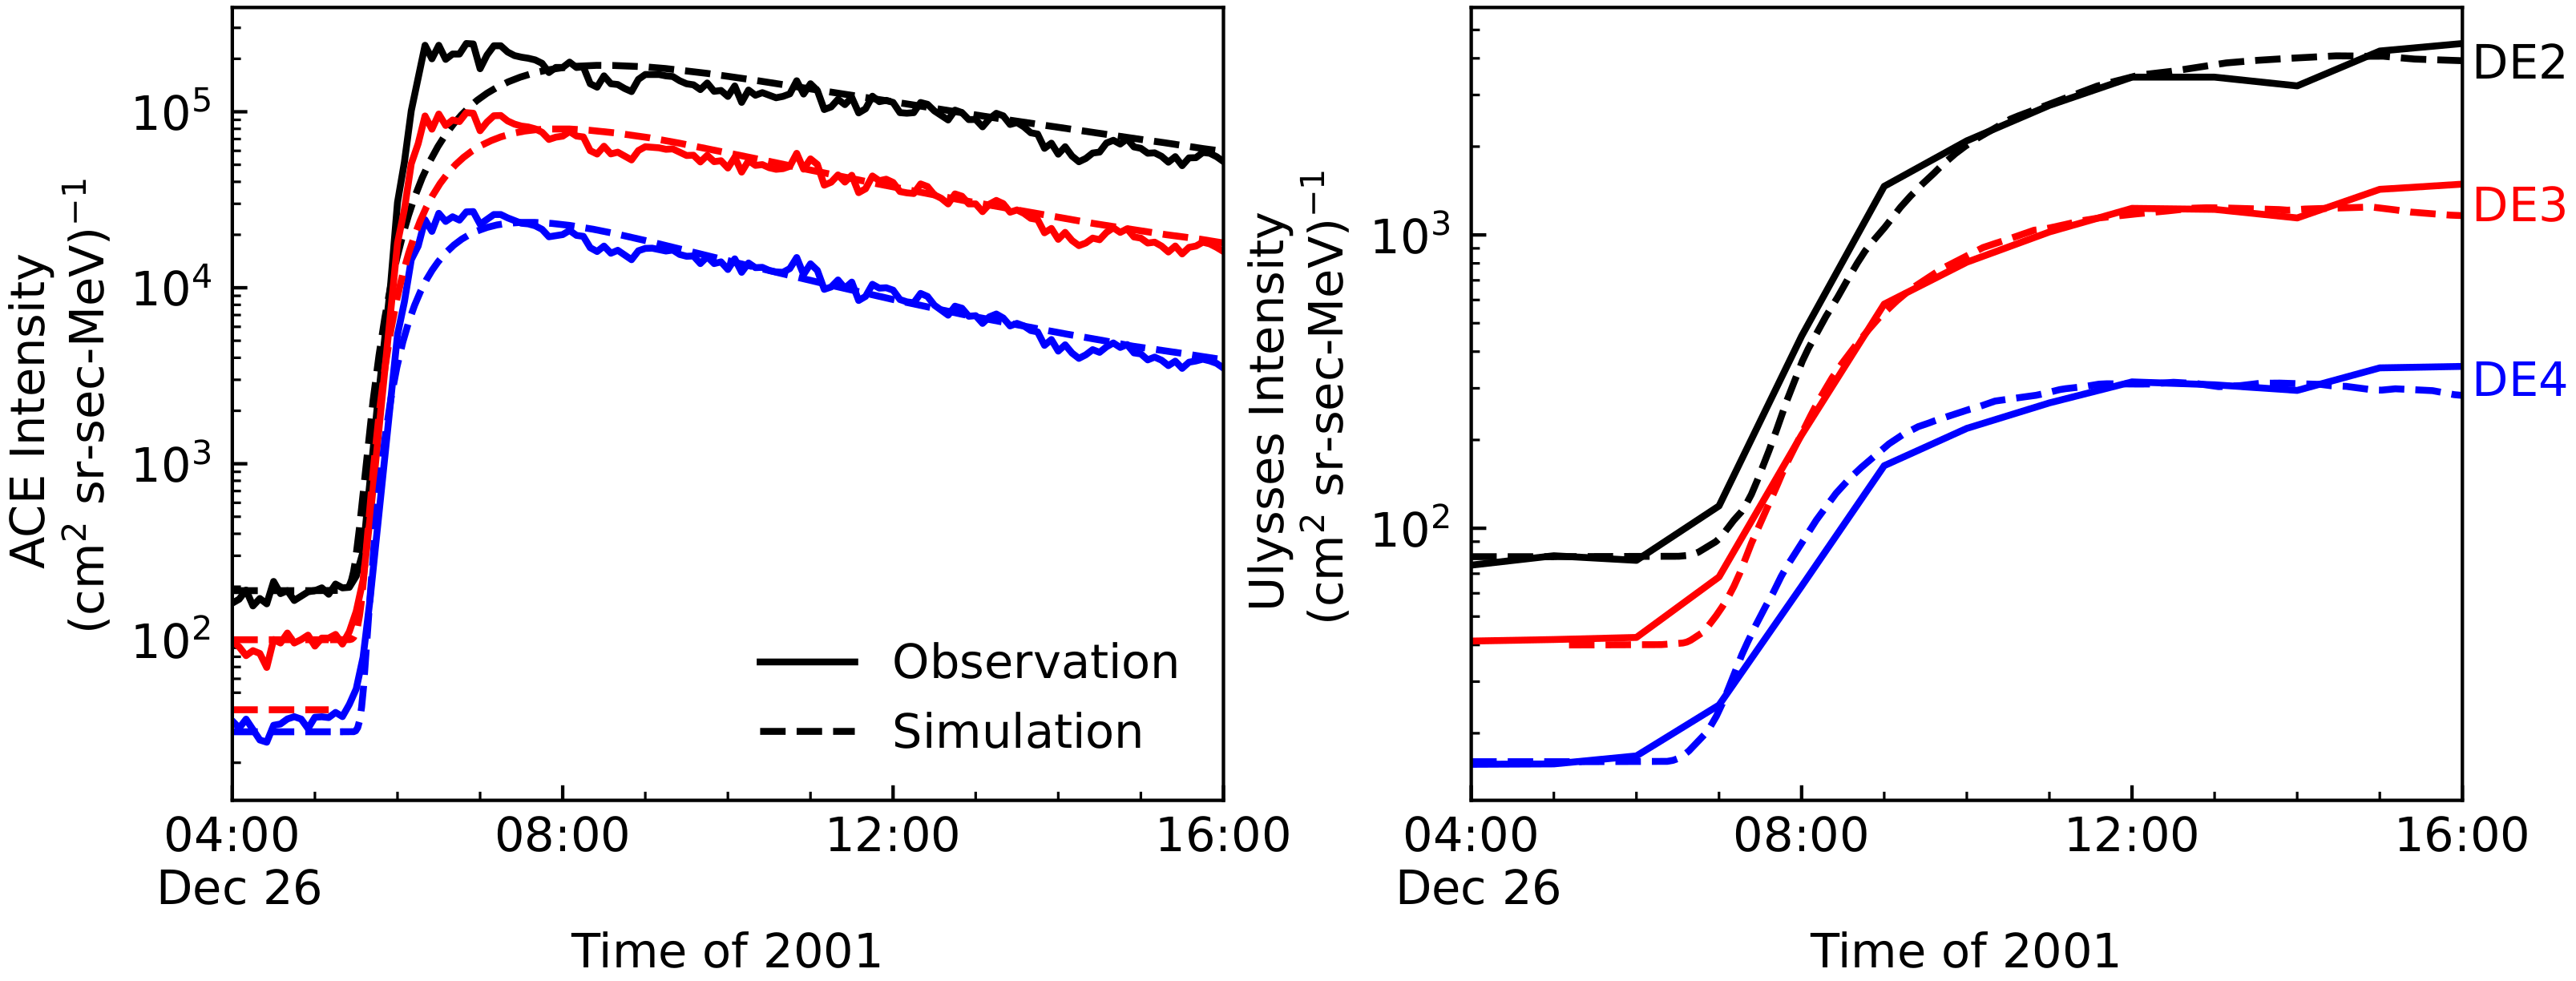
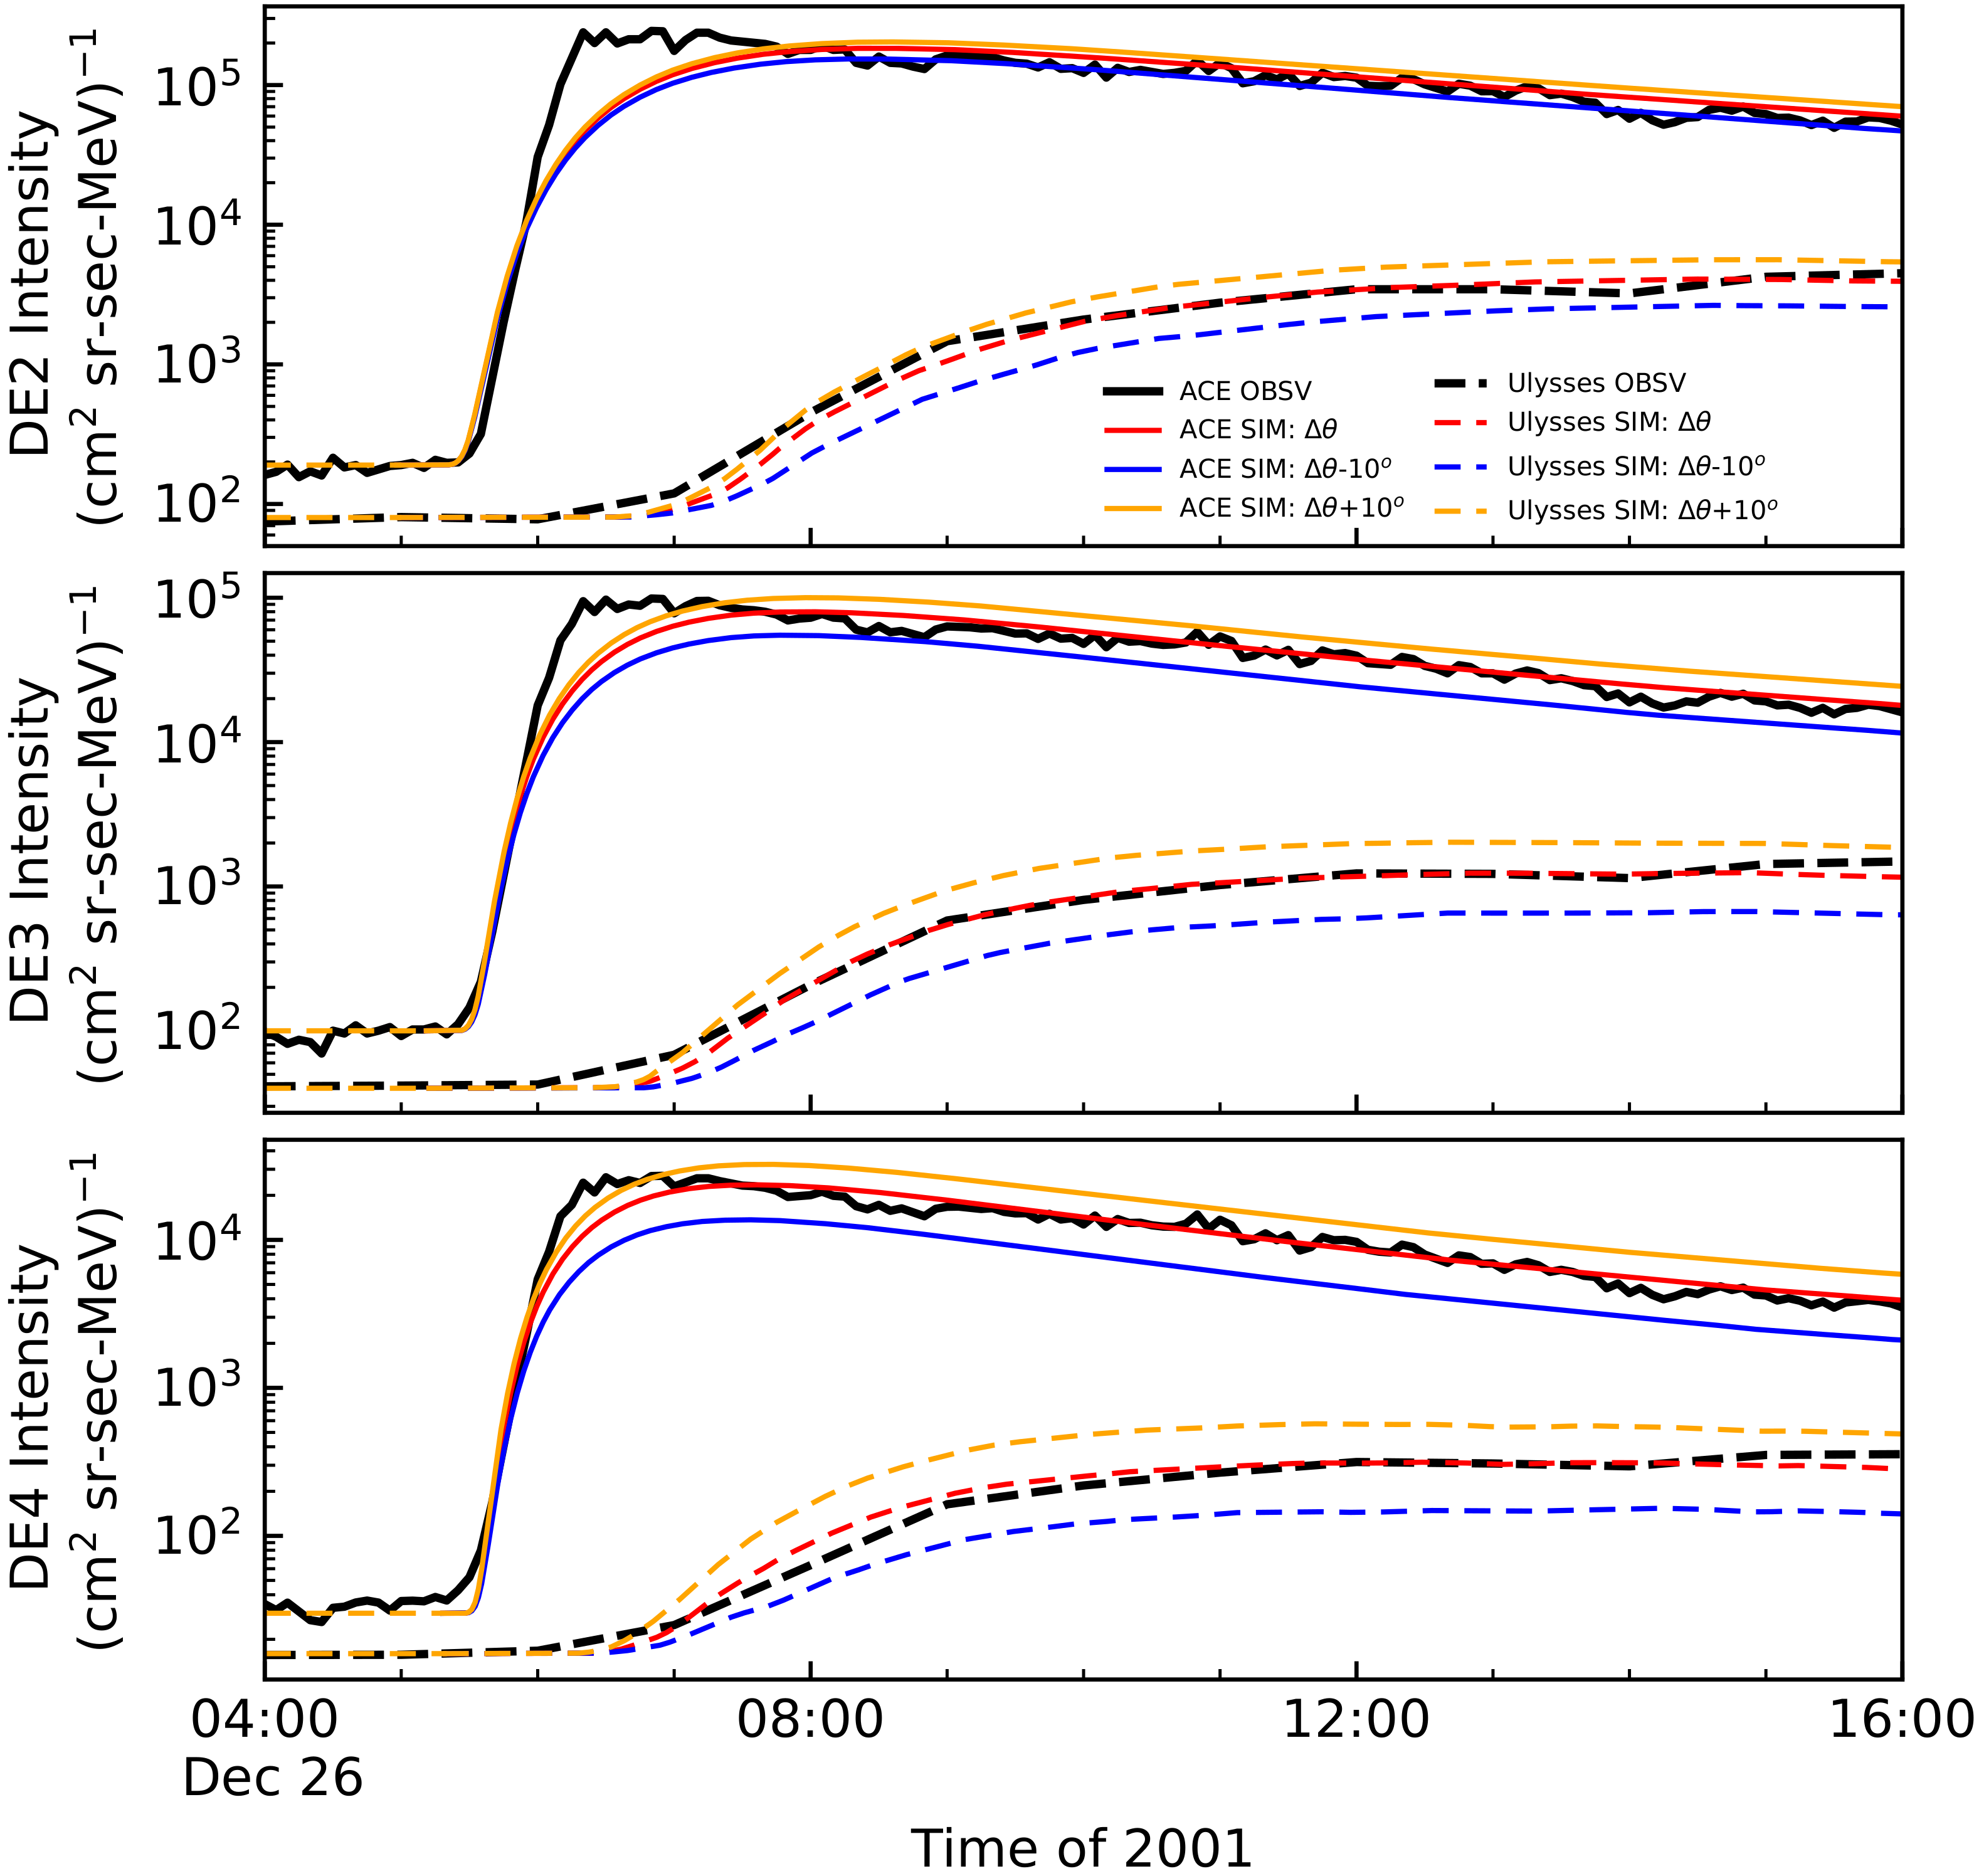
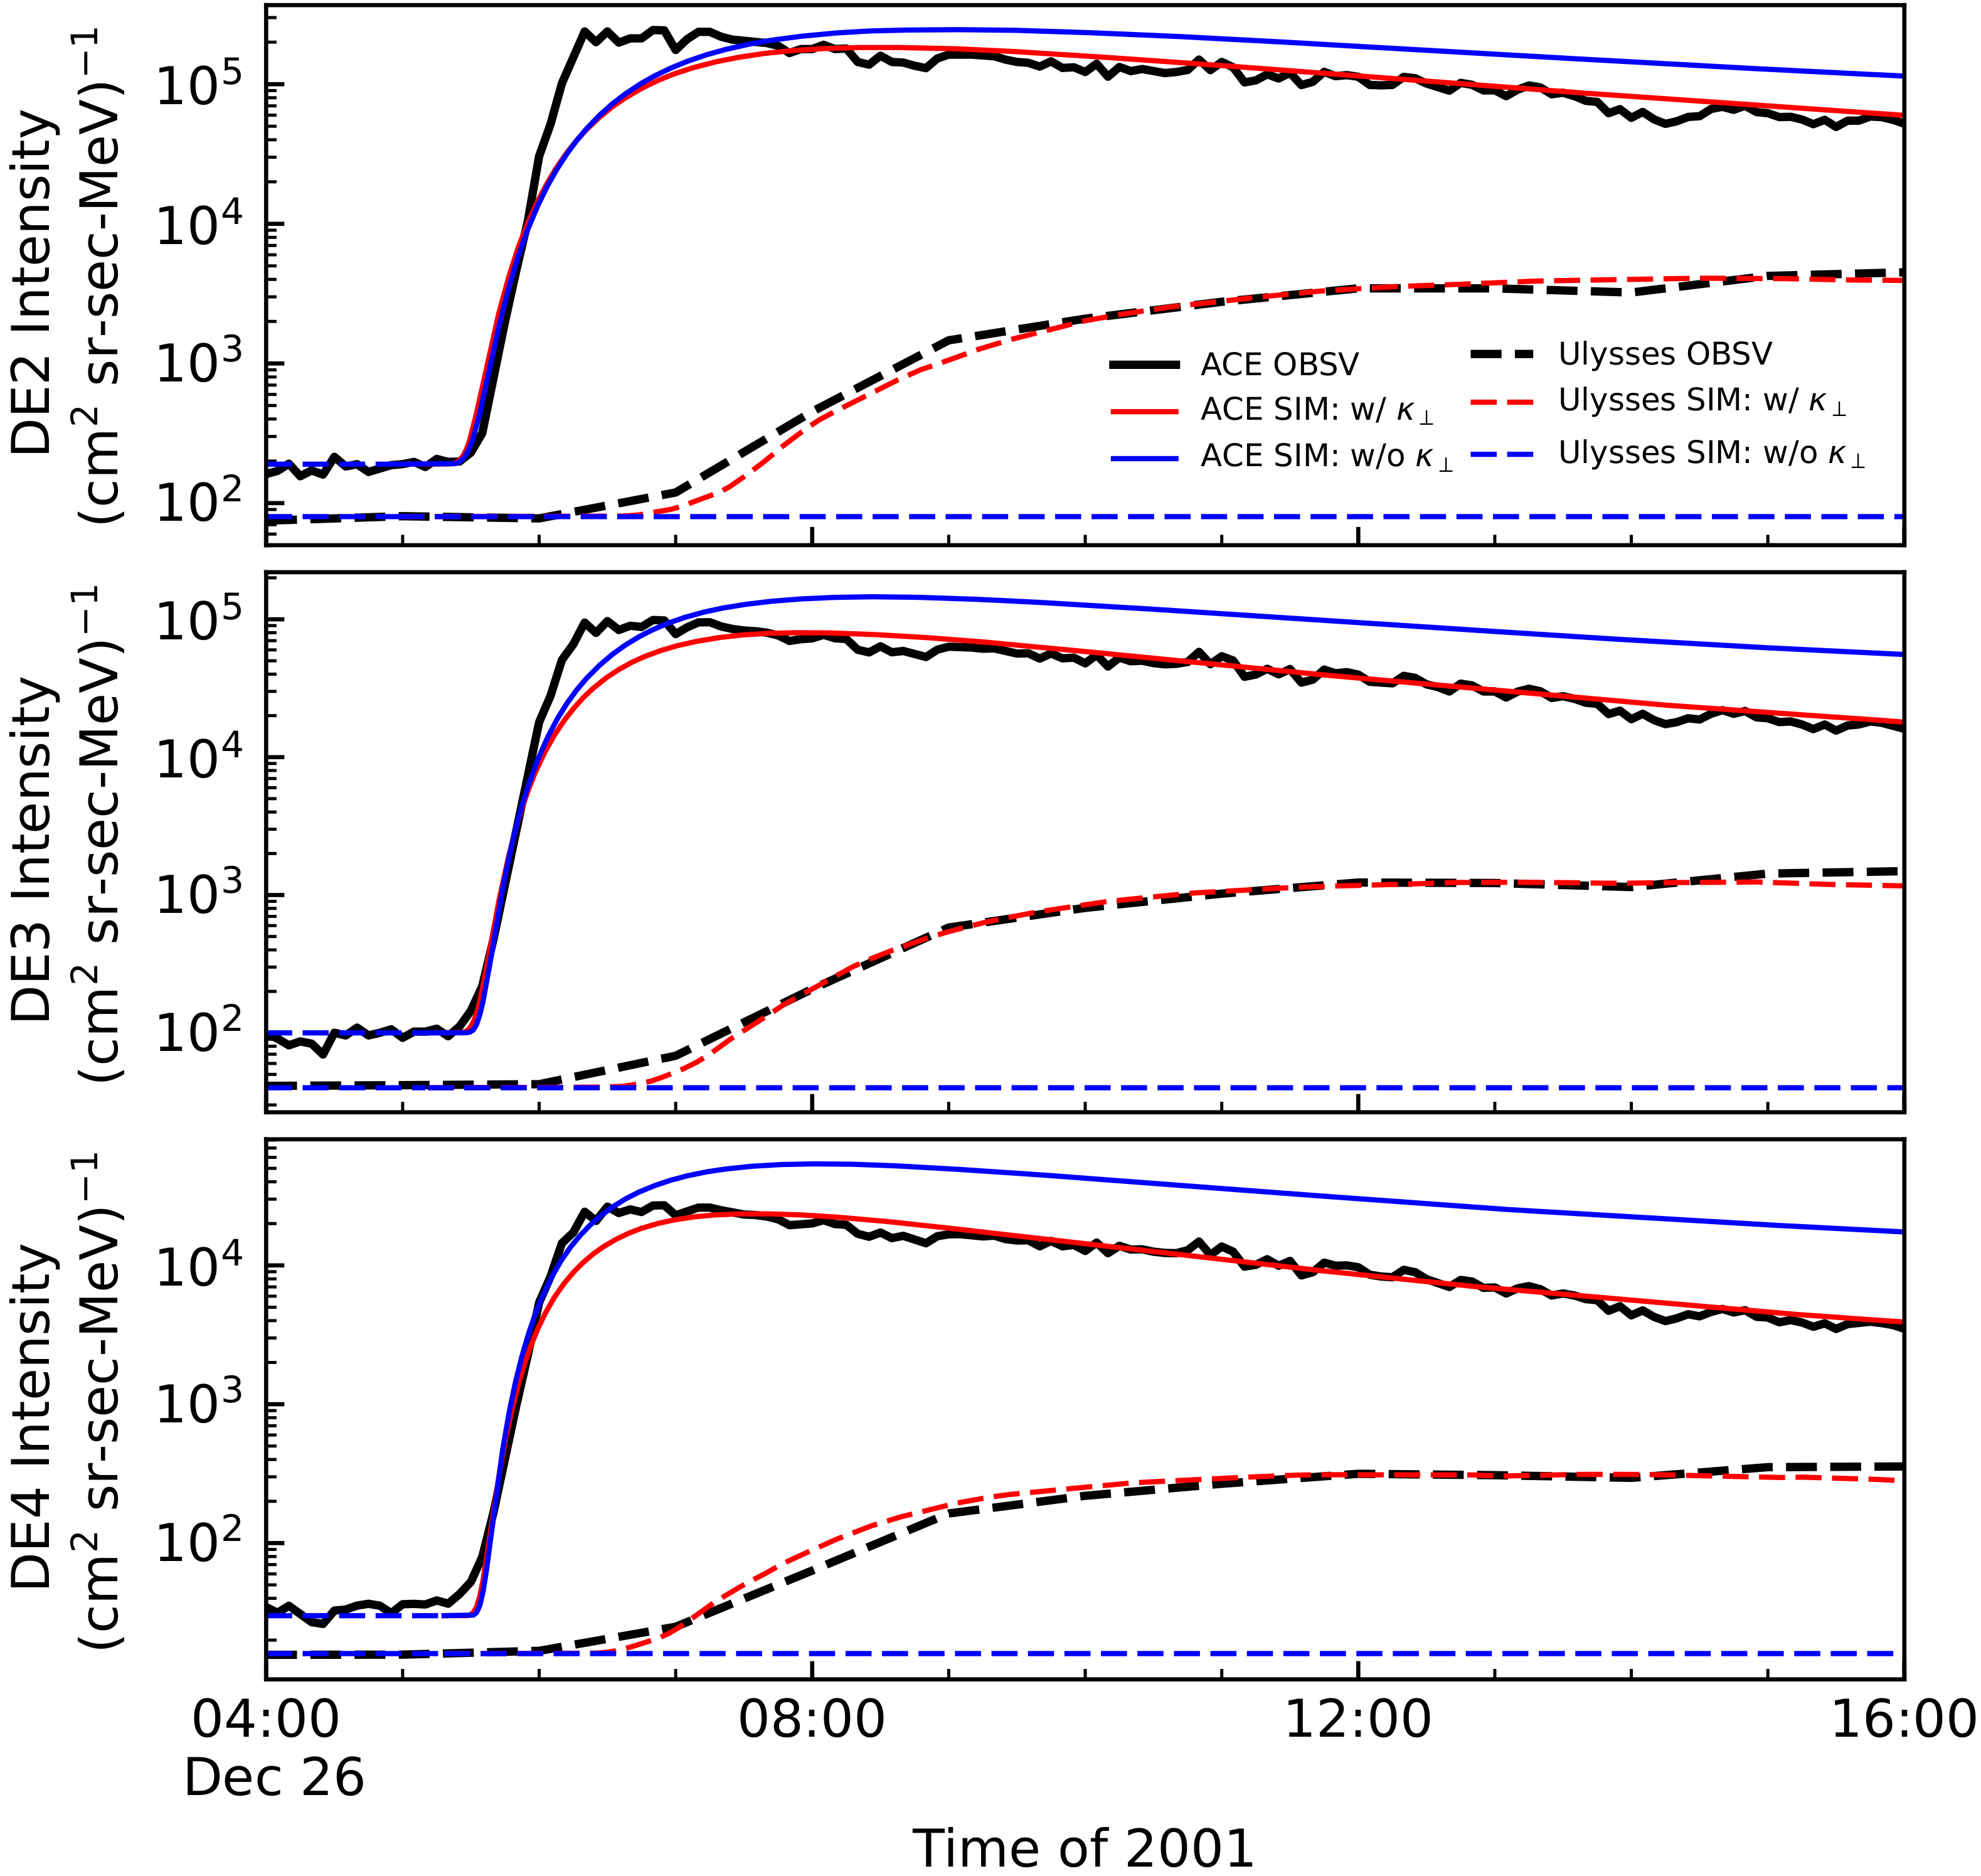
4.2. Study of the 26 December 2001 SEP Event through Simulations and a Comparison with Observations

For the 26 December 2001 SEP event, to fit the simulations with the observations, we also obtained the best fit parameters, as shown in Table 3. Based on these best fit parameters and the particle source model Equation (7), we derived the time-intensity profiles of the particle sources in the different energy channels DE2 (solid), DE3 (dashed), and DE4 (dotted). Figure 9 has the same format as Figure 5 but for the SEP event observed on 26 December 2001. In this event, the flare impulsiveness time Δ T d equals 68 min.
In addition, the start and peak times for particle sources occurred between the onset and max times of the flare in the energy channels of DE2–DE4. Moreover, the start and peak times of the high-energy particles are later than that for lower-energy particles in the particle source. One of the possible reasons for the high-energy particles to have a delayed injection may be that it takes longer to accelerate high-energy particles. Furthermore, it is obvious that the best fit J max decreases with increasing energy. Therefore, we suggest that it is more difficult to accelerate particles to higher energies. From Table 3 we can also see that, for this event, the best fit half width of the source is 55 in DE2, 40 in DE3, and 33 in DE4. Similar to Figure 2, in Figure 4 the dotted, dashed, and dash-dot lines indicate the source boundaries of the energy channels DE2, DE3, and DE4, respectively, for the 26 December 2001 SEP event. Figure 4 shows that the ACE footpoint was directly connected to the particle source by IMF lines, but the Ulysses footpoint was not.
Figure 10 is similar to Figure 6, showing the electron time-intensity profiles from the observations and simulations for the energy channels DE2–DE4. The only difference is that Figure 10 shows the 26 December 2001 SEP event. It can be seen from Figure 10 that, with the best fit parameters shown in Table 3, the simulations reproduce most features of the observations in the DE2–DE4 energy channels. The turbulence level δ B / B 0 equal 0.533 in the three different energy channels. It can also be seen from Table 4 that as the energy increases, the parallel MFP λ increases and the ratio κ / κ decreases at 1 AU in the ecliptic.
In order to study the effect of the half width of the SEP source, we perform simulations with different half widths with other parameters set as the best fit parameters, as shown in Table 3. Figure 11 is similar to Figure 7 except that it is for the 26 December 2001 SEP event. From Figure 11 we can see that with the best fit source half width Δ θ , the simulations fit the observations well.
In addition, we show the effect of perpendicular diffusion for the 26 December 2001 event in Figure 12 with the same format as Figure 8. It is shown that for the case of ACE, which is connected to the particle source by magnetic field lines, without perpendicular diffusion, SEP intensities from simulations have a higher peak and decrease slower than with perpendicular diffusion. On the other hand, for the case of Ulysses, the simulation results without perpendicular diffusion are always in the background level. Therefore, the perpendicular diffusion is very important, and the simulations with perpendicular diffusion agree better with the observations than those without for both ACE and Ulysses.

5. Best Fit Parameters for the Particle Source and Models

We analyse the best fit parameters of the particle source for the energy channels DE2–DE4, as shown in Table 3. We can see that, within the same event, τ c and τ L are the same. However, Δ θ , J max , and Δ T 1 vary as energy varies. Furthermore, we establish a simple model of J max , Δ T 1 and Δ θ of the particle source, which may be used in future space weather prediction.
In Figure 13, from top to bottom, the best fitting parameters J max , Δ T 1 and Δ θ of the energy function are represented as solid circles. The events observed on the 10 June 2000 and 26 December 2001 are indicated by black and red circles, respectively.
In the top panel of Figure 13, we can see that J max displays a decrease over energy E for both of the events. Moreover, within the same energy channel, the 26 December 2001 event, which had a larger SXR peak intensity I SXR and a longer flare impulsiveness time Δ T d , exhibits higher values of J max compared to the 10 June 2000 event. We consider the total energy released by a flare to be proportional to the product of the flare peak intensity and the rise time, I SXR Δ T d . On the other hand, assuming that the number of energetic electrons is proportional to J max E , we can estimate the total energy of energetic electrons released as J max E 2 . This suggests that the total energy released by a flare may be proportional to the energy carried by the energetic electrons,
J max E 2 I SXR Δ T d ,
or
J max = G I SXR Δ T d E 2 ,
where G is a constant to be determined. In top panel of Figure 13 the dashed lines show the model results from Equation (10) with the best fit value G = 2.07 × 10 3 (s sr) 1 . The unit of flare peak intensity I SXR is Watts/m 2 , the unit of the flare impulsiveness time Δ T d is minutes, the unit of energy E is keV, and the unit of the particle source intensity J max is (cm 2 sr s MeV) 1 . Therefore, the unit of the constant G is (s sr) 1 . We can see that the results of the modelling are in good agreement with the best fit parameters.
The middle panel of Figure 13 suggests that the best fit parameter Δ T 1 increases as the energy E increases for both events. Additionally, one can see that the 26 December 2001 event, which has a stronger flare, had a larger value of Δ T 1 . It is presumed that accelerating particles to higher momenta necessitates a longer time and that an event with a longer Δ T d could potentially increase the time to accelerate particles, thereby increasing Δ T 1 , Therefore, we assume
Δ T 1 = H p Δ T d ,
where H is a constant to be determined. In the middle panel of Figure 13 dashed lines show the modelling results from Equation (11) with the best fit value H = 3.41 × 10 11 (GeV/c) 1 . The unit of particles’ momentum p is GeV/c, the unit of Δ T d is minutes, and the unit of the time interval Δ T 1 is minutes. Therefore, the unit of the constant H is (GeV/c) 1 . We can see that the modelling results generally agree with the best fit parameters.
The bottom panel of Figure 13 shows that for both events the best fit parameter Δ θ decreases as the energy E increases. Furthermore, Δ θ is smaller in the 26 December 2001 event than in the 10 June 2000 event. The reason might be that it is more difficult to accelerate electrons to higher energies. In addition, with a larger SXR peak intensity, I SXR , the maximum value of particle source intensity J max increases, so Δ θ decreases for fixed total seed particles. Therefore, we suggest
Δ θ = K p I SXR 1 / 2
where K is a constant to be determined. In the bottom panel of Figure 13 the dashed lines show the model results from Equation (12) with the best fit value K = 3.13 × 10 16   deg · J · m 3 / 2 . The unit of particles’ momentum p is GeV/c, the unit of flare peak intensity I SXR is Watts/m 2 , and the unit of Δ θ is degree. Therefore, the unit of the constant K is deg · J · m 3 / 2 . This shows that the modelling results do not agree with the best fit parameters. However, such a model can account for the best fit parameter trends.

6. Summary and Discussion

We assumed that the 10 June 2000 and 26 December 2001 SEP events accelerated during intense solar flares. We focussed on the latitudinal extent of the SEPs and analysed the data of the ecliptic ACE and high-latitude Ulysses in the energy channels DE2–DE4. In addition, these scenarios were simulated by solving the three-dimensional focused transport equation. This transport equation contains many important propagation mechanisms, such as particle streaming along the magnetic field line, adiabatic cooling, magnetic focusing, and the diffusion perpendicular and parallel to the background magnetic field.
From the observations of the two SEP events we can see that, although ACE and Ulysses had very different latitudes, longitudes, and radial distances, they all observed the events, with the start and peak times of ACE earlier than that of Ulysses and the intensity observed by ACE 1–2 orders of magnitude stronger than that of Ulysses. It is suggested that the main difference of the time-intensity profiles between ACE, connected to the particle source with the magnetic field, and Ulysses, disconnected from the particle source, can be attributed to the transport effects, particularly perpendicular diffusion. On the other hand, the two events are quite different, e.g., they have different flare strengths, distances between the Ulysses footpoint and the source, distances between Ulysses and the Sun, etc. The significant difference between the two events as a whole may cause the huge change in the difference between the electron intensity observed by Ulysses and ACE.
In the 10 June 2000 and 26 December 2001 SEP events, the start and peak times of the particle sources were between the onset and max times of the flare. Moreover, the peak intensity of the particle source J max decreased with the increase in energy E, and increased with the SXR peak intensity I SXR , and a longer flare impulsiveness time Δ T d . Therefore, we have developed a model that describes the peak intensity of the particle source J max as being proportional to I SXR , Δ T d , and E 2 , which agrees well with the best fit parameters of the particle source. Additionally, we found that the best fit time interval from the onset time of the flare to the peak time of the particle source Δ T 1 increased both with energy E and the flare impulsiveness time Δ T d . It is hypothesized that longer times are needed to accelerate particles to a higher momentum, and that events with longer time intervals T d can make Δ T 1 larger. We have developed a model that describes Δ T 1 as proportional to momentum p and Δ T d , which is generally consistent with the fitting results from the simulations. Moreover, it is found that the best fit half width of particle source Δ θ decreased with increasing energy, possibly due to the difficulty of accelerating electrons to higher energies. It was also found that Δ θ was smaller in the 26 December 2001 event than the 10 June 2000 event. We conclude that, for fixed total seed particles, Δ θ decreases with larger SXR peak intensities, I SXR , or larger the maximum value of the particle source intensity J max . We propose a model for Δ θ proportional to momentum p 1 / 2 and an SXR peak flux I SXR 1 / 2 .
Vainio et al. [119] statistically studied the release time of energetic electrons by using the velocity dispersion analysis (VDA) and time-shifting analysis (TSA), and found that higher energy electrons were released later. However, in our study of the two events, the higher energy electrons were not released later according to our model.
In the numerical simulations, the best fit half width of the particle source Δ θ was 60 , much larger than the flare half width. One explanation for this phenomenon might be that the injection of SEPs at the Sun may be much wider than those expected from a flare-like point source. It suggests that the time needed for particles to be accelerated by a shock is proportional to the momentum in some situations (e.g., [120]). It is known that the inner boundary of the particle source was set to 0.05 AU. Firstly, due to the complex magnetic field configuration close to the Sun, the reconnection of closed and open magnetic field lines may allow particles to travel far away from the original solar event. Secondly, the existence of some kind of “coronal diffusion" process can also extend the particle source at the inner boundary beyond the angular span of the corresponding flare. This complex scenario may involve a combination of more than one of the processes described above.
The models of the SEP source parameters, obtained by the best fit of the simulation results to the observations, are important for the SEP prediction in space weather. In the future, we may check the validity of these models with simulations of more observation events.

Author Contributions

Data curation, L.L.; investigation, L.L., G.Q. and S.C.; methodology, L.L., G.Q. and Y.W.; writing—original draft preparation, L.L.; writing—review and editing, G.Q., L.L., Y.W. and S.C.; All authors have read and agreed to the published version of the manuscript.

Funding

This research was funded by the research grants of the Natural Science Foundation of China Grant Numbers: 42074206 and U1831129.

Institutional Review Board Statement

Not applicable.

Informed Consent Statement

Not applicable.

Data Availability Statement

The data for this paper are available at the Space Physics Data Facility (SPDF) (https://spdf.gsfc.nasa.gov/, accessed on 20 March 2023), and the CDAW CME catalog (http://cdaw.gsfc.nasa.gov/CME_list/, accessed on 20 March 2023).

Acknowledgments

We acknowledge the Ulysses/HISCALE, ACE/EPAM, and GOES/XRS teams for providing the data used in this paper. The Ulysses data are provided by Ulysses Date System (UDS), and the ACE data are provided by the ACE Science Center. We also acknowledge the availability of GOES data at the NOAA website. We gratefully acknowledge Ying Qin and Shaw Qin for useful discussions.

Conflicts of Interest

The authors declare no conflict of interest.

References

  1. Reames, D.V. Solar energetic particles: A paradigm shift. Rev. Geophys. 1995, 33, 585. [Google Scholar] [CrossRef]
  2. Reames, D.V. Particle acceleration at the Sun and in the heliosphere. Space Sci. Rev. 1999, 90, 413. [Google Scholar] [CrossRef]
  3. Cane, H.V.; von Rosenvinge, T.T.; Cohen, C.M.S.; Mewaldt, R.A. Two components in major solar particle events. Geophys. Res. Lett. 2003, 30, 8017. [Google Scholar] [CrossRef] [Green Version]
  4. Li, C.; Tang, Y.H.; Dai, Y.; Zong, W.G.; Fang, C. The acceleration characteristics of solar energetic particles in the 2000 July 14 event. Astron. Astrophys. 2007, 461, 1115–1119. [Google Scholar] [CrossRef] [Green Version]
  5. Cane, H.V.; Richardson, I.G.; von Rosenvinge, T.T. A study of solar energetic particle events of 1997-2006: Their composition and associations. J. Geophys. Res. 2010, 115, A08101. [Google Scholar] [CrossRef]
  6. Trottet, G.; Samwel, S.; Klein, K.L.; Dudok de Wit, T.; Miteva, R. Statistical Evidence for Contributions of Flares and Coronal Mass Ejections to Major Solar Energetic Particle Events. Sol. Phys. 2015, 290, 819. [Google Scholar] [CrossRef]
  7. Klein, K.L.; Dalla, S. Acceleration and Propagation of Solar Energetic Particles. Space Sci. Rev. 2017, 212, 1107–1136. [Google Scholar] [CrossRef]
  8. Wang, L.; Lin, R.P.; Krucker, S.; Mason, G.M. A Statistical Study of Solar Electron Events over One Solar Cycle. Astrophys. J. 2012, 759, 69. [Google Scholar] [CrossRef]
  9. Kahler, S.W. Solar Sources of Heliospheric Energetic Electron Events-Shocks or Flares? Space Sci. Rev. 2007, 129, 359–390. [Google Scholar] [CrossRef]
  10. Agueda, N.; Vainio, R.; Dalla, S.; Lario, D.; Sanahuja, B. Current Sheet Regulation of Solar Near-relativistic Electron Injection Histories. Astrophys. J. 2013, 765, 83. [Google Scholar] [CrossRef] [Green Version]
  11. Veronig, A.M.; Muhr, N.; Kienreich, I.W.; Temmer, M.; Vršnak, B. First Observations of a Dome-shaped Large-scale Coronal Extreme-ultraviolet Wave. Astrophys. J. Lett. 2010, 716, L57–L62. [Google Scholar] [CrossRef] [Green Version]
  12. Warmuth, A. Large-scale Globally Propagating Coronal Waves. Living Rev. Sol. Phys. 2015, 12, 3. [Google Scholar] [CrossRef] [Green Version]
  13. Wild, J.P. Observations of the Spectrum of High-Intensity Solar Radiation at Metre Wavelengths. II. Outbursts. Aust. J. Sci. Res. A Phys. Sci. 1950, 3, 399. [Google Scholar] [CrossRef]
  14. Gopalswamy, N.; Aguilar-Rodriguez, E.; Yashiro, S.; Nunes, S.; Kaiser, M.L.; Howard, R.A. Type II radio bursts and energetic solar eruptions. J. Geophys. Res. (Space Phys.) 2005, 110, A12S07. [Google Scholar] [CrossRef]
  15. Magdalenić, J.; Marqué, C.; Zhukov, A.N.; Vršnak, B.; Veronig, A. Flare-generated Type II Burst without Associated Coronal Mass Ejection. Astrophys. J. 2012, 746, 152. [Google Scholar] [CrossRef] [Green Version]
  16. Simnett, G.M. Solar and interplanetary particle acceleration. Advances in Space Research 2003, 31, 883–893. [Google Scholar] [CrossRef]
  17. Struminsky, A.B.; Grigorieva, I.Y.; Logachev, Y.I.; Sadovski, A.M. Two Phases of Solar Flares and a Stochastic Mechanism for Acceleration of Electrons and Protons. Astrophys. J. 2020, 63, 388–398. [Google Scholar] [CrossRef]
  18. Simnett, G.M.; Roelof, E.C.; Haggerty, D.K. The Acceleration and Release of Near-relativistic Electrons by Coronal Mass Ejections. Astrophys. J. 2002, 579, 854–862. [Google Scholar] [CrossRef]
  19. Simnett, G.M. Energetic Particles and Coronal Mass Ejections: A Case Study From ace and Ulysses. Sol. Phys. 2003, 213, 387–412. [Google Scholar] [CrossRef]
  20. Lario, D.; Decker, R.B.; Roelof, E.C.; Reisenfeld, D.B.; Sanderson, T.R. Low-energy particle response to CMEs during the Ulysses solar maximum northern polar passage. J. Geophys. Res. 2004, 109, A01107. [Google Scholar] [CrossRef] [Green Version]
  21. Dresing, N.; Kouloumvakos, A.; Vainio, R.; Rouillard, A. On the Role of Coronal Shocks for Accelerating Solar Energetic Electrons. Astrophys. J. Lett. 2022, 925, L21. [Google Scholar] [CrossRef]
  22. Dröge, W.; Kartavykh, Y.Y.; Dresing, N.; Klassen, A. Multi-spacecraft Observations and Transport Modeling of Energetic Electrons for a Series of Solar Particle Events in August 2010. Astrophys. J. 2016, 826, 134. [Google Scholar] [CrossRef] [Green Version]
  23. Liu, Y.; Luhmann, J.G.; Bale, S.D.; Lin, R.P. Solar Source and Heliospheric Consequences of the 2010 April 3 Coronal Mass Ejection: A Comprehensive View. Astrophys. J. 2011, 734, 84. [Google Scholar] [CrossRef]
  24. Richardson, I.G.; von Rosenvinge, T.T.; Cane, H.V.; Christian, E.R.; Cohen, C.M.S.; Labrador, A.W.; Leske, R.A.; Mewaldt, R.A.; Wiedenbeck, M.E.; Stone, E.C. >25 MeV Proton Events Observed by the High Energy Telescopes on the STEREO A and B Spacecraft and/or at Earth During the First ∼Seven Years of the STEREO Mission. Sol. Phys. 2014, 289, 3059–3107. [Google Scholar] [CrossRef]
  25. Desai, M.; Giacalone, J. Large gradual solar energetic particle events. Living Rev. Sol. Phys. 2016, 13, 3. [Google Scholar] [CrossRef] [PubMed] [Green Version]
  26. Paassilta, M.; Papaioannou, A.; Dresing, N.; Vainio, R.; Valtonen, E.; Heber, B. Catalogue of >55 MeV Wide-longitude Solar Proton Events Observed by SOHO, ACE, and the STEREOs at ∼1 AU During 2009-2016. Sol. Phys. 2018, 293, 70. [Google Scholar] [CrossRef] [Green Version]
  27. Wang, Y.; Lyu, D.; Xiao, B.X.; Qin, G.; Zhong, Y.S.; Lian, L.L. Statistical Survey of Reservoir Phenomenon in Energetic Proton Events Observed by Multiple Spacecraft. Astrophys. J. 2021, 909, 110. [Google Scholar] [CrossRef]
  28. Mason, G.M.; Gloeckler, G.; Hovestadt, D. Temporal variations of nucleonic abundances in solar flare energetic particle events. II - Evidence for large-scale shock acceleration. Astrophys. J. 1984, 280, 902–916. [Google Scholar] [CrossRef]
  29. Xu, Z.G.; Li, C.; Ding, M.D. Observations of a Coronal Shock Wave and the Production of Solar Energetic Particles. Astrophys. J. 2017, 840, 38. [Google Scholar] [CrossRef]
  30. Wiedenbeck, M.E.; Mason, G.M.; Cohen, C.M.S.; Nitta, N.V.; Gómez-Herrero, R.; Haggerty, D.K. Observations of Solar Energetic Particles from 3He-rich Events over a Wide Range of Heliographic Longitude. Astrophys. J. 2013, 762, 54. [Google Scholar] [CrossRef] [Green Version]
  31. Dresing, N.; Gómez-Herrero, R.; Heber, B.; Klassen, A.; Malandraki, O.; Dröge, W.; Kartavykh, Y. Statistical survey of widely spread out solar electron events observed with STEREO and ACE with special attention to anisotropies. Astron. Astrophys. 2014, 567, A27. [Google Scholar] [CrossRef]
  32. Bain, H.M.; Mays, M.L.; Luhmann, J.G.; Li, Y.; Jian, L.K.; Odstrcil, D. Shock Connectivity in the August 2010 and July 2012 Solar Energetic Particle Events Inferred from Observations and ENLIL Modeling. Astrophys. J. 2016, 825, 1. [Google Scholar] [CrossRef] [Green Version]
  33. Lario, D.; Haggerty, D.K.; Roelof, E.C.; Tappin, S.J.; Forsyth, R.J.; Gosling, J.T. Joint Ulysses and ACE observations of a magnetic cloud and the associated solar energetic particle event. Space Sci. Rev. 2001, 97, 277–280. [Google Scholar] [CrossRef]
  34. Lario, D.; Roelof, E.C.; Forsyth, R.J.; Gosling, J.T. 26-day Analysis of Energetic Ion Observations at High and Low Heliolatitudes: Ulysses and ACE. Space Sci. Rev. 2001, 97, 249–252. [Google Scholar] [CrossRef]
  35. Lario, D.; Decker, R.B.; Malandraki, O.E.; Lanzerotti, L.J. Influence of large-scale interplanetary structures on energetic particle propagation: September 2004 event at Ulysses and ACE. J. Geophys. Res. 2008, 113, A03105. [Google Scholar] [CrossRef] [Green Version]
  36. Malandraki, O.E.; Marsden, R.G.; Lario, D.; Tranquille, C.; Heber, B.; Mewaldt, R.A.; Cohen, C.M.S.; Lanzerotti, L.J.; Forsyth, R.J.; Elliott, H.A.; et al. Energetic Particle Observations and Propagation in the Three-dimensional Heliosphere During the 2006 December Events. Astrophys. J. 2009, 704, 469–476. [Google Scholar] [CrossRef] [Green Version]
  37. Dalla, S.; Balogh, A.; Krucker, S.; Posner, A.; Müller-Mellin, R.; Anglin, J.D.; Hofer, M.Y.; Marsden, R.G.; Sanderson, T.R.; Heber, B.; et al. Delay in solar energetic particle onsets at high heliographic latitudes. AnGeo 2003, 21, 1367–1375. [Google Scholar] [CrossRef]
  38. Malandraki, O.E.; Lario, D.; Lanzerotti, L.J.; Sarris, E.T.; Geranios, A.; Tsiropoula, G. October/November 2003 interplanetary coronal mass ejections: ACE/EPAM solar energetic particle observations. J. Geophys. Res. 2005, 110, A09S06. [Google Scholar] [CrossRef]
  39. Weygand, J.M.; Matthaeus, W.H.; Dasso, S.; Kivelson, M.G.; Kistler, L.M.; Mouikis, C. Anisotropy of the Taylor scale and the correlation scale in plasma sheet and solar wind magnetic field fluctuations. J. Geophys. Res. 2009, 114, A07213. [Google Scholar] [CrossRef]
  40. Weygand, J.M.; Matthaeus, W.H.; Dasso, S.; Kivelson, M.G. Correlation and Taylor scale variability in the interplanetary magnetic field fluctuations as a function of solar wind speed. J. Geophys. Res. 2011, 116, A08102. [Google Scholar] [CrossRef] [Green Version]
  41. Richardson, I.G.; Cane, H.V.; von Rosenvinge, T.T. Prompt arrival of solar energetic particles from far eastern events: The role of large-scale interplanetary magnetic field structure. J. Geophys. Res. 1991, 96, 7853–7860. [Google Scholar] [CrossRef]
  42. Richardson, I.G.; Cane, H.V. Particle flows observed in ejecta during solar event onsets and their implication for the magnetic field topology. J. Geophys. Res. 1996, 101, 27521–27532. [Google Scholar] [CrossRef]
  43. Chollet, E.E.; Mewaldt, R.A.; Cummings, A.C.; Gosling, J.T.; Haggerty, D.K.; Hu, Q.; Larson, D.; Lavraud, B.; Leske, R.A.; Opitz, A.; et al. Multipoint connectivity analysis of the May 2007 solar energeticparticle events. J. Geophys. Res. 2010, 115, 12106. [Google Scholar] [CrossRef] [Green Version]
  44. Qin, G.; Zhang, M.; Dwyer, J.R. Effect of adiabatic cooling on the fitted parallel mean free path of solar energetic particles. J. Geophys. Res. 2006, 111, A08101. [Google Scholar] [CrossRef] [Green Version]
  45. Qin, G.; Wang, Y.; Zhang, M.; Dalla, S. Transport of Solar Energetic Particles Accelerated by ICME Shocks: Reproducing the Reservoir Phenomenon. Astrophys. J. 2013, 766, 74. [Google Scholar] [CrossRef] [Green Version]
  46. Agueda, N.; Vainio, R.; Lario, D.; Sanahuja, B. Injection and Interplanetary Transport of Near-Relativistic Electrons: Modeling the Impulsive Event on 2000 May 1. Astrophys. J. 2008, 675, 1601–1613. [Google Scholar] [CrossRef]
  47. Agueda, N.; Lario, D.; Ontiveros, V.; Kilpua, E.; Sanahuja, B.; Vainio, R. Multi-spacecraft Study of the 8 November 2000 SEP Event: Electron Injection Histories 100° Apart. Sol. Phys. 2012, 281, 319–331. [Google Scholar] [CrossRef]
  48. Zhang, M.; Qin, G.; Rassoul, H. Propagation of Solar Energetic Particles in Three-Dimensional Interplanetary Magnetic Fields. Astrophys. J. 2009, 692, 109–132. [Google Scholar] [CrossRef] [Green Version]
  49. He, H.Q.; Qin, G.; Zhang, M. Propagation of Solar Energetic Particles in Three-dimensional Interplanetary Magnetic Fields: In View of Characteristics of Sources. Astrophys. J. 2011, 734, 74. [Google Scholar] [CrossRef] [Green Version]
  50. Wang, Y.; Qin, G.; Zhang, M. Effects of Perpendicular Diffusion on Energetic Particles Accelerated by the Interplanetary Coronal Mass Ejection shock. Astrophys. J. 2012, 752, 37. [Google Scholar] [CrossRef] [Green Version]
  51. Wang, Y.; Qin, G.; Zhang, M.; Dalla, S. A Numerical Simulation of Solar Energetic Particle Dropouts during Impulsive Events. Astrophys. J. 2014, 789, 157. [Google Scholar] [CrossRef] [Green Version]
  52. Dröge, W.; Kartavykh, Y.Y.; Dresing, N.; Heber, B.; Klassen, A. Wide longitudinal distribution of interplanetary electrons following the 7 February 2010 solar event: Observations and transport modeling. J. Geophys. Res. 2014, 119, 6074–6094. [Google Scholar] [CrossRef]
  53. Dröge, W.; Kartavykh, Y.Y.; Wang, L.; Telloni, D.; Bruno, R. Transport Modeling of Interplanetary Electrons in the 2002 October 20 Solar Particle Event. Astrophys. J. 2018, 869, 168. [Google Scholar] [CrossRef] [Green Version]
  54. Qin, G.; Wang, Y. Simulations of a Gradual Solar Energetic Particle Event Observed by Helios 1, Helios 2, and IMP 8. Astrophys. J. 2015, 809, 177. [Google Scholar] [CrossRef] [Green Version]
  55. Wang, Y.; Qin, G. Simulations of the Spatial and Temporal Invariance in the Spectra of Gradual Solar Energetic Particle Events. Astrophys. J. 2015, 806, 252. [Google Scholar] [CrossRef] [Green Version]
  56. Lario, D.; Kwon, R.Y.; Richardson, I.G.; Raouafi, N.E.; Thompson, B.J.; von Rosenvinge, T.T.; Mays, M.L.; Mäkelä, P.A.; Xie, H.; Bain, H.M.; et al. The Solar Energetic Particle Event of 2010 August 14: Connectivity with the Solar Source Inferred from Multiple Spacecraft Observations and Modeling. Astrophys. J. 2017, 838, 51. [Google Scholar] [CrossRef] [Green Version]
  57. Qin, G.; Qi, S.Y. Numerical simulation and data analysis of the 23 July 2012 SEP event observed by ACE, STEREO-A, and STEREO-B. Astron. Astrophys. 2020, 637, A48. [Google Scholar] [CrossRef] [Green Version]
  58. Dröge, W.; Kartavykh, Y.Y.; Klecker, B.; Kovaltsov, G.A. Anisotropic Three-Dimensional Focused Transport of Solar Energetic Particles in the Inner Heliosphere. J. Geophys. Res. 2010, 709, 912–919. [Google Scholar] [CrossRef]
  59. Dresing, N.; Gómez-Herrero, R.; Klassen, A.; Heber, B.; Kartavykh, Y.; Dröge, W.A. The Large Longitudinal Spread of Solar Energetic Particles During the 17 January 2010 Solar Event. Sol. Phys. 2012, 281, 281–300. [Google Scholar] [CrossRef] [Green Version]
  60. Wu, S.S.; Qin, G. Magnetic Cloud and Sheath in the Ground-Level Enhancement Event of 2000 July 14. I. Effects on the Solar Energetic Particles. Astrophys. J. 2020, 904, 151. [Google Scholar] [CrossRef]
  61. Zhao, L.L.; Zhang, M. Effects of Coronal Magnetic Field Structures on the Transport of Solar Energetic Particles. Astrophys. J. Lett. 2018, 859, L29. [Google Scholar] [CrossRef]
  62. Jokipii, J.R. Cosmic-Ray Propagation. I. Charged Particles in a Random Magnetic Field. Astrophys. J. 1966, 146, 480. [Google Scholar] [CrossRef]
  63. Matthaeus, W.H.; Qin, G.; Bieber, J.W.; Zank, G. Nonlinear Collisionless Perpendicular Diffusion of Charged Particles. Astrophys. J. 2003, 590, L53. [Google Scholar] [CrossRef] [Green Version]
  64. Dwyer, J.R.; Mason, G.M.; Mazur, J.E.; Jokipii, J.R.; von Rosenvinge, T.T.; Lepping, R.P. Perpendicular Transport of Low-Energy Corotating Interaction Region–associated Nuclei. Astrophys. J. 1997, 490, L115–L118. [Google Scholar] [CrossRef] [Green Version]
  65. Zhang, M.; Jokipii, J.R.; McKibben, R.B. Perpendicular Transport of Solar Energetic Particles in Heliospheric Magnetic Fields. Astrophys. J. 2003, 595, 493. [Google Scholar] [CrossRef]
  66. Qin, G.; Matthaeus, W.H.; Bieber, J.W. Subdiffusive transport of charged particles perpendicular to the large scale magnetic field. Geophys. Res. Lett. 2002, 29, 1048. [Google Scholar] [CrossRef] [Green Version]
  67. Qin, G.; Matthaeus, W.H.; Bieber, J.W. Perpendicular transport of charged particles in composite model turbulence: Recovery of diffusion. Astrophys. J. 2002, 578, L117–L120. [Google Scholar] [CrossRef]
  68. Qin, G. Nonlinear Parallel Diffusion of Charged Particles: Extent to the Nonlinear Guiding Center Theory. Astrophys. J. 2007, 656, 217–221. [Google Scholar] [CrossRef] [Green Version]
  69. Cane, H.V.; Reames, D.V.; von Rosenvinge, T.T. The role of interplanetary shocks in the longitude distribution of solar energetic particles. J. Geophys. Res. 1988, 93, 9555–9567. [Google Scholar] [CrossRef]
  70. Cliver, E.W.; Kahler, S.W.; Neidig, D.F.; Cane, H.V.; Richardson, I.G.; Kallenrode, M.B.; Wibberenz, G. Extreme “Propagation” of Solar Energetic Particles. In Proceedings of the 24th InInternational Cosmic Ray Conference, Rome, Italy, 28 August–8 September 1995; Volume 4, p. 257. [Google Scholar]
  71. Reames, D.V.; Barbier, L.M.; Ng, C.K. The Spatial Distribution of Particles Accelerated by Coronal Mass Ejection-driven Shocks. Astrophys. J. 1996, 466, 473. [Google Scholar] [CrossRef]
  72. Lario, D.; Kwon, R.Y.; Riley, P.; Raouaf, N.E. On the Link between the Release of Solar Energetic Particles Measured at Widespread Heliolongitudes and the Properties of the Associated Coronal Shocks. Astrophys. J. 2017, 847, 103. [Google Scholar] [CrossRef]
  73. Wang, H.; Chae, J.; Yurchyshyn, V.; Yang, G.; Steinegger, M.; Goode, P. Inter-Active Region Connection of Sympathetic Flaring on 2000 February 17. Astrophys. J. 2001, 559, 1171–1179. [Google Scholar] [CrossRef] [Green Version]
  74. Schrijver, C.J.; Title, A.M. Long-range magnetic couplings between solar flares and coronal mass ejections observed by SDO and STEREO. J. Geophys. Res. 2011, 116, A04108. [Google Scholar] [CrossRef]
  75. Shen, Y.; Liu, Y.; Su, J. Sympathetic Partial and Full Filament Eruptions Observed in One Solar Breakout Event. Astrophys. J. 2012, 750, 12. [Google Scholar] [CrossRef] [Green Version]
  76. Schrijver, C.J.; Title, A.M.; Yeates, A.R.; DeRosa, M.L. Pathways of Large-scale Magnetic Couplings between Solar Coronal Events. Astrophys. J. 2013, 773, 93. [Google Scholar] [CrossRef] [Green Version]
  77. Klein, K.L.; Krucker, S.; Lointier, G.; Kerdraon, A. Open magnetic flux tubes in the corona and the transport of solar energetic particles. Astron. Astrophys. 2008, 486, 589–596. [Google Scholar] [CrossRef]
  78. Masson, S.; Antiochos, S.K.; DeVore, C.R. A Model for the Escape of Solar-flare-accelerated Particles. Astrophys. J. 2013, 771, 82. [Google Scholar] [CrossRef]
  79. Shalchi, A.; Qin, G. Random Walk of Magnetic Field Lines: Analytical Theory versus Simulations. Astrophys. J. 2010, 330, 279. [Google Scholar] [CrossRef]
  80. Strauss, R.D.; Fichtner, H. On Aspects Pertaining to the Perpendicular Diffusion of Solar Energetic Particles. Astrophys. J. 2015, 801, 29. [Google Scholar] [CrossRef]
  81. Zhang, M.; Zhao, L. Precipitation and Release of Solar Energetic Particles from the Solar Coronal Magnetic Field. Astrophys. J. 2017, 846, 107. [Google Scholar] [CrossRef]
  82. Diaz, I.; Zhang, M.; Qin, G.; Rassoul, H. Delay in Onset Times of Solar Energetic Particles. In Proceedings of the 32nd International Cosmic Ray Conference, Beijing, China, 11–18 August 2011; Volume 10, p. 41. [Google Scholar] [CrossRef]
  83. Wang, Y.; Qin, G. Estimation of the release time of solar energetic particles near the Sun. Astrophys. J. 2015, 799, 111. [Google Scholar] [CrossRef] [Green Version]
  84. Qin, G.; Shalchi, A. Numerical investigation of the infulence of large turbulence scales on the parallel and perpendicular transport of cosmic rays. Adv. Space Res. 2012, 49, 1643–1652. [Google Scholar] [CrossRef]
  85. Matthaeus, W.H.; Goldstein, M.L.; Roberts, D.A. Evidence for the presence of quasi-two-dimensional nearly incompressible fluctuations in the solar wind. J. Geophys. Res. 1990, 95, 20673–20683. [Google Scholar] [CrossRef]
  86. Heras, A.M.; Sanahuja, B.; Smith, Z.K.; Detman, T.; Dryer, M. The Influence of the Large-Scale Interplanetary Shock Structure on a Low-Energy Particle Event. Astrophys. J. 1992, 391, 359. [Google Scholar] [CrossRef]
  87. Heras, A.M.; Sanahuja, B.; Lario, D.; Smith, Z.K.; Detman, T.; Dryer, M. Three Low-Energy Particle Events: Modeling the Influence of the Parent Interplanetary Shock. Astrophys. J. 1995, 445, 497. [Google Scholar] [CrossRef]
  88. Kallenrode, M.B.; Wibberenz, G. Propagation of particles injected from interplanetary shocks: A black box model and its consequences for acceleration theory and data interpretation. J. Geophys. Res. 1997, 102, 22311–22334. [Google Scholar] [CrossRef]
  89. Lario, D.; Sanahuja, B.; Heras, A.M. Energetic Particle Events: Efficiency of Interplanetary Shocks as 50 keV < E < 100 MeV Proton Accelerators. Astrophys. J. 1998, 509, 415–434. [Google Scholar] [CrossRef] [Green Version]
  90. Kallenrode, M.B. Shock as a black box: 2. Effects of adiabatic deceleration and convection included. J. Geophys. Res. 2001, 106, 24989–25004. [Google Scholar] [CrossRef]
  91. Lin, R.P. Non-relativistic Solar Electrons. Space Sci. Rev. 1974, 16, 189–256. [Google Scholar] [CrossRef]
  92. Lin, R.P. WIND Observations of Suprathermal Electrons in the Interplanetary Medium. Space Sci. Rev. 1998, 86, 61–78. [Google Scholar] [CrossRef]
  93. Haggerty, D.K.; Roelof, E.C. Impulsive Near-relativistic Solar Electron Events: Delayed Injection with Respect to Solar Electromagnetic Emission. Astrophys. J. 2002, 579, 841–853. [Google Scholar] [CrossRef]
  94. Ho, G.C.; Roelof, E.C.; Mason, G.M.; Lario, D.; Mazur, J.E. Onset study of impulsive solar energetic particle events. Adv. Space Res. 2003, 32, 2679–2684. [Google Scholar] [CrossRef]
  95. Mason, G.M. 3He-Rich Solar Energetic Particle Events. Space Sci. Rev. 2007, 130, 231–242. [Google Scholar] [CrossRef]
  96. Qin, G.; He, H.Q.; Zhang, M. An effect of perpendicular diffusion on the anisotropy of solar energetic particles from unconnected sources. Astrophys. J. 2011, 738, 28. [Google Scholar] [CrossRef]
  97. Gold, R.E.; Krimigis, S.M.; Hawkins, S.E.u.; Haggerty, D.K.; Lohr, D.A.; Fiore, E.; Armstrong, T.P.; Holland, G.; Lanzerotti, L.J. Electron, Proton, and Alpha Monitor on the Advanced Composition Explorer spacecraft. Space Sci. Rev. 1998, 86, 541–562. [Google Scholar] [CrossRef]
  98. Lanzerotti, L.J.; Gold, R.E.; Anderson, K.A.; Armstrong, T.P.; Lin, R.P.; Krimigis, S.M.; Pick, M.; Roelof, E.C.; Sarris, E.T.; Simnett, G.M. Heliosphere Instrument for Spectra, Composition and Anisotropy at Low Energies. Astron. Astrophys. Suppl. Ser. 1992, 92, 349–363. [Google Scholar]
  99. Lario, D. Heliospheric Energetic Particle Reservoirs: Ulysses and ACE 175-315 keV Electron Observations. AIP Conf. Proc. 2010, 1216, 625. [Google Scholar] [CrossRef] [Green Version]
  100. McComas, D.J.; Bame, S.J.; Barker, P.; Feldman, W.C.; Phillips, J.L.; Riley, P.; Griffee, J.W. Solar Wind Electron Proton Alpha Monitor (SWEPAM) for the Advanced Composition Explorer. Space Sci. Rev. 1998, 86, 563–612. [Google Scholar] [CrossRef]
  101. Bame, S.J.; McComas, D.J.; Barraclough, B.L.; Phillips, J.L.; Sofaly, K.J.; Chavez, J.C.; Goldstein, B.E.; Sakurai, R.K. The ULYSSES solar wind plasma experiment. Astron. Astrophys. Suppl. Ser. 1992, 92, 237–265. [Google Scholar]
  102. Qin, G.; Zhang, M.; Dwyer, J.R.; Rassoul, H.K.; Mason, G.M. The Model Dependence of Solar Energetic Particle Mean Free Paths Under Weak Scattering. Astrophys. J. 2005, 627, 562. [Google Scholar] [CrossRef]
  103. Agueda, N.; Klein, K.L.; Vilmer, N.; Rodríguez-Gasén, R.; Malandraki, O.E.; Papaioannou, A.; Subirȧ, M.; Sanahuja, B.; Valtonen, E.; Dröge, W.; et al. Release timescales of solar energetic particles in the low corona. Astron. Astrophys. 2014, 570, A5. [Google Scholar] [CrossRef] [Green Version]
  104. Skilling, J. Cosmic Rays in the Galaxy: Convection or Diffusion? Astrophys. J. 1971, 170, 265. [Google Scholar] [CrossRef]
  105. Schlicheiser, R. Cosmic Ray Astrophysics, 2nd ed.; Springer: Berlin/Heidelberg, Germany, 2002. [Google Scholar]
  106. Beek, J.; Wibberenz, G. Pitch Angle Distributions of Solar Energetic Particles and the Local Scattering Properties of the Interplanetary Medium. Astrophys. J. 1986, 311, 437. [Google Scholar] [CrossRef]
  107. Qin, G.; Shalchi, A. Pitch angle diffusion coefficients of charged particles from computer simulations. Astrophys. J. 2009, 707, 61–66. [Google Scholar] [CrossRef]
  108. Qin, G.; Shalchi, A. Pitch-Angle Dependent Perpendicular Diffusion of Energetic Particles Interacting With Magnetic Turbulence. Appl. Phys. Res. 2014, 6, 1–13. [Google Scholar] [CrossRef] [Green Version]
  109. Hasselmann, K.; Wibberenz, G. Scattering of charged particles by random electromagnetic fields. Z. Fur Geophys. 1968, 34, 353. [Google Scholar]
  110. Earl, J.A. The diffusive idealization of charged-particle transport in random magnetic fields. Astrophys. J. 1974, 193, 231. [Google Scholar] [CrossRef] [Green Version]
  111. Shalchi, A.; Bieber, J.W.; Matthaeus, W.H. Analytic Forms of the Perpendicular Diffusion Coefficient in Magnetostatic Turbulence. Astrophys. J. 2004, 604, 675. [Google Scholar] [CrossRef] [Green Version]
  112. Shalchi, A.; Li, G.; Zank, G.P. Analytic forms of the perpendicular cosmic ray diffusion coefficient for an arbitrary turbulence spectrum and applications on transport of Galactic protons and acceleration at interplanetary shocks. Astrophys. Space Sci. 2010, 325, 99. [Google Scholar] [CrossRef]
  113. Adhikari, L.; Zank, G.P.; Hunana, P.; Shiota, D.; Bruno, R.; Hu, Q.; Telloni, D., II. Transport of Nearly Incompressible Magnetohydrodynamic Turbulence from 1 to 75 au. Astrophys. J. 2017, 841, 85. [Google Scholar] [CrossRef] [Green Version]
  114. Zank, G.P.; Adhikari, L.; Hunana, P.; Shiota, D.; Bruno, R.; Telloni, D. Theory and Transport of Nearly Incompressible Magnetohydrodynamic Turbulence. Astrophys. J. 2017, 835, 147. [Google Scholar] [CrossRef]
  115. Zank, G.P.; Adhikari, L.; Zhao, L.L.; Mostafavi, P.; Zirnstein, E.J.; McComas, D.J. The Pickup Ion-mediated Solar Wind. Astrophys. J. 2017, 835, 147. [Google Scholar] [CrossRef]
  116. Zhao, L.L.; Adhikari, L.; Zank, G.P.; Hu, Q.; Feng, X.S. Influence of the Solar Cycle on Turbulence Properties and Cosmic-Ray Diffusion. Astrophys. J. 2018, 856, 94. [Google Scholar] [CrossRef]
  117. Reid, G.C. A diffusive model for the initial phase of a solar proton event. J. Geophys. Res. 1964, 69, 2659–2667. [Google Scholar] [CrossRef]
  118. Zhang, M. A Markov Stochastic Process Theory of Cosmic-Ray Modulation. Astrophys. J. 1999, 513, 409. [Google Scholar] [CrossRef]
  119. Vainio, R.; Valtonen, E.; Heber, B.; Malandraki, O.E.; Papaioannou, A.; Klein, K.L.; Afanasiev, A.; Agueda, N.; Aurass, H.; Battarbee, M.; et al. The first SEPServer event catalogue 68-MeV solar proton events observed at 1 AU in 1996–2010. J. Space Weather Space Clim. 2013, 3, A12. [Google Scholar] [CrossRef] [Green Version]
  120. Kong, F.J.; Qin, G.; Wu, S.S.; Zhang, L.H.; Wang, H.N.; Chen, T.; Sun, P. Study of Time Evolution of the Bend-over Energy in the Energetic Particle Spectrum at a Parallel Shock. Astrophys. J. 2019, 877, 97. [Google Scholar] [CrossRef]
Figure 1. SEP intensities in energy channels of DE2: 53–103 keV, DE3: 103–175 keV, and DE4: 175–315 keV, for the 10 June 2000 SEP event. The solid and dashed lines indicate the energetic electron intensities observed by ACE and Ulysses, respectively. The vertical line indicates the start time of the flare.
Magnetochemistry 09 00096 g001
Figure 2. The map shows the footpoints of ACE and Ulysses, as well as the flare, on the solar surface. The black dotted line indicates the particle source boundary in the energy channel of DE2, and the dashed lines indicate the particle source boundaries in the energy channels of both DE3 and DE4, from the best fit parameters.
Magnetochemistry 09 00096 g002
Figure 3. ACE (solid lines) and Ulysses (dashed lines) electron intensities in the DE2–DE4 energy channels for the 26 December 2001 SEP event (similar as Figure 1).
Magnetochemistry 09 00096 g003
Figure 4. Illustration of the footpoints of ACE and Ulysses on the solar surface on 26 December 2001 relative to the flare (similar as in Figure 2).
Magnetochemistry 09 00096 g004
Figure 5. Comparisons of X-ray observed by GOES and the particle source profiles for the 10 June 200 simulation. The purple curve indicates the X-ray intensity for the flare. The dotted, dashed, and dash-dot curves are the intensity profiles of the particle sources used to simulate the DE2–DE4 energy channels, respectively. Vertical lines indicate the moments of the flare onset and maximum.
Magnetochemistry 09 00096 g005
Figure 6. Comparison of the observations of the DE2–DE4 energy channels electron intensities and the simulation results for the 10 June 2000 event. The left panel represents ACE and the right panel represents Ulysses. The solid and dashed lines indicate observations and simulations, respectively. Black, red, and blue lines indicate the energy channels of DE2, DE3, and DE4, respectively.
Magnetochemistry 09 00096 g006
Figure 7. The SEP time-intensity profiles of 10 June 2000. The black lines indicate observations as measured by the spacecraft, and the red, blue, and orange lines indicate simulations with the best fit parameters, half width of a source 10 smaller or larger than the best fit parameters, i.e., Δ θ 10 and Δ θ + 10 , respectively.
Magnetochemistry 09 00096 g007
Figure 8. Similar as Figure 7 except the simulation results without perpendicular diffusion with blue lines are added in addition.
Magnetochemistry 09 00096 g008
Figure 9. The particle source profiles in DE2–DE4 and associated SXR flare for the 26 Decemeber 2001 SEP event (similar as Figure 5).
Magnetochemistry 09 00096 g009
Figure 10. Electrons fluxes of the observations and simulations in DE2–DE4 during the 26 December 2001 SEP event.
Magnetochemistry 09 00096 g010
Figure 11. The simulation results with different half width of particle source in 26 December 2001 SEP event.
Magnetochemistry 09 00096 g011
Figure 12. Same as Figure 11, except that simulation results without perpendicular diffusion (blue lines) are added additionally.
Magnetochemistry 09 00096 g012
Figure 13. From top to bottom: the maximum value of the particle source intensity I max , the time interval from the onset time of the flare to the peak time of the particle source, Δ T 1 , and the half width of the particle source Δ θ , with different energy for the two SEP events. Solid circles connected by solid lines indicate the best fit parameters, and the dashed lines indicate the modelling results. Black and red indicate the SEP events of 10 June 2000 and 26 December 2001, respectively.
Magnetochemistry 09 00096 g013
Table 1. Observational parameters and their solar origin for the SEP events.
Event DateFlareSXR I SXR SXRSXRCMECME V ACE SW V Ulysses SW UlyssesUlysses
SiteClass(Watts m 2 )Onset  a Max  a Speed  b Width  c (km s 1 )(km s 1 )R (AU)Loc
10 June 2000N22W38M5.25.2 × 10 5 16:4017:021108Halo5054753.37S58E87
26 December 2001N08W54M7.17.1 × 10 5 04:3205:4014462123805752.54N67W39
a Time unit is UT; b CME speed unit is km s−1; c CME width unit is °.
Table 2. Peak intensities of ACE and Ulysses observations and their ratios in different energy channels.
Event DateChannelPeak ACE Peak Uly Ratio
(cm 2 sr s MeV) 1 (cm 2 sr s MeV) 1
DE21.21 × 10 5 3.37 × 10 2 3.59 × 10 2
10 June 2000DE33.00 × 10 4 1.17 × 10 2 2.56 × 10 2
DE45.92 × 10 3 3.37 × 10 1 1.76 × 10 2
DE22.44 × 10 5 4.50 × 10 3 5.42 × 10 1
26 December 2001DE39.88 × 10 4 1.50 × 10 3 6.63 × 10 1
DE42.71 × 10 4 4.00 × 10 2 7.60 × 10 1
Table 3. Best fit parameters for the simulations.
Event Date δ B B 0 Channel τ c τ L Δ θ J max Δ T 1
(day)(day)( )(cm 2 sr s MeV) 1 (min)
DE20.0020.05603.92 × 10 7 6.32
10 June 20000.353DE30.0020.05531.61 × 10 7 10.64
DE40.0020.05533.47 × 10 6 14.96
DE20.020.05551.45 × 10 8 20.08
26 December 20010.533DE30.020.05406.22 × 10 7 33.04
DE40.020.05331.81 × 10 7 40.24
Table 4. Diffusion coefficients calculated from the models with the best fit parameter of the turbulence level δ B B 0 .
Event Date δ B B 0 Channel λ (au) κ κ
DE20.2200.023
10 June 20000.353DE30.2450.021
DE40.2730.020
DE20.0970.069
26 December 20010.533DE30.1080.064
DE40.1200.060
For electrons in the ecliptic at 1 AU.
Disclaimer/Publisher’s Note: The statements, opinions and data contained in all publications are solely those of the individual author(s) and contributor(s) and not of MDPI and/or the editor(s). MDPI and/or the editor(s) disclaim responsibility for any injury to people or property resulting from any ideas, methods, instructions or products referred to in the content.

