Article

Synthesis and Characterization of Hematite, Magnetite and Maghemite Supported on Silica Gel

1
Department of Chemistry, Lomonosov Moscow State University, 1-3 Leninskie Gory, Moscow 119991, Russia
2
Zelinsky Institute of Organic Chemistry, Russian Academy of Sciences, Moscow 170100, Russia
3
Topchiev Institute of Petrochemical Synthesis, Russian Academy of Sciences, Moscow 119071, Russia
4
Faculty of Physics, Lomonosov Moscow State University, 1-2 Leninskie Gory, Moscow 119991, Russia
*
Author to whom correspondence should be addressed.
Magnetochemistry 2023, 9(11), 228; https://doi.org/10.3390/magnetochemistry9110228
Submission received: 20 June 2023 / Revised: 21 August 2023 / Accepted: 8 November 2023 / Published: 15 November 2023

Abstract

:
A new method for obtaining nanosized particles of iron oxides using porous silica gel is proposed. In situ magnetometry was used to study the reduction of hematite deposited on silica gel during the thermolysis of glucose. The formed magnetite and maghemite obtained by subsequent oxidation of the magnetite were studied using X-ray diffraction and Mossbauer spectroscopy. It was shown that both the size of the oxide particles and the phase composition significantly depended on the porous structure of the silica gel. In particular, the formation of superparamagnetic maghemite particles on silica gels with pore sizes of 30, 15 and 10 nm was demonstrated.

1. Introduction

Materials containing nanosized particles of iron oxides are widely used in various fields, from catalysis to medicine [1,2,3,4]. First of all, nanosized particles of iron-containing substances are of interest for fundamental scientific research due to the differences in the physical properties of bulk and nanosized materials [5,6]. For example, synthetic nanosized magnetite has been proposed as a potential reactant for the purification of polluted groundwater and as an effective sorbent of metalloid pollutants due to its high surface area [7,8].
The targeted synthesis of preparations containing pure single-phase nanosized particles of iron with a monodisperse size distribution encounters significant difficulties due to the diversity of iron chemistry, which manifests itself in the stability of two oxidation states and rich crystal chemistry. All this causes problems with the coexistence of oxides of different compositions in one preparation, for example, such as magnetite (Fe3O4), maghemite (γ-Fe2O3), hematite (α-Fe2O3) and wustite (FeO) [9,10]. This problem is exacerbated by the tendency of nanosized iron oxide particles to aggregate into large agglomerates. This is especially important when working with magnetic particles such as Fe3O4 and γ-Fe2O3 [11]. To prevent particle aggregation, synthesis methods are used in carrier matrices, in particular, on silica gel. Silica was shown to be the best support in terms of both activity and selectivity in various catalytic reactions and, in particular, in Fisher–Tropsch synthesis [12,13,14,15,16].
Most often, to obtain such nanosized iron-containing preparations in a silica gel matrix, the sol–gel synthesis technique is used [9]. However, as a rule, as a result of using the sol–gel method, the synthesized nanoparticles of iron oxides are encapsulated in the bulk of the silica gel. In this case, the surfaces of the iron oxide nanoparticles are inevitably covered with silica shells and have limited access to the adsorbate. Such composites are not effective for catalysis due to the limited number of active sites accessible to reagents on the surface. In addition, it is necessary to take into account the possibility of the interaction of iron oxides with the silica gel material, especially at low iron concentrations [5].
Nanoparticles of iron oxides on silica gel can be prepared by impregnating the carrier with a solution of iron nitrate followed by thermolysis of the nitrate. This method is often used to prepare iron-supported catalysts [1,7]. Sonochemical synthesis of silica-supported iron oxide nanostructures was used by the authors of one work [17]. Preparation of magnetite on silica is a more difficult task, since the direct reduction of supported hematite inevitably leads to a mixture of oxides: Fe2O3, Fe3O4, FeO. To reduce hematite, it is possible to use hydrocarbons, as well as various carbohydrates. In this case, it is possible to channel the reaction towards the exclusive formation of magnetite [18]. The synthesis of ultrafine particles of magnetite using polysaccharides as a reducing agent was proposed in [19]. Silica-supported maghemite was prepared through the pyrolysis of a ternary composite of poly (vinyl alcohol) (PVA), iron (III) hydroxide and silica gel, and was characterized using X-ray diffraction and infrared spectroscopic and BET surface area measurements [20,21]. The synthesis of γ-Fe2O3 particles and the investigation of their properties are of fundamental importance for the development of science and technology. The preparation of pure γ-Fe2O3 nanophase presents some difficulties arising from the different metal oxidation states, which can lead to the presence of various oxides. The method of controlled oxidation of magnetite is usually used to obtain magnetite [11].
The aim of the present study is to demonstrate a technique for the selective synthesis of magnetite nanoparticles by means of the reduction of hematite supported on silica gel with pores of various sizes using glucose pyrolysis products, which makes it possible to synthesize nanosized maghemite particles of various specified sizes. The physicochemical properties of all of the synthesized composites were confirmed using Mossbauer spectroscopy, X-ray phase analysis and magnetic methods. Since the composites synthesized according to the method proposed in this work are supposed to be used as catalysts in the future, we refer to them as catalysts in what follows.

2. Materials and Methods

2.1. Materials

Iron (III) nitrate nonahydrate (Sigma-Aldrich, St Louis, MO, USA) (Fe(NO3)3·9H2O) was used as a precursor. CARIACT silica gel with grades of Q-30, Q-15 and Q-10 (Q-X, where X = 30, 15, 10 nm as the average pore size in silica gel, with surface areas of 100, 200 and 300 m2/g, respectively) manufactured by Fuji Silysia Chemical, Ltd. (Nagoya, Japan) was used as a support. The nominal content of iron was 20 mass% for Q-30 and 15 mass% for Q-15 and Q-10.
Catalysts were prepared via incipient wetness impregnation of the support with aqueous solutions of hydrous iron nitrate. After impregnation, the catalysts were dried in a rotary evaporator at 80 °C for 2 h. Then, they were calcined in air at 450 °C for 4 h with temperature ramping of 10 °C/min. These samples were denoted as Fe2O3/Q-30, Fe2O3/Q-15 and Fe2O3/Q-10.
Obtained Fe2O3/Q samples (calcined at 450 °C) were additionally impregnated with an aqueous glucose solution at room temperature and dried in a rotary evaporator at 80 °C. The iron/glucose molar ratio was 10/1.
These samples were denoted as G/Fe2O3/Q-30, G/Fe2O3/Q-15 and G/Fe2O3/Q-10.
Subsequently, some of the catalysts were studied using the in situ magnetic method, and some were subjected to calcination in an argon current at a heating rate of 10 °C/min to a temperature of 450 °C for 4 h. The catalysts obtained from calcination in argon were designated as Fe3O4/Q-30, Fe3O4/Q-15 and Fe3O4/Q-10. Some of the catalysts obtained in this way were subjected to oxidation in an air current at 450 °C. The resulting oxidation catalysts were designated as γ-Fe2O3/Q-30, γ-Fe2O3/Q-15 and γ-Fe2O3/Q-10. A block diagram of the sequence of operations in the synthesis of catalysts is presented below.
Fe(NO3)3·9H2O + SiO2 → (80 °C)
→ Fe(NO3)3/SiO2 → (450 °C air)
α−Fe2O3/SiO2 → (C6H12O6 80 °C)
→ G/α−Fe2O3/SiO2 → (450 °C Ar)
Fe3O4/SiO2 → (450 °C air) →
γ−Fe2O3/SiO2

2.2. X-ray Diffraction Study

The X-ray diffraction experiment was performed on a PANalytical Empyrean diffractometer. The immobile sample, in the form of a powder layer of 1 mm thick and about 20 mm in diameter on a non-reflective holder, was placed in the center of the vertical plane of the goniometer. The experiment was carried out in “Θ–Θ” geometry with synchronous movement of the PIXcel-3D detector and the ceramic X-ray tube along the goniometric circle. Diffraction patterns were measured on Cu Kα radiation in the scanning range for angle 2Θ of 5–100 degrees.
Mathematical processing of diffraction patterns, quantitative phase analysis of the samples (according to the Chung method) and particle size estimations using the Scherer method were carried out using the HighScore Plus program (version 4.9) and the JSCD file cabinet.

2.3. Mossbauer Spectroscopy

Mossbauer absorption spectra were obtained on an MS1104EM Express Mossbauer spectrometer (Cordon GmbH, Rostov-on-Don, Russia) in the constant acceleration mode with the triangular velocity reference signal. The 57Co nuclei in a metal rhodium matrix (RITVERC GmbH, St. Petersburg, Russia) with 50 mCi activity were used as the γ-radiation source. The spectra were obtained at room temperature (23 ± 3 °C). Mathematical processing was carried out for spectra using UNIVEM (Rostov-on-Don State University, Russia) software with a high resolution (1024 points). Experimental data were fitted using a superposition of symmetrical doublets and sextets with fixed line widths and intensity ratios. The chemical shifts were determined relative to α-Fe.

2.4. Magnetic Studies

Magnetic studies of the samples were carried out on a vibration magnetometer using the in situ regime. The test sample (10 mg) was placed in a measuring cell of the vibrating magnetometer [22], which is a flow-through microreactor with an internal volume of 0.3 cm3. The test sample was clamped between two membranes of porous quartz. In a nonisothermal experiment, the sample was heated (10 °C/min) to a predetermined temperature in the Ar or air at a magnetic field strength of 3 kOe with a flow rate of 10 cm3/min, while a change in magnetization was recorded continuously at a frequency of 1 Hz.

3. Results

Catalysts Fe2O3/Q-30, Fe2O3/Q-15 and Fe2O3/Q-10 did not reveal any changes in magnetization in an argon current up to the temperature of T = 600 °C. However, the exposure of catalysts G/Fe2O3/Q-30, G/Fe2O3/Q-15 and G/Fe2O3/Q-10 under identical conditions showed an increase in magnetization starting from 270 °C. Figure 1 shows the dependence of magnetization on temperature for the catalysts during heating in argon. The growth of magnetization is due to pyrolysis of glucose. During pyrolysis, the emitted CO reduces hematite particles to magnetite through the following reaction:
3Fe2O3 + CO = 2Fe3O4 + CO2
At temperatures above 500 °C, glucose is completely transformed into a mixture of CO, CO2 and H2O.
The drop in magnetization to zero at T = 570–580 °C corresponds to the Curie temperature of magnetite. After cooling, the dependences of magnetization on the field were measured, and the results are shown in Figure 2.
Note the absence of remanent magnetization and coercive force in the case of catalysts Fe3O4/Q-15 and Fe3O4/Q-10. This indicates the presence of superparamagnetism in these catalysts at room T. The presence of superparamagnetic particles allowed us to estimate the size of the particles using the Langevin equation. In this way, it was possible to estimate the upper and lower limits of Fe3O4 particle size, d, using the low-field (dLF) and high-field field (dHF) approximations of the Langevin function [23], as follows:
d L F 3 = 18 k π I s σ σ s / H T m
d H F 3 = 6 k π I s 1 σ σ s 1 / H T m
where k is the Boltzmann constant and Is is the spontaneous magnetization per unit volume for the bulk Fe3O4 saturation magnetization of the test sample at 93 K.
The saturation magnetization (Is) was estimated by plotting emu/g versus l/H and extrapolating to zero, as shown in Figure 3.
The saturation magnetization of bulk magnetite (Is) was assumed to be 70 emu/g [24,25,26,27]. Table 1 shows the values of max. and min. particle size that were calculated using equations 1 and 2, as well as the average size of catalysts Fe3O4/Q-15 and Fe3O4/Q-10.
After oxidation in air at 450 °C, catalysts Fe3O4/Q-30, Fe3O4/Q-15 and Fe3O4/Q-10 acquired a red-orange color and remained magnetized at room temperature. We assume that magnetite oxidation results in the formation of maghemite.
If the system contains no multidomain particles, the particle size distribution can be analyzed using the following equation [23]:
γ = 1 − 2Jr/Js
where γ is the proportion of superparamagnetic particles and Jr is the saturation remanent magnetization.
According to the XRD data (given below), the maghemite particles in the catalysts were smaller than the single-domain size of 40 nm [25].
More detailed information about the composition of the systems under study was provided with X-ray phase analysis. The results of the X-ray phase analysis for all of the investigated objects are given below.
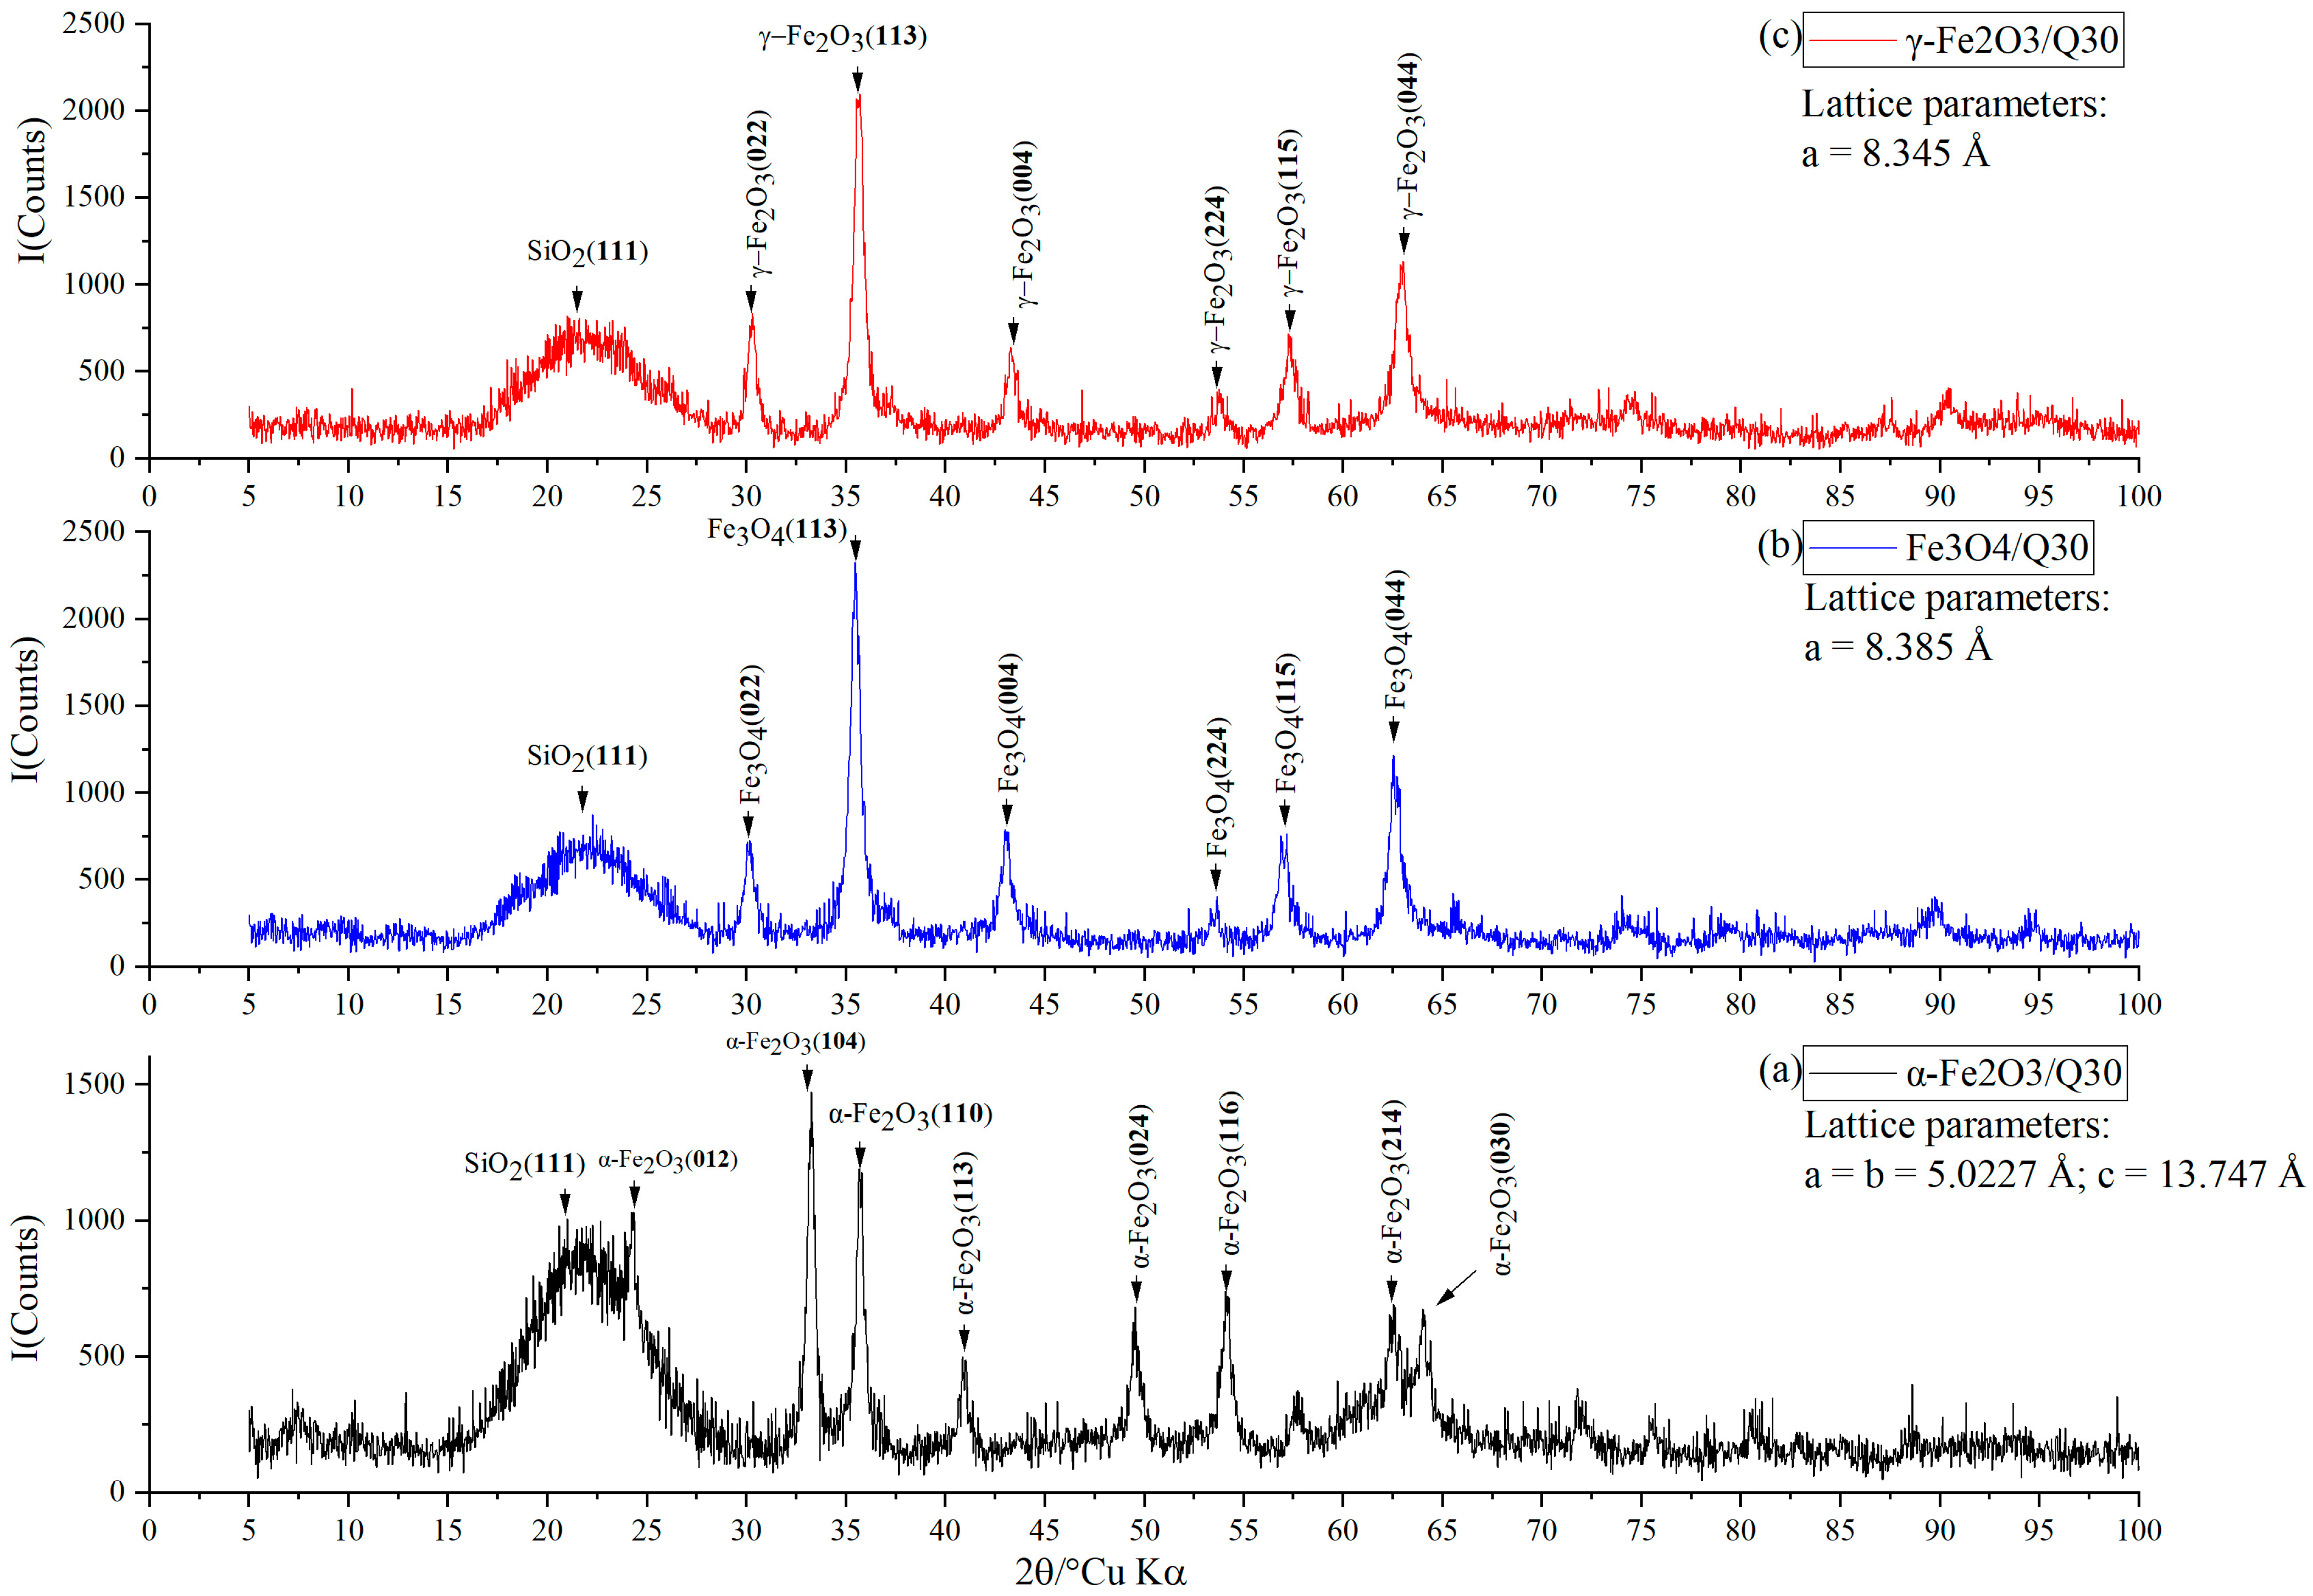
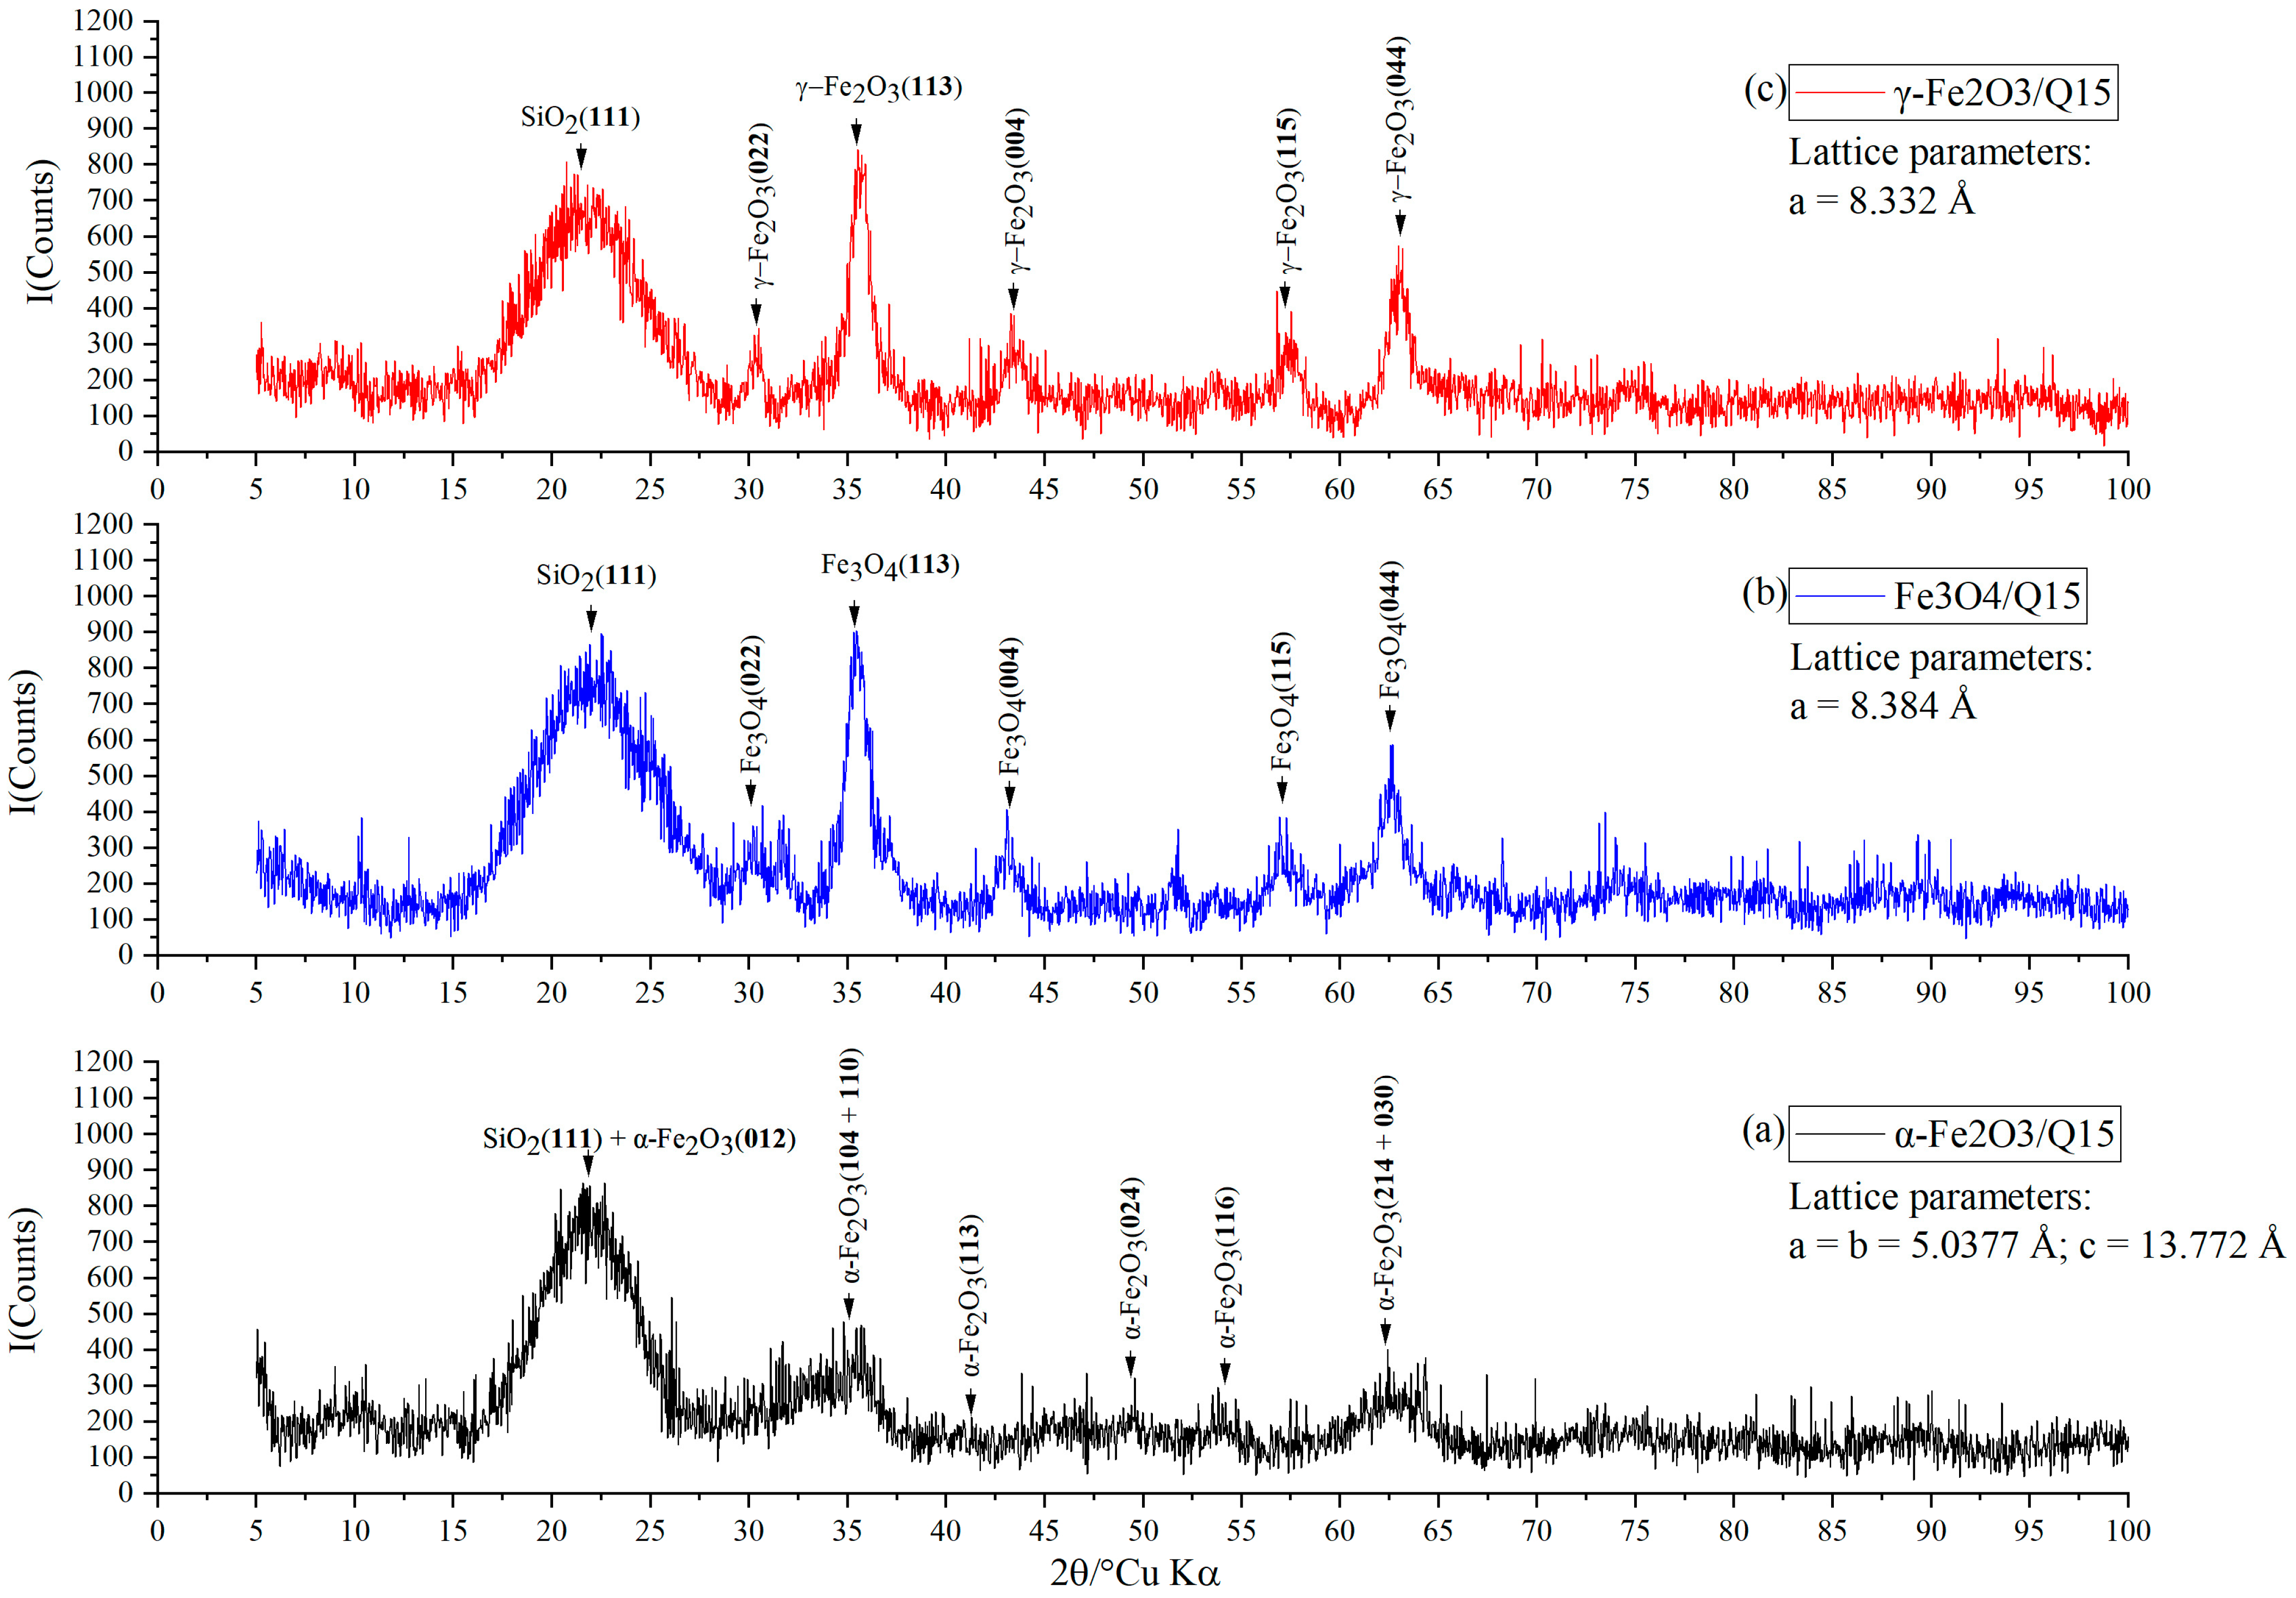
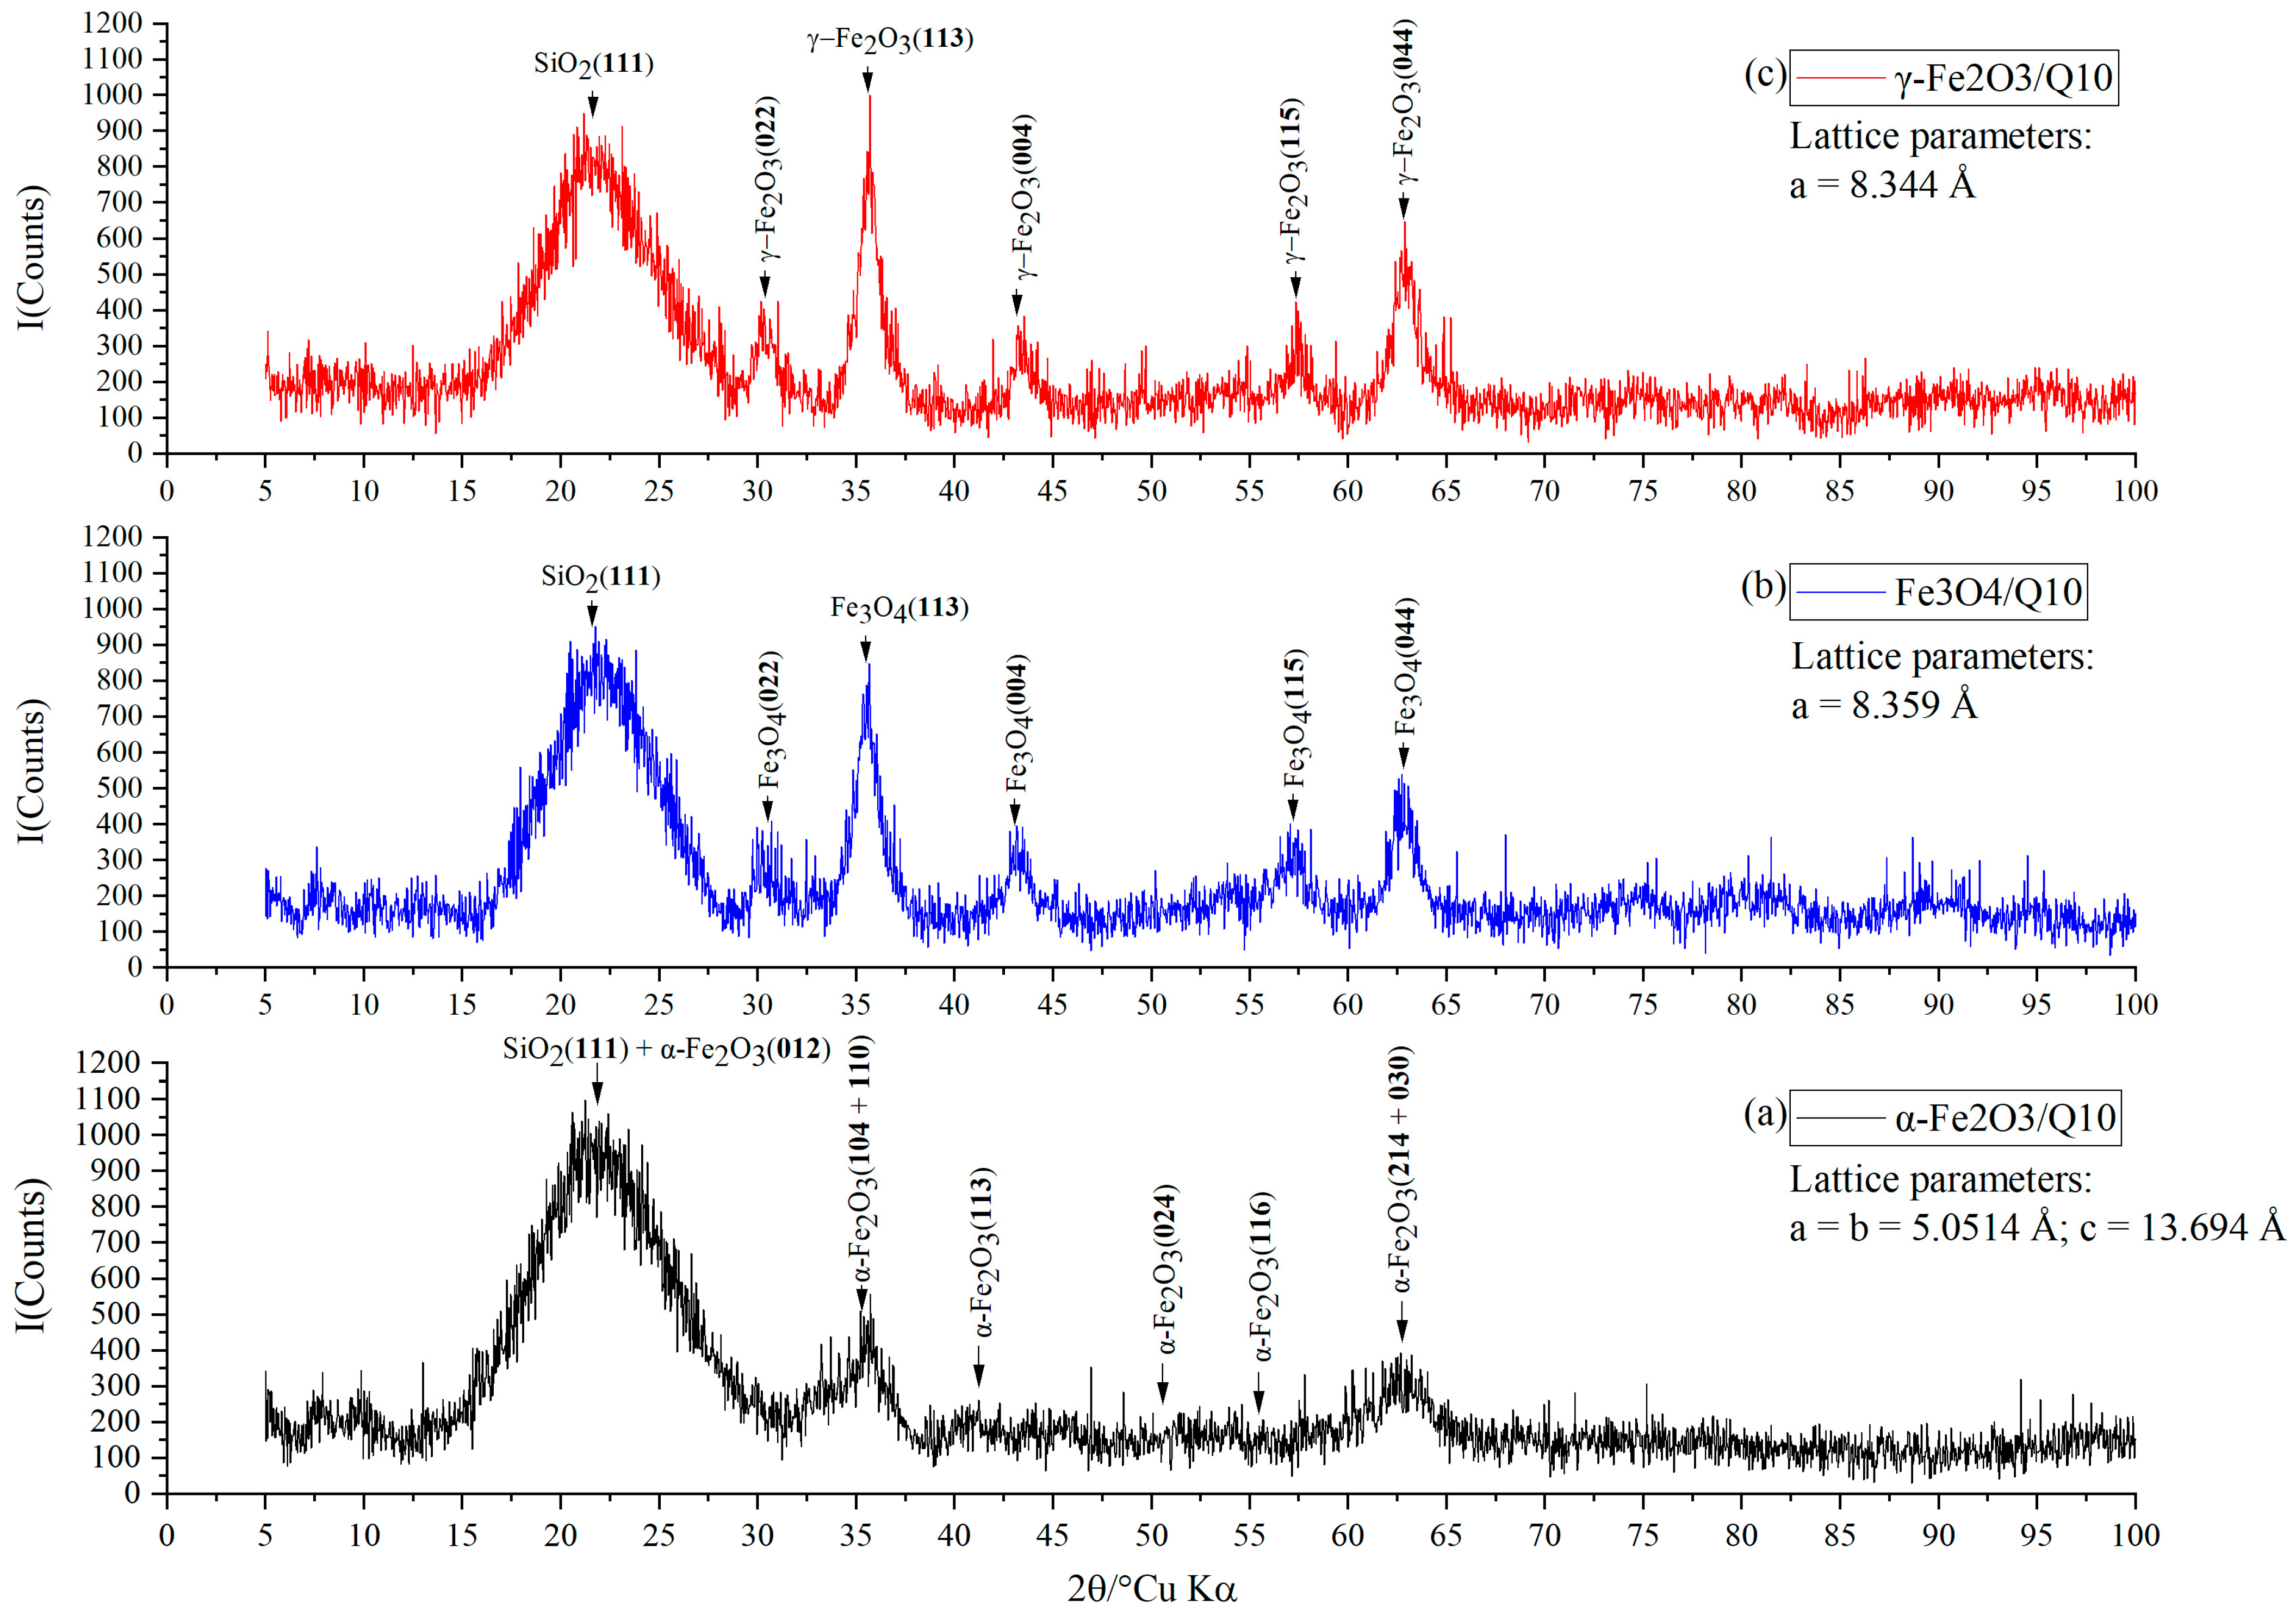
The X-ray diffraction patterns of all the samples at the first stage of synthesis (Figure 4, Figure 5 and Figure 6) were a superposition of reflections from two phases: a single, very wide and intense reflex of SiO2 gel (111) and a system of lines of nanosized α-Fe2O3 phase.
On the diffraction patterns obtained, at the stages of transition from hematite to magnetite and, further, to maghemite, the intensity of the reflections of the forming Fe3O4 and γ-Fe2O3 phases increased, and the reflections themselves became narrower in comparison with the reflections of γ-Fe2O3. This indicates an increase in the size of the obtained Fe3O4 and γ-Fe2O3 nanoparticles within the pore size throughout synthesis.
The mean particle sizes in the silica gel pores that were determined using the Scherrer method are given in Table 2. The average particle sizes given in the table agree well with the size estimates obtained from magnetic measurements. The exception is catalyst γ-Fe2O3/Q-30, because the particle size exceeded single-domain range and could not be determined using the magnetic method.
The phase transformations of nanoparticles occurring at all the stages of synthesis were investigated in more detail using Mossbauer spectroscopy.
To estimate the sizes of the obtained nanoparticles, spectra were measured at room temperature. Mathematical analysis of Mossbauer spectra of the samples obtained at all stages of synthesis allowed us to give a qualitative picture of the phase transformations taking place, to estimate the sizes of the obtained nanoparticles of iron oxides and to determine their quantitative characteristics. Particle size distributions for all investigated samples were also obtained from the mathematical processing of experimental Mossbauer spectra.
All the calculated parameters of the Mossbauer spectra are given in Table 3.
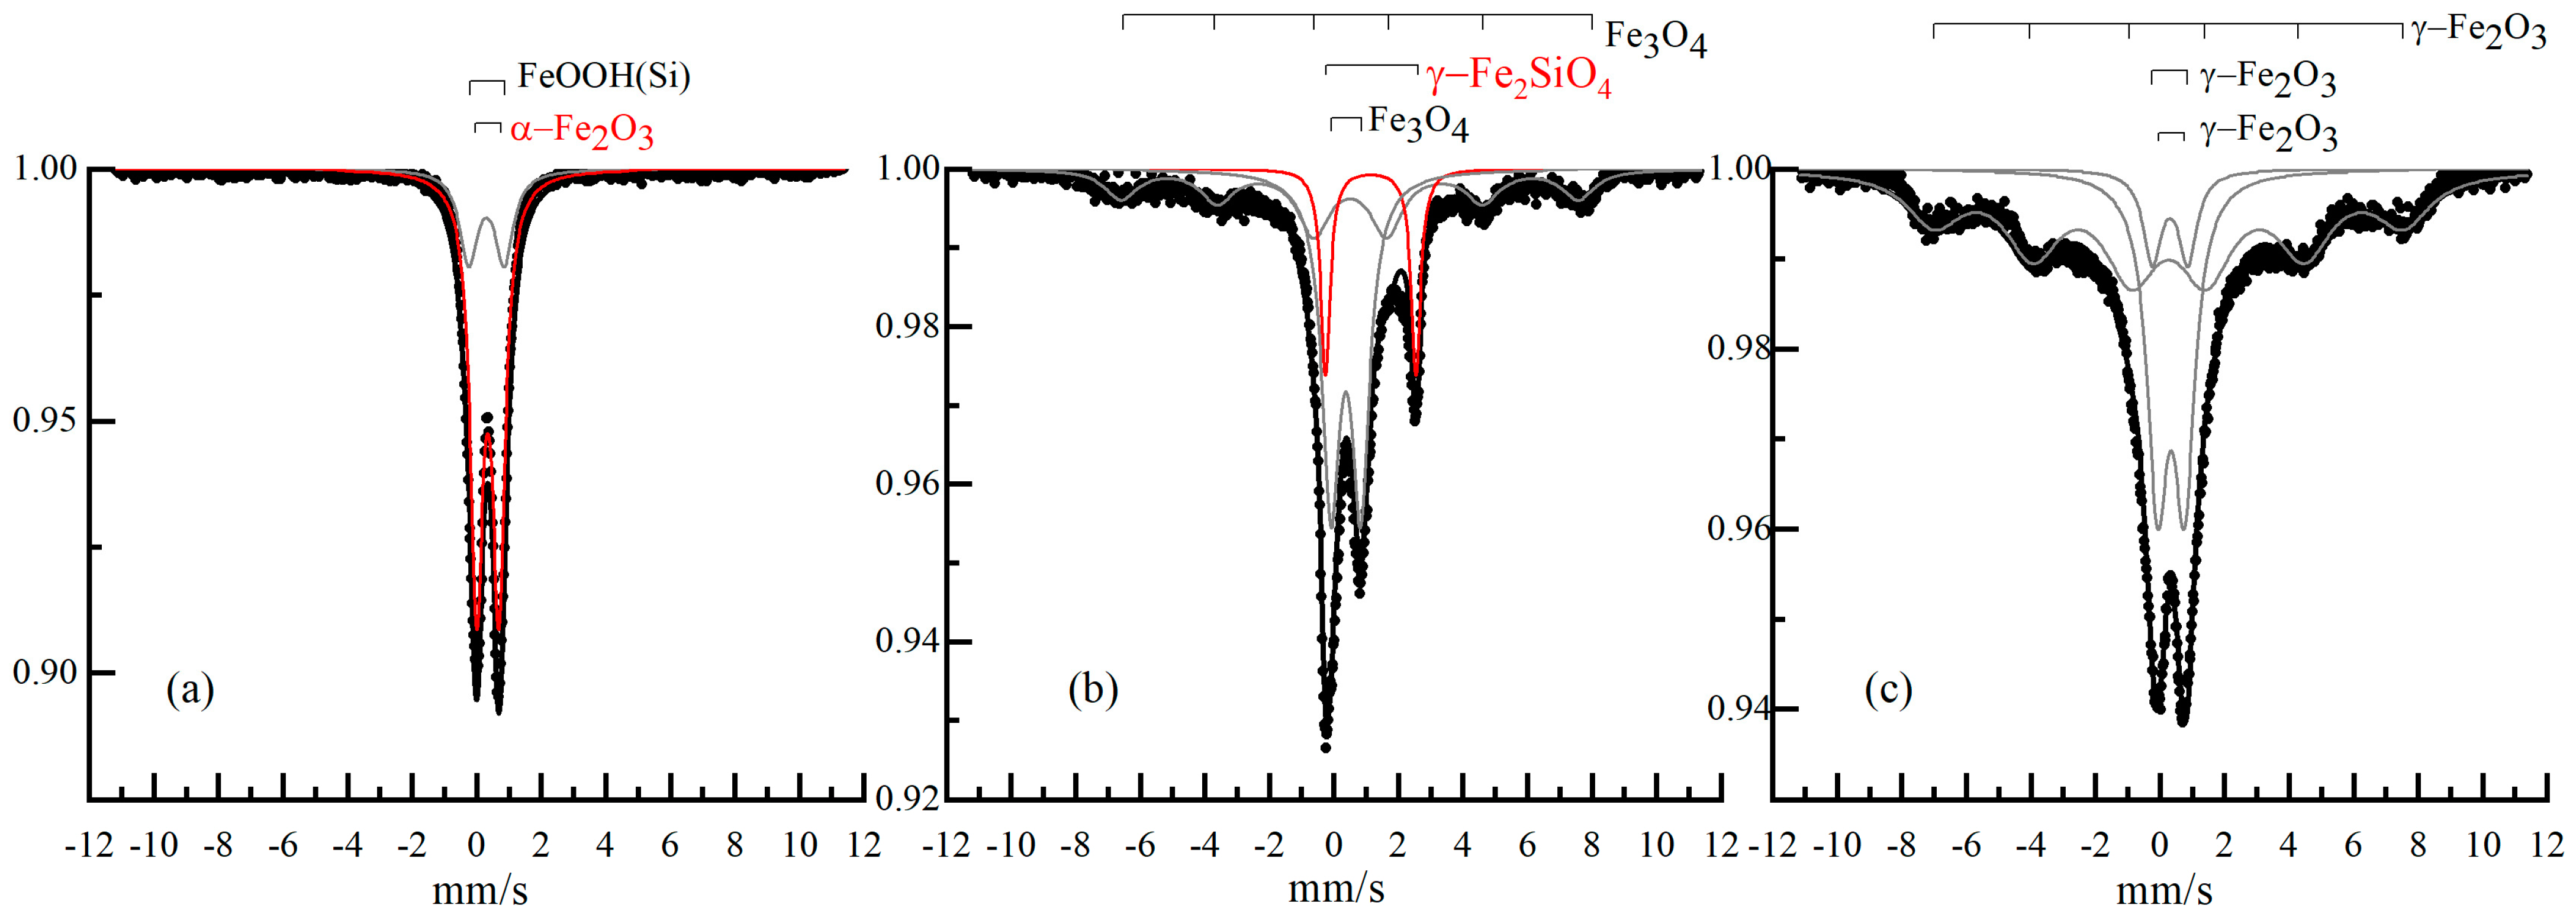
The Mossbauer spectrum of the α-Fe2O3/Q10 sample that was obtained at room temperature was a broadened paramagnetic doublet, characteristic of superparamagnetic compounds (Figure 7a).
Mathematical decomposition of the spectrum in Figure 7a revealed that it consisted of two components: a doublet of superparamagnetic α-Fe2O3 with particle sizes smaller than 10 nm [28,29] and a doublet of superparamagnetic α-FeOOH with particle sizes smaller than 5 nm [29]. To more precisely define both compounds’ particle sizes, we measured the α-Fe2O3/Q10 sample at 77.5 K. The α-FeOOH component of the spectrum was still a superparamagnetic doublet at this temperature, which indicates the very small sizes of its nanoparticles (2–3 nm). The α-Fe2O3 component showed hyperfine magnetic splitting, corresponding to nanoparticles of 5–6 nm.
α-Fe2O3 nanoparticles of 5 nm and less in size have a number of atoms on the surface comparable to their number in volume. The reactivity of the surface atoms is thus so high that the atoms of the Fe-O chain at the particle surface interact with the OH-Si groups at the SiO2-gel surface. As a result, nanolayers of goethite doped with silicon are formed on the surface of iron oxide nanoparticles, forming α-FeOOH(Si). The intensities of the α-FeOOH(Si) and α-Fe2O3 subspectra were 52 and 48%, respectively, which is consistent with the comparable number of atoms on the surface and in the volume of nanoparticles of ~5 nm and less.
At the second stage of the synthesis of Fe3O4/Q-10 nanosized particles, according to the X-ray data, the average particle size increased to 7 nm. In the Mossbauer spectrum in Figure 7b, this increase was manifested in the appearance of the Fe3O4 component with a hyperfine magnetic field of the relaxation type (H = 400 kOe). The superparamagnetic doublet of the Fe3O4 oxide formed the largest part of the spectrum (55%). In addition, the superparamagnetic component attributed to γ-Fe2O3 (15%) appeared. Apparently, it was due to the transformation of part of the α-FeOOH(Si) nanoparticles into γ-Fe2O3, which occurs during thermolysis of glucose at temperatures above 400 °C [30]. The peak on the thermomagnetic curve of the G/Fe2O3/Q-10 sample at 520 °C (Figure 1), as well as the Curie temperature shift beyond 600 °C, was due to this transformation. At the third stage of the synthesis of γ-Fe2O3/Q-10 nanoparticles, the average size of the formed γ-Fe2O3 nanosized particles further increased to 8 nm (Table 2). Analysis of the Mossbauer spectrum parameters showed that only γ-Fe2O3 nanoparticles with a narrow size distribution of 6–9 nm were formed in SiO2/Q-10 pores (Figure 8c).
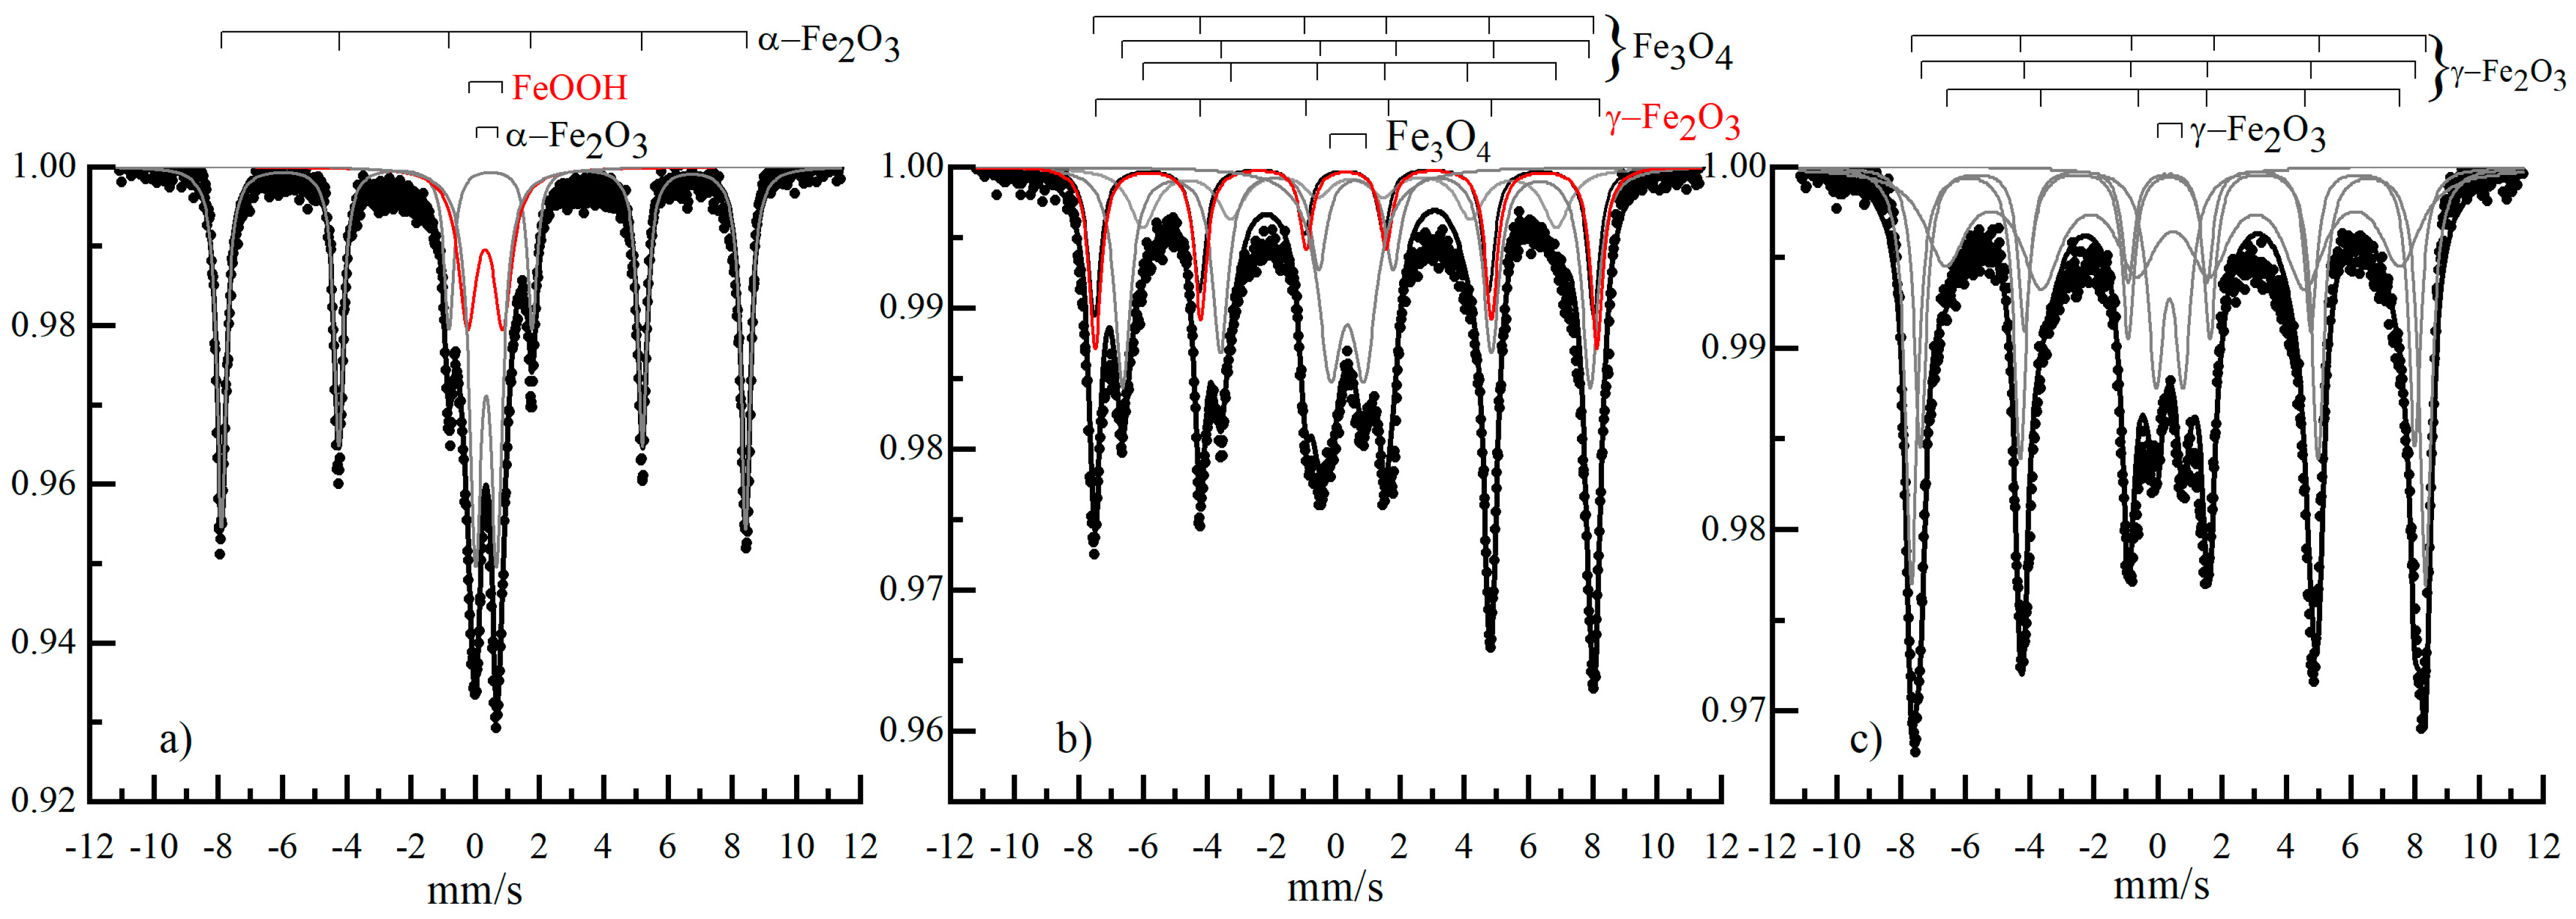
In the SiO2/Q-15 pores at all stages of γ-Fe2O3/Q15 synthesis, the nanoparticle sizes remained smaller than the pore size (Table 2). The sample formed at the first stage contained 76% α-Fe2O3 with particles of ~11 nm in size and 24% α-FeOOH(Si) with particles of ~2 nm in size. The Mossbauer spectra of catalysts α-Fe2O3/Q15 (a), Fe3O4/Q-15 (b) and γ-Fe2O3/Q-15 (c) are shown in Figure 9.
There were some features of phase transformations in the process of synthesis, however. The amount of α-FeOOH phase formed at the first stage of synthesis was two times less than in the case of α-Fe2O3/Q10 due to an increase in the average particle size to 7 nm and a reduction in the pore curvature. At the second stage, Fe3O4 particles were formed with most-probable sizes of around 8 and 14 nm. The contributions of these phases were 51 and 33%, respectively. Larger magnetite particles appeared in the spectrum as a relaxation-type component with a hyperfine magnetic field (H = 440 kOe). In addition, the second stage of Fe3O4/Q15 synthesis produced γ-Fe2SiO4 nanoparticles [31]. At the third stage of synthesis, only γ-Fe2O3 nanoparticles with a size distribution of 8–14 nm were formed in the Q-15 pores (Figure 10c). The main part was γ-Fe2O3 particles with a size of ~14 nm, and their share was 59%. The proportions of particles with sizes of ~11 nm and ~8 nm were 33 and 8%, respectively. We can see that for γ-Fe2O3/Q-15, the relative abundance of particles increased in direct proportion to their most probable size.
A large number of antiferromagnetic α-Fe2O3 nanosized particles were initially formed in the SiO2/Q-30 pores (Figure 11a), whose sizes approached the size of the single-domain state (the effective magnetic field parameter in the Mossbauer spectrum was 507 kOe). In addition, a number of smaller α-Fe2O3 nanoparticles were formed. About 20% of the spectrum was α-FeOOH(Si) phase, which was 2–3 nm in size. It should be noted that the Mossbauer parameters of the α–FeOOH(Si) phase formed at the first stage of synthesis were identical for all pore sizes. This is proof of the formation of an identical thin shell around the α-Fe2O3 particles in all the pores. It was this phase that was transformed into γ-Fe2O3 at the second stage of synthesis (Figure 11b and Figure 12b). All α-Fe2O3 nanoparticles turned into Fe3O4. At the third stage of synthesis (Figure 11c), all the nanoparticles were transformed into γ-Fe2O3 with a broad nanoparticle size distribution of 9–29 nm (Figure 12c).
The average sizes of the nanoparticles of the obtained catalysts, estimated from the size distributions of the nanoparticles (Figure 12), were d = 7 nm for catalyst γ-Fe2O3/Q-10, d = 11 nm for γ-Fe2O3/Q-15, d = 25 nm for γ-Fe2O3/Q-30.
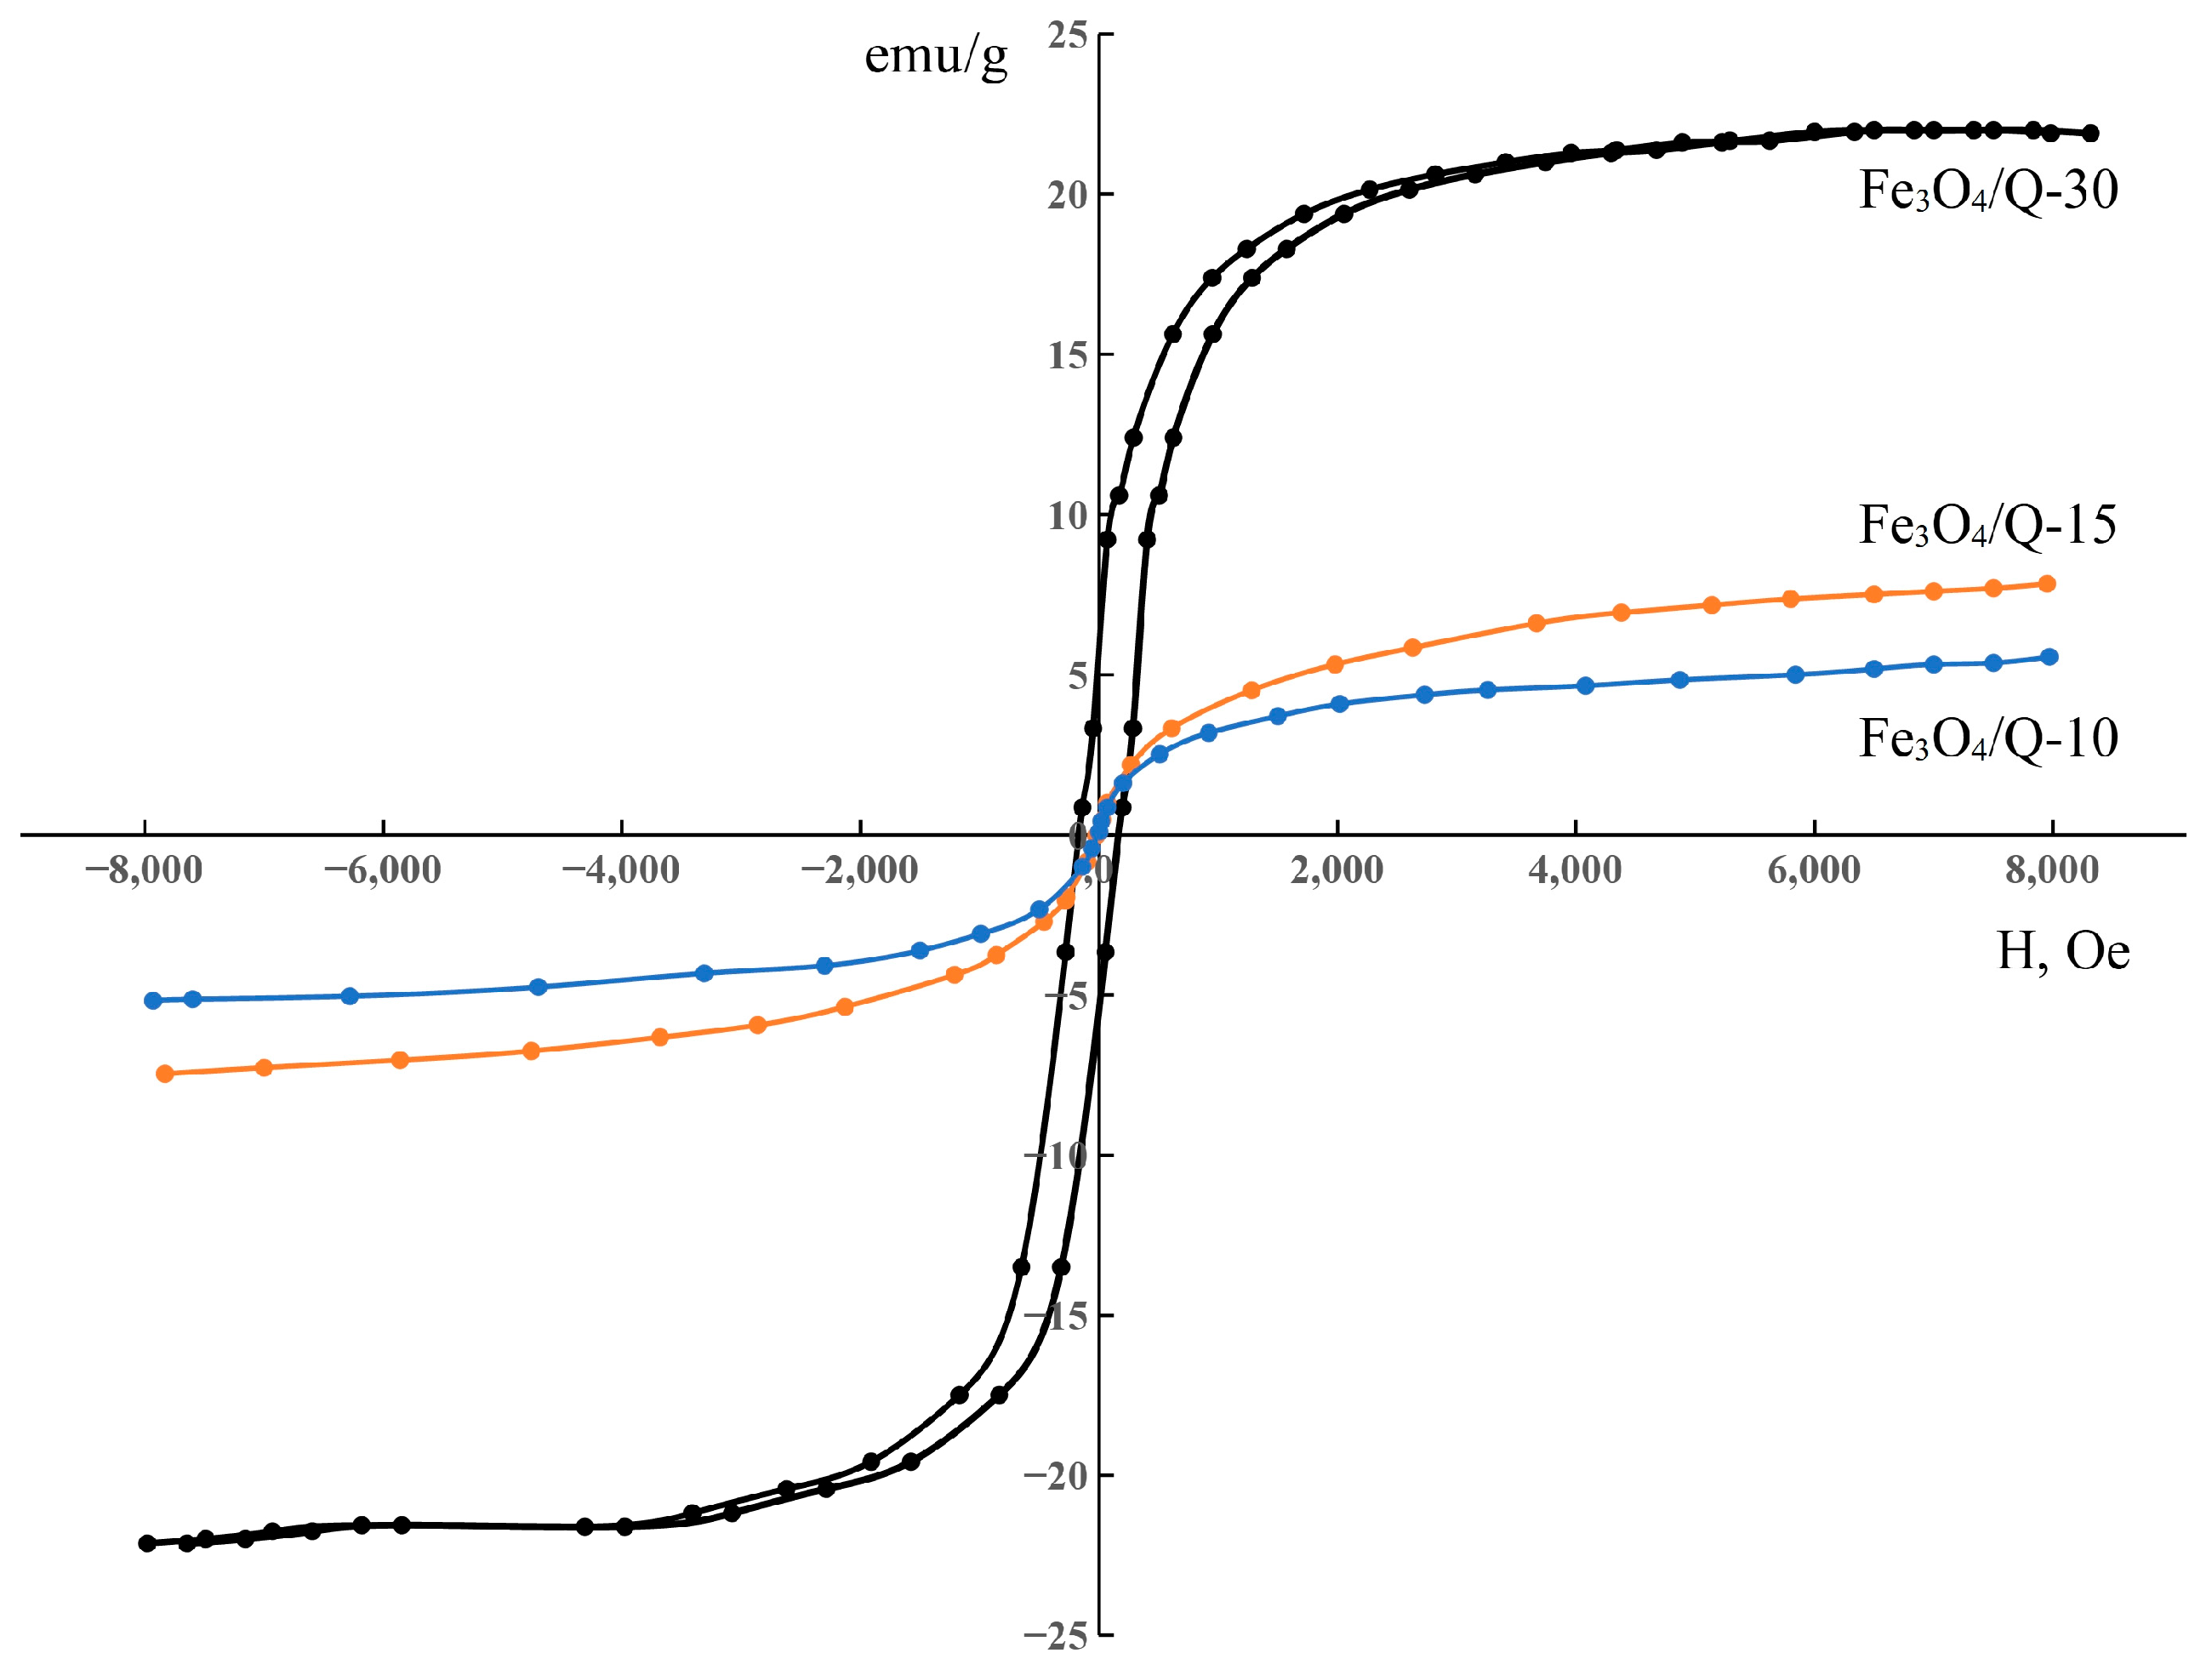
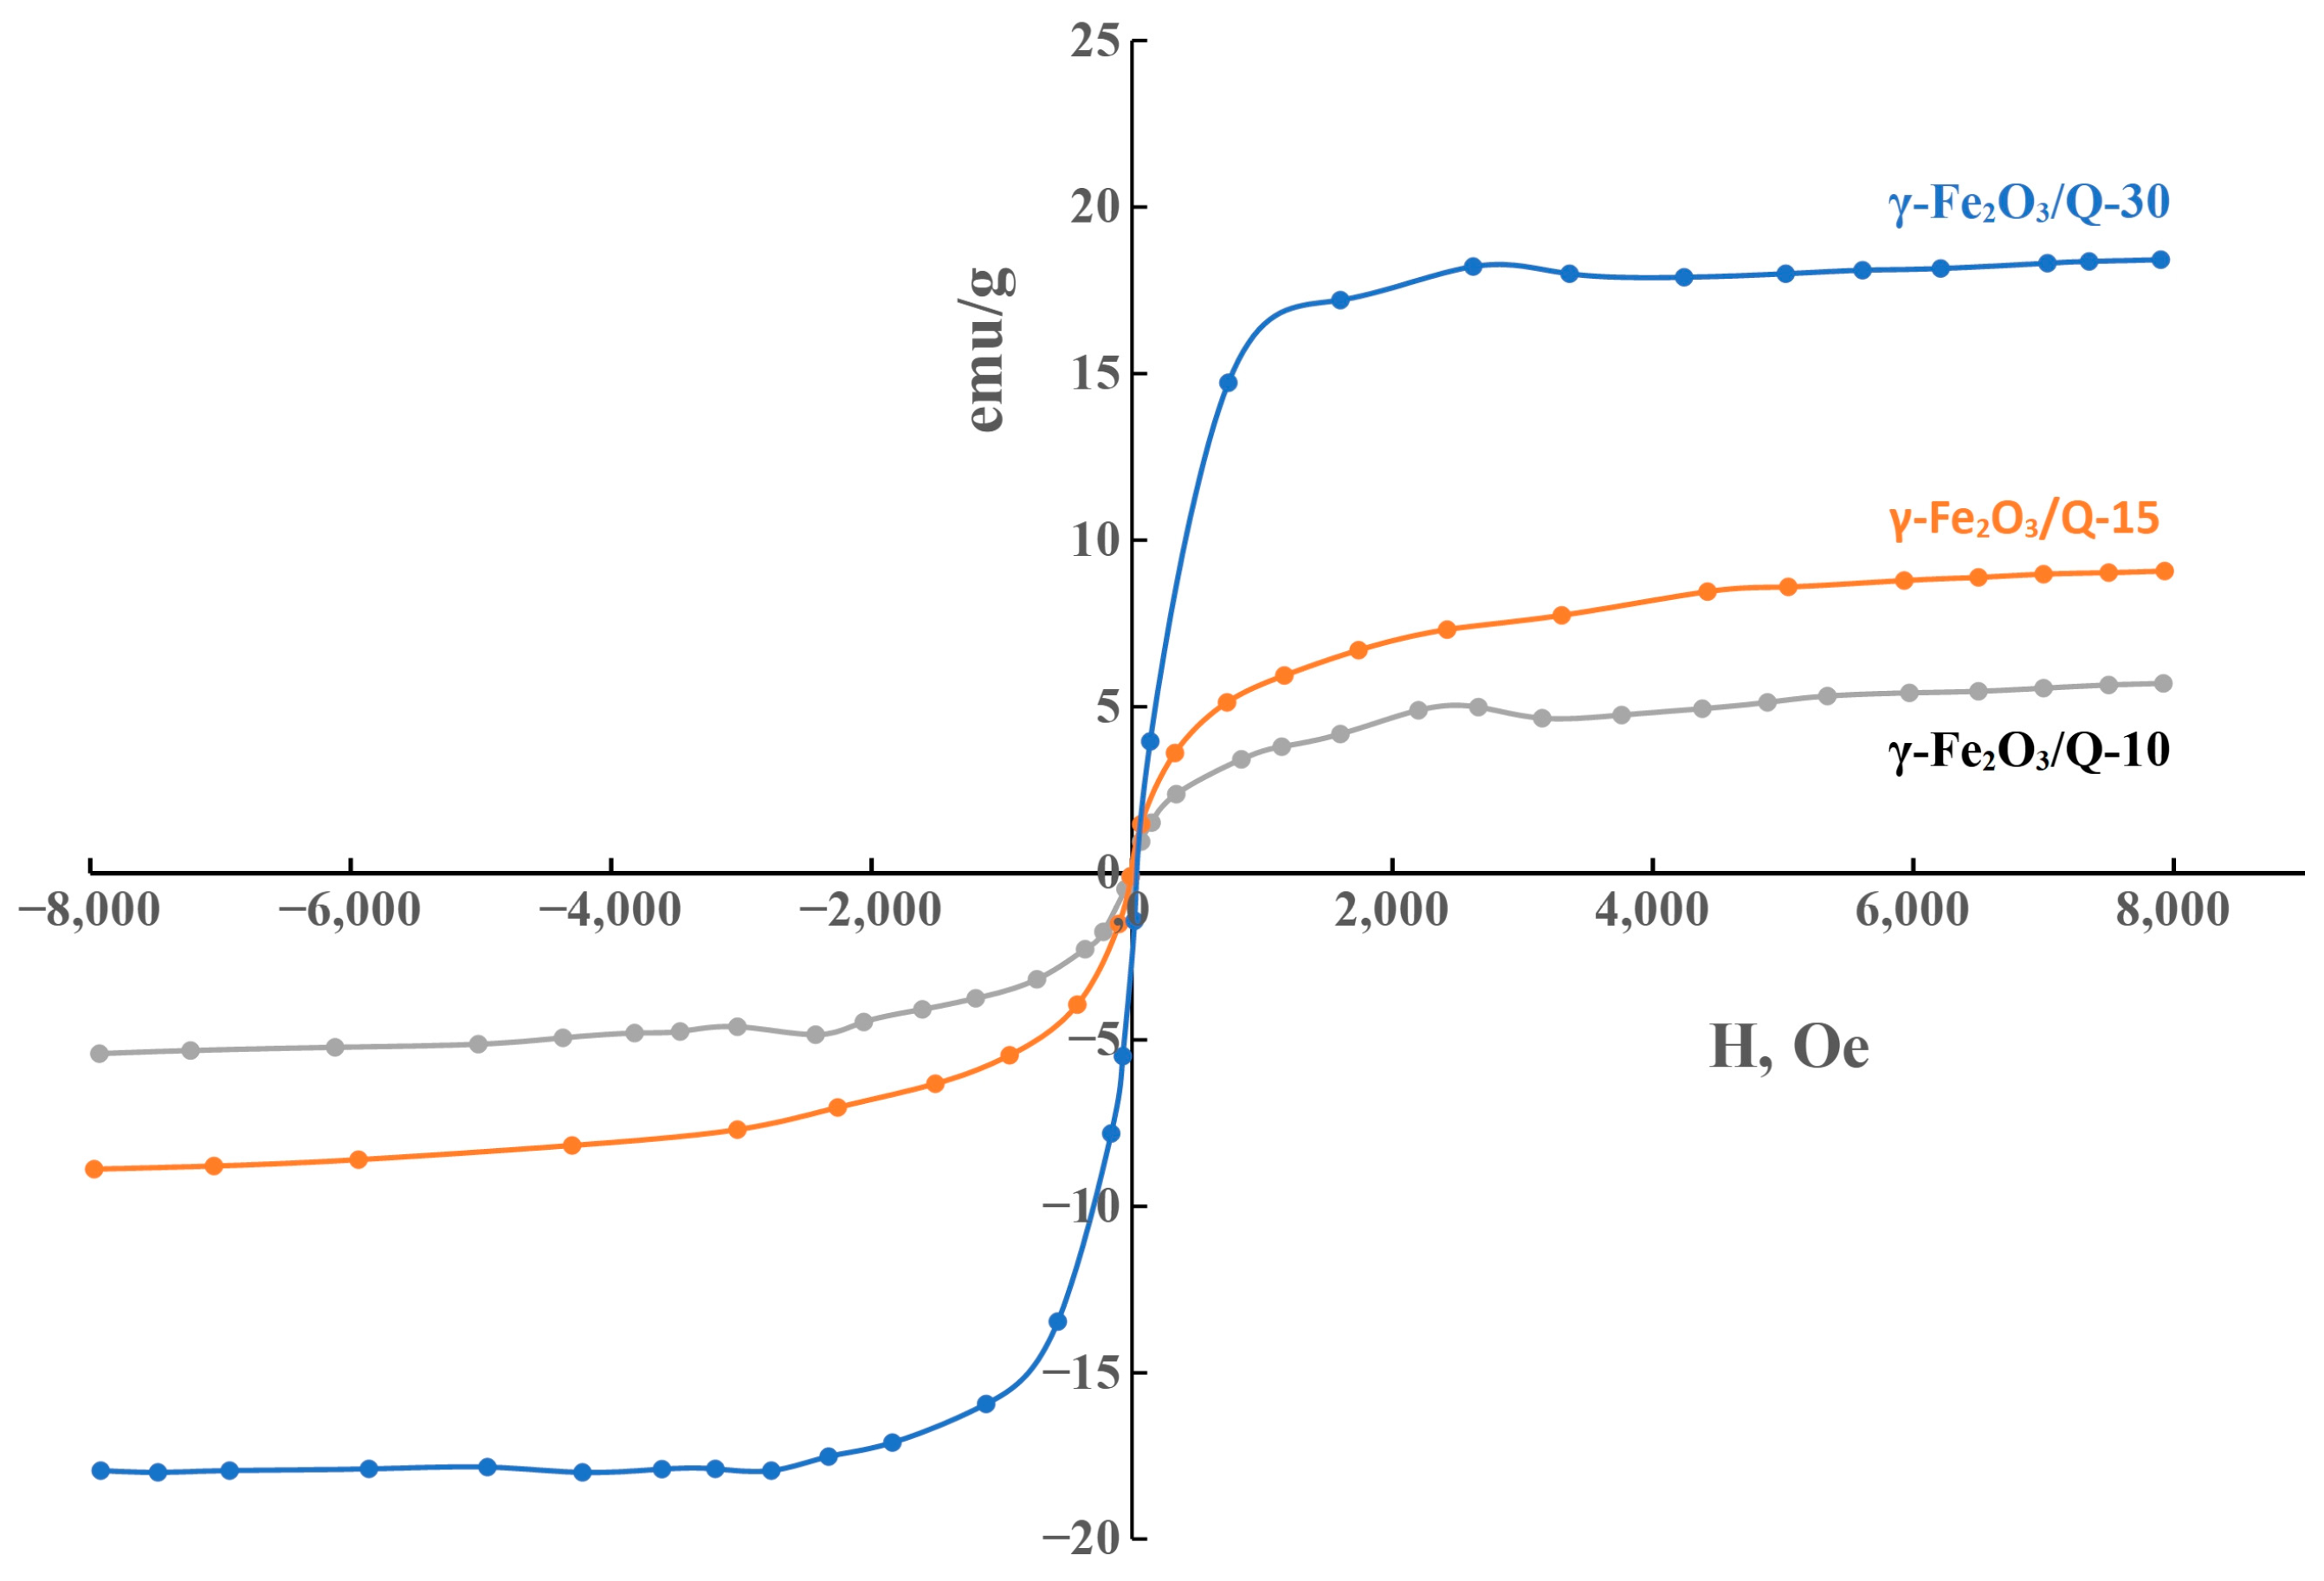
The dependences of magnetization on the magnetic field and pore sizes of catalysts γ-Fe2O3/Q-30, γ-Fe2O3/Q-15 and γ-Fe2O3/Q-10 were investigated by obtaining magnetization curves (Figure 13).
When a magnetic field is applied, particles with different relaxation times of magnetic moment (i.e., with different sizes) reach saturation magnetization at different values of the applied field, which leads to features in the γ-Fe2O3 magnetization curve.
The features of the curve are most clearly seen on the line related to γ-Fe2O3/Q-30, where the particle size distribution is the widest.

4. Conclusions

Based on the results of the present study, it can be concluded that the proposed chemical method for the synthesis of nanosized particles of iron oxides based on thermal reduction/oxidation in the presence of glucose is effective and promising for the synthesis of nanocatalysts with controlled particle sizes and their composition. Obviously, the carbon monoxide formed during glucose thermolysis contributes to the reduction of nanosized hematite particles on the surface of porous silica gel with the formation of nanosized magnetite particles. The subsequent oxidation of magnetite nanoparticles supported on silica gel for all catalysts leads to the formation of a single-phase system of nanosized maghemite particles. It has been shown that both the phase composition and particle size of iron oxides formed at all stages of catalyst synthesis depend on the pore sizes in the silica gel structure.
γ-Fe2O3/Q nanocatalysts were obtained in pores of all sizes, while the sizes of the resulting nanoparticles were limited by the pore size. As the pore size increased, the size distribution of the nanoparticles expanded, which corresponds to a wider range of relaxation times of the superparamagnetic nanosized particles’ magnetic moments, which, in turn, affected the values of the magnetization of the obtained nanosized catalysts (Figure 13). We hope to more carefully study these magnetization curves after removing the temperature dependences of all the obtained nanocatalysts’ Mossbauer spectra in the temperature range of 77.5–300 K. It will allow us to determine the relaxation times of magnetic moments for nanocatalyst particles of different sizes and the temperatures that block their magnetic state. The values of these parameters will make it possible to explain all the features of the magnetization curves.

Author Contributions

Conceptualization, P.A.C. and A.A.N.; methodology, P.A.C. and A.A.N.; software, D.A.P.; validation, P.A.C., A.A.N. and G.V.P.; formal analysis, S.I.P., G.A.P. and A.A.N.; investigation, P.A.C. and A.A.N.; resources, P.A.C. and A.A.N.; data curation, G.A.P.; writing—original draft preparation, G.V.P.; writing—review and editing, S.I.P. and G.A.P.; visualization, P.A.C., G.V.P. and S.I.P.; supervision, A.A.N.; project administration, P.A.C. All authors have read and agreed to the published version of the manuscript.

Funding

This research received no external funding.

Institutional Review Board Statement

Not applicable.

Informed Consent Statement

Not applicable.

Data Availability Statement

The data presented in this study are available on request from the corresponding author.

Conflicts of Interest

The authors declare no conflict of interest.

References

  1. Chourpa, I.; Douziech-Eyrolles, L.; Ngaboni-Okassa, L.; Fouquenet, J.-F.; Cohen-Jonathan, S.; Souce, M.; Marchais, H.; Dubois, P. Molecular composition of iron oxide nanoparticles, precursors for magnetic drug targeting, as characterized by confocal Raman microspectroscopy. Analyst 2005, 130, 1395. [Google Scholar] [CrossRef] [PubMed]
  2. Jain, T.K.; Morales, M.A.; Sahoo, S.K.; Leslie-Pelecky, D.L.; Labhasetwar, V. Iron Oxide Nanoparticles for Sustained Delivery of Anticancer Agents. Mol. Pharm. 2005, 2, 194. [Google Scholar] [CrossRef] [PubMed]
  3. Laurent, S.; Forge, D.; Port, M.; Roch, A.; Robic, C.; Vander Elst, L.; Muller, R.N. Magnetic Iron Oxide Nanoparticles: Synthesis, Stabilization, Vectorization, Physicochemical Characterizations, and Biological Applications. Chem. Rev. 2008, 108, 2064. [Google Scholar] [CrossRef]
  4. Batlle, X.; Perez, N.; Guardia, P.; Iglesias, O.; Labarta, A.; Bartolome, F.; Garcia, L.M.; Bartolome, J.; Roca, A.G.; Morales, M.P.; et al. Magnetic nanoparticles with bulklike properties (invited). J. Appl. Phys. 2011, 109, 07B524. [Google Scholar] [CrossRef]
  5. Yuen, S.; Chen, Y.; Kubsh, J.E.; Dumeslc, J.A. Metal Oxide-Support Interactions in Silica-Supported Iron Oxide Catalysts Probed by Nitric Oxide Adsorption. J. Phys. Chem. 1982, 86, 3022. [Google Scholar] [CrossRef]
  6. Vikesland, P.J.; Heathcock, A.M.; Rebodos, R.L.; Makus, K.E. Particle Size and Aggregation Effects on Magnetite Reactivity toward Carbon Tetrachloride. Environ. Sci. Technol. 2007, 41, 5277. [Google Scholar] [CrossRef]
  7. Yamaguchi, D.; Furukawa, K.; Takasuga, M.; Watanabe, K. A Magnetic Carbon Sorbent for Radioactive Material from the Fukushima Nuclear Accident. Sci. Rep. 2014, 4, 6053. [Google Scholar] [CrossRef]
  8. Yavuz, C.T.; Mayo, J.T.; Yu, W.W.; Prakash, A.; Falkner, J.C.; Yean, S.; Cong, L.L.; Shipley, H.J.; Kan, A.; Tomson, M.; et al. Low-field magnetic separation of monodisperse Fe3O4 nanocrystals. Science 2006, 314, 964. [Google Scholar] [CrossRef]
  9. Tong, S.; Zhu, H.; Bao, G. Magnetic iron oxide nanoparticles for disease detection and therapy. Materialstoday. 2019, 31, 86. [Google Scholar] [CrossRef]
  10. Ang, B.C.; Yaacob, I.I. Preparation of Maghemite-Silica Nanocomposites Using Sol-Gel Technique. Adv. Mater. Res. 2010, 97–101, 2140. [Google Scholar] [CrossRef]
  11. Heng, Z.; Schenk, J.; Spreitzer, D.; Wolfinger, T.; Daghagheleh, O. Review on the Oxidation Behaviors and Kinetics of Magnetite in Particle Scale. Steel Res. Int. 2021, 92, 2000687. [Google Scholar] [CrossRef]
  12. Dragomir, B.B.; Lang, X.; Mukesh, D.; Zimmerman, W.H.; Rosynek, M.P.; Li, C. Binder/support effects on the activity and selectivity of iron catalysts in the Fischer-Tropsch synthesis. Ind. Eng. Chem. Res. 1990, 29, 1588. [Google Scholar] [CrossRef]
  13. Shesterkina, A.A.; Shuvalova, E.V.; Redina, E.A.; Kirichenko, O.A.; Tkachenko, O.P.; Mishin, I.V.; Kustov, L.M. Silica-supported iron oxide nanoparticles: Unexpected catalytic activity in hydrogenation of phenylacetylene. Mendeleev Commun. 2017, 27, 512. [Google Scholar] [CrossRef]
  14. Martínez, F.; Calleja, G.; Melero, J.A.; Molina, R. Iron species incorporated over different silica supports for the heterogeneous photo-Fenton oxidation of phenol. Appl. Catal. B Environ. 2007, 70, 452. [Google Scholar] [CrossRef]
  15. Chernavskii, P.A.; Kazak, O.; Pankina, G.V.; Ordomsky, V.V.; Khodakov, A.Y. Mechanistic Aspects of the Activation of Silica-Supported Iron Catalysts for Fischer–Tropsch Synthesis in Carbon Monoxide and Syngas. ChemCatChem 2016, 8, 390. [Google Scholar] [CrossRef]
  16. de Smit, E.; Weckhuysen, B.M. The renaissance of iron-based Fischer–Tropsch synthesis: On the multifaceted catalyst deactivation behavior. Chem. Soc. Rev. 2008, 37, 2758. [Google Scholar] [CrossRef]
  17. Chen, L.; Costa, E.; Kileti, P.; Tannenbaum, R.; Lindberg, J.; Devinder, M. Sonochemical Synthesis of Silica-Supported Iron Oxide Nanostructures and Their Application as Catalysts in Fischer–Tropsch. Synthesis. Micro 2022, 2, 632. [Google Scholar] [CrossRef]
  18. Ponomar, V.P.; Dudchenko, N.O.; Brik, A.B. Reduction roasting of hematite to magnetite using carbohydrates. Int. J. Miner. Process. 2017, 164, 21. [Google Scholar] [CrossRef]
  19. Zhou, Y.; Yin, G.; Zeng, X.; Zhao, J.; Yao, G. Potential application of carbohydrate biomass in hydrometallurgy: One-pot reduction of metal oxides/salts under mild hydrothermal conditions. RSC Adv. 2022, 12, 20747. [Google Scholar] [CrossRef]
  20. Ikoma, S.; Ohki, K.; Yokoi, H. Preparation and Characterization of Silica-Supported Maghemite. J. Ceram. Soc. Jpn. 1992, 100, 864. [Google Scholar] [CrossRef]
  21. Paul, K.G.; Frigo, T.B.; Groman, J.Y.; Groman, E.V. Synthesis of Ultrasmall Superparamagnetic Iron Oxides Using Reduced Polysaccharides. Bioconjugate Chem. 2004, 15, 394. [Google Scholar] [CrossRef]
  22. Chernavskii, P.A.; Lunin, B.S.; Zakharyan, R.A.; Pankina, G.V.; Perov, N.S. Experimental setup for investigating topochemical transformations of ferromagnetic nanoparticles. Instr. Exp. Tech. 2014, 57, 78. [Google Scholar] [CrossRef]
  23. Barbier, A.; Hanif, A.; Dalmon, J.-A.; Martin, G.A. Preparation and characterization of well-dispersed and stable Co/SiO2 catalysts using the ammonia method. Appl. Catal. A Gen. 1998, 168, 333. [Google Scholar] [CrossRef]
  24. Kemp, S.J.; Ferguson, R.M.; Khandhar, A.P.; Krishnan, K.M. Monodisperse magnetite nanoparticles with nearly ideal saturation magnetization. RSC Adv. 2016, 6, 77452. [Google Scholar] [CrossRef]
  25. Reichel, V.; Kovács, A.; Kumari, M.; Bereczk-Tompa, É.; Schneck, E.; Diehle, P.; Pósfai, M.; Hirt, A.M.; Duchamp, M.; Dunin-Borkowski, R.E.; et al. Single crystalline superstructured stable single domain magnetite nanoparticles. Sci. Rep. 2017, 7, 45484. [Google Scholar] [CrossRef] [PubMed]
  26. Hadadian, Y.; Masoomi, H.; Dinari, A.; Ryu, C.; Hwang, S.; Kim, S.; Cho, B.; Lee, J.Y.; Yoon, J. From Low to High Saturation Magnetization in Magnetite Nanoparticles: The Crucial Role of the Molar Ratios between the Chemicals. ACS Omega 2022, 7, 15996. [Google Scholar] [CrossRef] [PubMed]
  27. Cao, D.; Li, H.; Pan, L.; Li, J.; Wang, X.; Jing, P.; Cheng, X.; Wang, W.; Wang, J.; Liu, Q. High saturation magnetization of γ-Fe2O3 nano-particles by a facile one-step synthesis approach. Sci. Rep. 2016, 6, 32360. [Google Scholar] [CrossRef] [PubMed]
  28. Bocquet, S.; Pollard, R.J.; Cashion, J.D. Dynamic magnetic phenomena in fine-particle goethite. Phys. Rev. 1992, B46, 11657. [Google Scholar] [CrossRef]
  29. Vandenberghe, R.E.; Barrero, C.A.; da Costa, G.M.; Van San, E.; De Grave, E. Mössbauer characterization of iron oxides and (oxy)hydroxides: The present state of the art. Hyperfine Interact. 2000, 126, 247. [Google Scholar] [CrossRef]
  30. Hanesch, M.; Stanjek, H.; Petersen, N. Thermomagnetic measurements of soil iron minerals: The role of organic carbon. Geophys. J. Int. 2006, 165, 53. [Google Scholar] [CrossRef]
  31. O’Neill, H.S.C.; McCammon, C.A.; Canil, D.; Rubie, D.C.; Ross, C.R., II; Seifert, F. Mössbauer spectroscopy of mantle transition zone phases and determination of minimum Fe3+ content. Am. Miner. 1993, 78, 456. [Google Scholar]
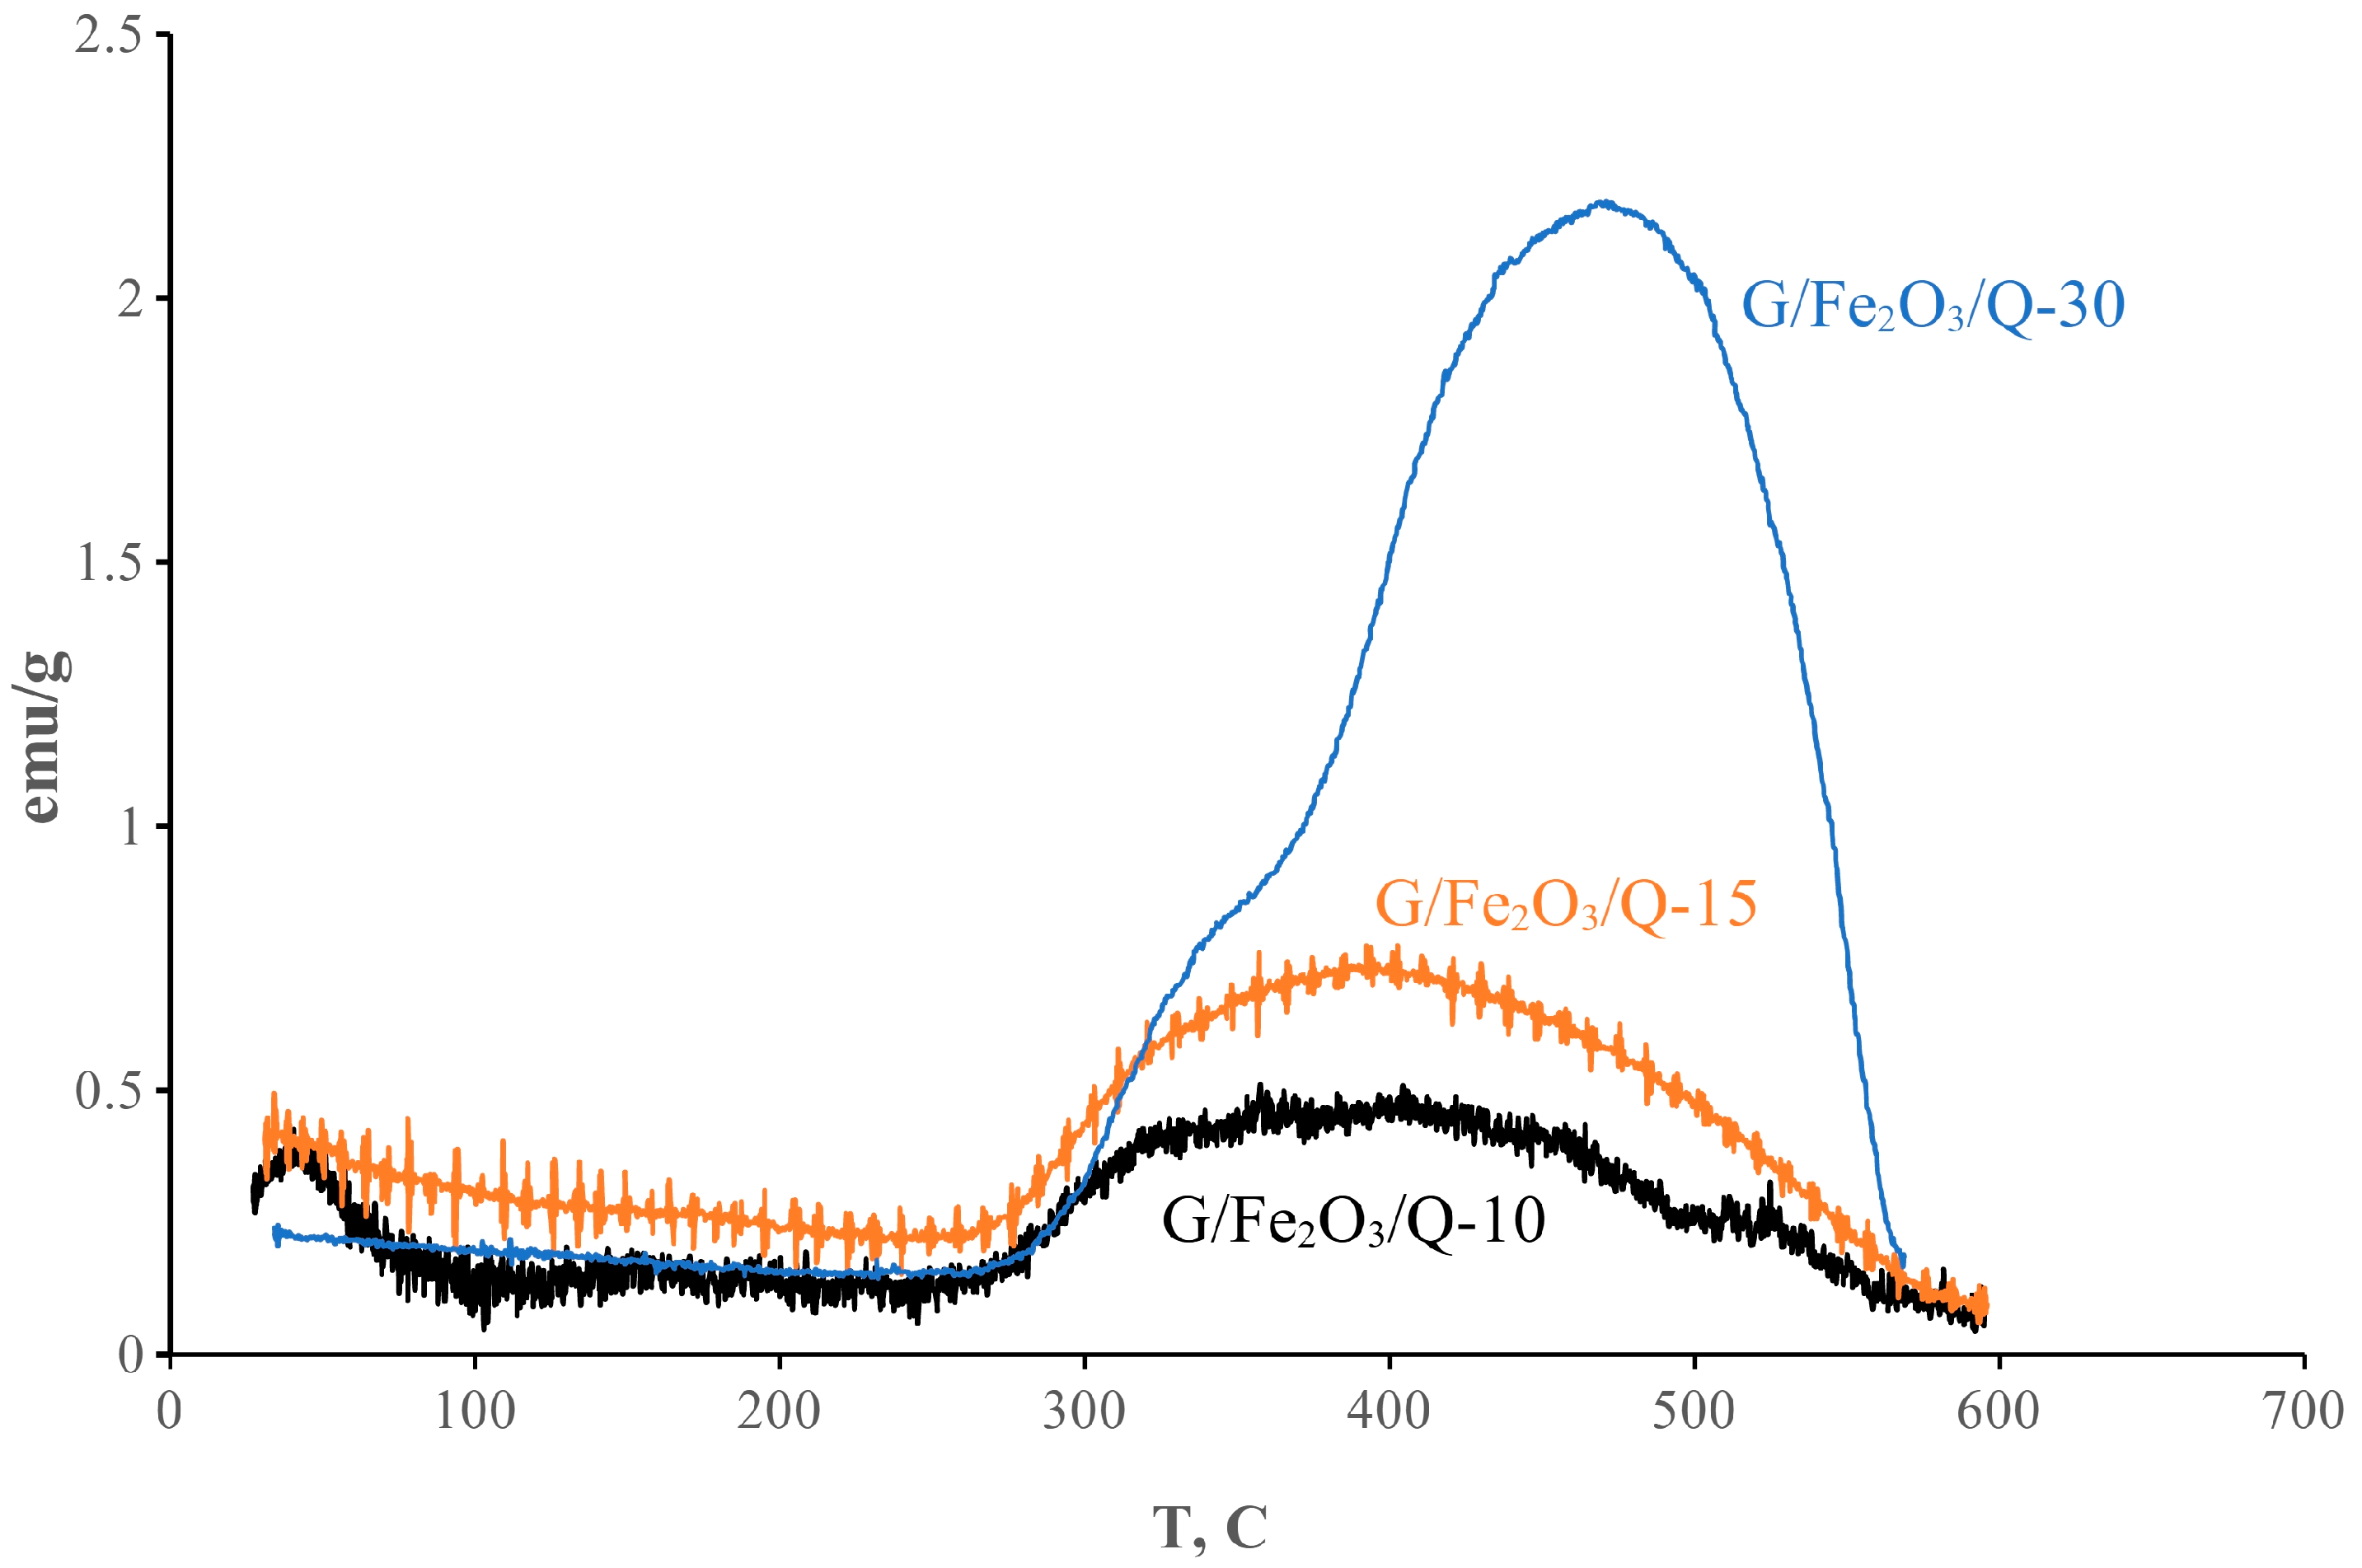
Figure 1. The dependence of magnetization on temperature for catalysts during heating in argon.
Magnetochemistry 09 00228 g001
Figure 2. The dependences of magnetization on the field for catalysts Fe3O4/Q−30, Fe3O4/Q−15 and Fe3O4/Q−10.
Magnetochemistry 09 00228 g002
Figure 3. Saturation magnetization determination: extrapolation at 1/H = 0 of the magnetizations of Fe3O4/Q-15 and Fe3O4/Q-10.
Magnetochemistry 09 00228 g003
Figure 4. Diffraction patterns of catalysts (a) α-Fe2O3/Q-10, (b) Fe3O4/Q-10 and (c) γ-Fe2O3/Q-10.
Magnetochemistry 09 00228 g004
Figure 5. Diffraction patterns of catalysts (a) α- Fe2O3/Q-15, (b) Fe3O4/Q-15, (c) γ-Fe2O3/Q-15.
Magnetochemistry 09 00228 g005
Figure 6. Diffraction patterns of catalysts (a) α-Fe2O3/Q-30, (b) Fe3O4/Q-30, (c) γ-Fe2O3/Q-30.
Magnetochemistry 09 00228 g006
Figure 7. Mossbauer spectra of catalysts (a) α-Fe2O3/Q10, (b) Fe3O4/Q-10, (c) γ -Fe2O3/Q-10.
Magnetochemistry 09 00228 g007
Figure 8. Size distribution diagrams for iron-containing components of catalysts (a) α-Fe2O3/Q-10, (b) Fe3O4/Q-10, (c) γ-Fe2O3/Q-10, where the intensities of the histograms correspond to the content of particles of a given size in the catalysts. The intermediate phases arising during the synthesis are marked in red.
Magnetochemistry 09 00228 g008
Figure 9. Mossbauer spectra of catalysts α-Fe2O3/Q15 (a), Fe3O4/Q-15 (b), γ-Fe2O3/Q-15 (c).
Magnetochemistry 09 00228 g009
Figure 10. Size distribution diagrams for iron-containing components of catalysts (a) α-Fe2O3/Q-15, (b) Fe3O4/Q-15, (c) γ-Fe2O3/Q-15 obtained at the stages of synthesis of the γ-Fe2O3/Q-15 nanocatalyst.
Magnetochemistry 09 00228 g010
Figure 11. Mossbauer spectra of catalysts α-Fe2O3/Q30 (a), Fe3O4/Q-30 (b), γ-Fe2O3/Q-30 (c).
Magnetochemistry 09 00228 g011
Figure 12. Size distribution diagrams for iron oxide nanoparticles obtained at the stages of synthesis of the γ-Fe2O3/Q-30 nanocatalyst: α-Fe2O3/Q-30 (a), Fe3O4/Q-30 (b), γ-Fe2O3/Q-30 (c).
Magnetochemistry 09 00228 g012
Figure 13. The dependences of magnetization on the field and pore sizes of catalysts γ-Fe2O3/Q-30 (9–29 nm), γ-Fe2O3/Q-15 (8–14 nm) and γ-Fe2O3/Q-10 (6–9 nm).
Magnetochemistry 09 00228 g013
Table 1. The upper and lower limits of Fe3O4 particle size (d), estimated for each case.
Medium, nmd (max)d (min)Catalysts
5.77 nm4.5 nmFe3O4/Q-15
5.47 nm3.8 nmFe3O4/Q-10
Table 2. Iron oxide particle sizes found from Scherrer reflex width analysis.
Particle Size, nmCatalysts
γ-Fe2O3Fe3O4α-Fe2O3
22α-Fe2O3/Q-30
13α-Fe2O3/Q-15
5α-Fe2O3/Q-10
24 Fe3O4/Q-30
14 Fe3O4/Q-15
7 Fe3O4/Q-10
25 γ-Fe2O3/Q-30
14 γ-Fe2O3/Q-15
8 γ-Fe2O3/Q-10
Table 3. Mossbauer spectra parameters (T = 300 K).
S, %Heff, kOeΓexp, mm/sΔ, mm/sδ, mm/sPhaseSample
48 0.450.650.35α-Fe2O3 d~6 nm1α-Fe2O3/Q-10
52 0.650.940.33α-FeOOH(Si) d~2 nm2
29400200.27Fe3O4 d~9 nm1Fe3O4/Q-10
55 0.620.760.35Fe3O4 d~7 nm2
15 0.681.140.31γ-Fe2O3 d~5 nm3
43452200.27γ-Fe2O3 d~9 nm1γ-Fe2O3/Q-10
44 0.650.760.34γ-Fe2O3 d~7 nm2
13 0.681.10.31γ-Fe2O3 d~5 nm3
76 0.470.690.34α-Fe2O3 d~11 nm1α-Fe2O3/Q-15
24 0.671.10.3α-FeOOH(Si) d~2 nm2
334401.20.50.35Fe3O4 d~14 nm1Fe3O4/Q-15
51 0.760.920.37Fe3O4 d~8 nm2
16 0.62.81.14γ-Fe2SiO4 d~9 nm3
59451200.27γ-Fe2O3 d~14 nm1γ-Fe2O3/Q-15
33 0.780.840.34γ-Fe2O3 d~11 nm2
8 0.681.10.31γ-Fe2O3 d~8 nm3
535070.36−0.220.37α-Fe2O3 d~17 nm1α-Fe2O3/Q-30
29 0.450.660.34α-Fe2O3 d~12 nm2
18 0.681.10.31α-FeOOH(Si) d~2 nm3
494520.60.020.64Fe3O4 d~29 nm1Fe3O4/Q-30
4830.4600.26Fe3O4 d~29 nm
134201−0.030.45Fe3O4 d~15 nm2
17 0.911.060.36Fe3O4 d~8 nm3
214850.3600.32γ-Fe2O3 d~27 nm4
334970.45−0.020.34γ-Fe2O3 d~29 nm1γ-Fe2O3/Q-30
214780.4500.3γ-Fe2O3 d~20 nm2
364391.500.46γ-Fe2O3 d~15 nm3
10 0.60.850.36γ-Fe2O3 d~9 nm4
Disclaimer/Publisher’s Note: The statements, opinions and data contained in all publications are solely those of the individual author(s) and contributor(s) and not of MDPI and/or the editor(s). MDPI and/or the editor(s) disclaim responsibility for any injury to people or property resulting from any ideas, methods, instructions or products referred to in the content.