Article

Experimental and Numerical Analyses of a Novel Magnetostatic Force Sensor for Defect Inspection in Ferromagnetic Materials

1
Department of Mechanical and Electrical, Yuncheng University, Yuncheng 044000, China
2
School of Automation, Xi’an University of Posts & Telecommunications, Xi’an 710121, China
3
Chengdu Holy Industry & Commerce Corp., Ltd. (Group), Pengzhou 611936, China
*
Author to whom correspondence should be addressed.
Magnetochemistry 2022, 8(12), 182; https://doi.org/10.3390/magnetochemistry8120182
Submission received: 4 November 2022 / Revised: 1 December 2022 / Accepted: 5 December 2022 / Published: 7 December 2022
(This article belongs to the Section Applications of Magnetism and Magnetic Materials)

Abstract

:
An innovative magnetostatic force sensor consisting of a laser source, a tiny cantilever beam, and a small permanent magnet was developed and used for defect inspection in ferromagnetic samples in the present article. The penetrating zone within a ferromagnetic material under the magnetic field provided by a permanent magnet was called the magnetic sensing zone (MSZ), and surface or internal defects within the MSZ were inspected by measuring the change in the magnetostatic force. This magnetostatic force could be calculated by the Maxwell tensor integrating over the surface and interface of a ferromagnetic material. Numerical and experimental results demonstrated that this sensor was reliable and could precisely inspect the defects of different sizes in ferromagnetic samples. In summary, the sensor proposed in this paper has the potential for industrial applications to detect surface and sub-surface tiny defects on ferromagnetic steel thin sheets, such as the zinc slag defect of hot galvanized sheets, cracks on cold-rolled sheets, and the ferromagnetic oscillation marks of continuous casting.

1. Introduction

With the continuous development of processing technology, metals are widely used in different engineering fields. However, the processing of metals generates different types of flaws in the final products, such as shrinkage cavities, slag inclusions, and corrosion. Such flaws can negatively influence the mechanical properties and lifetime of the metals, such that the metals will likely crack and fracture over an extended time period, resulting in huge economic losses [1,2].
Non-destructive testing is widely used in the metal industry to control the quality of materials [3]. Ultrasonic, radiographic, and eddy current test methods are generally used for flaw detection [4,5,6,7,8,9,10]. The main drawback of ultrasonic testing is that small defects can only be detected at high frequencies. However, it is very difficult to generate frequencies greater than 50 MHz [11]. Generally, ultrasonic testing has high resolution but relatively low sensitivity, and the relevant equipment has a large size and complicated structure. In addition, a coupling agent is also required, which will limit the role of ultrasonic testing in industrial practices. Radiographic testing has the disadvantages of high requirements on the detection medium and low detection efficiency, and the equipment used in radiographic testing is relatively heavy and expensive. Moreover, radiographic testing has the risk of environmental pollution and human damage and needs additional safety protection [12,13]. Under the skin and lift-off effects of eddy current testing, an accuracy of 1 mm or better for the excitation and detection coils is difficult to achieve [14]. Thus, small defect detection is very limited. In previous research [15], a new testing method, which combined the eddy-current and magnetostatic field and was used for the defect detection of ferromagnetic materials, was presented. The main part of the method is a simultaneous subjection of the inspected object to the static magnetic and alternating electromagnetic fields. However, the theory and device involved in this method were quite complex, which was inconvenient for the subsequent industrial application.
The present work was inspired by the Lorentz force eddy current testing method created by Thess et al. [16,17,18,19]. The above Lorentz force eddy current testing method only used a force sensor and a small permanent magnet, making the device simple and lightweight [18,19]. We performed experimental work for the detection of the surface oscillating marks of continuous casting using a magnetostatic force, accompanied by theoretical analytical work [20,21]. In this article, a magnetostatic force sensor consisting of a laser source, a tiny cantilever beam, and a small permanent magnet was developed, and a precise laser displacement sensor was used to measure the magnetostatic force change. The magnetostatic force we detected using this method constituted a vector. More details about the principle of the laser displacement sensor can be found in the literature [20]. Numerical and experimental methods were conducted to verify the measurement principle. In comparison to the traditional eddy current test method, this new method has the advantage of obtaining more abundant information about the flaws in materials.

2. Measurement Principle

The flaw measurement principle by magnetostatic force is illustrated in Figure 1. When a small permanent magnet is positioned at a fixed distance from the surface of the test plate, the magnetization direction remains perpendicular to the magnet surface. Permanent magnets magnetize the ferromagnetic material and produce a magnetic attraction for the material. Moreover, the permanent magnet generates a magnetic sensing zone (MSZ). The measurement accuracy clearly depends on MSZ. Therefore, the reactive force F0′ existing on the ferromagnetic material is calculated by Newton’s third law. F0′ is expressed as
F 0 = F 0 = Ω n T d s
where ds is the elemental area of the upper and the lower surface Ω, n is the normal vector of the ferromagnetic material surface, and T is the Maxwell tensor which is computed from
n T = 1 2 ( H B ) + ( n B ) B T
where H, B, and BT are the magnetic field, magnetic flux density, and the transpose of the matrix of B, respectively.
When a flaw appears in MSZ, the reactive force changes to F1′, as follows:
F 1 = F 1 = Ω n T d s
where Ω′ represents the upper and lower surfaces and the interface between the sample and the flaw, n′ is the normal vector pointing from the inside to outside of the sample in MSZ, and s′ is the area of Ω′. Subsequently, F1′ is compared with F0′. If F1= F0′, no flaws are present in the test sample. Otherwise, the sample is determined to contain one or more flaws.

3. Experimental Prototype

3.1. Design of the Experimental Device

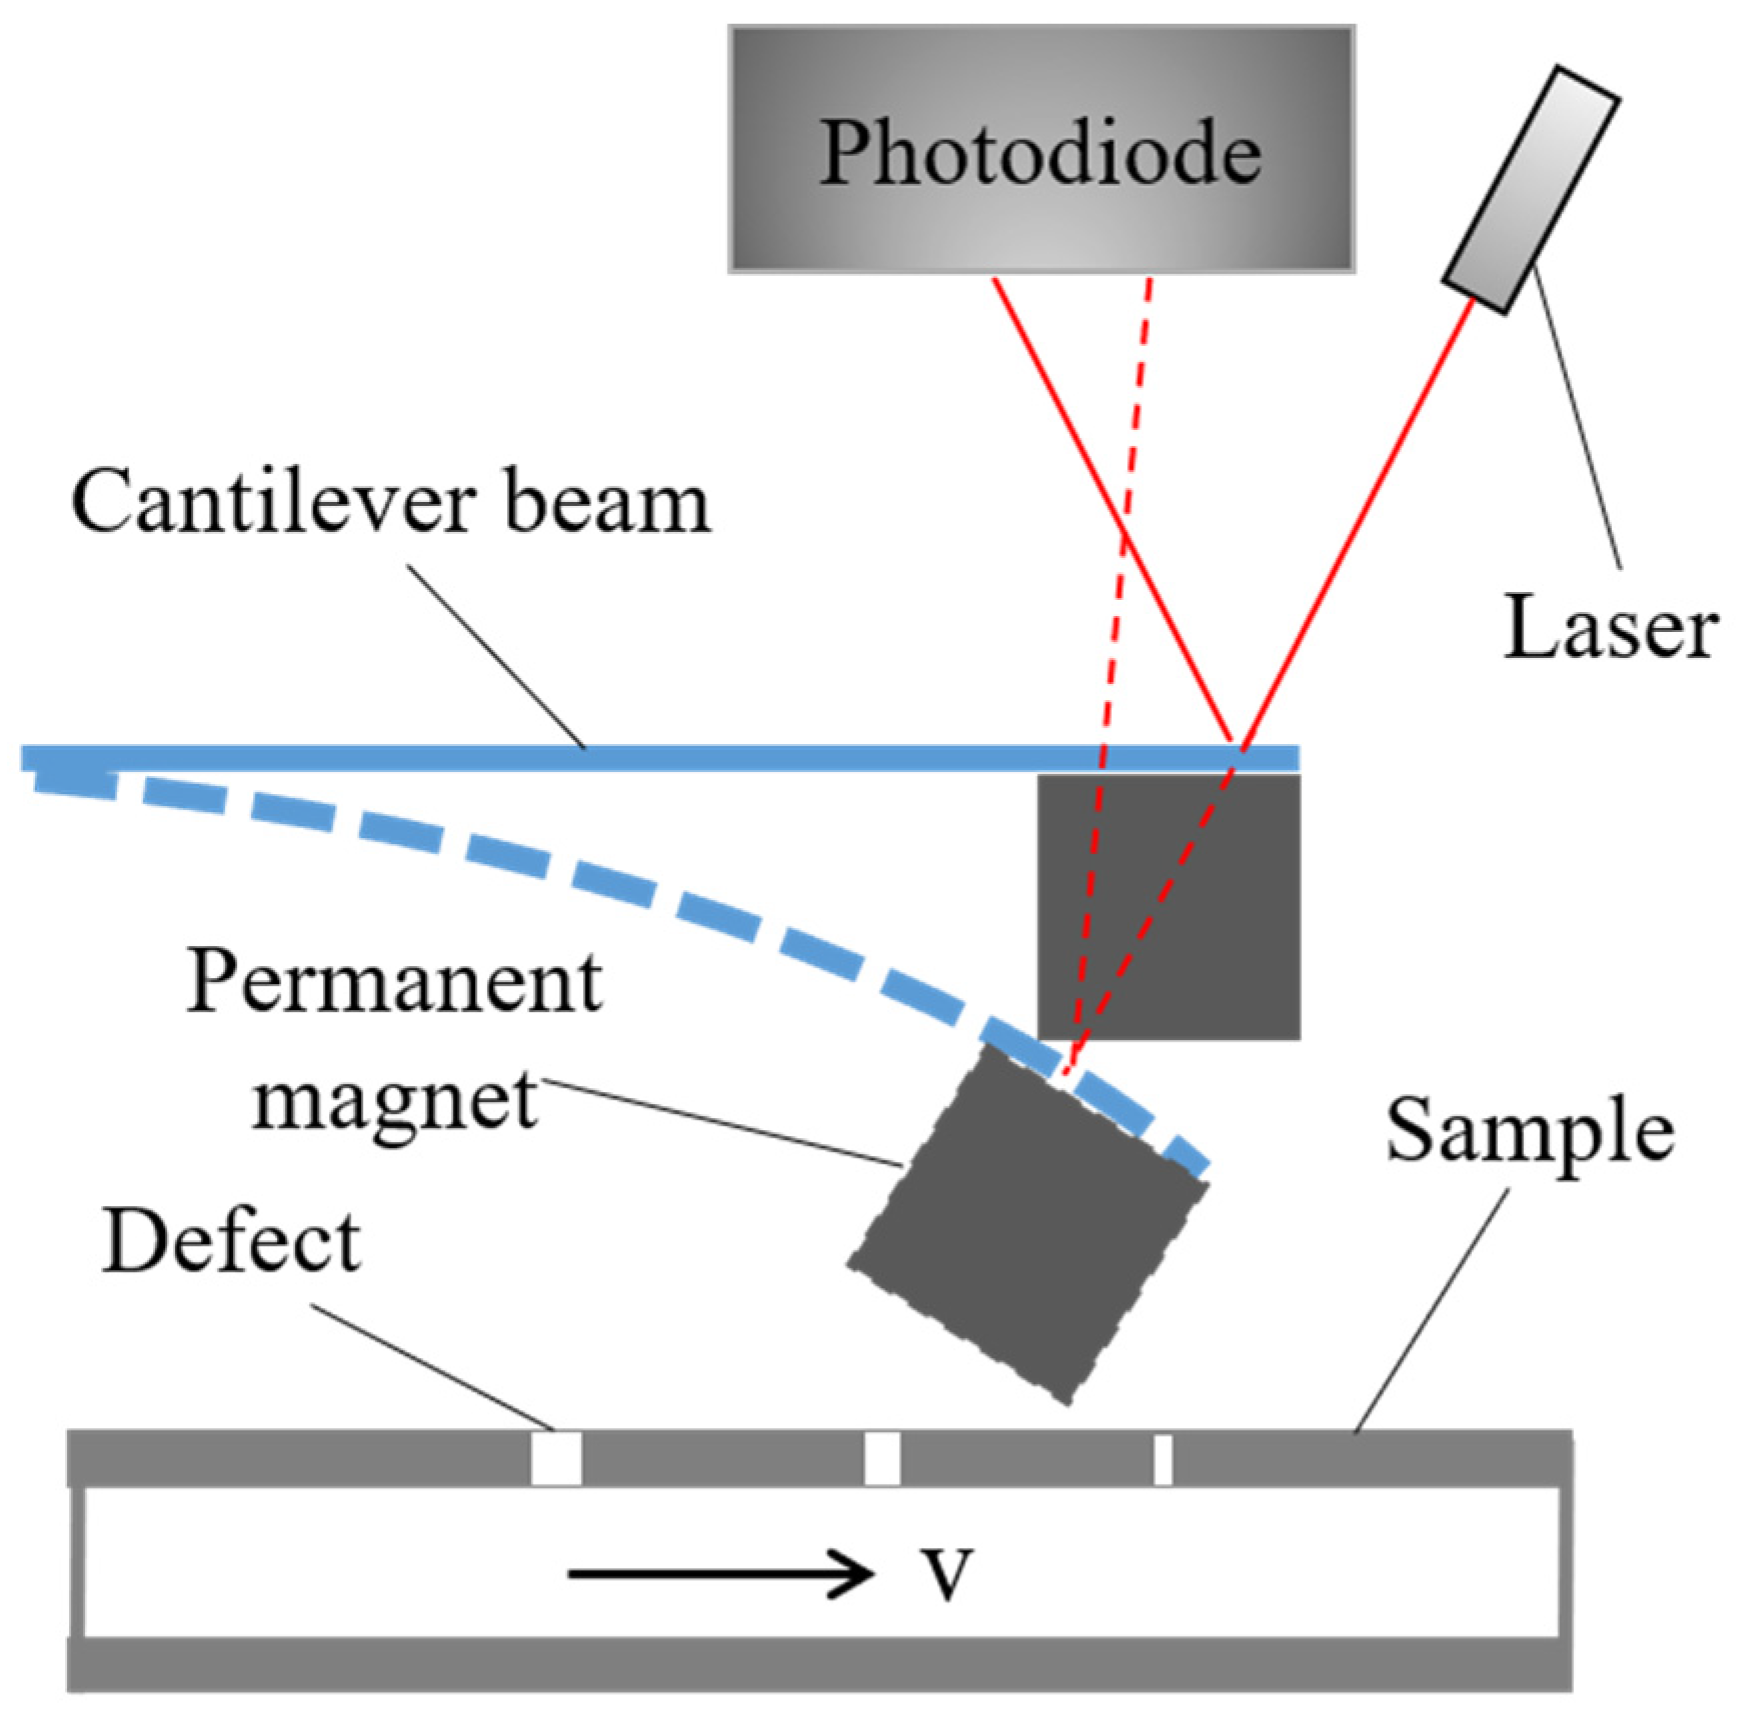
The magnetostatic force sensor was based on an atomic force microscope. A cantilever beam with a nanometer tip was used in the microscope for sample detection [22,23]. When the tip, which is sensitive to the distance from the sample, interacted with the sample, the cantilever was deformed. The structure of the experimental device is shown in Figure 2. The sensor was mainly composed of a laser source, a cantilever beam, and a permanent magnet. The cantilever was made of a thin rectangular steel sheet whose thickness was 0.03 mm. One side of the cantilever was fixed, and the other side was free. The permanent magnet adhered to the free tip of the cantilever beam, and the laser shone on the cantilever beam. A photodiode (Microtrak LTS-050-10, Chengdu Holy Industry & Commerce Corp., Ltd., Pengzhou, China) was employed to measure the change in the laser path, which could be used to exhibit the deformation of the cantilever beam. Therefore, the sensor was termed a laser–cantilever-magnet system.
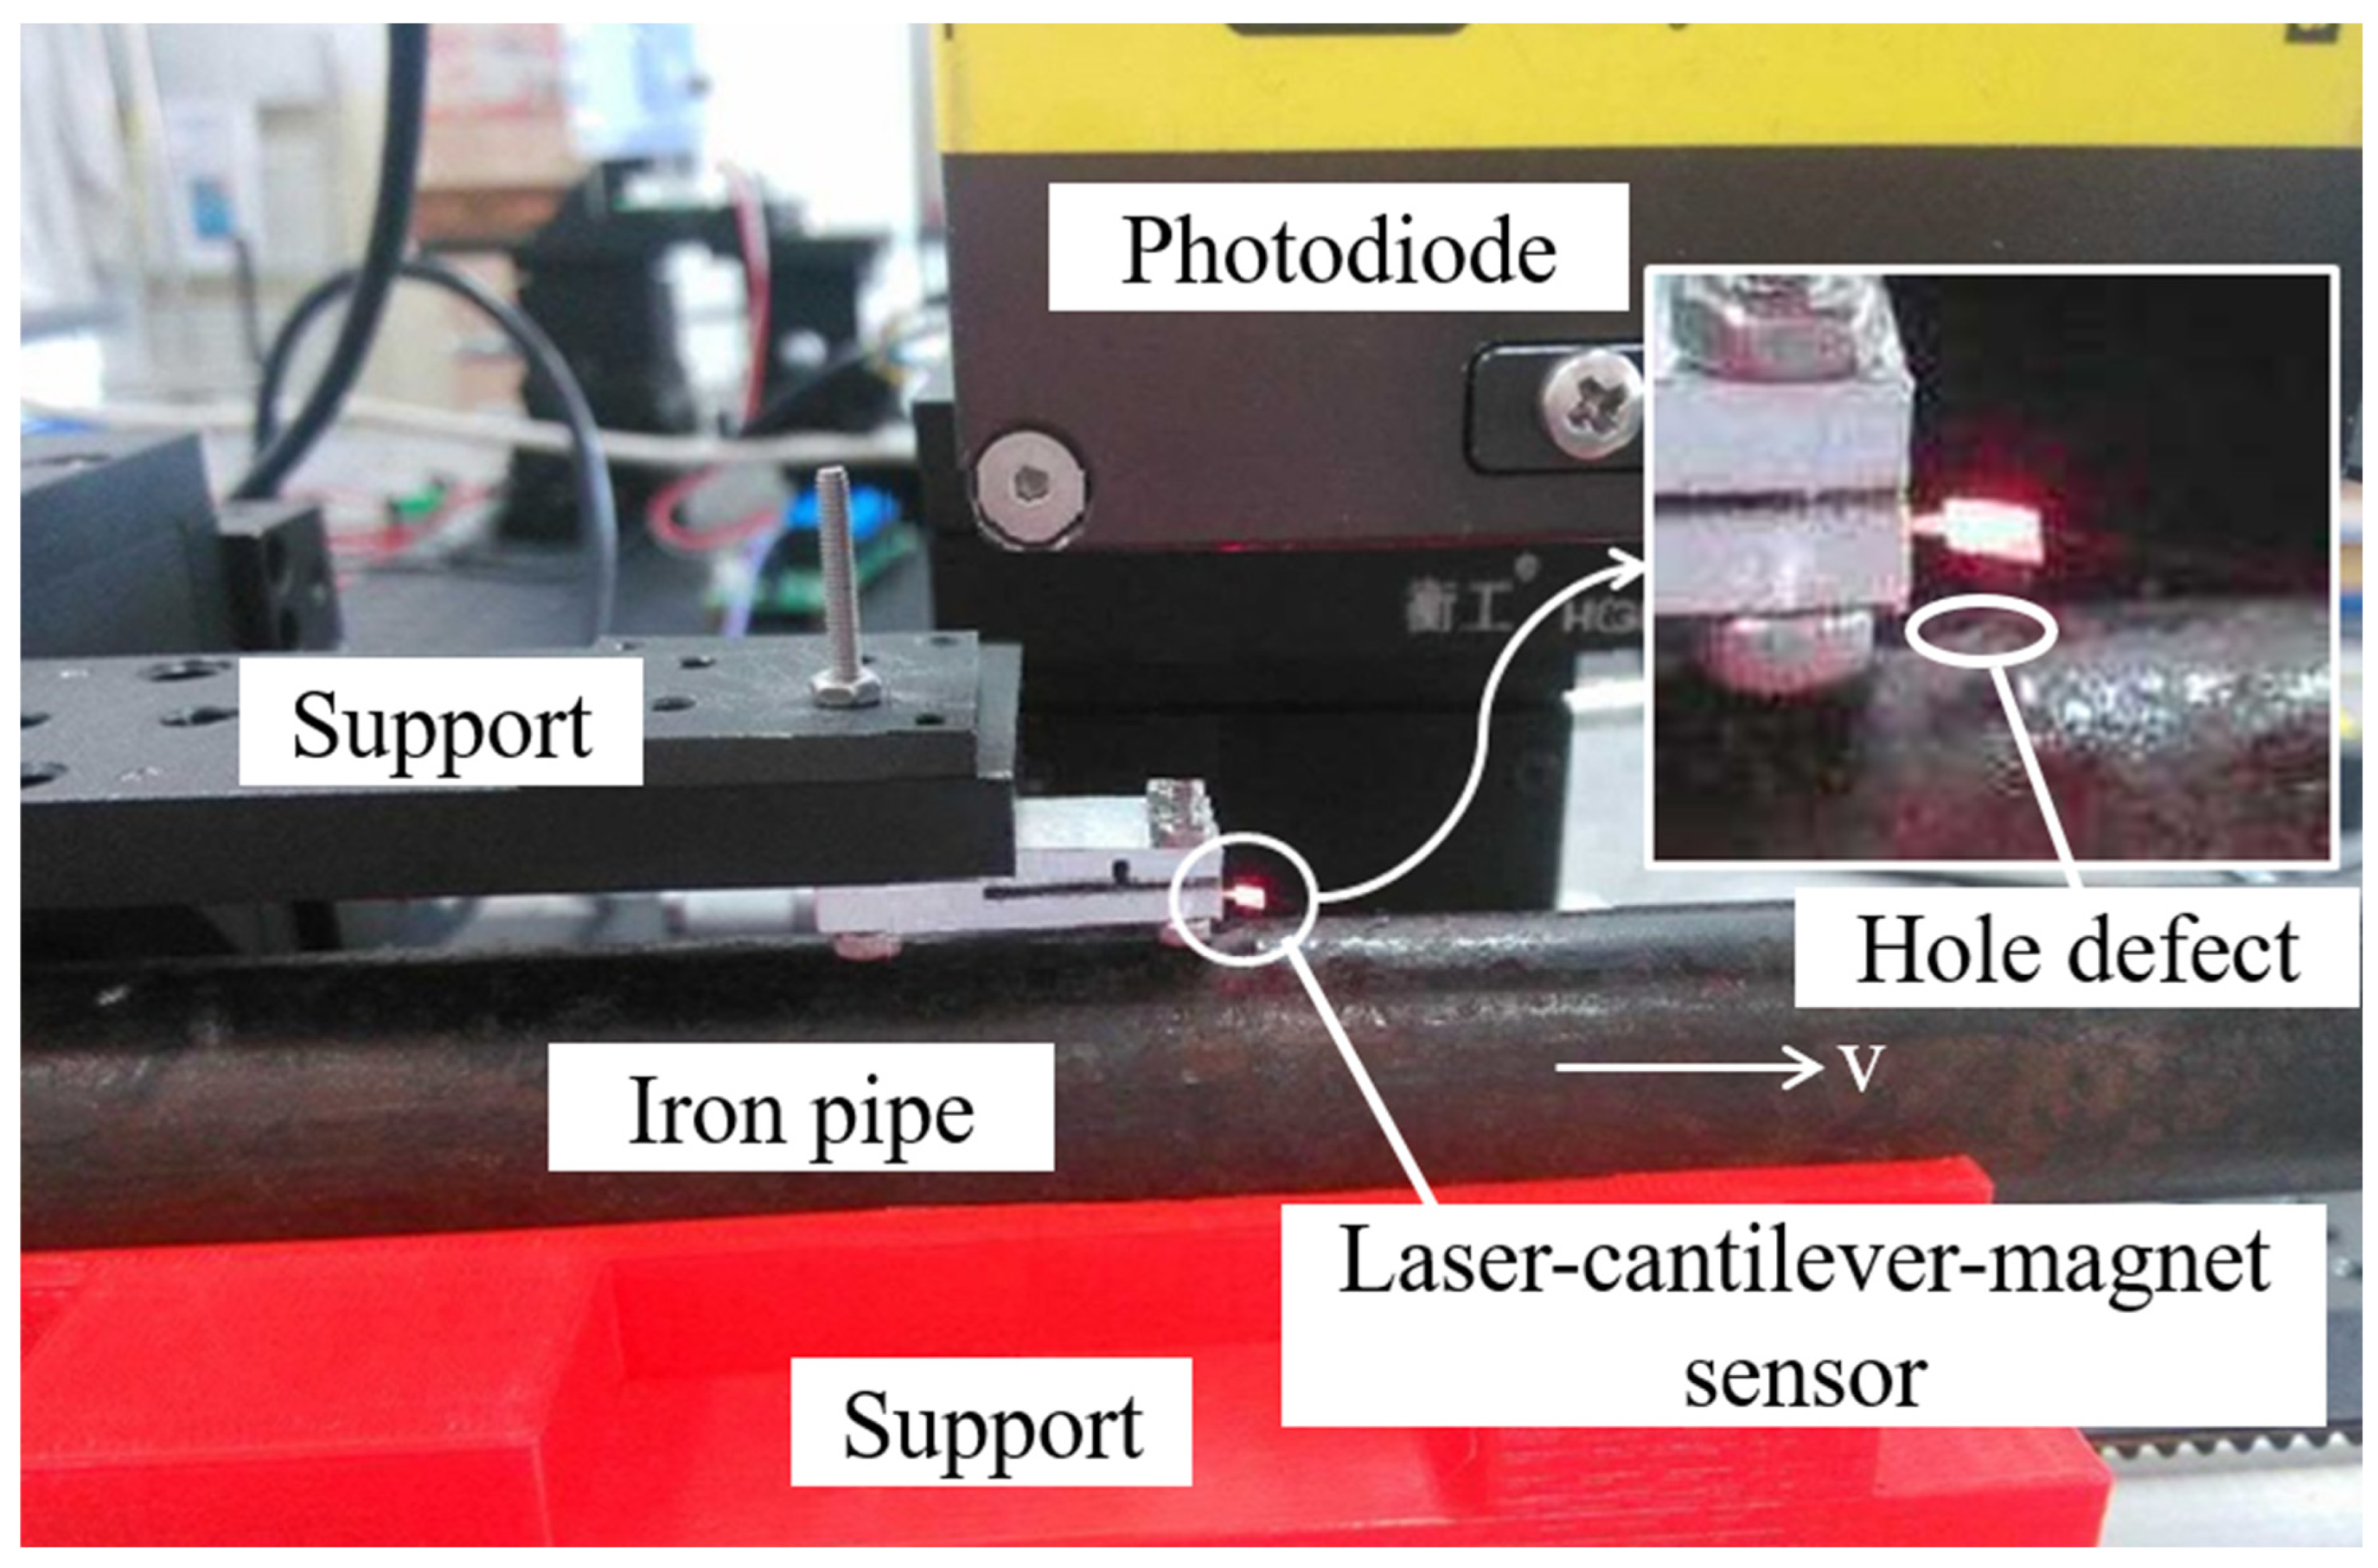
The prototype experimental device is shown in Figure 3. The permanent magnet was made of NdFeB, which is one of the strongest permanent magnet materials. The remanent magnetic flux density of the permanent magnet B0 was equal to 1.4 T. A cubic permanent magnet with a length of 1 mm was used. Two different types of ferromagnetic material samples were inspected in this experiment. The first sample was an iron pipe with through-hole defects. The diameter and thickness of the iron pipe were 16 mm and 3 mm, respectively. The diameters of the holes were set to 0.5 mm, 1.0 mm, and 2.5 mm. The second sample was a standard sample used in industrial eddy current testing. Two slot defects with 0.15 mm in width were cut on the sample surface to investigate the detection depth of this method. The depths of the slots were 1 mm and 0.2 mm, respectively.
The sample was placed beneath the magnetostatic force sensor, as seen in Figure 2 and Figure 3. In the experiment, the sample was driven by a stepper motor with a speed of 15 mm/s, and thus, the sensor could sequentially scan all the hole defects that were mentioned above. The photodiode recorded the evolution of the magnetostatic force in the testing process. The distance between the sample and the sensor was very important. The smaller the distance, the larger the force on the sample. Thus, the distance had to be set to less than a certain critical value. This value was relative to both the cantilever elastic deformation force and the amplitude of the magnetostatic attractive force. However, this distance could not be set too small; otherwise, the cantilever would touch the sample. If the distance is too large, MSZ and the magnetostatic force will be too small, resulting in low measurement accuracy. The optimized distance was eventually adopted as 1 mm.

3.2. Experimental Detection of Pipe Defects

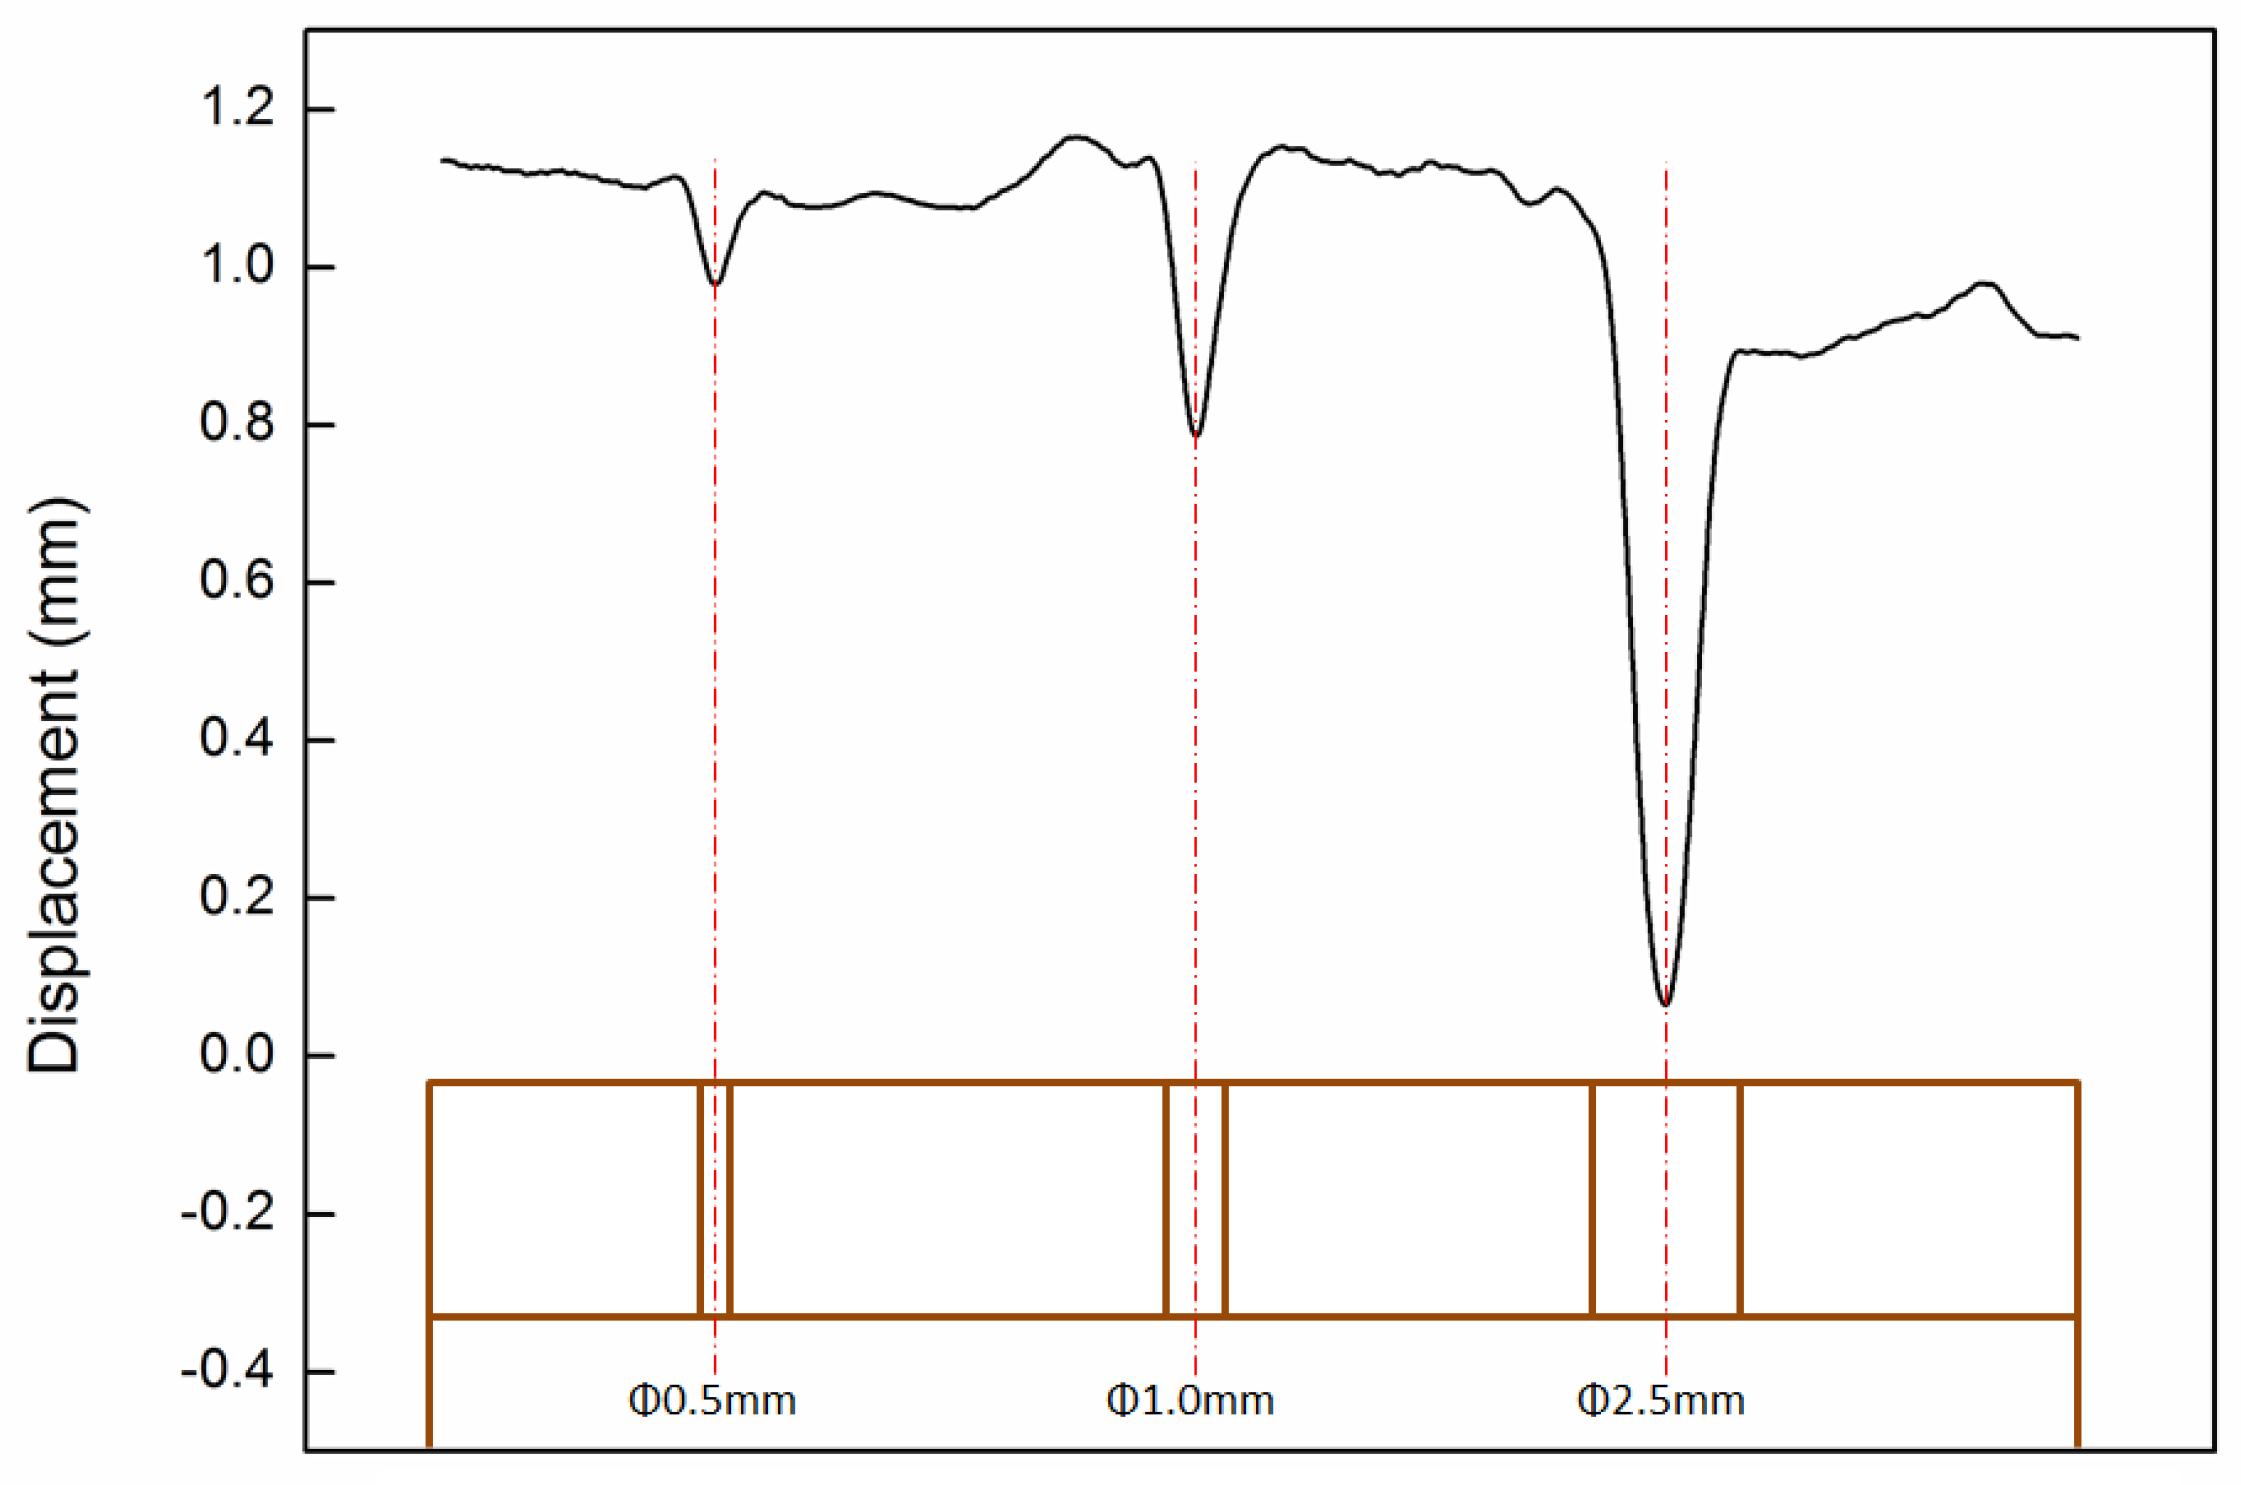
The magnetostatic force sensor was applied to detect hole defects with different diameters in a pipe sample. The signals generated from these defects are shown in Figure 4. It is clear that the as-developed sensor could effectively distinguish defects with different sizes. The signal amplitude was proportional to the hole defect diameter. In Figure 4, the baseline represents the irregular surface of the steel pipe and the displacement along the Y-axis represents the distance between the permanent magnet and the laser source. The change in the distance was influenced by the magnetostatic force. Moreover, the change in the hole defect diameter influenced the reflecting time. The accuracy of the generated signals was low because the reflecting time gradually became short.

3.3. Depth Detection of Slot Defects

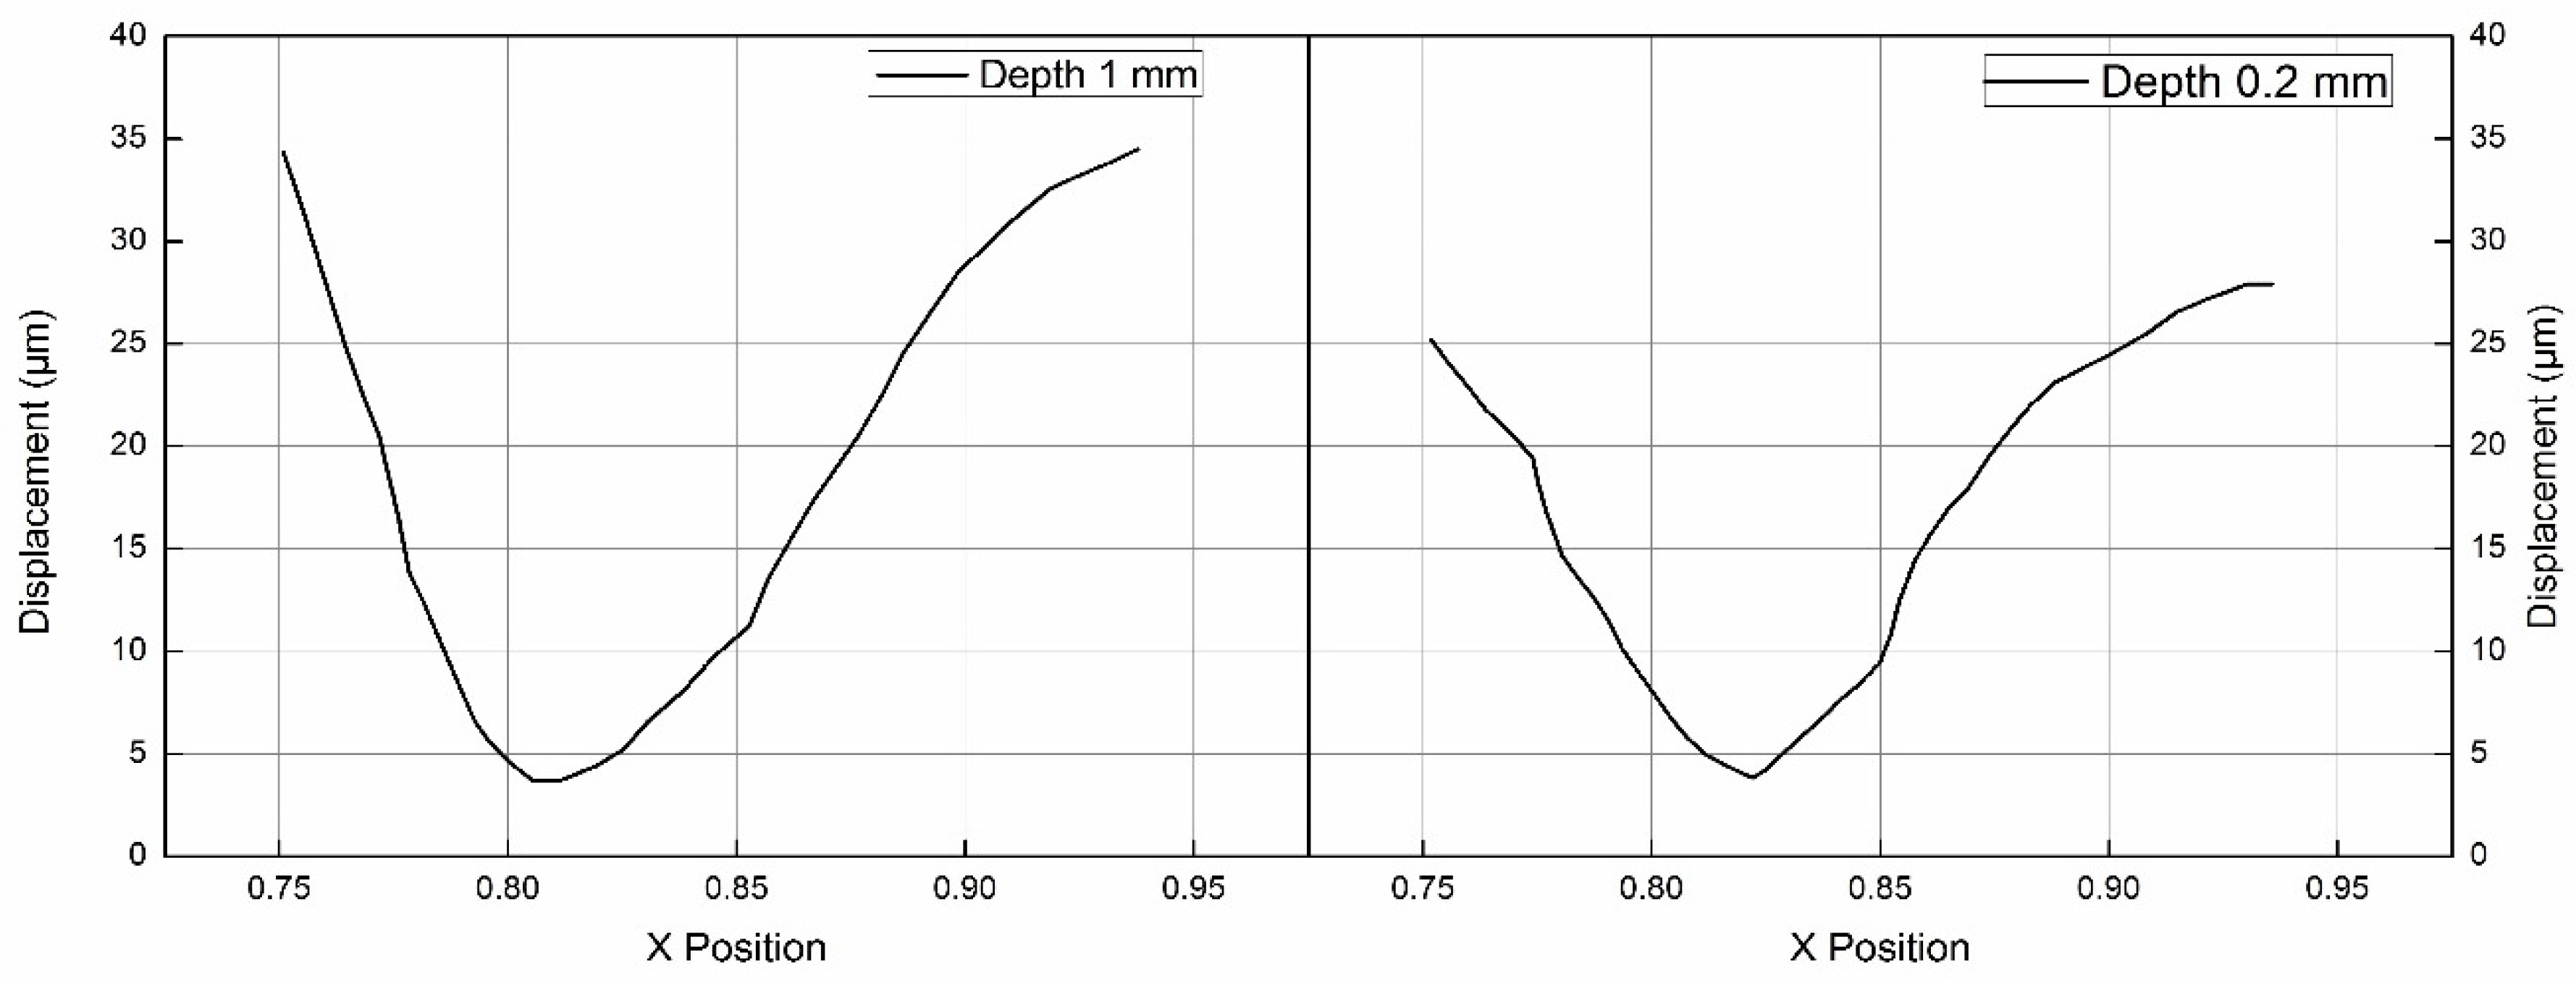
In Figure 5, the X and the Y-axis represent slot defect locations and the displacement with the same interval. Pulse signals contained information regarding the flaws, such as slot defects, width, and depth. However, the signal width and depth were not in accordance with the width and depth of the slot defect. This discrepancy occurred because when a flaw entered MSZ, the permanent magnetic probe detected it and influenced the magnetostatic force. Therefore, the signal width was related to both the flaw width and the dimensions of MSZ.
The depths of the signals were directly proportional to the depths of the slot defects. The depths of the two flaws actually differed by a factor of five; however, the measurement results greatly differed from this ratio. This difference occurred because the signals generated from the two flaws were very close to each other. Moreover, as the penetration range was limited to MSZ, it could not reach all of the flaws. The real depth was detected from the signal reflecting the 1 mm depth flaw. In summary, the detected signals were sensitive to the width and depth of the flaws. Because the pulse signal can be easily analyzed, we could obtain information regarding the flaw, including amplitude, width, start, and end.

4. Numerical Models and Results

4.1. Numerical Analysis of Magnetostatic Force

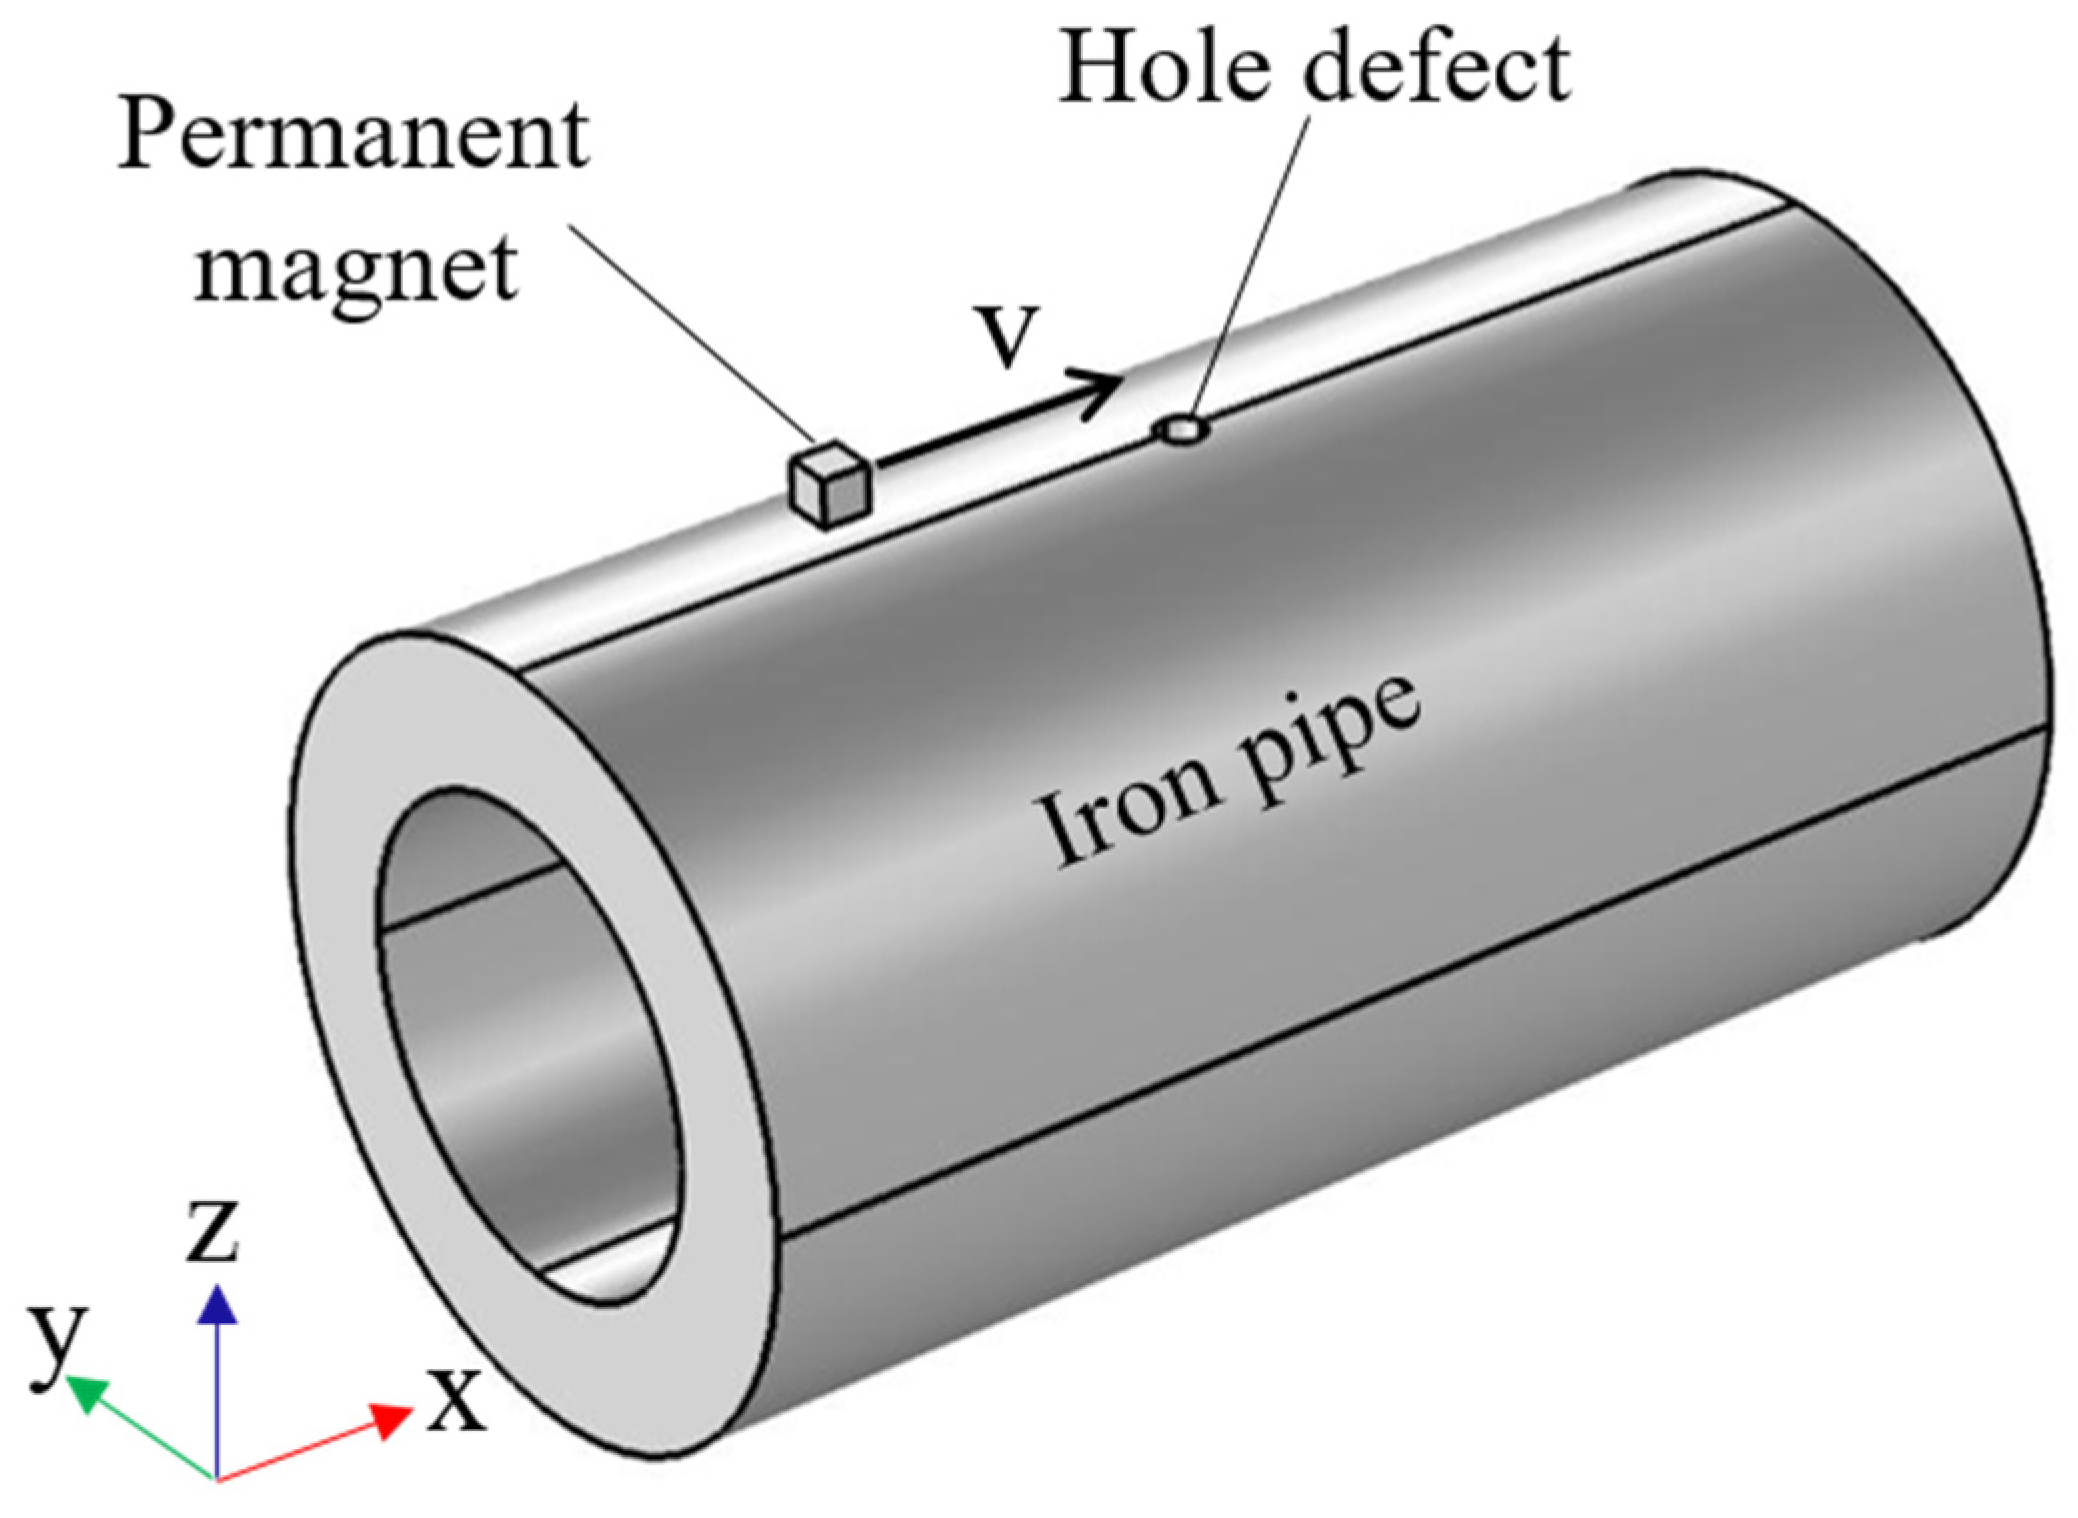
A three-dimensional numerical model for the magnetostatic force was constructed using the finite element method (FEM) by COMSOL (Version 6.0, COMSOL Inc., Stockholm, Sweden), as shown in Figure 6. The model was built by using the “Magnetic Fields, No Currents (mfnc)” physics module and stationary solver. The origin of the model was located at the center of the middle cross-section of the iron pipe. The parameters used in this numerical model were consistent with the experiment. The evolution of the magnetic field could be easily obtained according to the following governing equations:
H = V m
( μ 0 μ r H ) = B = 0
The boundary condition was the magnetic insulation in the geometry domain, e.g.,
n B = 0
where H, Vm, μ0, μr, n, and B are the magnetic field intensity, scalar magnetic potential, relative permeability, vacuum permeability, normal vector, and magnetic induction intensity, respectively. The parameters used in this numerical model are listed in Table 1.
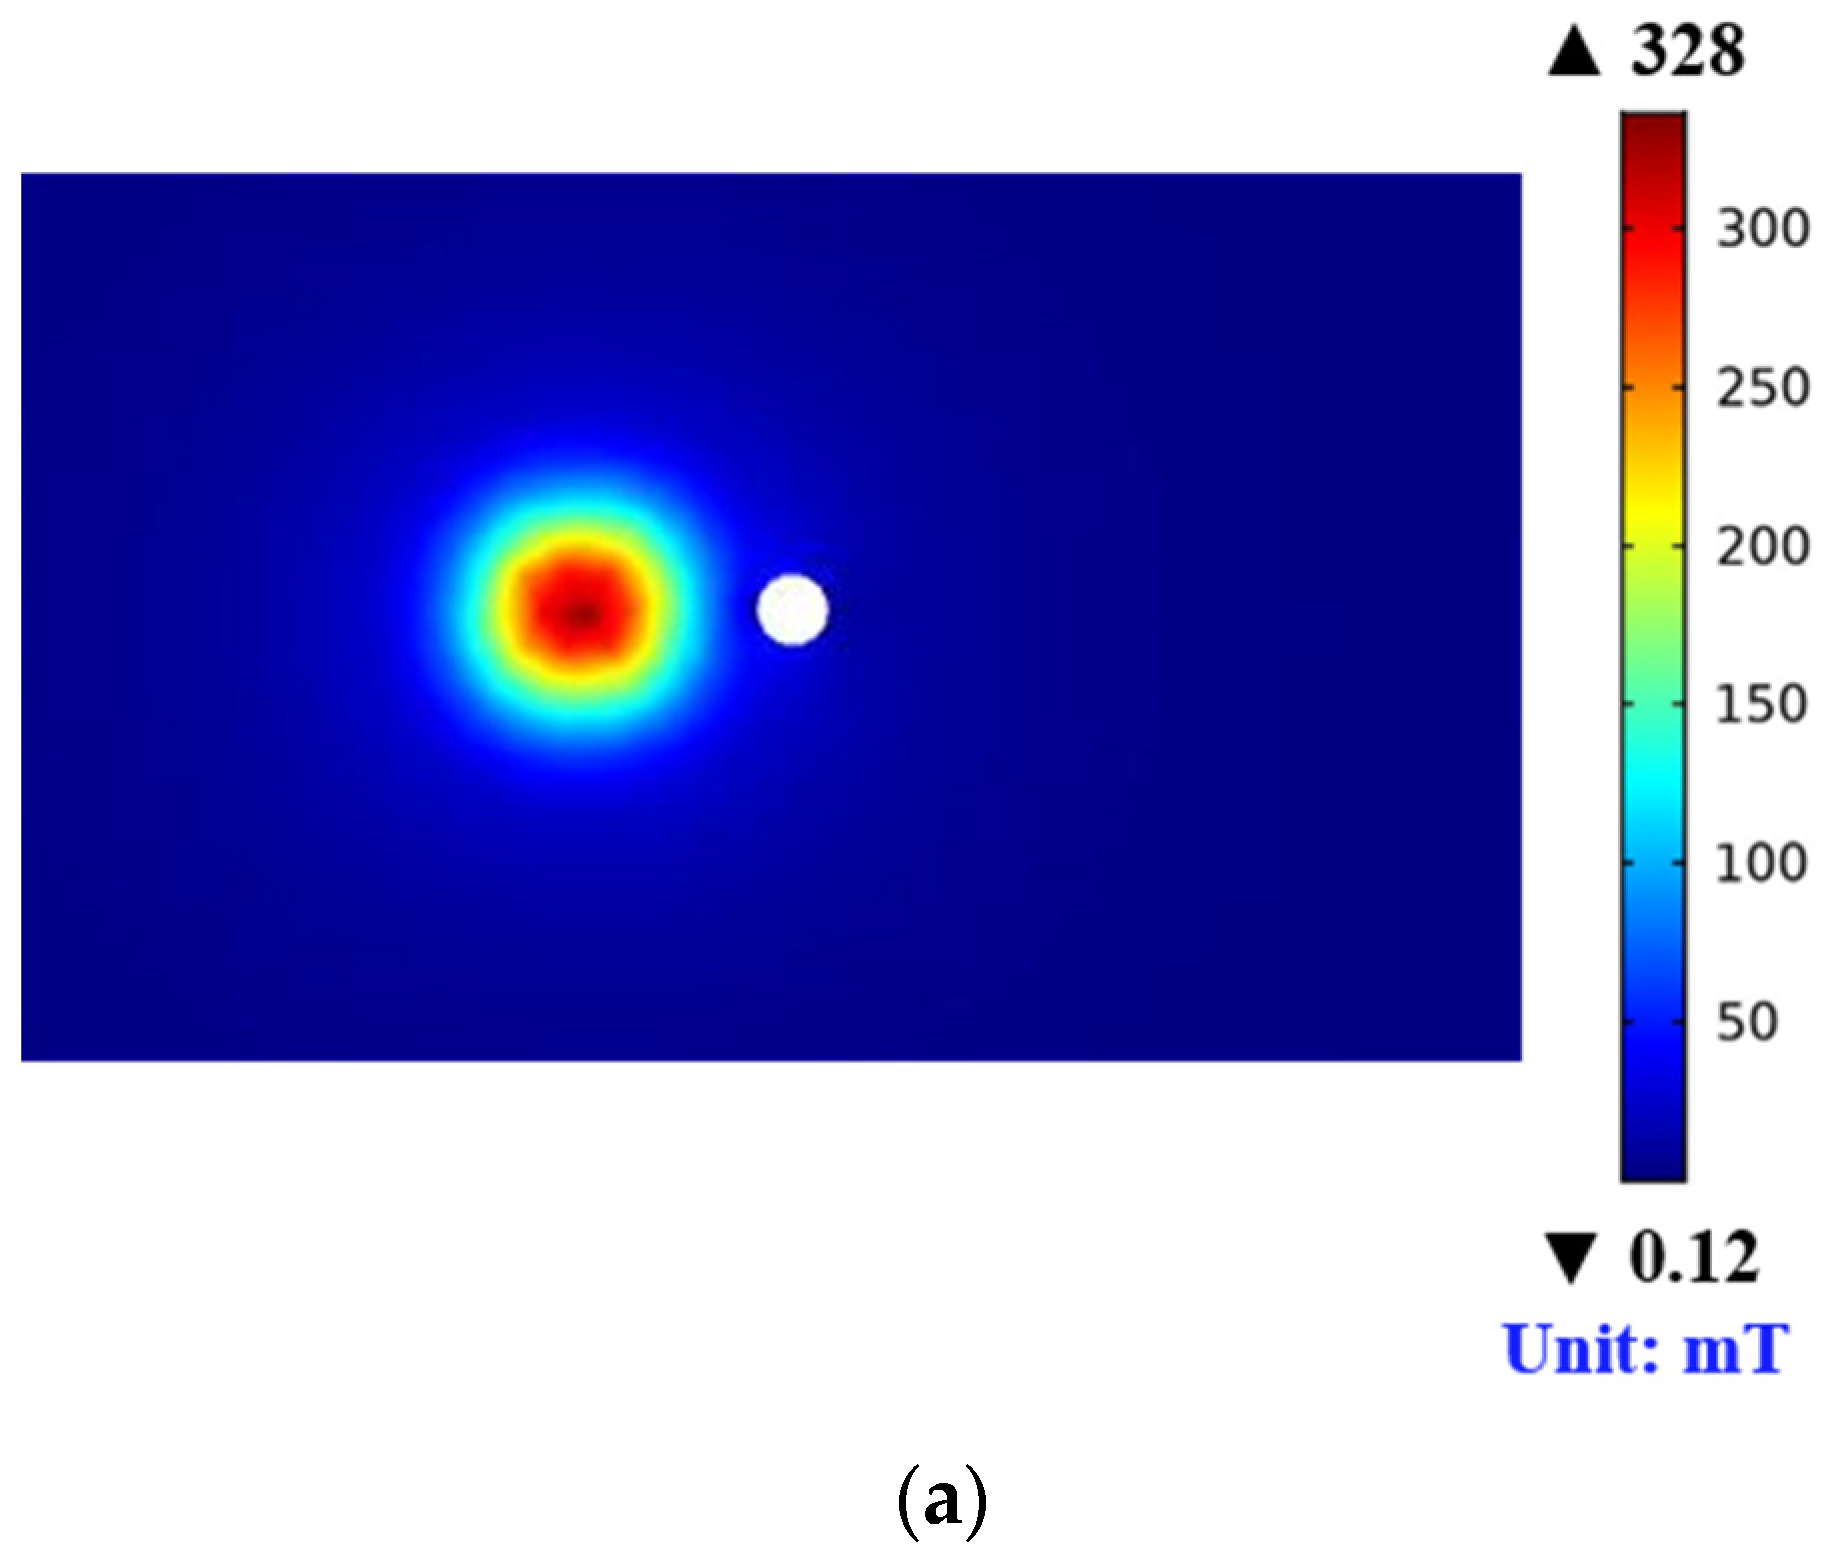
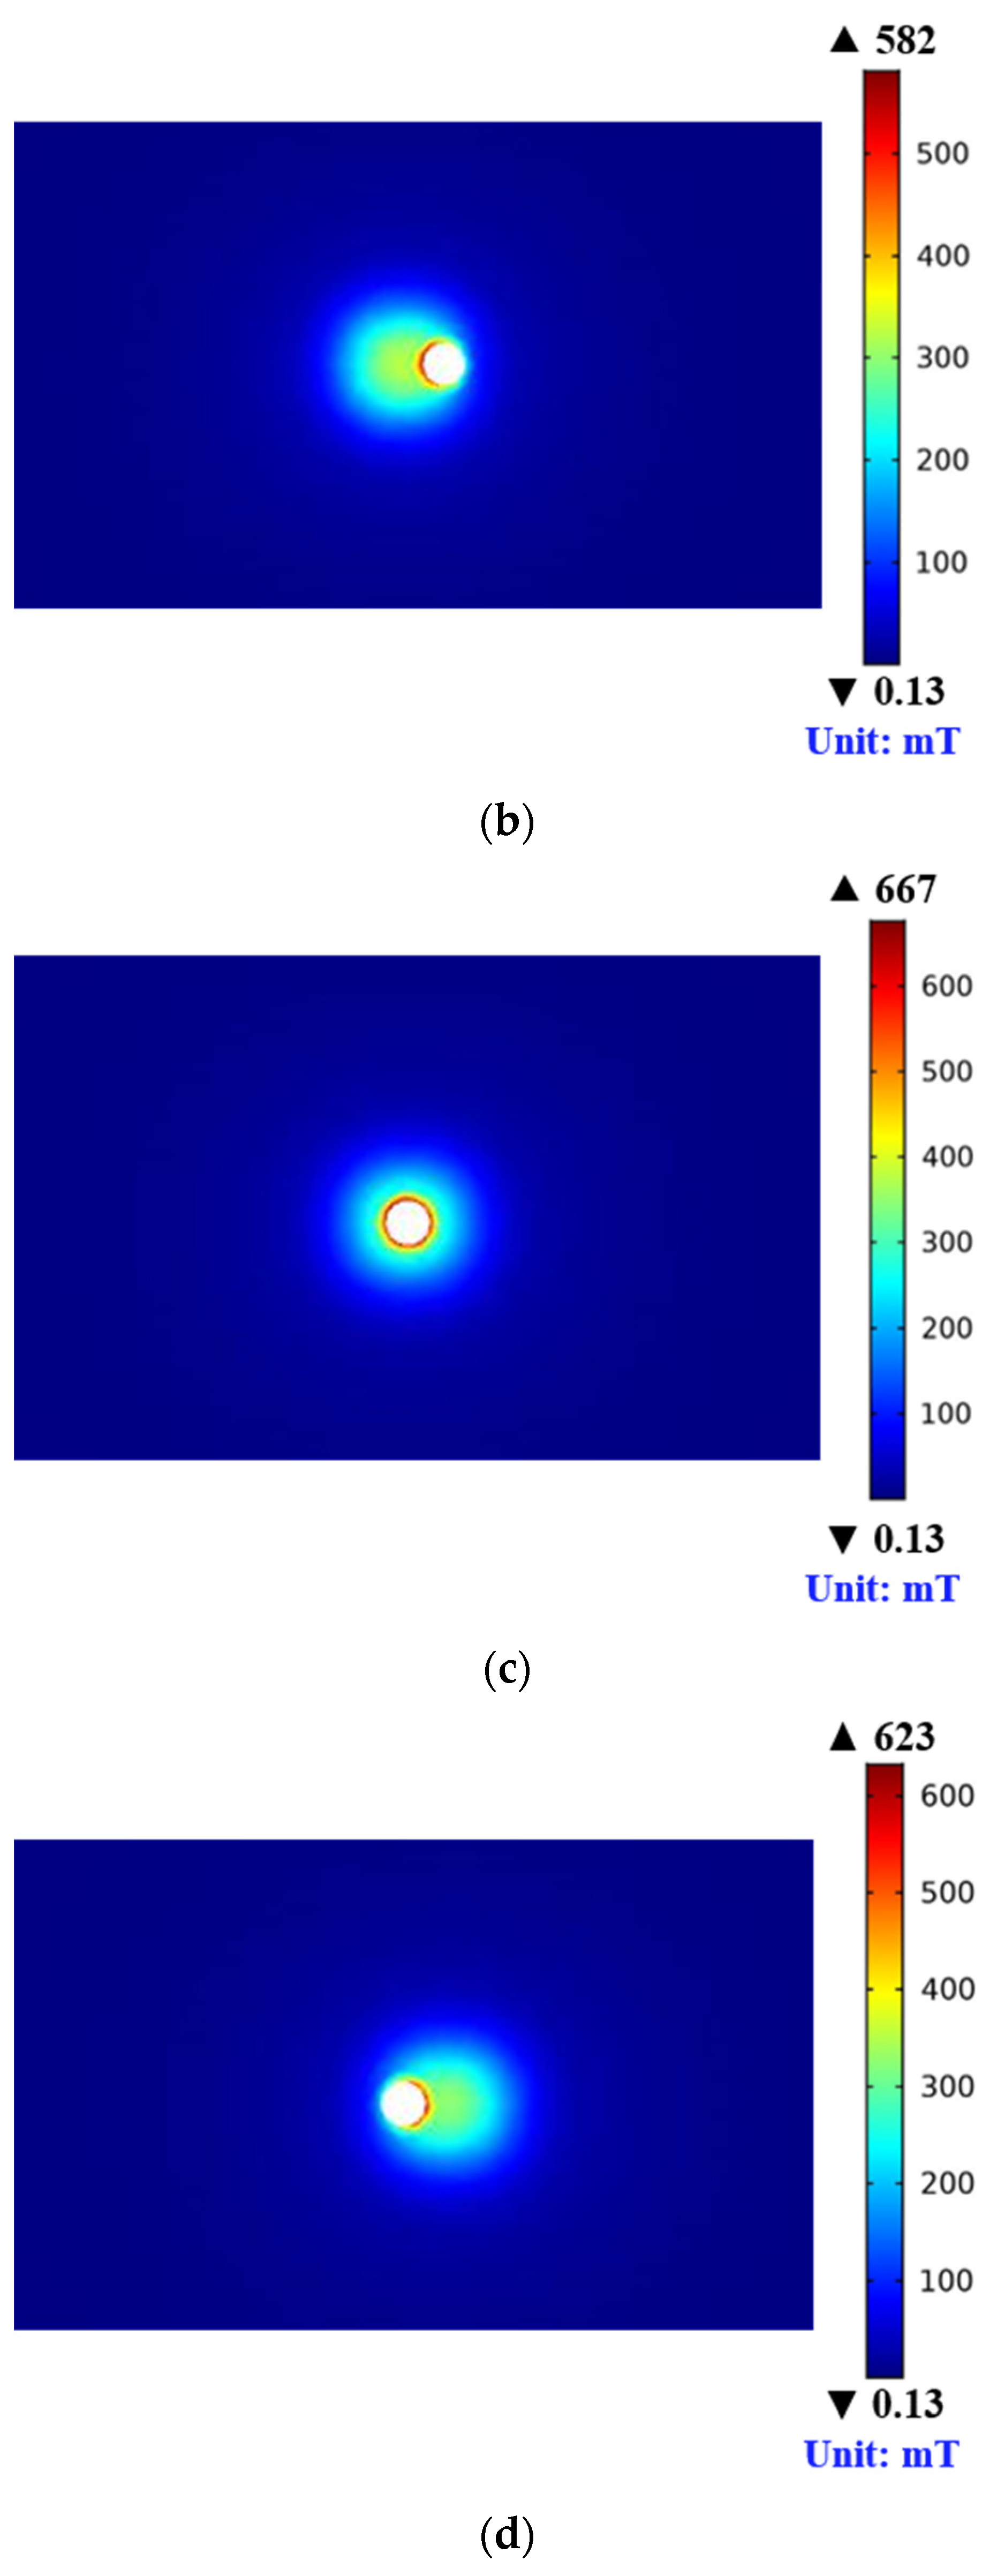
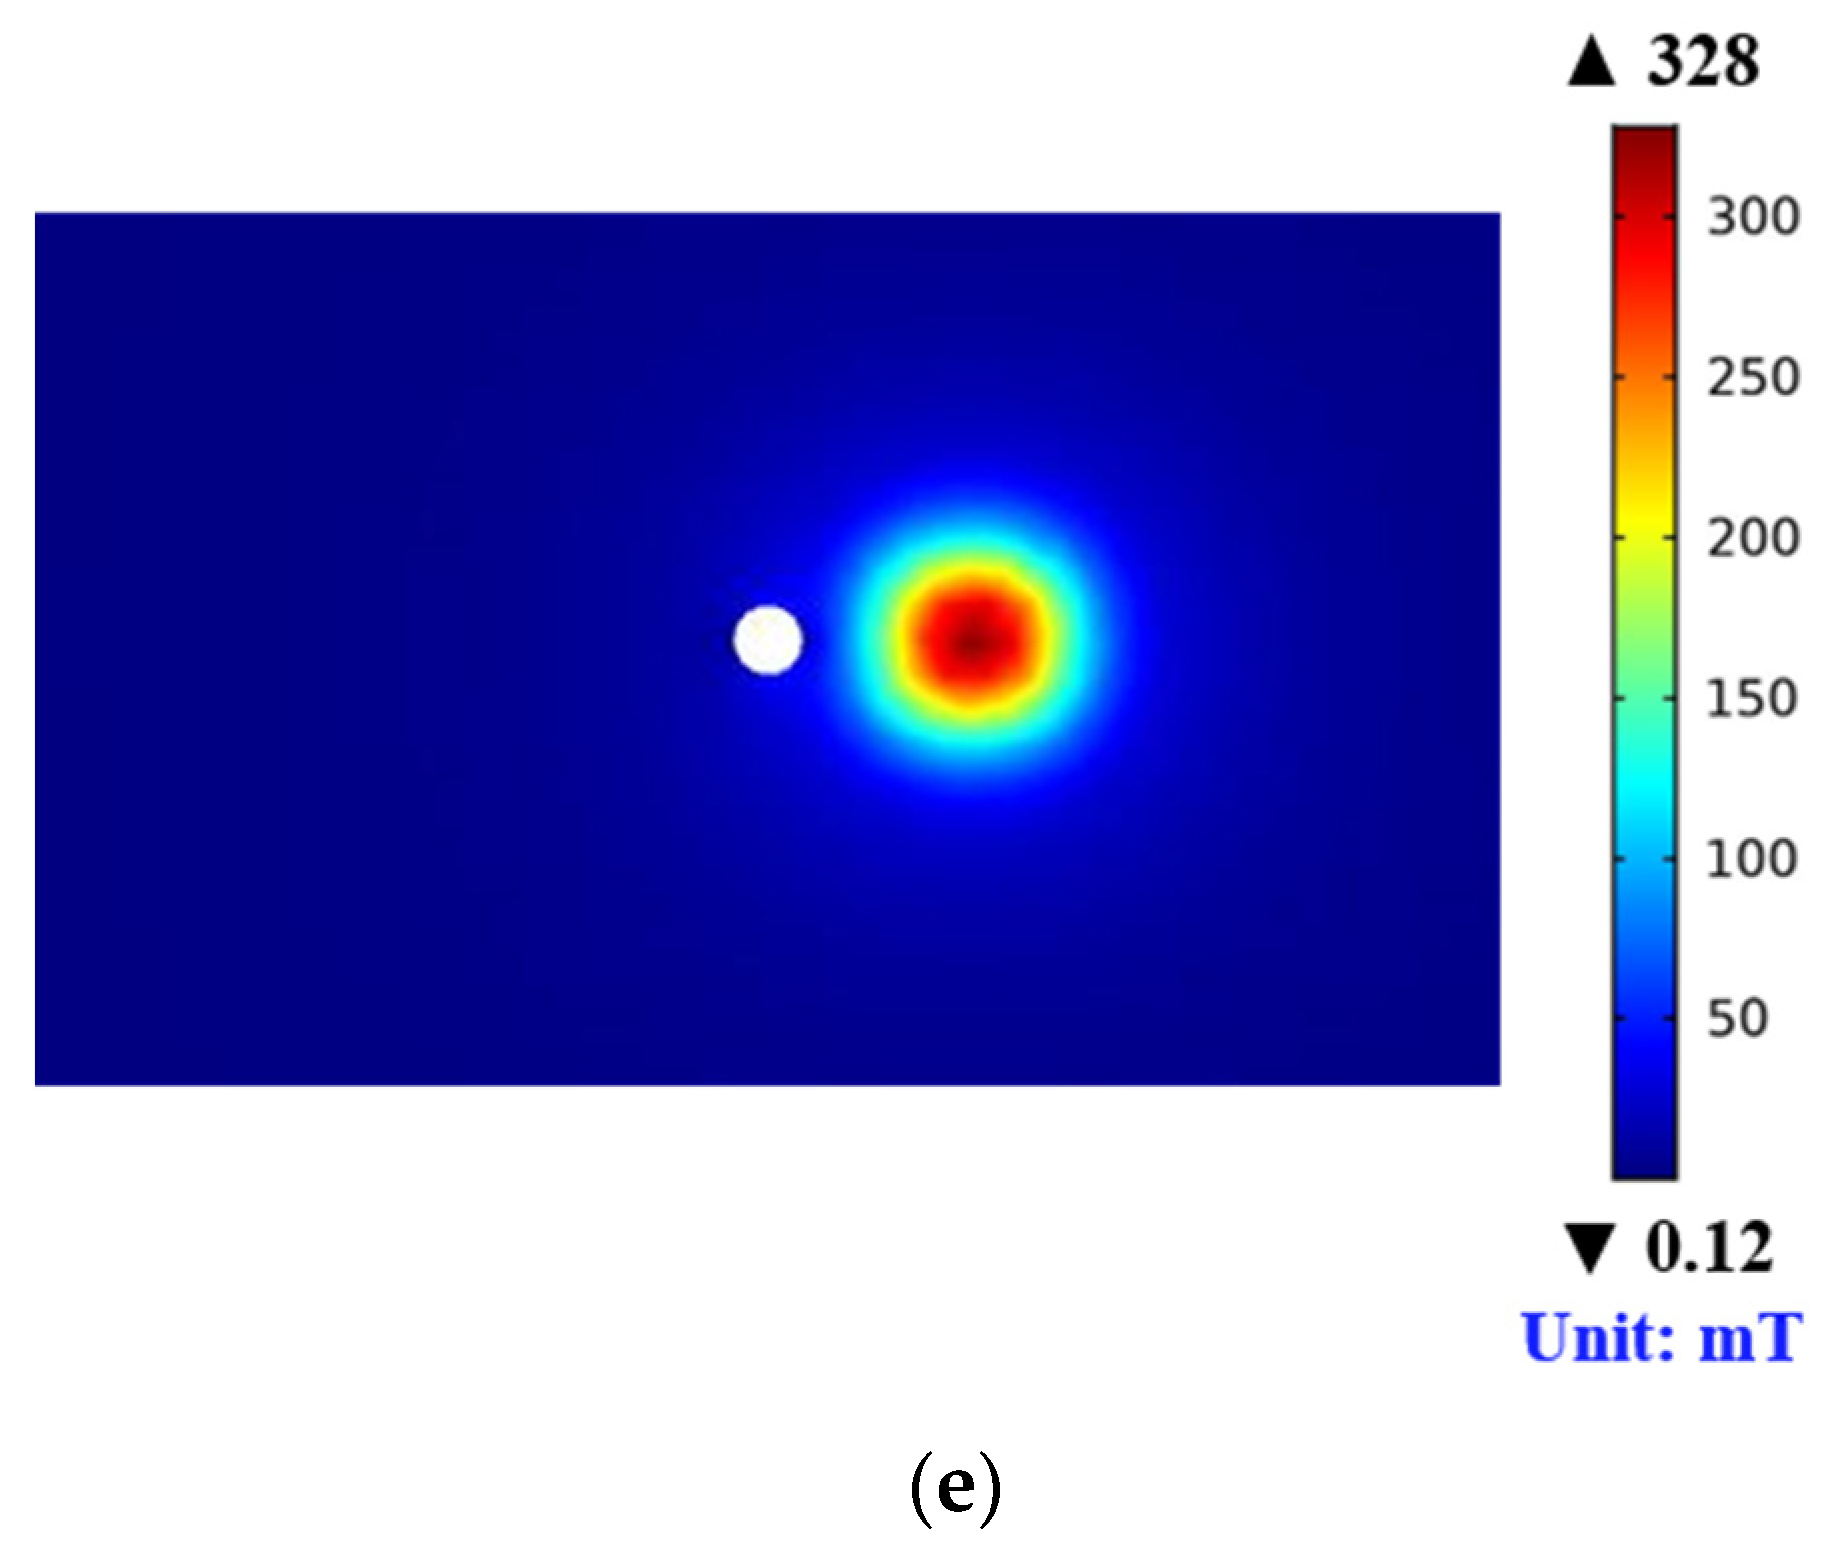
In this article, the magnetic field was simulated when the sensor passed the defect, as shown in Figure 7. Five positions were selected to display the variation in the magnetic field. Clearly, the distinct force measurement positions from the magnetic field maps shown in Figure 7 indicate that the magnetic field is redistributed by the hole defect. When the hole defect was present at different positions, the magnetic flux density was quite different, and the values of the magnetic flux density significantly increased when the hole defect entered the core of the MSZ because of the edge effect. This difference in the magnetic flux density was the root cause of the defect and generated the magnetostatic force change.
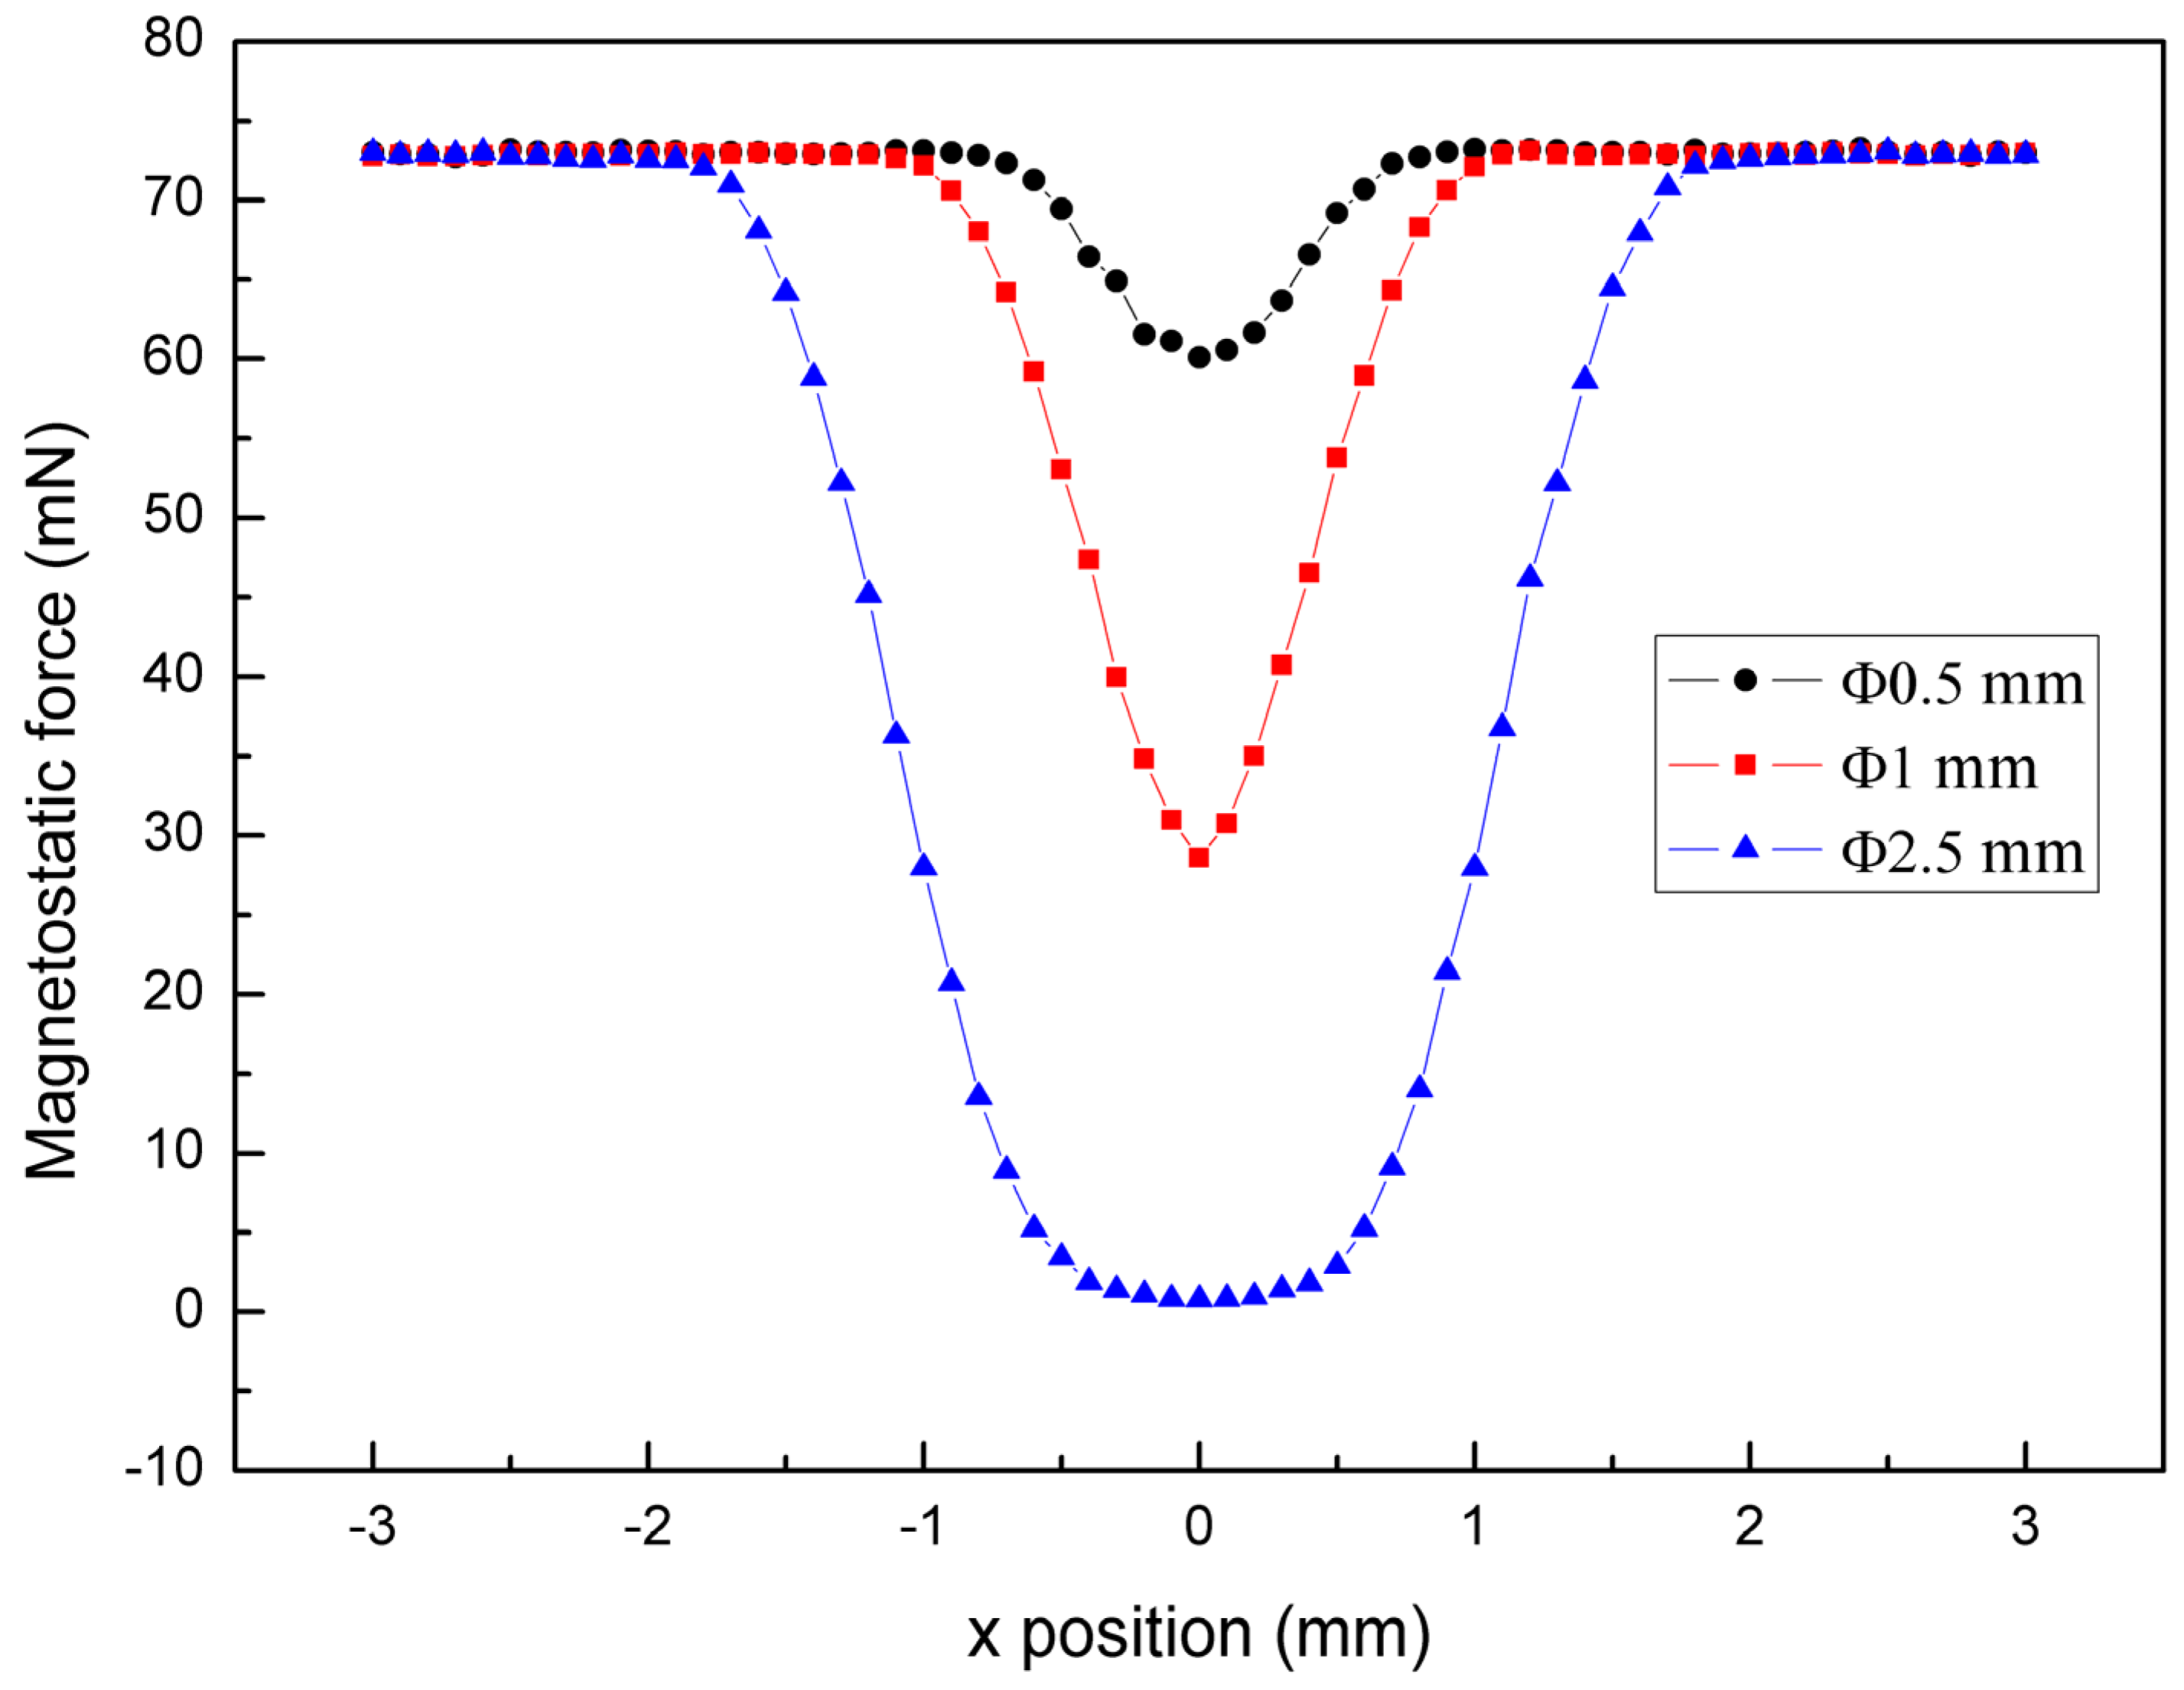
Then, magnetostatic force changes caused by three different diameters of hole defects were investigated using the above numerical model. The coordinate for the hole defect was x = 0 mm. A total of 61 positions were selected between (−3 mm and 3 mm) with auniform gap of 0.1 mm, as seen in the scattered data in Figure 8. These positions could be used to demonstrate the whole process of the defect passing through the sensor. The magnetostatic force was calculated position by position. The “Parametric Sweep” tool was employed to realize and simplify the calculation process. The initial magnetostatic force was constant at 73 mN, as shown in Figure 8. When the flaw passed the permanent magnet, the magnetostatic force decreased rapidly. After the flaw left MSZ, the magnetostatic force returned to 73 mN. The larger the diameter of the hole defect, the larger the magnetostatic force changes. When the hole defect with a diameter of 2.5 mm entered the core of the MSZ, the magnetostatic force almost decreased to zero and lasted a while because the size of the hole was significantly larger than the permanent magnet.

4.2. Numerical Analysis of the Cantilever Beam Displacement

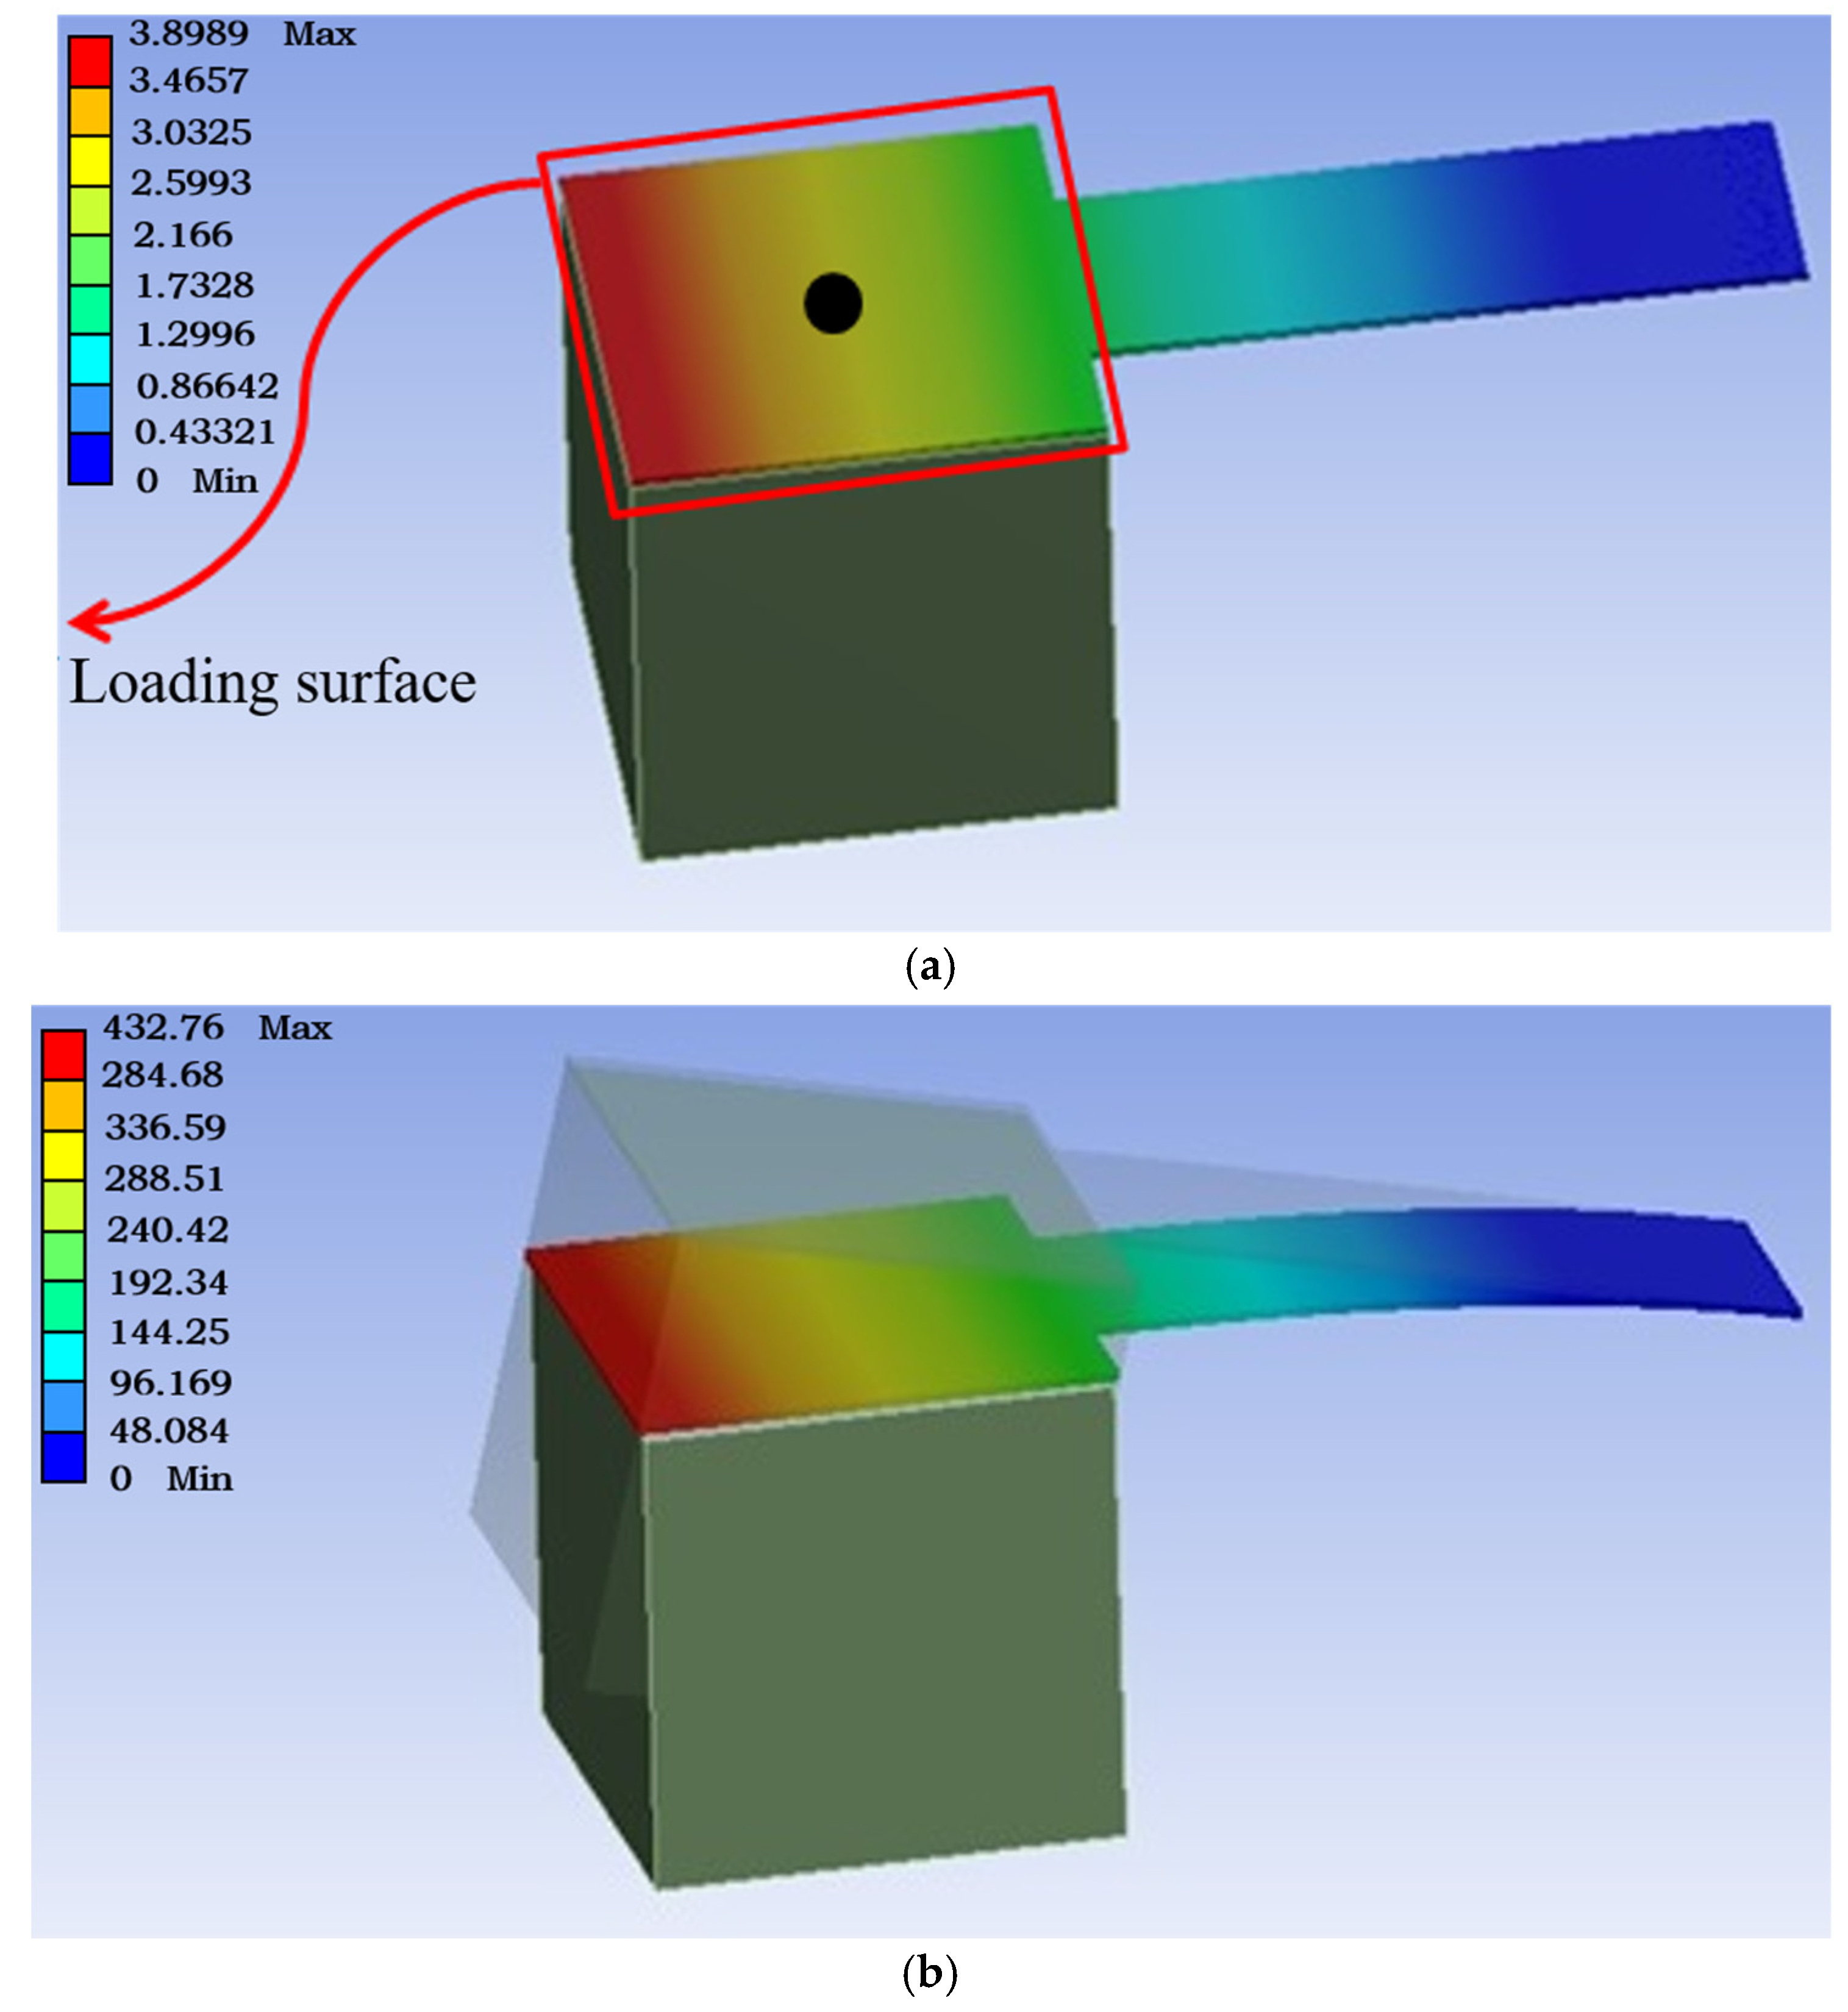
We developed another numerical model to calculate the displacement of the cantilever beam using the FEM, as shown in Figure 9. The magnetostatic force of the Φ 0.5 mm hole, calculated using the previous model, was loaded on the entire model surface to obtain the displacement data, as shown in Figure 9a. The displacement occurred in the middle of the loading surface, which is located at the black point shown in Figure 9a.
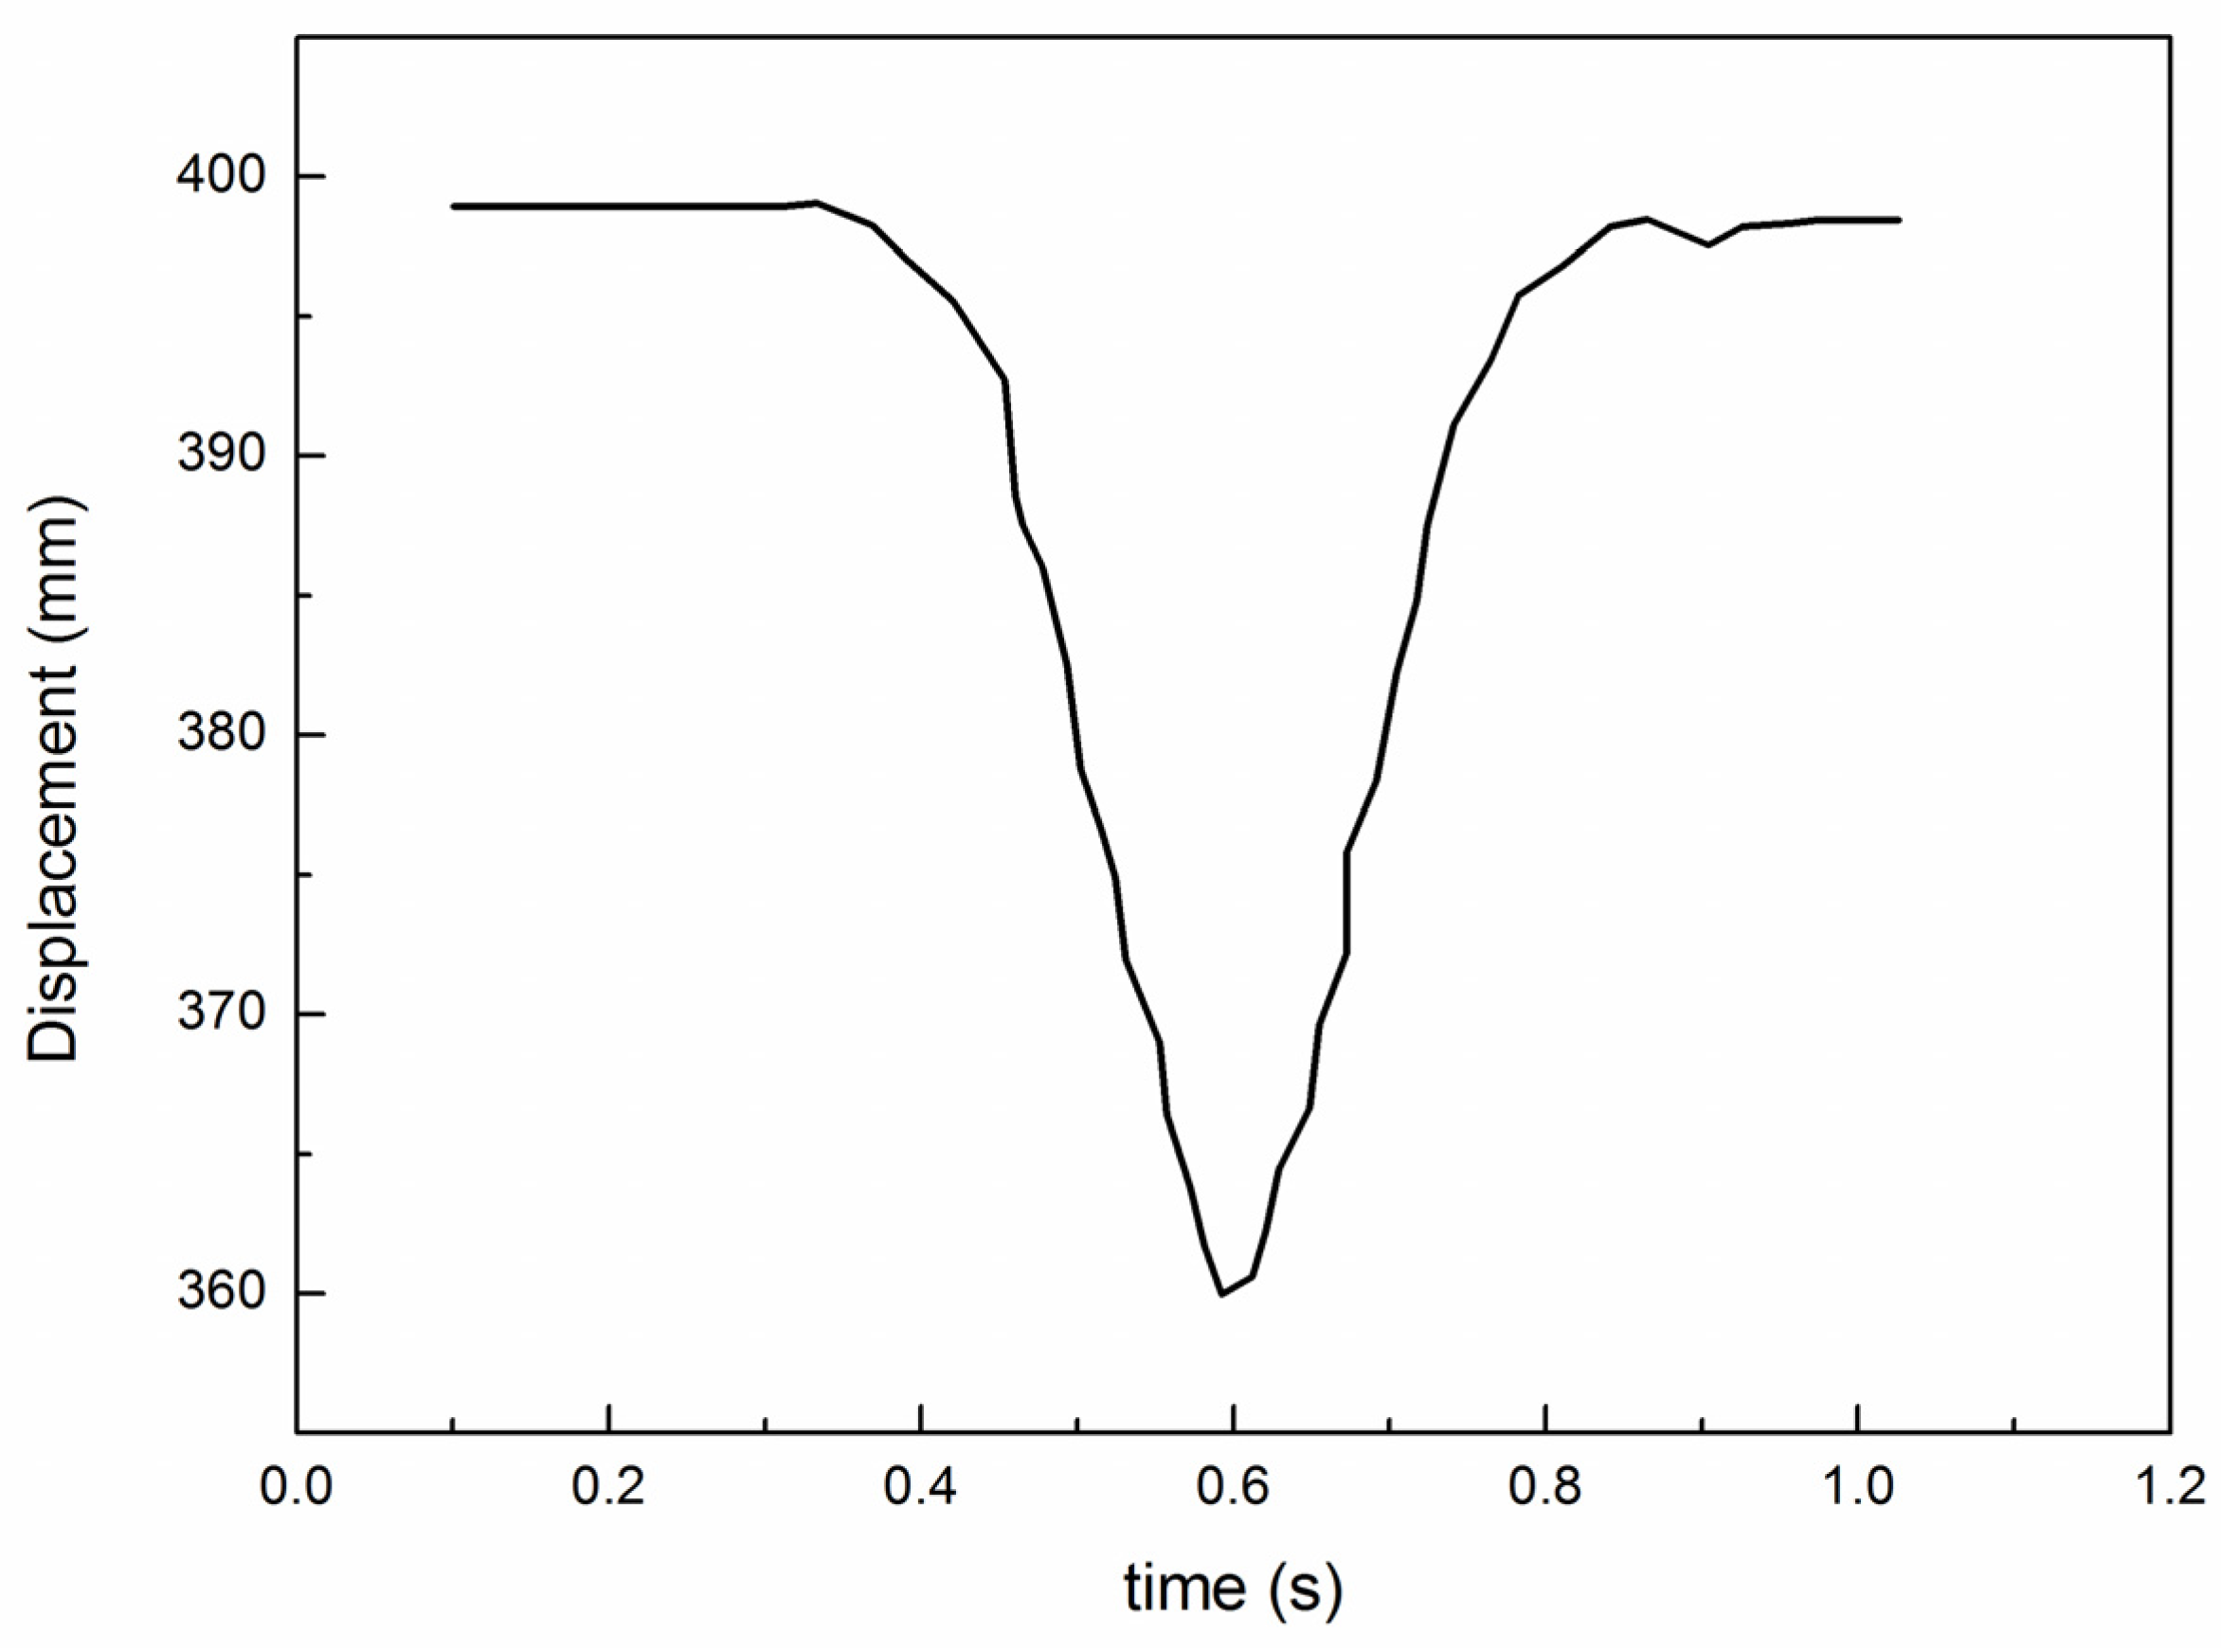
The maximum and actual displacements of the cantilever beam were 40 μm and 38 μm, respectively. This caused a discrepancy between the distance of the permanent magnet and the sample. The distance was constant during the simulation. However, the actual experimental conditions were more complicated than the numerical ones. The displacement curve of the cantilever beam obtained by the numerical simulation is shown in Figure 10.
In the actual experiment, a constant magnetostatic force existed at the start of the detection process, and the cantilever beam was pre-stressed. When a defect passed the MSZ, the magnetostatic force and the shape of the cantilever changed. However, the strain rate history and the stress–strain relationship both affected the structural response of the cantilever beam. The other factor that caused the difference between the numerical and experimental results was the distance between the sample and the sensor. The distance varied with the magnetostatic force, whereas the force changed the distance. This behavior is an example of bidirectional physical process coupling.

5. Conclusions and Perspective

In this article, a novel magnetostatic force sensor was used for the non-contact defect inspection of ferromagnetic materials. A series of measurements of an actual iron pipe were conducted based on a prototype experimental device to verify the reliability of the measurement sensor. Furthermore, two numerical models were developed to plot the curves of the magnetostatic force and the cantilever beam displacement. Furthermore, numerical results were compared with experimental findings. Both numerical and experimental results verified the reliability of this sensor.
In summary, the magnetostatic force sensor developed in this work could be successfully used in the metallurgy industry because of its reliability and simple architecture. In comparison to the magnetic flux leakage non-destructive testing method, the proposed method has higher accuracy. For potential industrial applications in the future, the enormous influence of complex industrial environmental conditions on measurement techniques should be considered. Such conditions include mechanical vibration, electromagnetic interference, high temperature, etc., all of which complicate measurements.

Author Contributions

Conceptualization, Methodology, Formal analysis, Investigation, Writing—original draft, B.W.; Writing—review and editing, Data curation, Validation, Visualization, B.W., S.Z. and X.C.; Supervision, Resources, F.W.; Project administration, Funding acquisition, B.W., F.W. and B.X. All authors have read and agreed to the published version of the manuscript.

Funding

This research was funded by the Scientific and Technological Innovation Programs of Higher Education Institutions in Shanxi [Grant Number 2020L0565]; the Doctoral Research Launch Project of Yuncheng University [Grant Number YQ-2022004 and YQ-2019005]; the Research Fund for the Excellent Doctoral Program of Shanxi Province [Grant Number QZX-2019010]; and the Industrial Information Transformation and Promotion Collaborative Innovation Center Construction Program of “1331 Project” in Shanxi Province.

Institutional Review Board Statement

Not applicable.

Informed Consent Statement

Not applicable.

Data Availability Statement

Data are available from the authors upon reasonable request.

Conflicts of Interest

The authors declare no conflict of interest.

References

  1. Saguy, H.; Rittel, D. Flaw detection in metals by the ACPD technique: Theory and experiments. NDT E Int. 2007, 40, 505–509. [Google Scholar]
  2. Zhang, W.; Wang, G.; Zhang, Y.; Cheng, G.; Zhan, Z. Formation Mechanism and Improvement of Magnetic Particle Inspection Defects in Cr5 Backup Roller Forged Ingot. Metals 2022, 12, 295. [Google Scholar] [CrossRef]
  3. Rosado, L.S.; Santos, T.G.; Piedade, M.; Ramos, P.M.; Vilaça, P. Advanced technique for non-destructive testing of friction stir welding of metals. Measurement 2010, 43, 1021–1030. [Google Scholar] [CrossRef]
  4. Williams, C.; Borigo, C.; Rivière, J.; Lissenden, C.J.; Shokouhi, P. Nondestructive Evaluation of Fracture Toughness in 4130 Steel Using Nonlinear Ultrasonic Testing. J. Nondestruct. Eval. 2022, 41, 13. [Google Scholar] [CrossRef]
  5. Zhao, M.; Nie, Z.; Wang, K.; Liu, P.; Zhang, X. Nonlinear ultrasonic test of concrete cubes with induced crack. Ultrasonics 2019, 97, 1–10. [Google Scholar] [CrossRef] [PubMed]
  6. Kim, F.H.; Pintar, A.L.; Obaton, A.F.; Fox, J.C.; Tarr, J.; Donmez, A.M. Merging experiments and computer simulations in X-ray Computed Tomography probability of detection analysis of additive manufacturing flaws. NDT E Int. 2021, 119, 102416. [Google Scholar]
  7. Cotter, D.J.; Koenigsberg, W.D. Improving Probability of Flaw Detection in Ceramics by X-ray Imaging Energy level Optimization. J. Am. Ceram. Soc. 1990, 73, 1763–1765. [Google Scholar] [CrossRef]
  8. Chen, W.; Wu, D.; Wang, X.; Wang, T. A self-frequency-conversion eddy current testing method. Measurement 2022, 195, 111129. [Google Scholar] [CrossRef]
  9. Gong, Z.; Yang, S. Metamaterial-Core Probes for Nondestructive Eddy Current Testing. IEEE Trans. Instrum. Meas. 2021, 70, 3505209. [Google Scholar] [CrossRef]
  10. Zhao, Y.; Wei, G.; Han, J.; Cai, W.; Chen, H.E.; Chen, Z. Enhancement of crack reconstruction through inversion of eddy current testing signals with a new crack model and a deterministic optimization method. Meas. Sci. Technol. 2022, 33, 055011. [Google Scholar] [CrossRef]
  11. Drinkwater, B.W.; Wilcox, P.D. Ultrasonic arrays for non-destructive evaluation: A review. NDT E Int. 2006, 39, 525–541. [Google Scholar]
  12. Sumarto, S.; Yulianti, I.; Addawiyah, A.; Setiawan, R. Optimization of exposure factors for X-ray radiography non-destructive testing of pearl oyster. J. Phys. Conf. Ser. 2018, 983, 012004. [Google Scholar]
  13. Zhang, H.; Wang, Y.; Wang, H.O.; Huo, D.X.; Tan, W.S. Room-temperature magnetoresistive and magnetocaloric effect in La1−xBaxMnO3 compounds: Role of Griffiths phase with ferromagnetic metal cluster above Curie temperature. J. Appl. Phys. 2022, 131, 043901. [Google Scholar] [CrossRef]
  14. Wang, Z.; Yu, Y. Traditional Eddy Current–Pulsed Eddy Current Fusion Diagnostic Technique for Multiple Micro-Cracks in Metals. Sensors 2018, 18, 2909. [Google Scholar] [CrossRef]
  15. Shkatov, P. Combining eddy-current and magnetic methods for the defectoscopy pf ferromagnetic materials. Nondestruct. Test. Eval. 2013, 28, 155–165. [Google Scholar] [CrossRef]
  16. Schmidt, R.; Otterbach, J.M.; Ziolkowski, M.; Brauer, H.; Toepfer, H. Portable Lorentz Force Eddy Current Testing System with Rotational Motion. IEEE Trans. Magn. 2018, 54, 6200504. [Google Scholar] [CrossRef]
  17. Uhlig, R.P.; Zec, M.; Brauer, H.; Thess, A. Lorentz Force Eddy Current Testing: A Prototype Model. J. Nondestruct. Eval. 2012, 31, 357–372. [Google Scholar] [CrossRef]
  18. Otterbach, J.M.; Schmidt, R.; Brauer, H.; Ziolkowski, M.; Töpfer, H. Comparison of defect detection limits in Lorentz force eddy current testing and classical eddy current testing. J. Sens. Sens. Syst. 2018, 7, 453–459. [Google Scholar] [CrossRef]
  19. Weise, K.; Schmidt, R.; Carlstedt, M.; Ziolkowski, M.; Brauer, H.; Toepfer, H. Optimal Magnet Design for Lorentz Force Eddy-Current Testing. IEEE Trans. Magn. 2015, 51, 6201415. [Google Scholar] [CrossRef]
  20. Chen, X.Y.; Wang, X.D.; Ren, Z.M.; Tao, Z.; Na, X.Z.; Wang, E.G. A magnetostatic force inspection method for monitoring the oscillation marks of continuous casting. Meas. Sci. Technol. 2015, 26, 115601. [Google Scholar] [CrossRef]
  21. Tao, Z.; Wang, X.D.; Chen, X.Y.; Na, X.Z. Theory of Magnetostatic Force Inspection Method for Monitoring the Oscillation Marks of Continuous Casting. Exp. Tech. 2016, 40, 1539–1547. [Google Scholar] [CrossRef]
  22. Binnig, G.; Quate, C.F.; Gerber, C. Atomic Force Microscope. Phys. Rev. Lett. 1986, 56, 930–933. [Google Scholar] [CrossRef] [PubMed] [Green Version]
  23. Sajid, N. Topography of Schwann cell with atomic force microscope. Chin. J. Phys. 2020, 68, 381–386. [Google Scholar] [CrossRef]
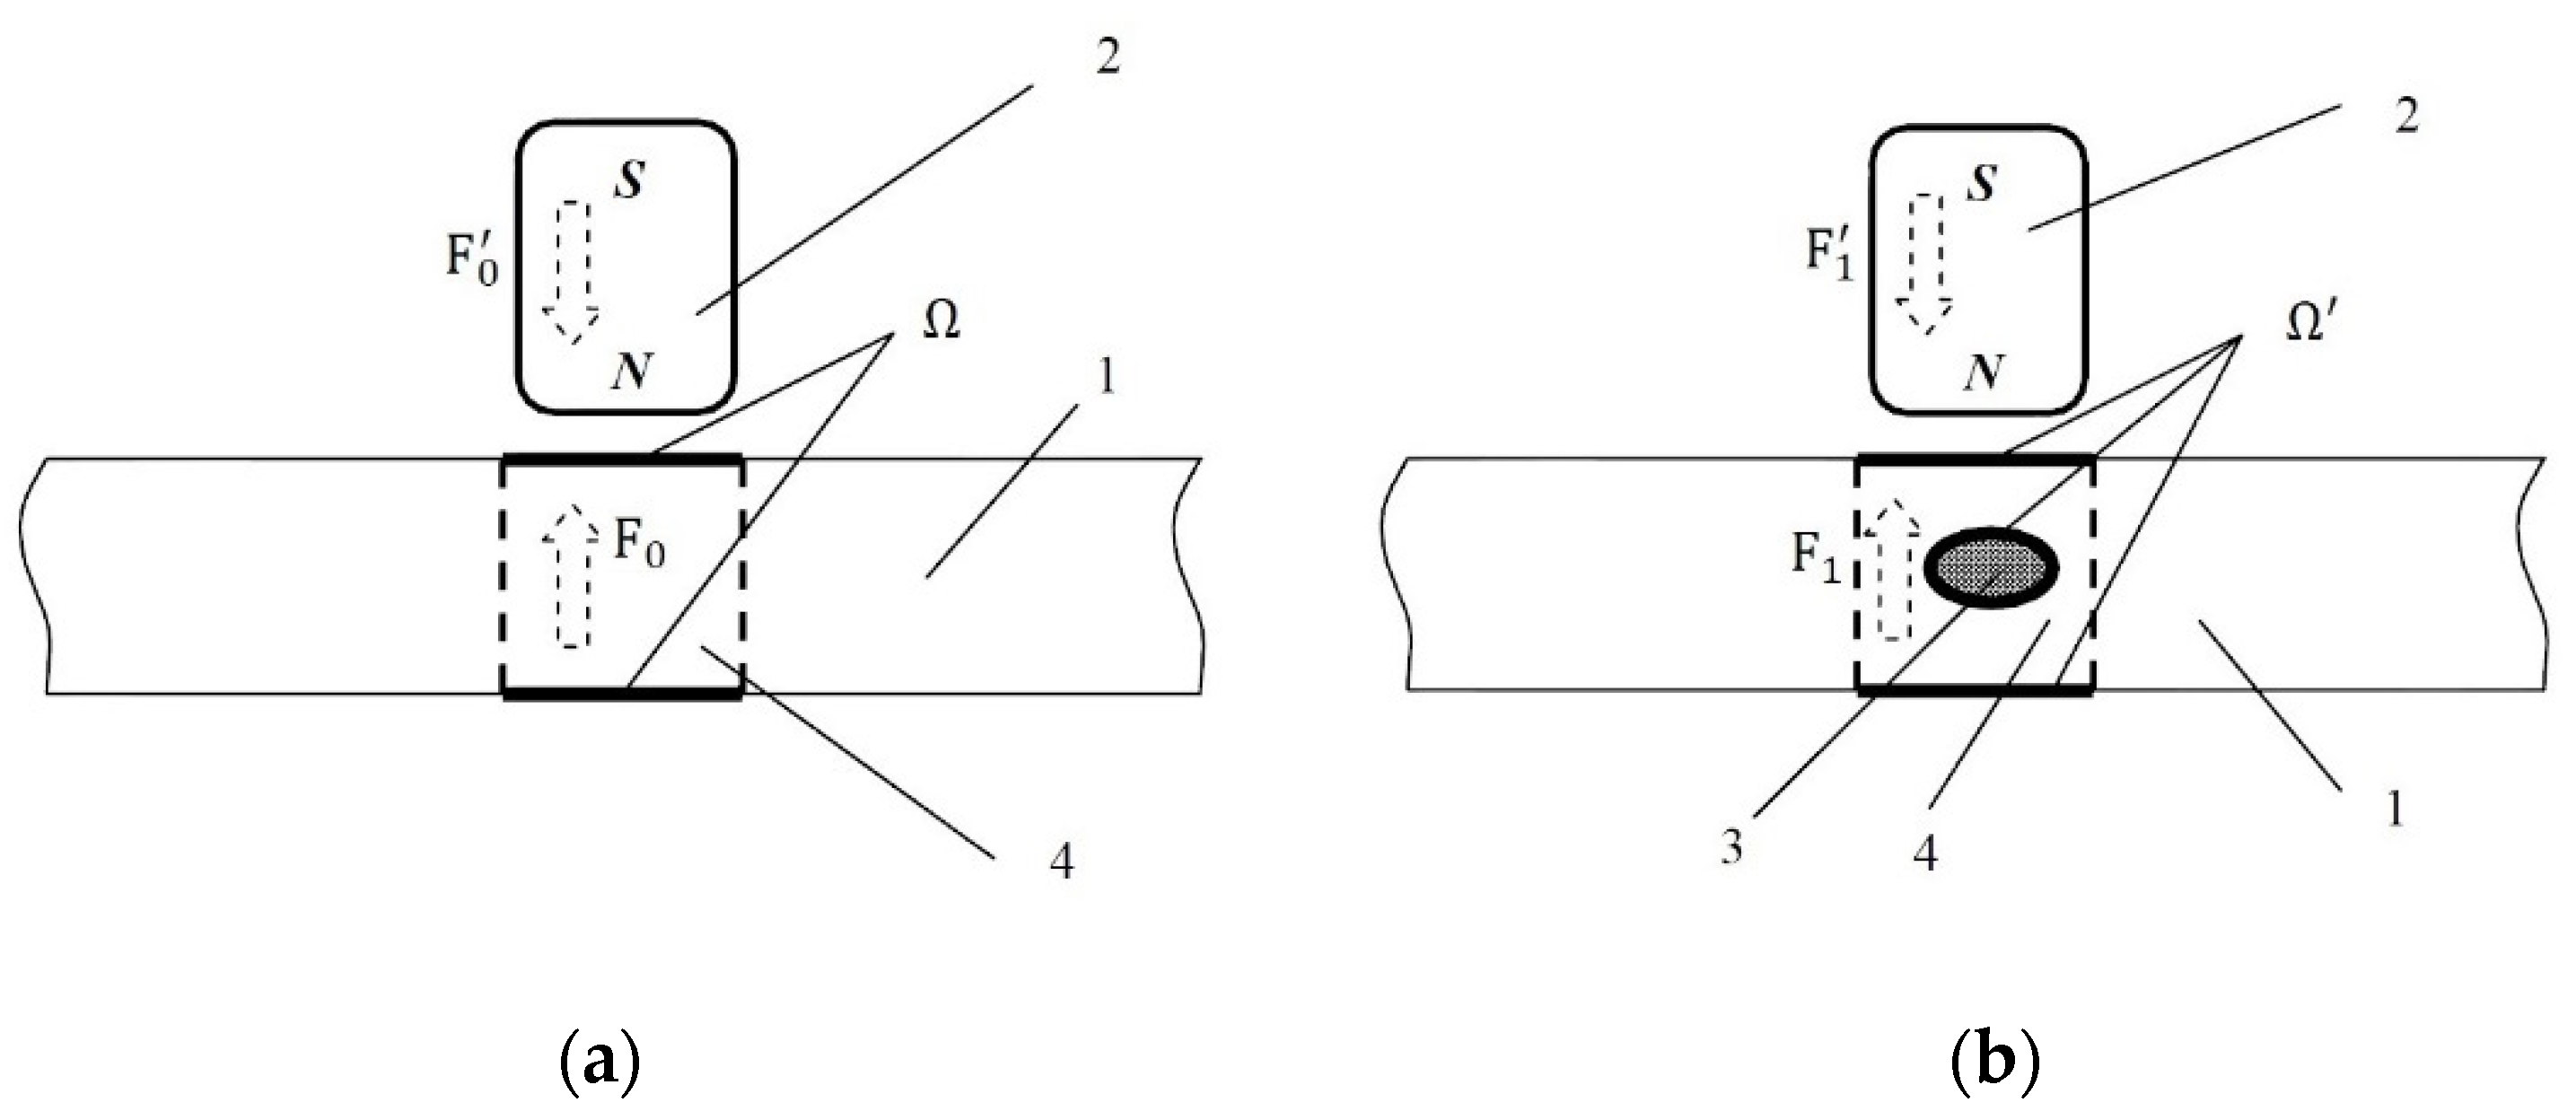
Figure 1. Flaw measurement principle by magnetostatic force: (a) Without flaws and (b) With a defect. (1—sample, 2—permanent magnet, 3—flaw, 4—magnetic sensing zone. Ω is the surface and Ω′ is the interface.).
Magnetochemistry 08 00182 g001
Figure 2. Magnetostatic force sensor used to detect small forces acting on the permanent magnet adhered to via elastic deformation of the cantilever beam. The solid and dotted lines represent the deformation of cantilever beam and the laser path with and without defects, respectively.
Magnetochemistry 08 00182 g002
Figure 3. Magnetostatic force sensor with the laser, cantilever beam and small permanent magnet. The inset shows the laser–cantilever–permanent magnet system.
Magnetochemistry 08 00182 g003
Figure 4. Output signals corresponding to hole defects with different sizes.
Magnetochemistry 08 00182 g004
Figure 5. Output signals corresponding to slot defects of different depths.
Magnetochemistry 08 00182 g005
Figure 6. Sketches of the numerical model for the magnetostatic force.
Magnetochemistry 08 00182 g006
Figure 7. Numerical results of the magnetic flux density distribution when the defect is at different positions: (a) x = −1.5 mm, (b) x = −0.5 mm, (c) x = 0 mm, (d) x = 0.5 mm and (e) x = 1.5 mm (top view).
Magnetochemistry 08 00182 g007aMagnetochemistry 08 00182 g007bMagnetochemistry 08 00182 g007c
Figure 8. Magnetostatic force calculated by the numerical model.
Magnetochemistry 08 00182 g008
Figure 9. Displacement of the cantilever beam: (a) Initial state and (b) Vibration of the loading surface loaded with magnetostatic force.
Magnetochemistry 08 00182 g009
Figure 10. Displacement of the cantilever beam calculated by the numerical simulation.
Magnetochemistry 08 00182 g010
Table 1. Parameters in the numerical model.
ParameterValue
Moving velocity of permanent magnet (mm/s)15
Diameter of the through-hole defect (mm)0.5/1/2.5
Outer diameter of the iron pipe (mm)16
Inner diameter of the iron pipe (mm)10
Length of the iron pipe (mm)30
Size of the cubic permanent magnet (mm)1
Distance between the permanent magnet and the iron pipe (mm)1
Publisher’s Note: MDPI stays neutral with regard to jurisdictional claims in published maps and institutional affiliations.