
Effect of Metal-Oxide Phase on the Magnetic and Magnetocaloric Properties of La0.7Ca0.3MnO3-MO (MO=CuO, CoO, and NiO) Composite

 , and
, and 
Abstract
1. Introduction
2. Experimental
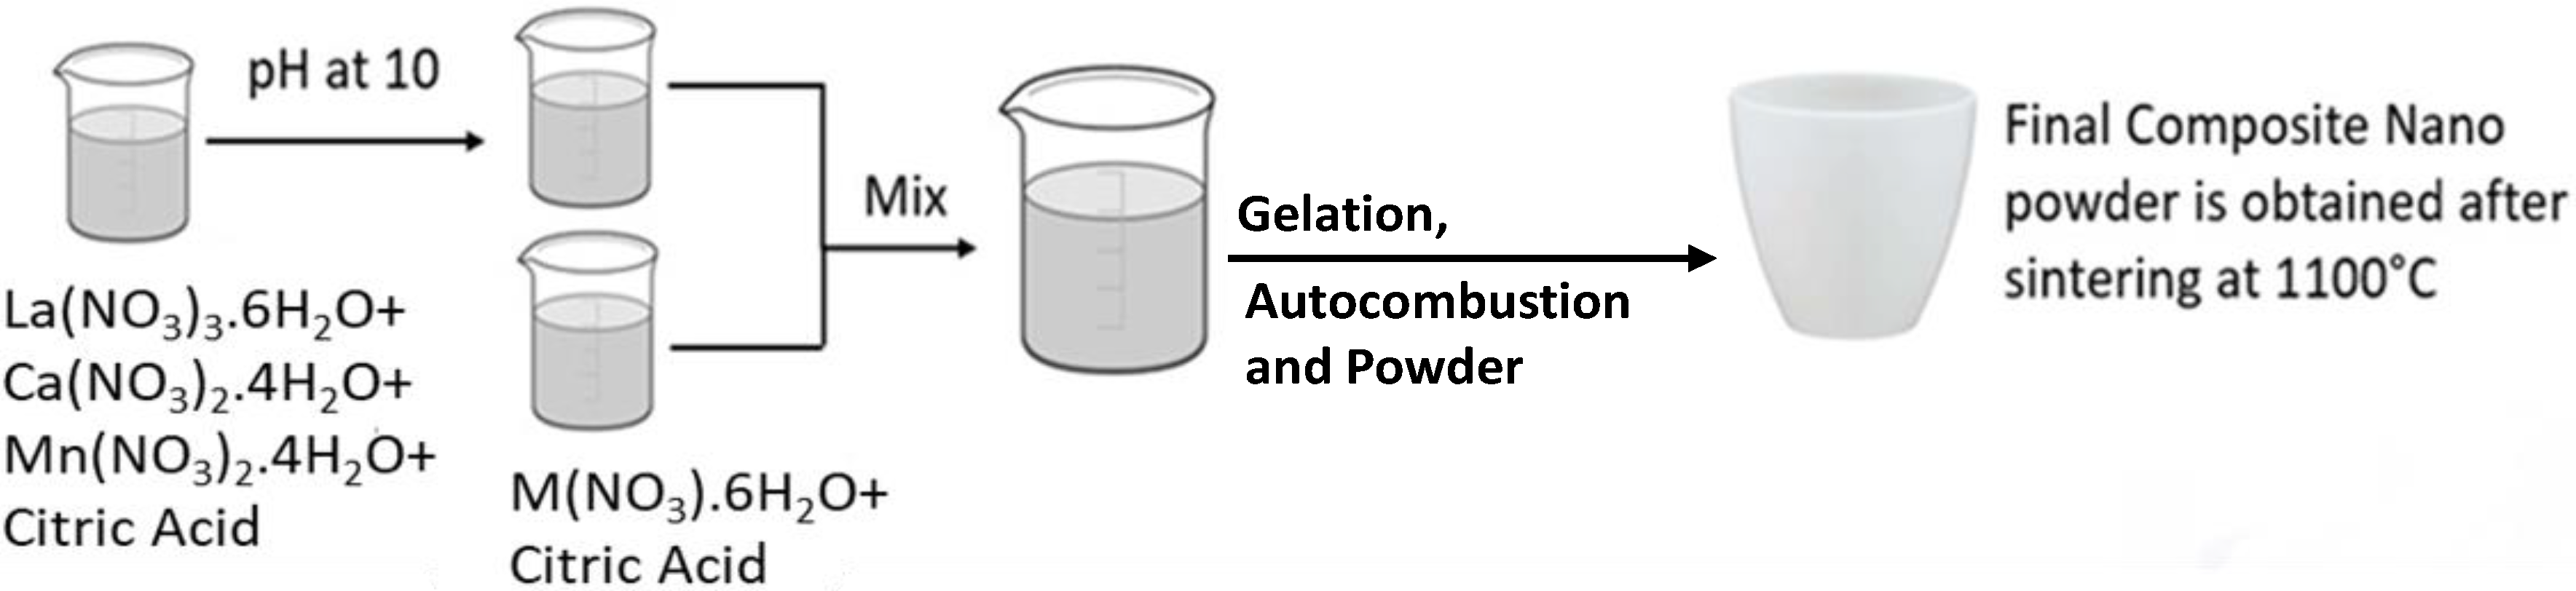
Synthesis
3. Characterization
4. Results and Discussion
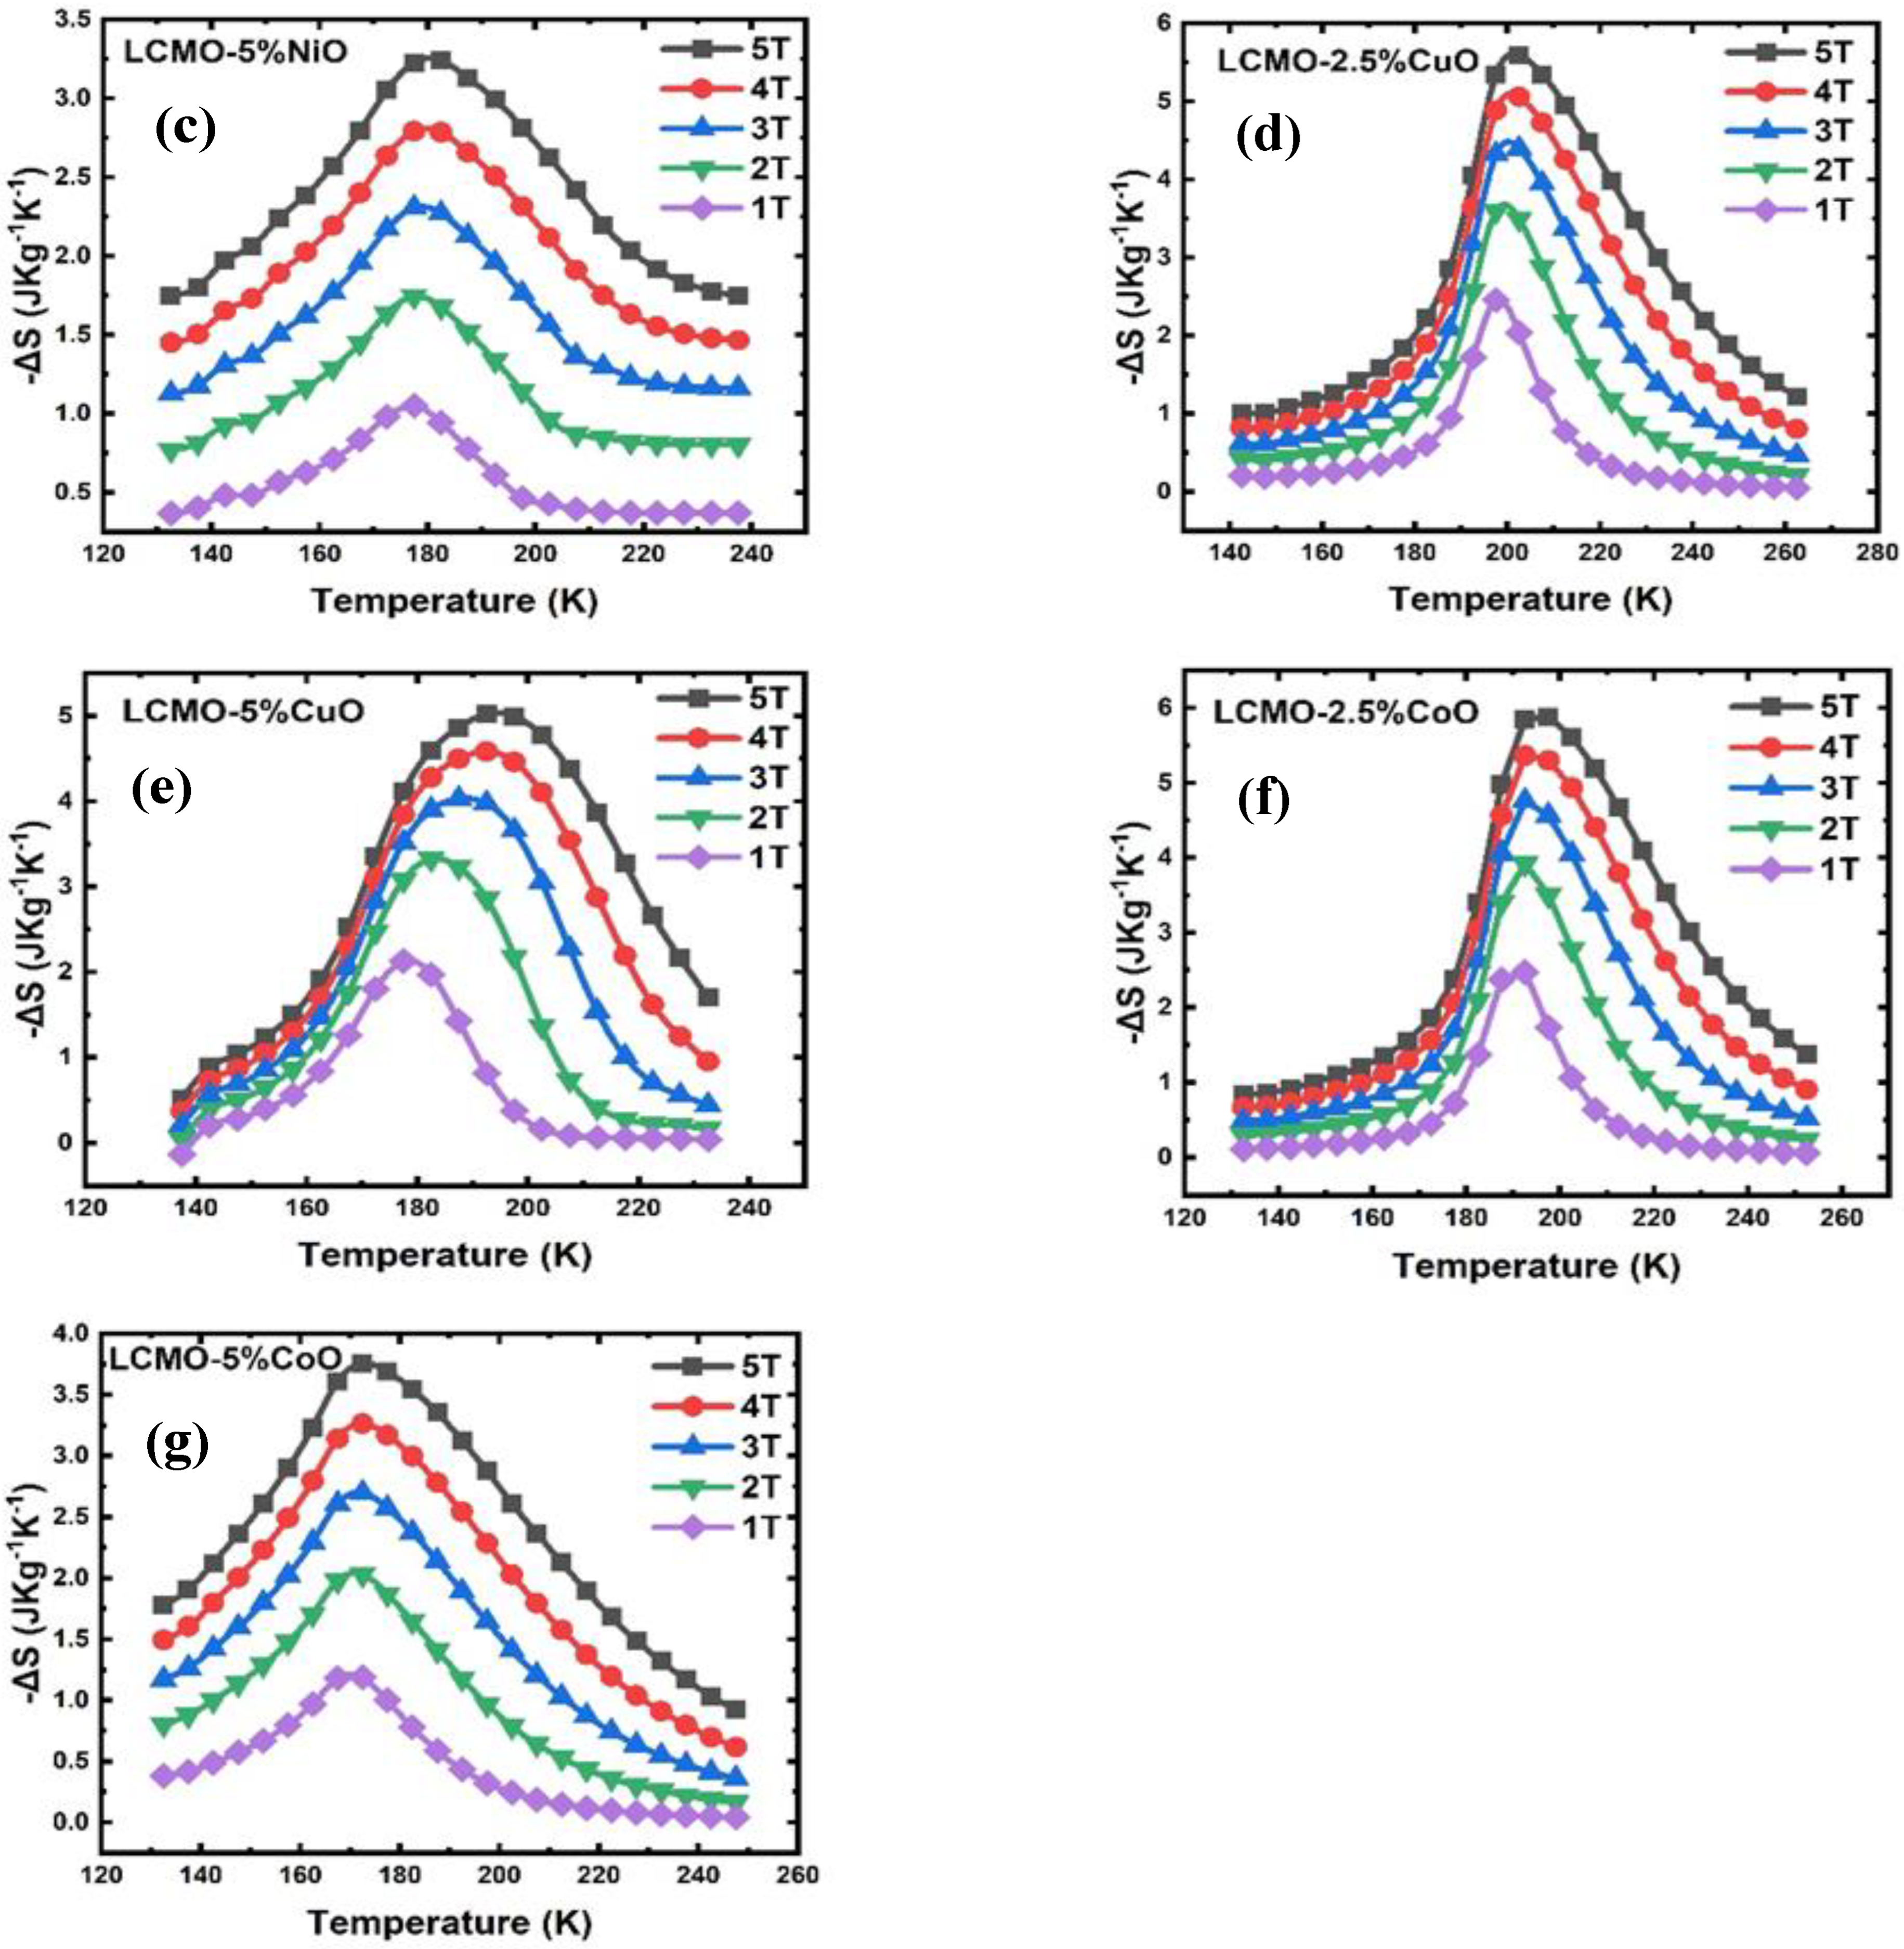
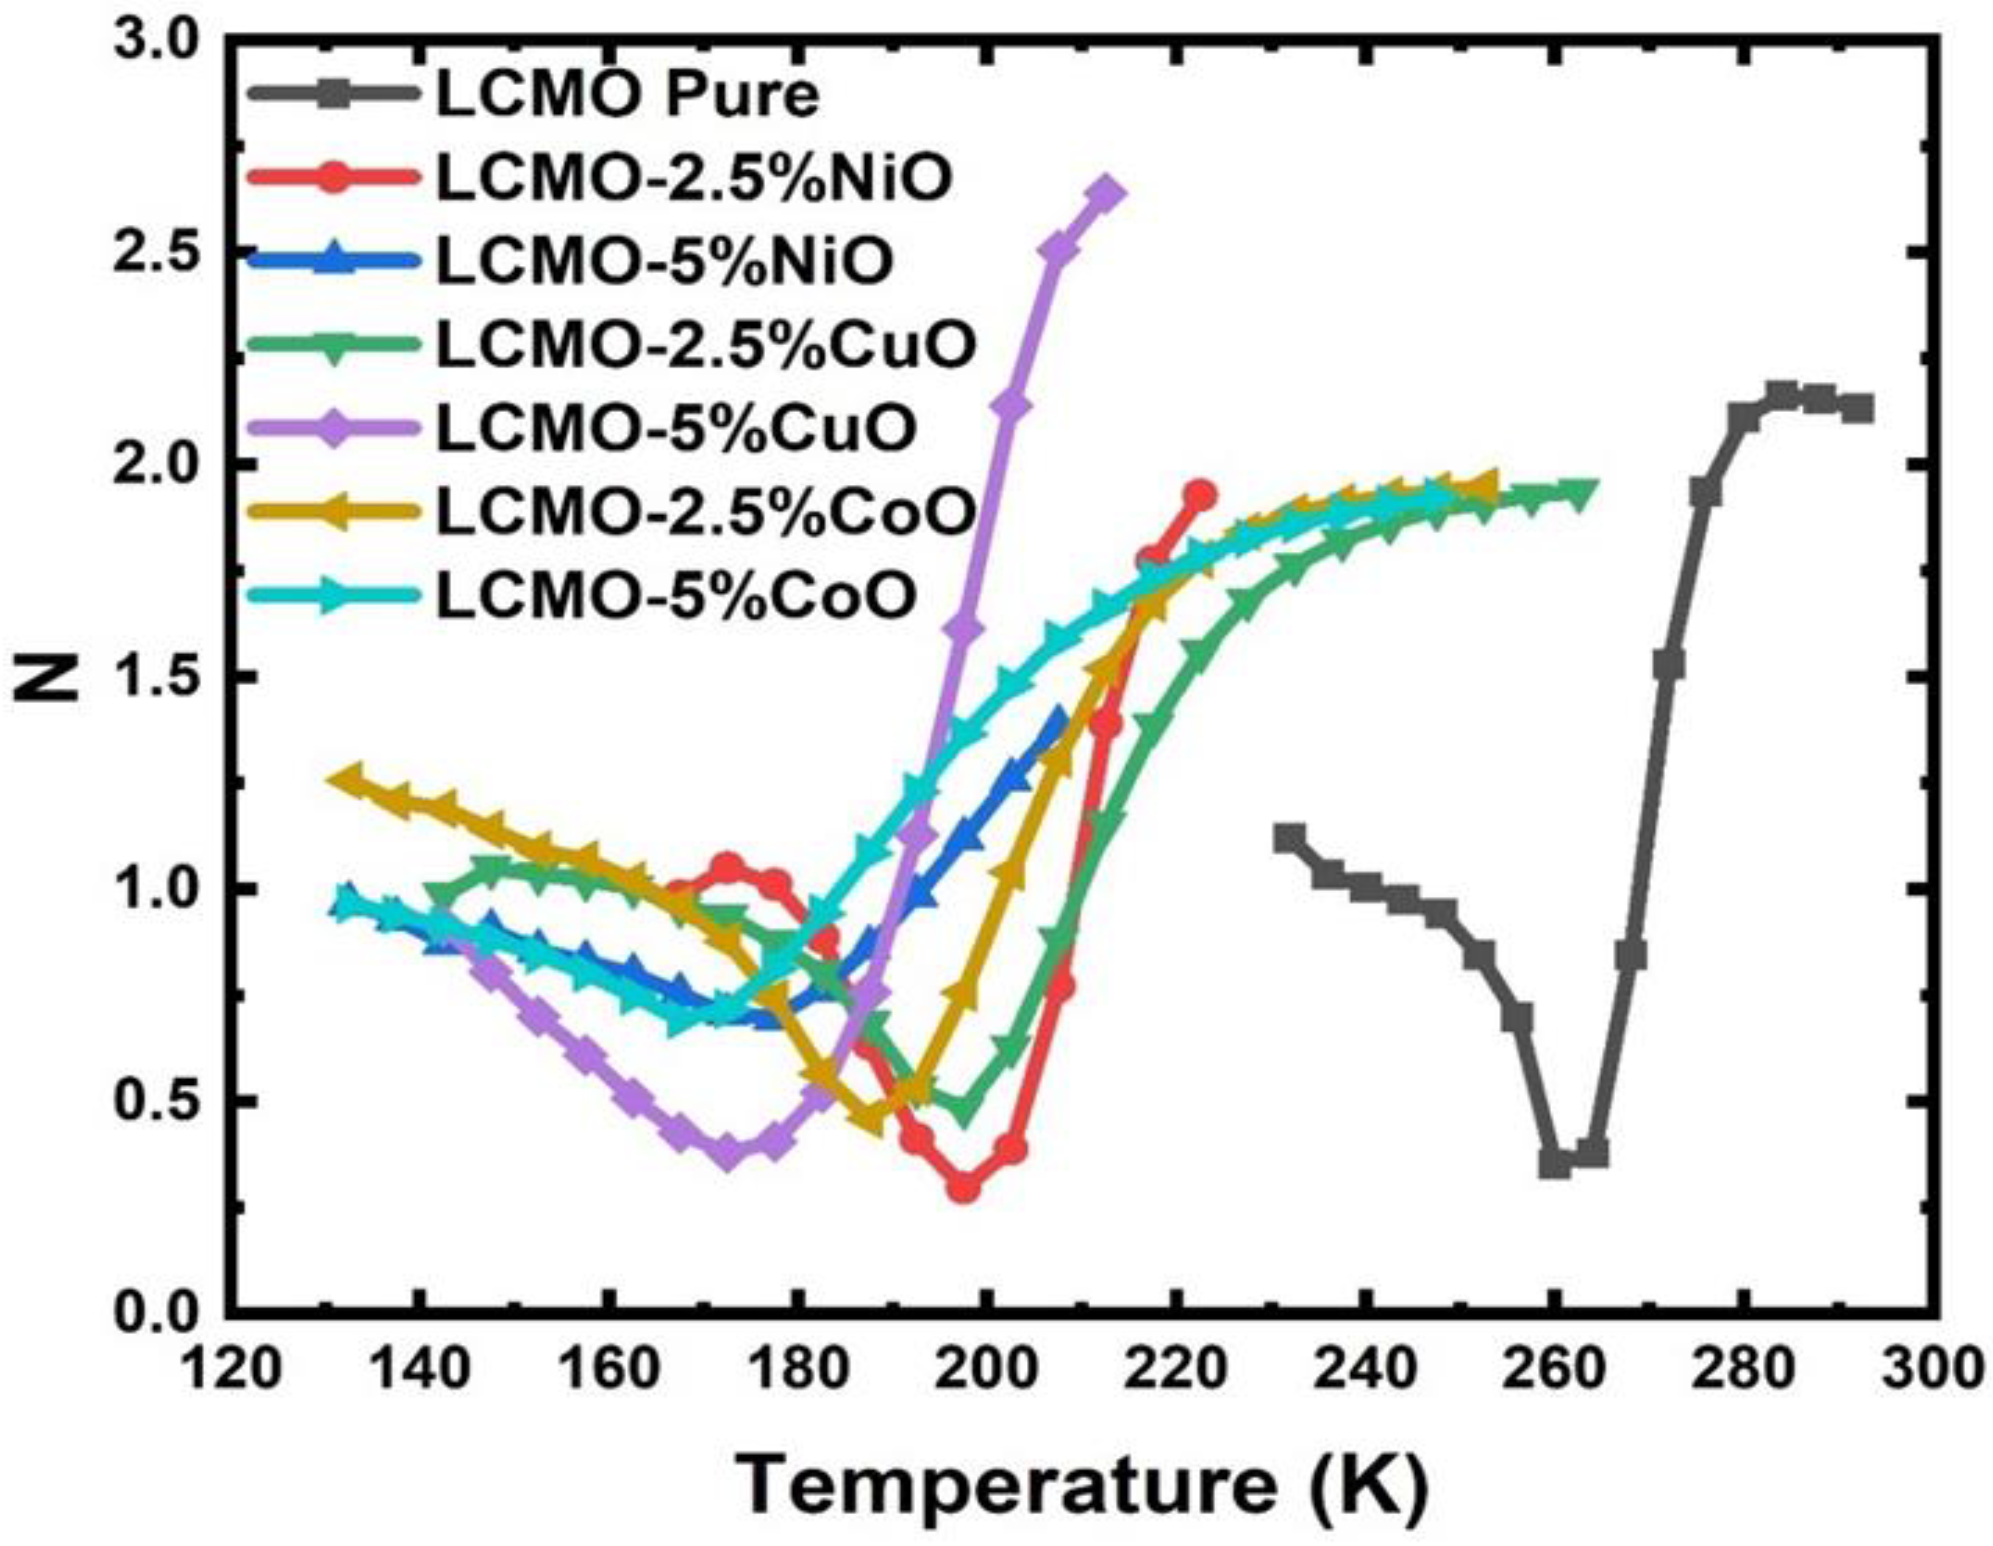
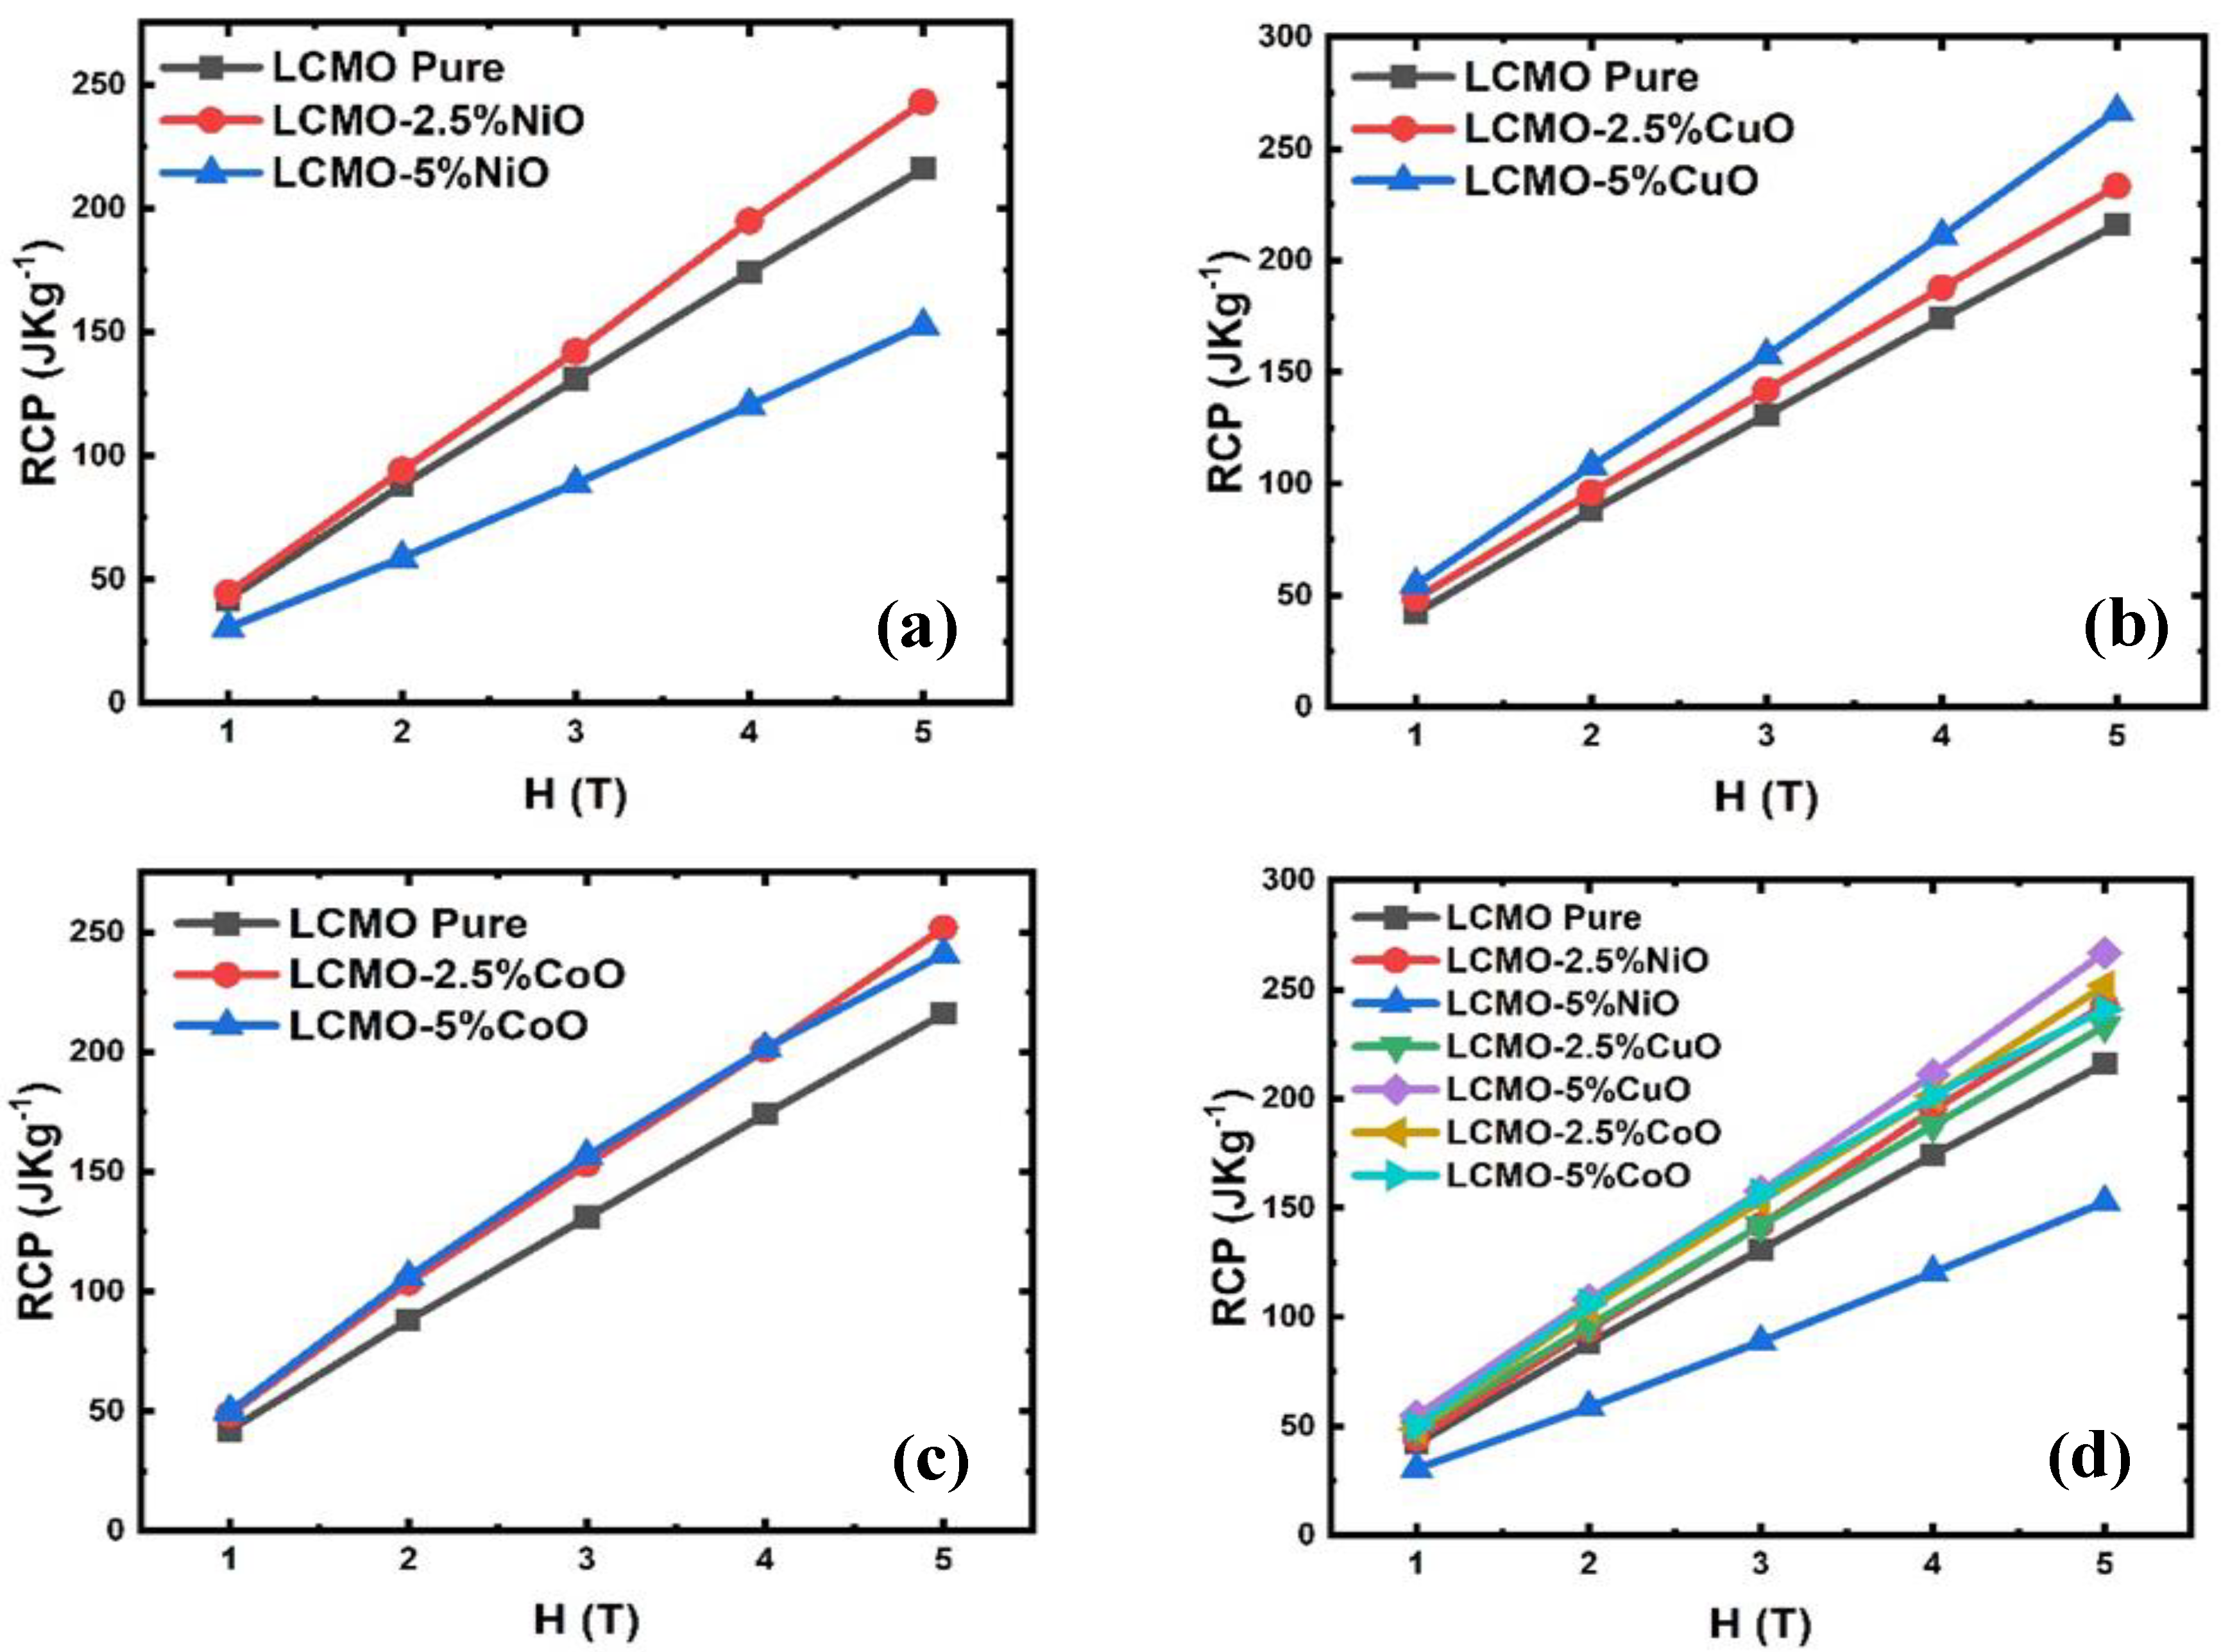
5. Magnetic and Magnetocaloric Study
6. Conclusions
Author Contributions
Funding
Institutional Review Board Statement
Informed Consent Statement
Data Availability Statement
Conflicts of Interest
References
- Wang, Y.; Zhang, H.; Liu, E.; Zhong, X.; Tao, K.; Wu, M.; Xing, C.; Xiao, Y.; Liu, J.; Long, Y. Outstanding Comprehensive Performance of La(Fe, Si)13 Hy/In Composite with Durable Service Life for Magnetic Refrigeration. Adv. Electron. Mater. 2018, 4, 1700636. [Google Scholar] [CrossRef]
- Li, L.; Yan, M. Recent progresses in exploring the rare earth based intermetallic compounds for cryogenic magnetic refrigeration. J. Alloys Compd. 2020, 823, 153810. [Google Scholar] [CrossRef]
- Gottschall, T.; Skokov, K.P.; Fries, M.; Taubel, A.; Radulov, I.; Scheibel, F.; Benke, D.; Riegg, S.; Gutfleisch, O. Making a Cool Choice: The Materials Library of Magnetic Refrigeration. Adv. Energy Mater. 2019, 9, 1901322. [Google Scholar] [CrossRef]
- Gschneidner, K.A., Jr.; Pecharsky, V.; Pecharsky, A.; Zimm, C. Recent Developments in Magnetic Refrigeration. Mater. Sci. Forum 1999, 315-317, 69–76. [Google Scholar] [CrossRef]
- Kitanovski, A. Energy Applications of Magnetocaloric Materials. Adv. Energy Mater. 2020, 10, 1903741. [Google Scholar] [CrossRef]
- Weiss, P.; Piccard, A. The magnetocaloric phenomenon. J. Phys. Appl. 1917, 7, 103–109. [Google Scholar] [CrossRef]
- Gschneidner, K.A., Jr.; Pecharsky, V. Magnetic refrigeration materials. J. Appl. Phys. 1999, 85, 5365–5368. [Google Scholar] [CrossRef]
- Moya, X.; Kar-Narayan, S.; Mathur, N.D. Caloric materials near ferroic phase transitions. Nat. Mater. 2014, 13, 439–450. [Google Scholar] [CrossRef]
- Lyubina, J.; Schäfer, R.; Martin, N.; Schultz, L.; Gutfleisch, O. Novel Design of La(Fe,Si)13 Alloys Towards High Magnetic Refrigeration Performance. Adv. Mater. 2010, 22, 3735–3739. [Google Scholar] [CrossRef]
- Provenzano, V.; Shapiro, A.J.; Shull, R.D. Reduction of hysteresis losses in the magnetic refrigerant Gd5Ge2Si2 by the addition of iron. Nature 2004, 429, 853–857. [Google Scholar] [CrossRef]
- Lyubina, J.; Hannemann, U.; Cohen, L.F.; Ryan, M.P. Novel La(Fe,Si)13/Cu Composites for Magnetic Cooling. Adv. Energy Mater. 2012, 2, 1323–1327. [Google Scholar] [CrossRef]
- Bejar, M.; Sdiri, N.; Hussein, M.; Mazen, S.; Dhahri, E. Magnetocaloric effect on strontium vacancies in polycrystalline La0.7Sr0.3−x□xMnO3. J. Magn. Magn. Mater. 2007, 316, e566–e568. [Google Scholar] [CrossRef]
- Kallel, N.; Kallel, S.; Hagaza, A.; Oumezzine, M. Magnetocaloric properties in the Cr-doped La0.7Sr0.3MnO3 manganites. Phys. B Condens. Matter 2009, 404, 285–288. [Google Scholar] [CrossRef]
- Ehsani, M.H.; Kameli, P.; Ghazi, M.E.; Razavi, F.S.; Taheri, M. Tunable magnetic and magnetocaloric properties of La0.6Sr0.4MnO3 nanoparticles. J. Appl. Phys. 2013, 114, 223907. [Google Scholar] [CrossRef]
- Chau, N.; Niem, P.Q.; Nhat, H.N.; Luong, N.H.; Tho, N.D. Influence of Cu substitution for Mn on the structure, magnetic, magnetocaloric and magnetoresistance properties of La0.7Sr0.3MnO3 perovskites. Phys. B Condens. Matter 2003, 327, 214–217. [Google Scholar] [CrossRef]
- Hamad, M.; Hemeda, O.; Alamri, H.R.; Mohamed, A.; Harb, M.E. Strong tailoring magnetocaloric effect in highly (001)-oriented La0.7Sr0.3MnO3 thin films. J. Mater. Res. Technol. 2021, 11, 1356–1361. [Google Scholar] [CrossRef]
- Pękała, M.; Pękała, K.; Drozd, V.; Staszkiewicz, K.; Fagnard, J.-F.; Vanderbemden, P. Magnetocaloric and transport study of poly- and nanocrystalline composite manganites La0.7Ca0.3MnO3/La0.8Sr0.2MnO3. J. Appl. Phys. 2012, 112, 023906. [Google Scholar] [CrossRef]
- M’Nassri, R. Searching the conditions for a table-like shape of the magnetic entropy in the magnetocaloric LBMO2.98/LBMO2.95 composite. Eur. Phys. J. Plus 2016, 131, 392. [Google Scholar] [CrossRef]
- Mbarek, H.; M’Nasri, R.; Cheikhrouhou-Koubaa, W.; Cheikhrouhou, A. Magnetocaloric effect near room temperature in (1–y)La0.8 Ca0.05 K0.15 MnO3/y La0.8 K0.2 MnO3 composites. Phys. Status Solidi A 2014, 211, 975–979. [Google Scholar] [CrossRef]
- Jerbi, A.; Krichene, A.; Chniba-Boudjada, N.; Boujelben, W. Magnetic and magnetocaloric study of manganite compounds Pr0.5A0.05Sr0.45MnO3 (A=Na and K) and composite. Phys. B Condens. Matter 2015, 477, 75–82. [Google Scholar] [CrossRef]
- Ezaami, A.; Chaaba, I.; Cheikhrouhou-Koubaa, W.; Cheikhrouhou, A.; Hlil, E. Enhancement of magnetocaloric properties around room temperature in (1-x)La0.7Ca0.25Sr0.05MnO3/xLa0.7Ca0.2Sr0.1MnO3 system (0 ≤ x ≤ 1). J. Alloys Compd. 2018, 735, 2331–2335. [Google Scholar] [CrossRef]
- Akça, G.; Çetin, S.K.; Ekicibil, A. Composite xLa0.7Ca0.2Sr0.1MnO3/(1 − x)La0.7Te0.3MnO3 materials: Magnetocaloric properties around room temperature. J. Mater. Sci. Mater. Electron. 2020, 31, 6796–6808. [Google Scholar] [CrossRef]
- Gschneidner, K.A., Jr.; Pecharsky, V.K. Magnetocaloric Materials. Annu. Rev. Mater. Sci. 2000, 30, 387–429. [Google Scholar] [CrossRef]
- El Boukili, A.; Mounkachi, O.; Hamedoun, M.; Lachkar, P.; Hlil, E.; Benyoussef, A.; Balli, M.; Ez-Zahraouy, H. A study of structural, magnetic and magnetocaloric properties of (1−x)La0.6Ca0.4MnO3/xMn2O3 composite materials. J. Alloys Compd. 2020, 859, 158392. [Google Scholar] [CrossRef]
- Anwar, M.; Ahmed, F.; Danish, R.; Koo, B.H. Impact of Co3O4 phase on the magnetocaloric effect and magnetoresistance in La0.7Sr0.3MnO3/Co3O4 and La0.7Ca0.3MnO3/Co3O4 ceramic composites. Ceram. Int. 2015, 41, 631–637. [Google Scholar] [CrossRef]
- Nasri, M.; Khelifi, J.; Laifi, J.; Hcini, F.; Alzahrani, B.; Bouazizi, M.L.; Dhahri, E.; Hlil, E. Structural, magnetic and theoretical investigation of the magnetocaloric effect of La0.6Sr0.4MnO3/x(Sb2O3) compound. Phase Transit. 2021, 94, 170–182. [Google Scholar] [CrossRef]
- Gavrilova, T.; Gilmutdinov, I.; Deeva, J.; Chupakhina, T.; Lyadov, N.; Faizrakhmanov, I.; Milovich, F.; Kabirov, Y.; Eremina, R. Magnetic and magnetocaloric properties of (1—x)La0.7Sr0.3MnO3/xNaF composites. J. Magn. Magn. Mater. 2018, 467, 49–57. [Google Scholar] [CrossRef]
- Neupane, D.; Hulsebosch, L.; Pathak, A.K.; Mishra, S.R. Magnetocaloric Study of La0.45Nd0.25Sr0.3MnO3/MO (MO=CuO, CoO, and NiO) Nanocomposites. IEEE Trans. Magn. 2021, 58, 1–8. [Google Scholar] [CrossRef]
- Wang, F.; Fu, W.; Jiang, C.; Li, J.; Huang, J. Exchange Bias Effect in LaFeO3: La0.7Ca0.3MnO3 Composite Thin Films. Coatings 2021, 11, 1125. [Google Scholar] [CrossRef]
- Lau, L.; Lim, K.; Chok, S.; Ishak, A.; Hon, X.; Wong, Y.; Kechik, M.A.; Chen, S.; Ibrahim, N.; Miryala, M.; et al. Effect of NiO Nanoparticle Addition on the Structural, Microstructural, Magnetic, Electrical, and Magneto-Transport Properties of La0.67Ca0.33MnO3 Nanocomposites. Coatings 2021, 11, 835. [Google Scholar] [CrossRef]
- Phong, P.; Khiem, N.; Dai, N.; Manh, D.; Hong, L.; Phuc, N. Influence of Al2O3 on low-field spin-polarized tunneling magnetoresistance of (1−x) La0.7Ca0.3MnO3+x Al2O3 composites. Mater. Lett. 2009, 63, 353–356. [Google Scholar] [CrossRef]
- Hwang, H.Y.; Cheong, S.-W.; Ong, N.P.; Batlogg, B. Spin-Polarized Intergrain Tunneling inLa2/3Sr1/3MnO3. Phys. Rev. Lett. 1996, 77, 2041–2044. [Google Scholar] [CrossRef] [PubMed]
- Tadić, M.; Panjan, M.; Marković, D. NiO/SiO2 nanostructure and the magnetic moment of NiO nanoparticles. Mater. Lett. 2010, 64, 2129–2131. [Google Scholar] [CrossRef]
- Varma, A.; Mukasyan, A.S.; Rogachev, A.S.; Manukyan, K.V. Solution Combustion Synthesis of Nanoscale Materials. Chem. Rev. 2016, 116, 14493–14586. [Google Scholar] [CrossRef] [PubMed]
- Kopanja, L.; Milosevic, I.; Panjan, M.; Damnjanovic, V.; Tadic, M. Sol–gel combustion synthesis, particle shape analysis and magnetic properties of hematite (α-Fe2O3) nanoparticles embedded in an amorphous silica matrix. Appl. Surf. Sci. 2016, 362, 380–386. [Google Scholar] [CrossRef]
- Patil, J.; Nadargi, D.; Gurav, J.; Mulla, I.; Suryavanshi, S. Synthesis of glycine combusted NiFe2O4 spinel ferrite: A highly versatile gas sensor. Mater. Lett. 2014, 124, 144–147. [Google Scholar] [CrossRef]
- Yang, J.; Guo, Q.; Wen, X.; Gao, X.; Peng, Q.; Li, Q.; Ma, D.; Li, Z. Pyrene-based blue AIEgens: Tunable intramolecular conjugation, good hole mobility and reversible mechanochromism. J. Mater. Chem. C 2016, 4, 8506–8513. [Google Scholar] [CrossRef]
- Azadmanjiri, J.; Ebrahimi, S.A.S. Influence of stoichiometry and calcination condition on the microstructure and phase constitution of NiFe2 O4 powders prepared by sol-gel autocombustion method. Phys. Status Solidi C 2004, 1, 3414–3417. [Google Scholar] [CrossRef]
- Bahadur, D.; Fischer, W.; Rane, M. In-situ high-temperature X-ray diffraction studies of non-stoichiometric Ni–Zr substituted barium hexagonal ferrites prepared by citrate precursor route. Mater. Sci. Eng. A 1998, 252, 109–116. [Google Scholar] [CrossRef]
- Anwar, M.S.; Ahmed, F.; Kim, G.W.; Heo, S.N.; Koo, B.H. The interplay of Ca and Sr in the bulk magnetocaloric La0.7Sr(0.3−x)Ca x MnO3 (x = 0, 0.1 and 0.3) manganite. J. Korean Phys. Soc. 2013, 62, 1974–1978. [Google Scholar] [CrossRef]
- Ayuela, A.; Klein, D.J.; March, N.H. Neel temperature of antiferromagnets for phase transitions driven by spin-wave interactions. Croat. Chem. Acta 2013, 86, 463–467. [Google Scholar] [CrossRef]
- Kimura, T.; Sekio, Y.; Nakamura, H.; Siegrist, T.; Ramirez, A.P. Cupric oxide as an induced-multiferroic with high-TC. Nat. Mater. 2008, 7, 291–294. [Google Scholar] [CrossRef]
- El Maalam, K.; Balli, M.; Habouti, S.; Dietze, M.; Hamedoun, M.; Hlil, E.K.; Es-Souni, M.; El Kenz, A.; Benyoussef, A.; Mounkachi, O. Composite (La0. 45Nd0. 25) Sr0. 3MnO3/5CuO materials for magnetic refrigeration applications. J. Magn. Magn. Mater. 2018, 449, 25–32. [Google Scholar] [CrossRef]
- Patterson, A.L. The Scherrer Formula for X-Ray Particle Size Determination. Phys. Rev. Series I 1939, 56, 978–982. [Google Scholar] [CrossRef]
- Shankar, K.; Kar, S.; Subbanna, G.; Raychaudhuri, A. Enhanced ferromagnetic transition temperature in nanocrystalline lanthanum calcium manganese oxide (La0.67Ca0.33MnO3). Solid State Commun. 2004, 129, 479–483. [Google Scholar] [CrossRef]
- Cureton, W.F.; Palomares, R.I.; Walters, J.; Tracy, C.L.; Chen, C.-H.; Ewing, R.C.; Baldinozzi, G.; Lian, J.; Trautmann, C.; Lang, M. Grain size effects on irradiated CeO2, ThO2, and UO2. Acta Mater. 2018, 160, 47–56. [Google Scholar] [CrossRef]
- Dipesh, D.N.; Wang, L.; Adhikari, H.; Alam, J.; Mishra, S. Influence of Al3+ doping on structural and magnetic properties of CoFe2-xAlxO4 Ferrite nanoparticles. J. Alloys Compd. 2016, 688, 413–421. [Google Scholar] [CrossRef]
- Zulueta, Y.A.; Dawson, J.A.; Mune, P.D.; Froeyen, M.; Nguyen, M.T. Oxygen vacancy generation in rare-earth-doped SrTiO3. Phys. Status Solidi B 2016, 253, 2197–2203. [Google Scholar] [CrossRef]
- Poudel, T.; Rai, B.; Yoon, S.; Guragain, D.; Neupane, D.; Mishra, S. The effect of gadolinium substitution in inverse spinel nickel ferrite: Structural, Magnetic, and Mössbauer study. J. Alloys Compd. 2019, 802, 609–619. [Google Scholar] [CrossRef]
- Zhou, X.; Zhou, Y.; Zhou, L.; Wei, J.; Wu, J.; Yao, D. Effect of Gd and La doping on the structure, optical and magnetic properties of NiZnCo ferrites. Ceram. Int. 2018, 45, 6236–6242. [Google Scholar] [CrossRef]
- Yang, H.; Zhu, Y.; Xian, T.; Jiang, J. Synthesis and magnetocaloric properties of La0.7Ca0.3MnO3 nanoparticles with different sizes. J. Alloys Compd. 2013, 555, 150–155. [Google Scholar] [CrossRef]
- Liu, M.F.; Du, Z.Z.; Xie, Y.L.; Li, X.; Yan, Z.B.; Liu, J.M. Unusual ferromagnetism enhancement in ferromagnetically optimal manganite La0.72yCa0.31yMn12yRuyO3 (0#y,0.3): The role of Mn-Ru t2g super-exchange. Sci. Rep. 2015, 5, 9922. [Google Scholar] [CrossRef] [PubMed]
- Beyreuther, E.; Grafström, S.; Eng, L.M.; Thiele, C.; Dörr, K. XPS investigation of Mn valence in lanthanum manganite thin films under variation of oxygen content. Phys. Rev. B 2006, 73, 155425. [Google Scholar] [CrossRef]
- Gao, T.; Cao, S.; Liu, Y.; Zhang, Y.; Zhang, J. Cu-doping induced ferromagnetic insulating behavior and domain wall pinning effects in LaMnO3. Rare Met. 2011, 30, 359–367. [Google Scholar] [CrossRef]
- Goodenough, J.B.; Wold, A.; Arnott, R.J.; Menyuk, N. Relationship Between Crystal Symmetry and Magnetic Properties of Ionic Compounds ContainingMn3+. Phys. Rev. Series I 1961, 124, 373–384. [Google Scholar] [CrossRef]
- He, X.; Zhong, W.; Au, C.T.; Du, Y. Size dependence of the magnetic properties of Ni nanoparticles prepared by thermal decomposition method. Nanoscale Res. Lett. 2013, 8, 446. [Google Scholar] [CrossRef]
- Banerjee, B.K. On a generalized approach to first and second order magnetic transitions. Phys. Lett. 1964, 12, 16–17. [Google Scholar] [CrossRef]
- Tang, W.; Lu, W.; Luo, X.; Wang, B.; Zhu, X.; Song, W.; Yang, Z.; Sun, Y. Particle size effects on La0.7Ca0.3MnO3: Size-induced changes of magnetic phase transition order and magnetocaloric study. J. Magn. Magn. Mater. 2010, 322, 2360–2368. [Google Scholar] [CrossRef]
- Pecharsky, V.K.; Gschneidne, K.A., Jr. Magnetocaloric effect and magnetic refrigeration. J. Magn. Magn. Mater. 1999, 200, 44–56. [Google Scholar] [CrossRef]
- Ahmed, A.; Mohamed, H.; Diab, A.; Omar, E.Y. Crossover effect of magnetotransport and magnetocaloric effect in (La0.7Ba0.3MnO3)1-x/(Al2O3)x composites. J. Magn. Magn. Mater. 2019, 489, 165388. [Google Scholar] [CrossRef]
- Phan, T.-L.; Thanh, P.; Yen, P.; Zhang, P.; Thanh, T.; Yu, S. Ferromagnetic short-range order and magnetocaloric effect in Fe-doped LaMnO3. Solid State Commun. 2013, 167, 49–53. [Google Scholar] [CrossRef]
- Hcini, S.; Boudard, M.; Zemni, S.; Oumezzine, M. Effect of Fe-doping on structural, magnetic and magnetocaloric properties of Nd0.67Ba0.33Mn1−xFexO3 manganites. Ceram. Int. 2014, 40, 16041–16050. [Google Scholar] [CrossRef]
- Bi, Y.; He, W.; Yang, T.; Wu, W.; Wen, J.; Yu, X.; Chen, F. The Effects of La Doping on the Crystal Structure and Magnetic Properties of Ni2In-Type MnCoGe1−xLax (x = 0, 0.01, 0.03) Alloys. Materials 2021, 14, 3998. [Google Scholar] [CrossRef] [PubMed]
- Afify, M.S.; El Faham, M.M.; Eldemerdash, U.; El Rouby, W.M.; El-Dek, S. Room temperature ferromagnetism in Ag doped LaMnO3 nanoparticles. J. Alloys Compd. 2021, 861, 158570. [Google Scholar] [CrossRef]
- Biswas, B.; Taran, S.; Pal, S. Study of magnetic and magnetocaloric properties in monovalent doped Pr0.75Li0.25MnO3. AIP Conf. Proc. 2021, 2352, 020016. [Google Scholar] [CrossRef]
- Rahman, M.M.; Jamal, A.; Khan, S.B.; Faisal, M. Fabrication of Highly Sensitive Ethanol Chemical Sensor Based on Sm-Doped Co3O4 Nanokernels by a Hydrothermal Method. J. Phys. Chem. C 2011, 115, 9503–9510. [Google Scholar] [CrossRef]


| Sample | Mass (grams) | ||||||
|---|---|---|---|---|---|---|---|
| La(NO3)3·6H2O | Ca(NO3)2·4H2O | Mn(NO3)2·4H2O | Ni(NO3)2·6H2O | Cu(NO3)2·3H2O | Co(NO3)2·6H2O | Citric Acid | |
| LCMO | 1.4284 | 0.3338 | 1.1829 | - | - | - | 2.9709 |
| LCMO-2.5%NiO | 1.3927 | 0.3255 | 1.1533 | 0.0973 | - | - | 2.9670 |
| LCMO-5.0%NiO | 1.3570 | 0.3171 | 1.1237 | 0.1946 | - | - | 2.9630 |
| LCMO-2.5%CuO | 1.3927 | 0.3255 | 1.1533 | - | 0.0731 | - | 2.9627 |
| LCMO-5.0%CuO | 1.3570 | 0.3171 | 1.1237 | - | 0.1462 | - | 2.9544 |
| LCMO-2.5%CoO | 1.3927 | 0.3255 | 1.1533 | - | - | 0.0970 | 2.9668 |
| LCMO-5.0%CoO | 1.3570 | 0.3171 | 1.1237 | - | - | 0.1941 | 2.9626 |
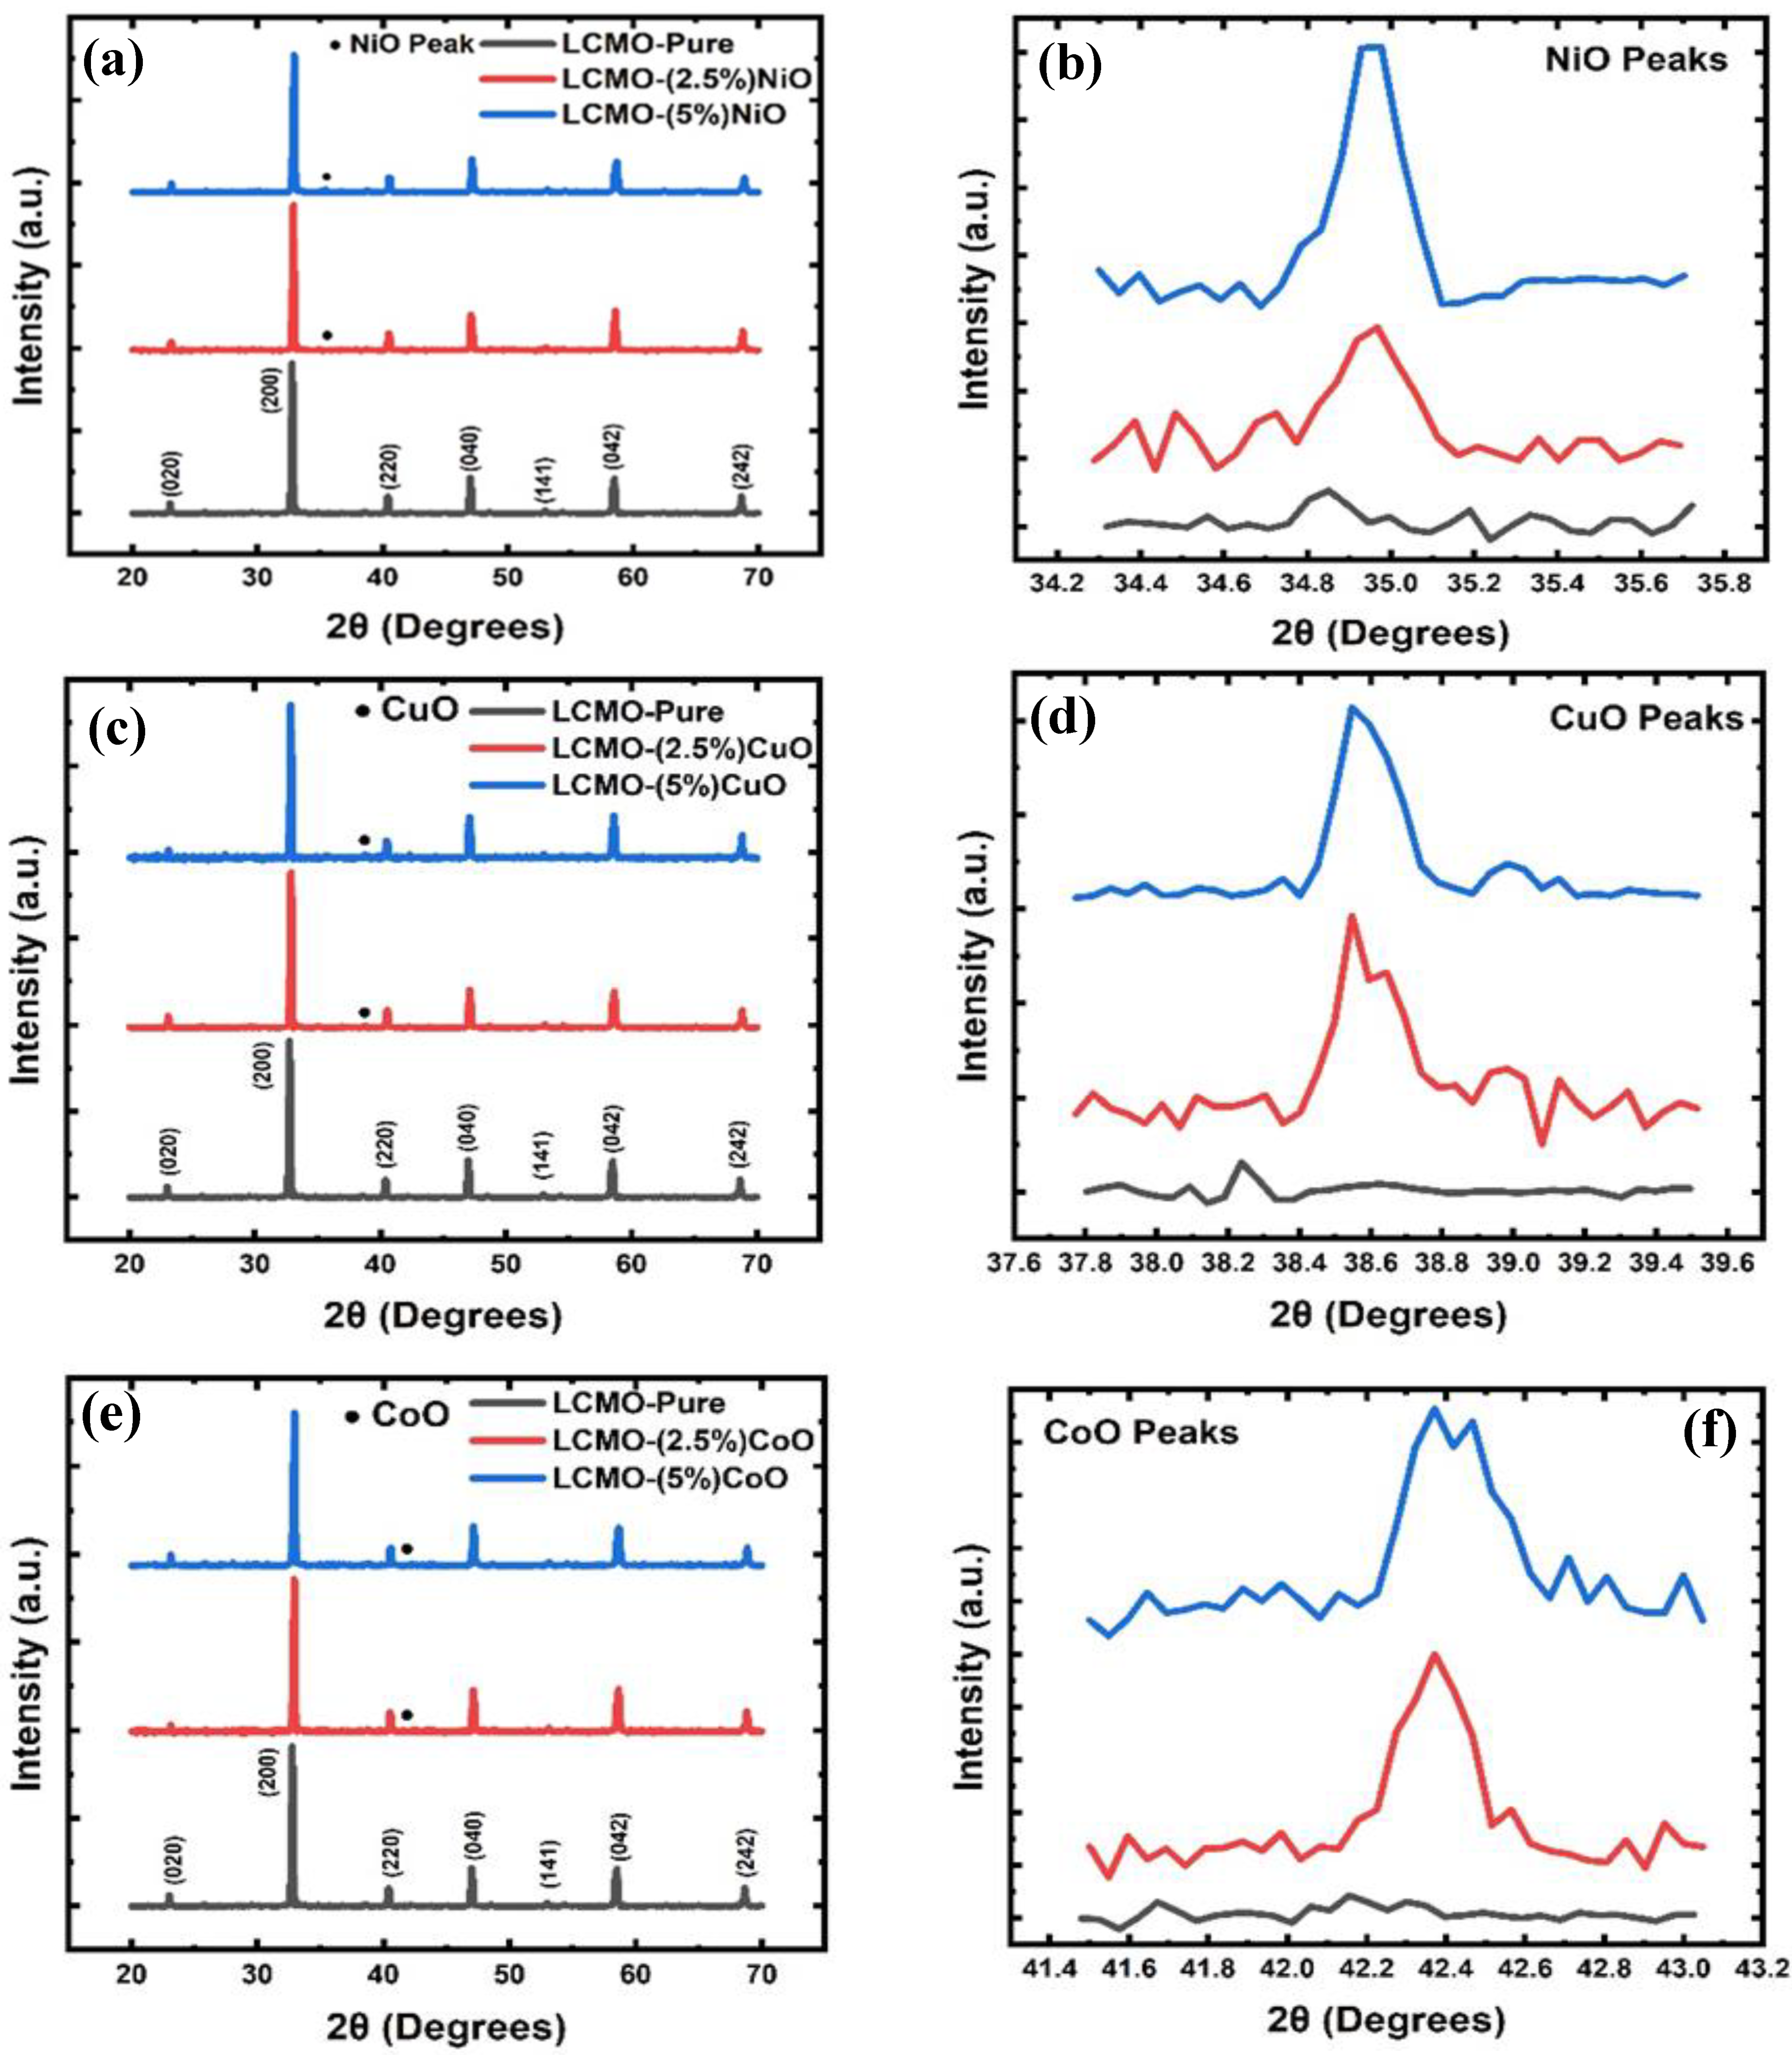
| Sample | La0.7Ca0.3MnO3 Phase | Metal Oxide Phase | ||||||||
|---|---|---|---|---|---|---|---|---|---|---|
| a(Å) (±0.01) | b(Å) (±0.01) | c(Å) (±0.01) | δ | Cell Volume (Å3) (±0.1) | a(Å) (±0.01) | b(Å) (±0.01) | c(Å) (±0.01) | Cell Volume (Å3) (±0.1) | Crystallite Size (nm) | |
| LCMO | 5.46 | 7.71 | 5.47 | −0.0027 | 230.27 | NA | NA | 48.85 (±4.41) | ||
| LCMO-2.5%NiO | 5.46 | 7.71 | 5.46 | −0.0014 | 229.85 | 3.79 | NA | NA | 54.42 | 48.01 (±4.59) |
| LCMO-5%NiO | 5.46 | 7.70 | 5.45 | −0.0015 | 229.13 | 4.29 | NA | NA | 79.10 | 42.37 (±3.92) |
| LCMO-2.5%CuO | 5.46 | 7.69 | 5.44 | −0.0025 | 228.41 | 4.69 | 3.32 | 5.13 | 79.88 | 47.70 (±4.39) |
| LCMO-5%CuO | 5.47 | 7.70 | 5.46 | −0.0028 | 229.97 | 4.78 | 3.37 | 5.16 | 83.12 | 47.15 (±4.66) |
| LCMO-2.5%CoO | 5.41 | 7.68 | 5.44 | 0.00130 | 226.03 | 4.32 | NA | NA | 80.57 | 46.83 (±4.19) |
| LCMO-5%CoO | 5.45 | 7.71 | 5.44 | 0.00132 | 228.59 | 4.31 | NA | NA | 80.25 | 43.06 (±3.93) |
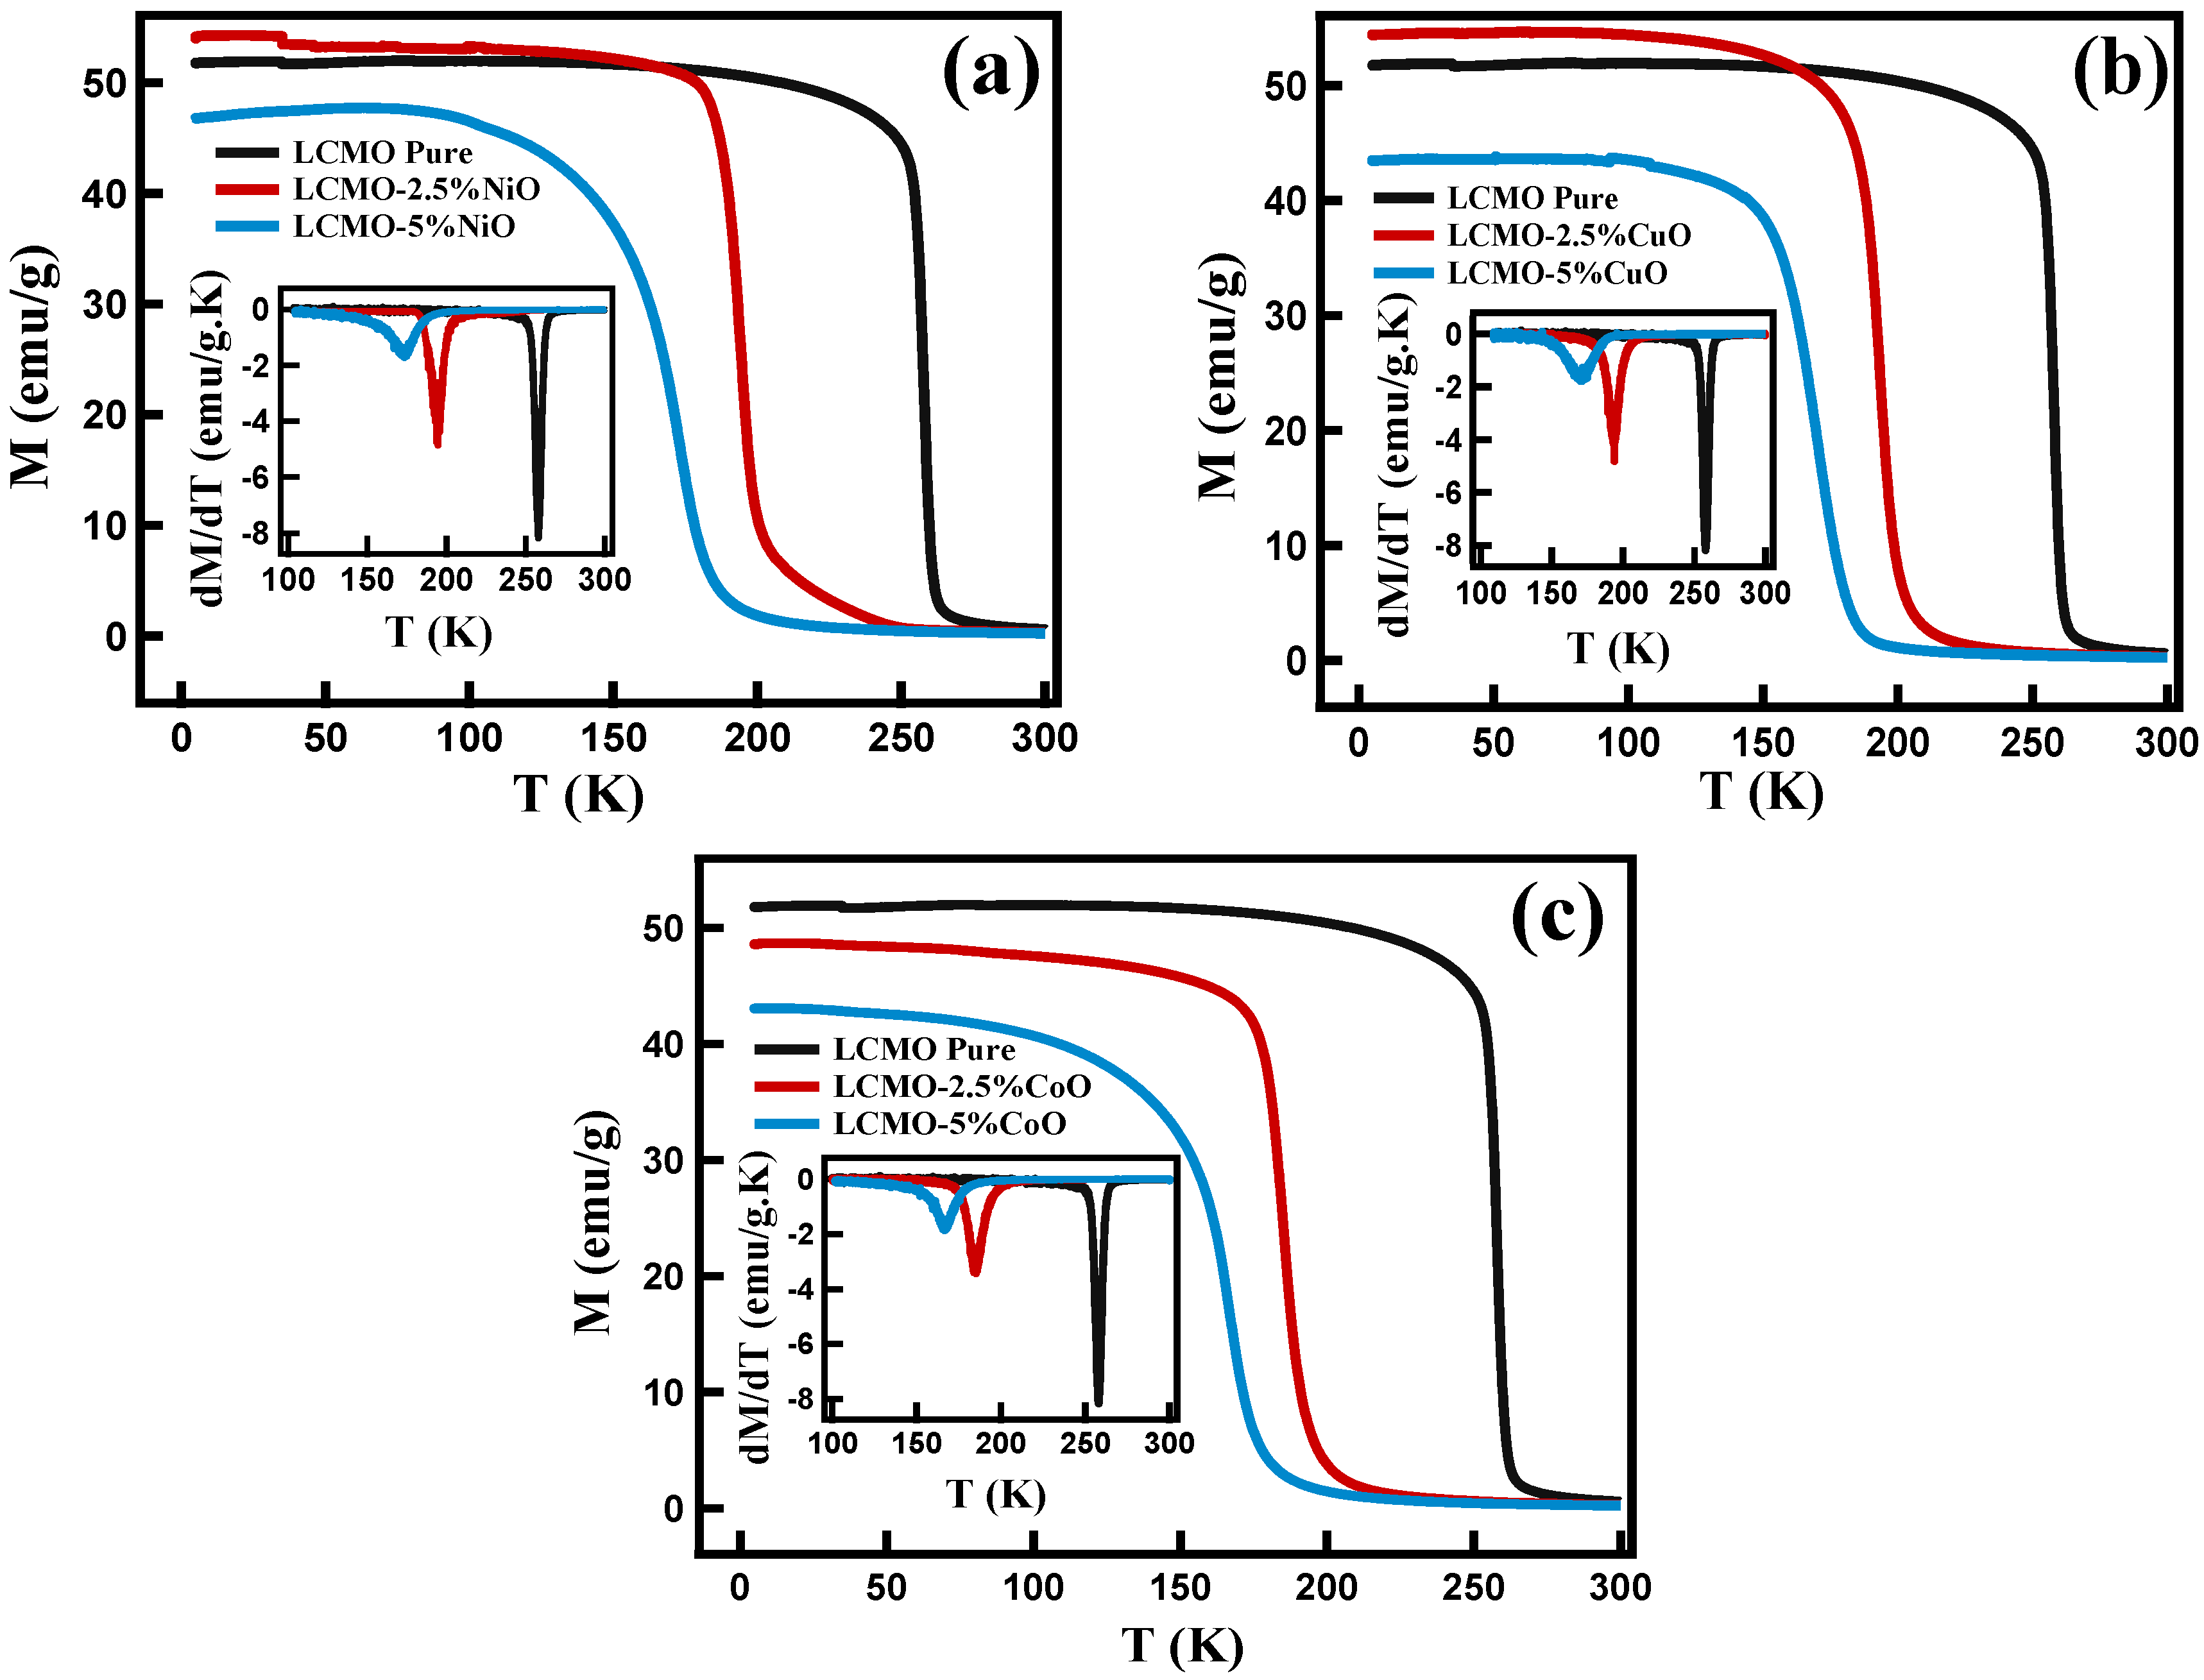
| Sample | Phase Transition Temperature (TC) |
|---|---|
| LCMO | 258.0 K |
| LCMO-2.5%NiO | 195.0 K |
| LCMO-5%NiO | 173.0 K |
| LCMO-2.5%CuO | 172.0 K |
| LCMO-5%CuO | 194.0 K |
| LCMO-2.5%CoO | 185.0 K |
| LCMO-5%CoO | 167.0 K |
| Field(T) | LCMO | LCMO–2.5%NiO | LCMO–5%NiO | |||
|---|---|---|---|---|---|---|
| ∆Smax (J·Kg−1K−1) | FWHM (K) | ∆Smax (J·Kg−1K−1) | FWHM (K) | ∆Smax (J·Kg−1K−1) | FWHM (K) | |
| 1.0 | 4.75 | 8.86 | 3.14 | 14.14 | 1.05 | 29.12 |
| 2.0 | 6.61 | 13.31 | 4.62 | 20.38 | 1.74 | 33.68 |
| 3.0 | 7.54 | 17.36 | 5.22 | 27.18 | 2.30 | 38.50 |
| 4.0 | 8.23 | 21.14 | 5.74 | 33.93 | 2.79 | 43.12 |
| 5.0 | 8.77 | 24.63 | 6.16 | 39.45 | 3.24 | 47.10 |
| Field(T) | LCMO | LCMO–2.5%CuO | LCMO–5%CuO | |||
|---|---|---|---|---|---|---|
| ∆Smax (J·Kg−1K−1) | FWHM (K) | ∆Smax (J·Kg−1K−1) | FWHM (K) | ∆Smax (J·Kg−1K−1) | FWHM (K) | |
| 1.0 | 4.75 | 8.86 | 2.45 | 19.79 | 2.12 | 25.75 |
| 2.0 | 6.61 | 13.31 | 3.59 | 26.73 | 3.32 | 32.47 |
| 3.0 | 7.54 | 17.36 | 4.39 | 32.30 | 4.02 | 39.11 |
| 4.0 | 8.23 | 21.14 | 5.05 | 37.12 | 4.58 | 46.05 |
| 5.0 | 8.77 | 24.63 | 5.59 | 41.72 | 5.02 | 53.14 |
| Field(T) | LCMO | LCMO–2.5%CoO | LCMO–5%CoO | |||
|---|---|---|---|---|---|---|
| ∆Smax (J·Kg−1K−1) | FWHM (K) | ∆Smax (J·Kg−1K−1) | FWHM (K) | ∆Smax (J·Kg−1K−1) | FWHM (K) | |
| 1.0 | 4.75 | 8.86 | 2.47 | 19.70 | 1.18 | 42.18 |
| 2.0 | 6.61 | 13.31 | 3.92 | 26.45 | 2.02 | 52.30 |
| 3.0 | 7.54 | 17.36 | 4.75 | 32.20 | 2.69 | 58.04 |
| 4.0 | 8.23 | 21.14 | 5.36 | 37.49 | 3.26 | 61.72 |
| 5.0 | 8.77 | 24.63 | 5.87 | 42.85 | 3.75 | 64.09 |
| Sample | RCP (J·Kg−1) | ||||
|---|---|---|---|---|---|
| 1 T | 2 T | 3 T | 4 T | 5 T | |
| LCMO | 42.15 | 88.07 | 130.93 | 174.21 | 216.12 |
| LCMO-2.5%NiO | 44.51 | 94.19 | 142.17 | 194.92 | 243.05 |
| LCMO-5%NiO | 30.58 | 58.75 | 88.83 | 120.41 | 152.71 |
| LCMO-2.5%CuO | 48.62 | 96.15 | 142.02 | 187.77 | 233.37 |
| LCMO-5%CuO | 54.85 | 107.97 | 157.51 | 211.12 | 266.89 |
| LCMO-2.5%CoO | 48.79 | 103.76 | 153.25 | 201.16 | 251.78 |
| LCMO-5%CoO | 50.04 | 106.15 | 156.66 | 201.52 | 240.88 |
| Sample | R-Value |
|---|---|
| LCMO | 1.01 |
| LCMO-2.5%NiO | 1.05 |
| LCMO-5%NiO | 0.99 |
| LCMO-2.5%CuO | 0.97 |
| LCMO-5%CuO | 0.97 |
| LCMO-2.5%CoO | 1.01 |
| LCMO-5%CoO | 0.98 |
Publisher’s Note: MDPI stays neutral with regard to jurisdictional claims in published maps and institutional affiliations. |
© 2022 by the authors. Licensee MDPI, Basel, Switzerland. This article is an open access article distributed under the terms and conditions of the Creative Commons Attribution (CC BY) license (https://creativecommons.org/licenses/by/4.0/).
Share and Cite
Dhungana, S.; Casey, J.; Neupane, D.; Pathak, A.K.; Karna, S.; Mishra, S.R. Effect of Metal-Oxide Phase on the Magnetic and Magnetocaloric Properties of La0.7Ca0.3MnO3-MO (MO=CuO, CoO, and NiO) Composite. Magnetochemistry 2022, 8, 163. https://doi.org/10.3390/magnetochemistry8120163
Dhungana S, Casey J, Neupane D, Pathak AK, Karna S, Mishra SR. Effect of Metal-Oxide Phase on the Magnetic and Magnetocaloric Properties of La0.7Ca0.3MnO3-MO (MO=CuO, CoO, and NiO) Composite. Magnetochemistry. 2022; 8(12):163. https://doi.org/10.3390/magnetochemistry8120163
Chicago/Turabian StyleDhungana, Surendra, Jacob Casey, Dipesh Neupane, Arjun K. Pathak, Sunil Karna, and Sanjay R. Mishra. 2022. "Effect of Metal-Oxide Phase on the Magnetic and Magnetocaloric Properties of La0.7Ca0.3MnO3-MO (MO=CuO, CoO, and NiO) Composite" Magnetochemistry 8, no. 12: 163. https://doi.org/10.3390/magnetochemistry8120163
APA StyleDhungana, S., Casey, J., Neupane, D., Pathak, A. K., Karna, S., & Mishra, S. R. (2022). Effect of Metal-Oxide Phase on the Magnetic and Magnetocaloric Properties of La0.7Ca0.3MnO3-MO (MO=CuO, CoO, and NiO) Composite. Magnetochemistry, 8(12), 163. https://doi.org/10.3390/magnetochemistry8120163