Abstract
Magnetocaloric alloys are an important class of materials that enable non-vapor compression cycles. One promising candidate for magnetocaloric systems is LaFeMnSi, thanks to a combination of factors including low-cost constituents and a useful curie temperature, although control of the constituents’ phase distribution can be challenging. In this paper, the effects of composition and high energy ball milling on the particle morphology and phase stability of LaFe11.71-xMnxSi1.29H1.6 magnetocaloric powders were investigated. The powders were characterized with optical microscopy, dynamic light scattering, X-ray diffraction (XRD), and differential scanning calorimetry (DSC). It was found that the powders retained most of their original magnetocaloric phase during milling, although milling reduced the degree of crystallinity in the powder. Furthermore, some oxide phases (<1 weight percent) were present in the as-received and milled powders, which indicates that no significant contamination of the powders occurred during milling. Finally, the results indicated that the Curie temperature drops as Fe content decreases (Mn content increases). In all of the powders, milling led to an increase in the Curie temperature of ~3–6 °C.
Notice: This manuscript has been authored by UT-Battelle, LLC under Contract No. DE-AC05-00OR22725 with the U.S. Department of Energy. The United States Government retains and the publisher, by accepting the article for publication, acknowledges that the United States Government retains a non-exclusive, paid-up, irrevocable, world-wide license to publish or reproduce the published form of this manuscript, or allow others to do so, for United States Government purposes. The Department of Energy will provide public access to these results of federally sponsored research in accordance with the DOE Public Access Plan (http://energy.gov/downloads/doe-public-access-plan, accessed on 7 May 2021).
1. Introduction
Room temperature magnetocaloric refrigeration has been proposed as an alternative to conventional vapor compression refrigeration as it is more efficient and environmentally friendly [1,2,3,4,5,6,7]. This type of refrigeration is based on a magnetic solid that acts as a refrigerant via the magnetocaloric effect (MCE) [8]. The MCE consists of the thermal response of a material when exposed to a varying magnetic field, and is an intrinsic property of all magnetic materials [5,9]. The earliest thermodynamic investigations of the MCE at near or above room temperature began in the middle of the 20th century, when work was mainly focused on the development of heat engines [10]. In 1997, Pecharsky et al. observed the MCE in Gd5Ge2Si2 compounds [11,12], which prompted future research efforts towards room temperature magnetic refrigeration applications. Due to the reversible nature of the MCE, magnetic refrigeration has a great potential for high thermodynamic cycle efficiency [13]. Furthermore, it is expected that MCE refrigeration will help reduce the use of hazardous Freon-based gases that are used in conventional refrigeration systems [14].
Current research efforts include the investigation of magnetocaloric materials (MCMs) that exhibit comparable thermodynamic properties [15,16,17]. However, despite their potential for use in refrigeration systems, As- and Gd-containing MCMs are not viable for industrial or commercial applications because they are either prohibitively expensive or highly toxic [18]. La-based powders have also been proposed as viable candidates for magnetic refrigeration applications [18,19]. In particular, La(FexSi1-x)13 compounds can form intermetallic phases that exhibit good magnetocaloric properties [19,20]. However, these compounds have been reported to exhibit Curie temperatures (Tc) ranging from −93 to −43 °C [21], which are significantly below the conditions necessary for magnetic cooling at room temperature [13]. One method that has been used to raise Tc in these types of MCMs is to increase the lattice parameter by inserting hydrogen into interstitial sites. In 2006, Fukamichi et al. [14] raised the Tc in a La(Fe0.88Si0.12)13Hy material from −78 °C for y = 0 [only La(Fe0.88Si0.12)13 material] to 57 °C for y = 1.6.
Despite the apparent room temperature capability of the La(FexSi1-x)13Hy compound, it is difficult to control the partial hydrogenation in this MCM for large-scale industrial processes to a sufficient degree of accuracy [22]. One way to overcome this issue is to substitute some Fe with Mn in the above compound, which allows for the necessary fine tuning of Tc [23]. In 2015, Basso et al. [24] reported that an increase in the Mn content from y = 0.06 to y = 0.46 in LaFexMnySizH1.65 (x + y + z = 13) MCM led to a decrease in the transition temperature from 66 °C to −3 °C. They also found that the refrigerant capacity [25] reached a maximum value of 70.8 J/kg when y = 0.25.
Ball milling is a traditional powder-processing technique that is primarily used for reducing particle sizes or mixing different materials, and is typically employed in the mineral, pharmaceutical, and ceramic industries [26]. This type of method involves mechanically grinding powders using metallic media, and has been investigated for use with some rare earth-based compounds, such as La(FeSi)13 materials [27,28,29,30]. Ball milling can enhance the MCE in some powders, and thereby increase their refrigerant cooling power [31]. However, the presence of contamination from the milling media must be taken into account [32]. Furthermore, the mechanical grinding that occurs during milling can also induce phase transformations, chemical reactions, and reductions in particle and grain size [33,34].
To date, there has been little work to systematically study the effects of composition on the properties of high energy ball milled LaFe13-x-yMnxSiyHz MCM powders. The purpose of this work, therefore, is to examine how changing the Mn and Fe content in LaFe11.71-xMnxSi1.29H1.6 (x = 0.38, 0.39, 0.40, 0.42, 0.43, and 0.44) magnetocaloric powders affects the phase structure and particle morphology of these MCM powders during ball milling. In doing so, this work is expected to provide insight into the effects of powder composition on the material properties during milling.
2. Results and Discussion
Figure 1a–f displays the optical microscopic images of six LaFe11.71-xMnxSi1.29H1.6 (x = 0.38, 0.39, 0.40, 0.42, 0.43, and 0.44, see Table 1) magnetocaloric powders (labelled P-1 M–P-6 M) that were milled for 30 min. Before imaging, the powders were mounted in epoxy. The milled particles exhibited a similar morphology for all the conditions. Furthermore, the particles were estimated to have diameters well below 50 µm. Figure 2a–f displays the particle size distribution for the milled powders that are listed in Table 1. The particles exhibited a lognormal distribution in which the particle diameters for all powders ranged from ~1 to 15 µm with mean particle sizes that varied between 4.21 to 4.88 µm, indicating that milling for 30 min significantly reduced the particle size (from 800–1250 µm). Table 2 displays the circularity and aspect ratios for the magnetocaloric P-1 M–P-6 M powders that were milled for 30 min. The circularity values were found to range from 0.8137 to 0.8228, while the aspect ratio exhibited values of 0.9401–0.9403. Importantly, these values were within a standard deviation of one another. The similarity between the particle diameter distributions, aspect ratio, and circularity values indicates that the milling process was reproducible. The results also indicate that powder composition had no significant effect on the shape and size of the particles during milling.
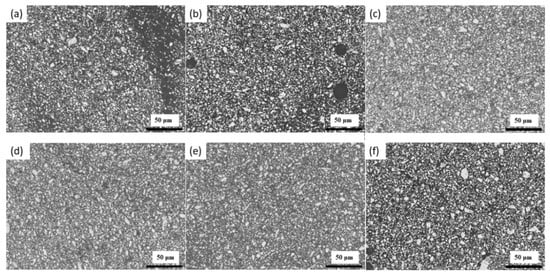
Figure 1.
Optical imaging of ball milled (30 min) magnetocaloric powders (a) P-1 M, (b) P-2 M, (c) P-3 M, (d) P-4 M, (e) P-5 M, and (f) P-6 M.

Table 1.
Composition and Curie temperature for the investigated magnetocaloric powders P-1 AR–P-6 AR.
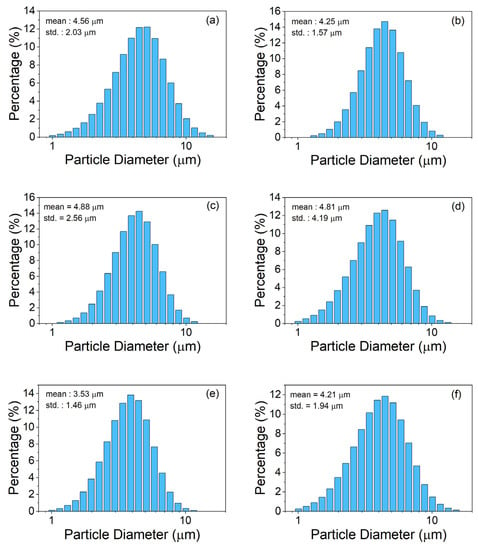
Figure 2.
Particle size distribution for milled MCM powders (a) P-1 M, (b) P-2 M, (c) P-3 M, (d) P-4 M, (e) P-5 M, and (f) P-6 M.

Table 2.
The mean and standard deviation values for the aspect ratio and the circularity for milled (30 min) magnetocaloric powders P-1 M–P-6 M.
Figure 3a,b displays the X-ray diffraction (XRD) patterns for the ground (P-1 AR–P-6 AR) and milled (30 min) (P-1 M–P-6 M) powders for scattering angles ranging from 10 to 100° 2θ. There are many distinctive peaks throughout the range of scattering angles. This increase in the lattice parameters (and lattice volume) may be due to a greater incorporation of hydrogen atoms into the lattice structure during milling, or to the energy imparted into the lattice during milling [30,35]. Furthermore, the peaks for the milled powder were broader and had a relatively lower intensity as compared to the ground powder, indicating that there was a decrease in the crystallite size (or increasing lattice strain) due to milling [36].
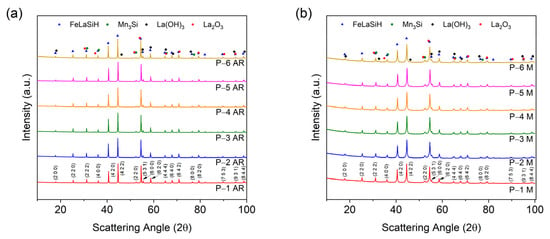
Figure 3.
XRD patterns for (a) the as-received (ground) (P-1 AR–P-6 AR) and (b) the milled (30 min.) (P-1 M–P-6 M) magnetocaloric powders for scattering angles of 10–100° 2θ. The Miller indices are shown for the peaks for powders P-1 AR and P-1 M.
The results of the Rietveld refinements (see Table A1 and Table A2 in Appendix A) indicates that all of the powders contained the cubic phases LaFe11.31Si1.69H1.51 (space group Fmc (226)) and Mn3Si (space group Fmm (225)). All of the as-received powders P-1 AR–P-6 AR as well as milled powder P-1 M contained a hexagonal La2O3 (space group Pm1 (164)) phase, whereas as-received powders P-2 AR–P-6 AR and milled powders P-2 M–P-6 M contained a hexagonal La(OH)3 (space group P63/m (176)) phase. The difference in the La-based oxygen-containing phases may be a consequence of either the differing amount of oxygen content present in the as-received powders, or contamination during the milling process. All of the milled powders contained less than one weight percent (wt.%) oxide phases, indicating that no significant contamination of the powders occurred during milling. As for the as-received powders, the LaFeSiH and MnSi phases ranged from 95.5 wt.% (P-6 AR) to 96.9 wt.% (P-1 AR) and 2.40 wt.% to 3.66 wt.%, respectively. After milling, the same phases ranged from 93.8 wt.% (P-4 M) to 95.6 wt.% (P-1 M) and 4.01 wt.% (P-5 M) to 5.51 wt.% (P-4 M), respectively. The above results indicate that milling for 30 min did not significantly decrease the amount of the primary magnetocaloric LaFeSiH phase in the powder. Lastly, the lattice volume of the LaFeSiH phase increased with respect to the Fe content in the powder and after milling.
To give a clearer comparison between the phase composition of the different powders, a bar graph for the wt.% of the different phases in the as-received powders P-1 AR–P-6 AR and milled powders P-1 M–P-6 M are plotted in Figure 4a,b. All of the powders contained a similar amount of the LaFeSiH and MnSi phases, which suggests that the milling procedure was reproducible. Finally, the similarity in the phase content of the powders (see Table A1 and Table A2 and Figure 4a,b) indicates that during milling, the powder composition had no significant effect on the phase structure.
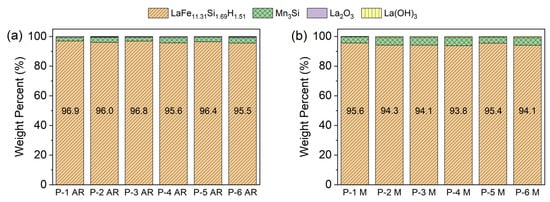
Figure 4.
Bar chart comparing the amount of each phase for the (a) as-received (ground) (P-1 AR–P-6 AR) and (b) milled P-1 M–P-6 M powders, as obtained from the Rietveld refinement analysis.
Table 3 displays the crystallite size and microstrain for the LaFeSiH and MnSi crystal phases in the as-received (ground) P-1 AR–P-6 AR and milled P-1 M–P-6 M powders. Milling led to a significant decrease in the crystallite size and increase in the microstrain of both phases. The increase in the microstrain was attributed to the increase in the stored energy in the lattice [37]. The most significant change in the crystallite size of the LaFeSiH phase was observed in powder P-3 AR, where the size decreased from 2138 Å to 488 Å after milling. The largest decrease in the MnSi phase occurred in powder P-6 AR, where the size decreased from 475 Å to 225 Å after milling. The most substantial change in the lattice strain of the LaFeSiH phase was observed in powder P6-AR, where the microstrain increased from 0.01% to 0.15% after milling. In terms of the MnSi phase, the largest increase in the strain occurred in powder P3-AR, where the microstrain increased from 0.02% to 0.24% after milling. As for each of the as-received and milled powders, there was not an obvious trend with regards to the crystallite size and microstrain. For the LaFeSiH phase in the as-received powders, the crystallite size and microstrain values ranged from 1624 to 2186 Å and 0.01 to 0.03%, respectively. As for the MnSi phase, the crystallite size varied from 413 to 475 Å while the microstrain ranged from 0.02 to 0.04%. As for the milled powders, the crystallite size and microstrain values for the LaFeSiH phase ranged from 488 to 858 Å and 0.09 to 0.15%, respectively. As for the MnSi phase, the crystallite size varied from 210 to 252 Å while the microstrain ranged from 0.17 to 0.24%.

Table 3.
The crystallite size and strain for the LaFe11.31Si1.69H1.51 and Mn3Si phases present in the as-received (grounded (P-1 AR–P-6 AR) and milled (P-1 M–P-6 M) powders.
Figure 5a displays the results of the temperature-dependent magnetization (M(T)) measurements performed in a 1 kOe field for the as-received and milled powders P-1 AR and P-1 M. The peak Curie temperatures of 15.4 °C and 18.3 °C for the as-received and milled powders, respectively, are marked by red arrows. It was found that the milling led to an increase in the peak width as well as a decrease in the amplitude. This increase in the width is indicative of a broader spread of Curie temperatures within the sample, likely arising from a spread of crystallite sizes (consistent with data in Figure 2) or microstrains in the ferromagnetic phase. The results also showed that milling led to an increase in the Curie temperature of the powder. The Curie temperatures, as determined by taking the temperature differential of the magnetization and identifying the minima of the peak associated with the transition (the point of maximum slope), are displayed in Figure 5b. Here, all samples showed a Curie temperature in the range of 4 °C–20 °C. Furthermore, except for samples P-5 AR (0.43 atomic percent (at.%) Mn) and P-6 M (0.44 at.% Mn), the Tc in both the as-received and milled powders generally decreased with increasing Mn content. This discrepancy in the decreasing trend may be due to some inhomogeneity in the samples. Additionally, an increase in Tc of about 3–6 °C after milling was also observed for samples P-5 AR (0.43 at.% Mn) and P-6 AR (0.44 at.% Mn). This increase in Tc may be a consequence of the milling-induced increase in the lattice size and microstrain. However, a more detailed microstructural investigation is needed to better understand this phenomenon.
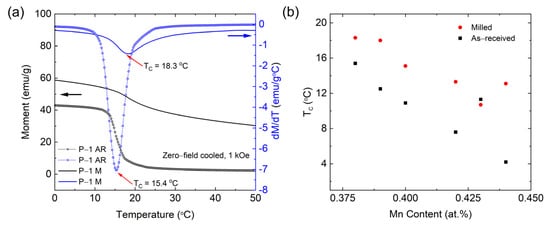
Figure 5.
Magnetization of the milled powders, measured in 1 kOe after cooling in zero field. M(T) and dM/dT for the sample with Mn content of 0.38 at.% is shown in (a), demonstrating the broad transition at Tc. The peak Curie temperatures of 15.4 °C and 18.3 °C for the as-received and milled powders, respectively, are marked by red arrows. The Tc for all alloys (0.38, 0.39, 0.40, 0.42, 0.43, and 0.44 at.% Mn) is presented in (b), indicating a general downward trend of Tc with increasing Mn content but a persistent increase in Tc due to milling.
Figure 6a,b presents the differential scanning calorimetry (DSC) curves for the as-received and milled powders for temperatures ranging from −40 to 100 °C. Clear Curie transition peaks were observed for all the samples in the range of −4 to 13 °C. Furthermore, the peaks for the as-received powders (P-1 AR–P-6 AR) are significantly more pronounced as compared to the milled powders P-1 M–P-6 M. Similar to the results for the XRD and magnetic measurement characterization, the peak widths are more broad in the milled powders, which indicates that milling reduced the crystallinity of the powders, which was accompanied by both a decrease in the crystallite size and an increase in the microstrain of the LaFe11.31Si1.69H1.51 and Mn3Si phases (see Table 3). For both sets of patterns, the peaks exhibit a shift towards lower temperatures with an increase in the Mn content, as indicated by the arrow in the graph. For the same Mn content, the Curie temperature increased after milling (see Figure 7), which is consistent with the results obtained from the Temperature dependent magnetization measurements. Lastly, the Curie temperature obtained from the DSC is lower than the temperature dependent magnetization measurement, which is possibly due to the different testing mechanism and the applied magnetic field that increases the ordering temperature.
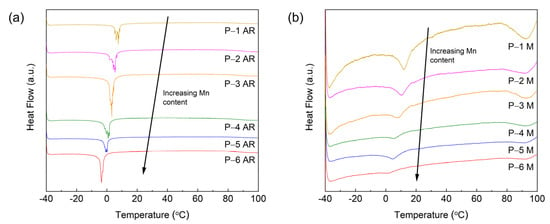
Figure 6.
The heat flow as a function of the temperature (−40 to 100 °C) for the (a) as-received (ground) P-1 AR–P-6 AR and (b) milled P-1 M–P-6 M powders.
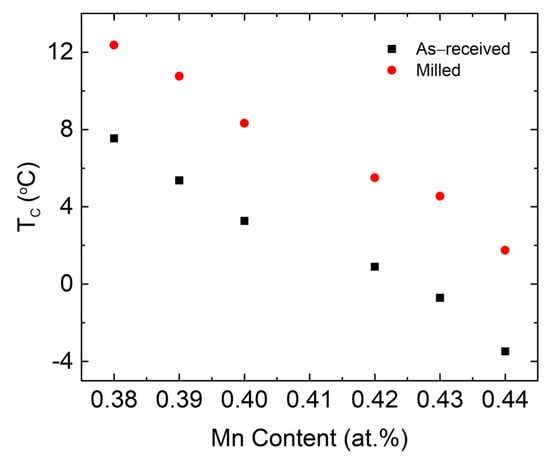
Figure 7.
The Tc for both the as-received and milled powders as a function of the Mn content, as determined from the DSC experiments.
3. Materials and Methods
Six LaFe11.71-xMnxSi1.29H1.6 (x = 0.38, 0.39, 0.40, 0.42, 0.43, and 0.44) magnetocaloric powders were obtained from Vacuumschmelze GmbH & Co. KG [22,38]. The particle composition and Curie temperature of the as-received powders are displayed in Table 1. These powders had Curie temperatures that ranged from 3.7 to 12.1 °C. Furthermore, the Curie temperature increased with respect to an increase in the Fe content and, conversely, with a decrease in the Mn content.
Milling of the powders was performed using a SPEX SamplePrep 8000M Mixer Mill. Here, 3 mm stainless steel balls were used as the grinding medium in which a 5/1 steel ball-to-powder mass ratio was used. The steel balls and powder were then placed into a stainless-steel container. Subsequently, 2-propanol was poured into the container to act as a milling solvent. The container was closed and then put into a sealed vacuum chamber where it was exposed to a rough vacuum (~1 kPa) that was applied for 1 min and then subsequently backfilled with Ar. This process of applying vacuum and backfilling with Ar was repeated twice so as to reduce the chances of powder oxidation [39]. Next, the steel container was milled for a total of 30 min in increments of 2 min. To mitigate any thermally induced chemical reactions during the grinding process, the container was placed into an ice water bath (1 min) between each milling step.
Optical images were taken using a Leica DM5000M using a 500X lens. Powder was mounted in epoxy and then ground and polished using a Struers TegraForce-5/TegraPol-31 polishing system. Samples then underwent vibration polishing using a VibroMet™ 2 vibratory polisher with a colloidal silica (0.05 micron) suspension which consisted of a mixture of 50% Colloidal Silica (Syton HT-50) and 50% Distilled Water, for approximately 5–6 h, to produce a high quality surface.
The XRD characterization was performed at the Joint Institute for Advanced Materials (JIAM) Diffraction Facility located at the University of Tennessee. Here, as-received powders P-1 AR–P-6 AR were ground in a mortar and pestle and then used as a control sample. The XRD was performed using a PANalytical Empyrean diffractometer equipped with an Fe filter, 0.04 radian soller slit, 1/4° divergence slit, 10 mm mask, and 1/2° anti-scatter slit on the incident side and 1/4° anti-scatter slit, 0.04 radian soller slits, and PIXcel3D Medipix3 detector on the diffracted side. The X-ray consisted of a Co beam with a Kα wavelength of 1.79 Å, in addition to an accelerating voltage and current of 45 kV and 40 mA, respectively. The scan was performed for 2θ angles ranging from 10 to 100°.
Subsequent powder diffraction, in conjunction with qualitative and quantitative phase analysis, was performed to analyze the crystal phases in the alloy. Phase identification (ID) and quantitative phase analysis were performed in Highscore Plus using the Powder Diffraction File-4+ (PDF-4+) database. The lattice parameter and volume was determined by Rietveld refinement. Having first accounted for instrumental broadening using a NIST 640e silicon standard, the microstrain and crystallite size were determined using the pseudo-Voigt profile function. For the microstrain, the following equations were used [40]:
where et is the microstrain, U is a parameter that pertains to the strain broadening, W is a parameter that corrects for a possible size broadening, and the subscripts i and std represent the given reflection and the standard, respectively. The variance of the microstrain is defined by
where Ae is equal to
In terms of the crystallite size, it is calculated via the following equation [41,42]:
where Di is the crystallite size and λ is the wavelength of the X-rays. The variance of the crystallite size is defined as
where AD represents the constant 180 × λ/π.
The particle size distributions of the magnetocaloric powders were measured in ethanol by a commercial Horiba La-950V2 laser scattering analyzer, which uses a laser diffraction method to measure size distribution. This technique uses first principles to calculate size using light scattered off the edge of the particle and secondary refraction through the particle. To span a range of 30 nm to 3 mm, the LA-950 uses two light sources of different wavelengths: a 5 mW 650 nm red laser diode and a 3 mW 405 nm blue solid-state light emitting diode (LED). The analysis software computes the particle size distribution using the full Mie scattering theory [43]. The instrument was fitted with a minicell that requires only milligram portions of each powder. To maintain a homogeneous ensemble, the sample was circulated through the optical cell using the highest flow rate possible for the instrument. An index of refraction of 1.8 and 1.36 was used for the powders and the ethanol, respectively. The particle size distribution for each sample was measured several times during circulation through the instrument.
The size and shape factors of the milled powders were analyzed using a Malvern Morphologi G3 optical microscope system. For the analysis, the particles were dispersed on a glass plate using a sample dispersion unit. Dispersing the particles in this manner ensured that the particles were uniformly arranged on the glass such that the effects of adhesion on the particles were minimized. The accompanying software package was used to analyze the circularity and aspect ratio parameters.
Magnetic measurements were conducted in a Quantum Design Physical Properties Measurement System (PPMS), using the VSM option to control temperature from −120 °C to 120 °C. Samples were first heated to 120 °C in zero field, then cooled to −120 °C, and a measuring field of 1 kOe was applied to define an axis of magnetization. Temperature-dependent magnetization measurements were conducted in continuous measurement mode using a temperature ramp rate of 5 °C/min. Here, both zero-field cooled and field-cooled measurements were conducted over the temperature from −120 °C to 120 °C, with ZFC warming in a 1 kOe field, and FC cooling in the same 1 kOe field. The Tc was determined by calculating dM/dT and taking the maximum of the peaks corresponding to the ferromagnetic transition.
The Curie temperature was determined with the DSC, which was performed using a TA Instruments DSC 2500 model in the range of −40 to 100 °C. A heat-cool-heat cycle was used with a ramp rate of 3 °C/min under a nitrogen atmosphere. The enthalpy was calculated with the first heating cycle using Trios software (TA Instruments).
4. Conclusions
The effects of composition on multiple magnetocaloric powders were examined using different characterization techniques. The results revealed that after 30 min of high energy ball milling, the magnetocaloric powders consisted of particle sizes well below 30 µm. Importantly, XRD showed that the powders did not undergo significant phase decomposition during the milling process and that no substantial contamination of the powder occurred during milling. Optical microscopy revealed that the particle morphology was similar for all the powders after milling. The XRD, DSC, and magnetic measurements showed that milling led to an increase in the peak widths of the patterns, which indicated that milling reduced the crystallinity of the powders, decreased the crystallite size, and increased the microstrain of the LaFe11.31Si1.69H1.51 and Mn3Si phases. The findings also indicate that in most cases, the milling process led to a composition-independent increase in Tc of ~3–6 °C. This increase in Tc may be a consequence of the milling-induced increase in the lattice size and microstrain. The results suggest that the milling procedure as used for this investigation would be effective in producing viable magnetocaloric powders for use in different applications.
Author Contributions
Conceptualization, J.B., M.R.K., M.S.K., H.B.H., A.A.B., O.R. and A.M.M.; methodology, J.B., M.R.K., M.S.K., H.B.H., A.A.B., K.L., J.K., O.R. and A.M.M.; validation, J.B., M.R.K. and K.L.; formal analysis, J.B., M.S.K., H.B.H., A.A.B. and K.L.; investigation, J.B., M.R.K., H.B.H., A.A.B. and K.L.; resources, M.R.K., J.K., O.R. and A.M.M.; data curation, J.B. and M.R.K.; writing—original draft preparation, J.B., M.R.K., H.B.H. and A.A.B.; writing—review and editing, M.S.K., M.R.K., J.K., K.N., O.R. and A.M.M.; visualization, J.B., H.B.H. and A.A.B.; supervision, K.N., O.R. and A.M.M.; project administration, O.R. and A.M.M.; funding acquisition, O.R. and A.M.M. All authors have read and agreed to the published version of the manuscript.
Funding
This work was sponsored by the U. S. Department of Energy’s Building Technologies Office under Contract No. DE-AC05-00OR22725 with UT-Battelle, LLC. This work was also performed under the auspices of the U.S. Department of Energy by Lawrence Livermore National Laboratory under Contract DE-AC52-07NA27344.
Acknowledgments
This research used resources at the Building Technologies Research and Integration Center, a DOE Office of Science User Facility operated by the Oak Ridge National Laboratory. We would like to acknowledge Antonio Bouza the Technology Manager for the HVAC & Appliances for his support. The authors would also like to thank Mingkan Zhang for helpful discussions.
Conflicts of Interest
The authors declare no conflict of interest.
Appendix A

Table A1.
Chemical composition of as-received (ground) powders P-1 AR–P-6 AR. All phase constituents are presented as wt.%.
Table A1.
Chemical composition of as-received (ground) powders P-1 AR–P-6 AR. All phase constituents are presented as wt.%.
| Sample | Phase | wt.% | Crystal System | Space Group (No.) | Lattice Parameter (Å) | Volume (Å3) |
|---|---|---|---|---|---|---|
| P-1 AR | LaFe11.31Si1.69H1.51 | 96.90 | Cubic | Fmc (226) | a = 11.56 | 1544.59 |
| b = 11.56 | ||||||
| c = 11.56 | ||||||
| Mn3Si | 2.40 | Cubic | Fmm (225) | a = 5.73 | 188.55 | |
| b = 5.73 | ||||||
| c = 5.73 | ||||||
| La2O3 | 0.67 | Hexagonal | Pm1 (164) | a = 3.94 | 82.69 | |
| b = 3.94 | ||||||
| c = 6.15 | ||||||
| P-2 AR | LaFe11.31Si1.69H1.51 | 96.00 | Cubic | Fmc (226) | a = 11.56 | 1544.35 |
| b = 11.56 | ||||||
| c = 11.56 | ||||||
| Mn3Si | 3.34 | Cubic | Fmm (225) | a = 5.74 | 188.87 | |
| b = 5.74 | ||||||
| c = 5.74 | ||||||
| La(OH)3 | 0.29 | Hexagonal | P63/m (176) | a = 6.53 | 142.89 | |
| b = 6.53 | ||||||
| c = 3.87 | ||||||
| La2O3 | 0.38 | Hexagonal | Pm1 (164) | a = 3.94 | 82.76 | |
| b = 3.94 | ||||||
| c = 6.16 | ||||||
| P-3 AR | LaFe11.31Si1.69H1.51 | 96.80 | Cubic | Fmc (226) | a = 11.56 | 1544.61 |
| b = 11.56 | ||||||
| c = 11.56 | ||||||
| Mn3Si | 2.53 | Cubic | Fmm (225) | a = 5.74 | 188.92 | |
| b = 5.74 | ||||||
| c = 5.74 | ||||||
| La(OH)3 | 0.16 | Hexagonal | P63/m (176) | a = 6.54 | 143.28 | |
| b = 6.54 | ||||||
| c = 3.87 | ||||||
| La2O3 | 0.48 | Hexagonal | Pm1 (164) | a = 3.94 | 82.86 | |
| b = 3.94 | ||||||
| c = 6.17 | ||||||
| P-4 AR | LaFe11.31Si1.69H1.51 | 95.60 | Cubic | Fmc (226) | a = 11.56 | 1544.24 |
| b = 11.56 | ||||||
| c = 11.56 | ||||||
| Mn3Si | 3.66 | Cubic | Fmm (225) | a = 5.74 | 188.90 | |
| b = 5.74 | ||||||
| c = 5.74 | ||||||
| La(OH)3 | 0.11 | Hexagonal | P63/m (176) | a =6.53 | 142.06 | |
| b = 6.53 | ||||||
| c = 3.84 | ||||||
| La2O3 | 0.61 | Hexagonal | Pm1 (164) | a = 3.94 | 82.68 | |
| b = 3.94 | ||||||
| c = 6.15 | ||||||
| P-5 AR | LaFe11.31Si1.69H1.51 | 96.40 | Cubic | Fmc (226) | a = 11.56 | 1544.34 |
| b = 11.56 | ||||||
| c = 11.56 | ||||||
| Mn3Si | 3.04 | Cubic | Fmm (225) | a = 5.74 | 188.89 | |
| b = 5.74 | ||||||
| c = 5.74 | ||||||
| La(OH)3 | 0.03 | Hexagonal | P63/m (176) | a = 6.52 | 142.44 | |
| b = 6.52 | ||||||
| c = 3.87 | ||||||
| La2O3 | 0.55 | Hexagonal | Pm1 (164) | a = 3.94 | 82.78 | |
| b = 3.94 | ||||||
| c = 6.16 | ||||||
| P-6 AR | LaFe11.31Si1.69H1.51 | 95.50 | Cubic | Fmc (226) | a = 11.56 | 1543.68 |
| b = 11.56 | ||||||
| c = 11.56 | ||||||
| Mn3Si | 3.60 | Cubic | Fmm (225) | a = 5.74 | 188.98 | |
| b = 5.74 | ||||||
| c = 5.74 | ||||||
| La(OH)3 | 0.28 | Hexagonal | P63/m (176) | a = 6.53 | 142.96 | |
| b = 6.53 | ||||||
| c = 3.87 | ||||||
| La2O3 | 0.57 | Hexagonal | Pm1 (164) | a = 3.94 | 82.70 | |
| b = 3.94 | ||||||
| c = 6.16 |

Table A2.
Chemical composition of milled (30 min) powders P-1 M–P-6 M. All phase constituents are presented as wt.%.
Table A2.
Chemical composition of milled (30 min) powders P-1 M–P-6 M. All phase constituents are presented as wt.%.
| Sample | Phase | wt.% | Crystal System | Space Group (No.) | Lattice Parameter (Å) | Volume (Å3) |
|---|---|---|---|---|---|---|
| P-1 M | LaFe11.31Si1.69H1.51 | 95.60 | Cubic | Fmc (226) | a = 11.57 | 1547.96 |
| b = 11.57 | ||||||
| c = 11.57 | ||||||
| Mn3Si | 4.10 | Cubic | Fmm (225) | a = 5.73 | 188.57 | |
| b = 5.73 | ||||||
| c = 5.73 | ||||||
| La2O3 | 0.29 | Hexagonal | Pm1 (164) | a = 3.95 | 82.89 | |
| a = 3.95 | ||||||
| c = 6.15 | ||||||
| P-2 M | LaFe11.31Si1.69H1.51 | 94.30 | Cubic | Fmc (226) | a = 11.57 | 1547.47 |
| b = 11.57 | ||||||
| c = 11.57 | ||||||
| Mn3Si | 4.80 | Cubic | Fmm (225) | a = 5.73 | 188.45 | |
| b = 5.73 | ||||||
| c = 5.73 | ||||||
| La(OH)3 | 0.88 | Hexagonal | P63/m (176) | a = 6.54 | 143.47 | |
| b = 6.54 | ||||||
| c = 3.87 | ||||||
| P-3 M | LaFe11.31Si1.69H1.51 | 94.10 | Cubic | Fmc (226) | a = 11.57 | 1547.39 |
| b = 11.57 | ||||||
| c = 11.57 | ||||||
| Mn3Si | 5.20 | Cubic | Fmm (225) | a = 5.73 | 188.55 | |
| b = 5.73 | ||||||
| c = 5.73 | ||||||
| La(OH)3 | 0.68 | Hexagonal | P63/m (176) | a = 6.54 | 143.52 | |
| b = 6.54 | ||||||
| c = 3.87 | ||||||
| P-4 M | LaFe11.31Si1.69H1.51 | 93.80 | Cubic | Fmc (226) | a = 11.57 | 1547.09 |
| b = 11.57 | ||||||
| c = 11.57 | ||||||
| Mn3Si | 5.51 | Cubic | Fmm (225) | a = 5.73 | 188.19 | |
| b = 5.73 | ||||||
| c = 5.73 | ||||||
| La(OH)3 | 0.69 | Hexagonal | P63/m (176) | a = 6.53 | 142.92 | |
| b = 6.53 | ||||||
| c = 3.87 | ||||||
| P-5 M | LaFe11.31Si1.69H1.51 | 95.43 | Cubic | Fmc (226) | a = 11.56 | 1546.73 |
| b = 11.56 | ||||||
| c = 11.56 | ||||||
| Mn3Si | 4.01 | Cubic | Fmm (225) | a = 5.73 | 188.28 | |
| b = 5.73 | ||||||
| c = 5.73 | ||||||
| La(OH)3 | 0.54 | Hexagonal | P63/m (176) | a = 6.54 | 143.54 | |
| b = 6.54 | ||||||
| c = 3.88 | ||||||
| P-6 M | LaFe11.31Si1.69H1.51 | 94.13 | Cubic | Fmc (226) | a = 11.56 | 1546.52 |
| b = 11.56 | ||||||
| c = 11.56 | ||||||
| Mn3Si | 5.21 | Cubic | Fmm (225) | a = 5.73 | 188.23 | |
| b = 5.73 | ||||||
| c = 5.73 | ||||||
| La(OH)3 | 0.75 | Hexagonal | P63/m (176) | a = 6.54 | 143.25 | |
| b = 6.54 | ||||||
| c = 3.86 |
References
- Momen, A.M.; Abdelaziz, O.; Gluesenkamp, K.; Vineyard, E.; Benedict, M. Thermofluid Analysis of Magnetocaloric Refrigeration; Amer. Soc. Mechanical Engineers: New York, NY, USA, 2015. [Google Scholar]
- Zhang, M.K.; Momen, A.M.; Abdelaziz, O. The operating principle of a fully solid state active magnetic regenerator. In 7th International Conference on Magnetic Refrigeration at Room Temperature; Sandeman, K., Bruck, E., LoBue, M., Barbosa, J., KedousLebouc, A., Rowe, A., Eds.; Int Inst Refrigeration: Paris, France, 2016; pp. 59–62. [Google Scholar] [CrossRef]
- Nicholson, D.M.; Odbadrakh, K.; Shassere, B.A.; Rios, O.; Hodges, J.; Ludtka, G.M.; Porter, W.D.; Sefat, A.S.; Rusanu, A.; Brown, G.; et al. Modeling and characterization of the magnetocaloric effect in Ni2MnGa materials. Int. J. Refrig.-Rev. Int. Froid 2014, 37, 289–296. [Google Scholar] [CrossRef]
- Zhang, M.; Mehdizadeh Momen, A.; Abdelaziz, O. Preliminary analysis of a fully solid state magnetocaloric refrigeration. In Proceedings of the 16th International Refrigeration and Air-Conditioning Conference, West Lafayette, IN, USA, 11–14 July 2016. [Google Scholar]
- Zhang, M.K.; Abdelaziz, O.; Momen, A.M.; Abu-Heiba, A. A numerical analysis of a magnetocaloric refrigerator with a 16-layer regenerator. Sci. Rep. 2017, 7, 12. [Google Scholar] [CrossRef] [Green Version]
- Zhang, M.; Abuheiba, A.; Gluesenkamp, K.R.; Mehdizadeh Momen, A. Fully Solid State Thermomagnetoelectric Generator: Cycle Model and Proof-of-Concept Results; Oak Ridge National Lab.(ORNL): Oak Ridge, TN, USA, 2018. [Google Scholar]
- Momen, A. Magnetocaloric Materials Revolutionize Refrigeration Technology; Oak Ridge National Lab.(ORNL): Oak Ridge, TN, USA, 2016. [Google Scholar]
- Aprea, C.; Greco, A.; Maiorino, A.; Masselli, C. Magnetic refrigeration: An eco-friendly technology for the refrigeration at room temperature. J. Phys. Conf. Ser. 2015, 655, 012026. [Google Scholar] [CrossRef]
- Gomez, J.R.; Garcia, R.F.; Catoira, A.D.; Gomez, M.R. Magnetocaloric effect: A review of the thermodynamic cycles in magnetic refrigeration. Renew. Sust. Energ. Rev. 2013, 17, 74–82. [Google Scholar] [CrossRef]
- Kitanovski, A.; Tušek, J.; Tomc, U.; Plaznik, U.; Ožbolt, M.; Poredoš, A. Magnetocaloric Energy Conversion: From Theory to Applications; Springer International Publishing: Cham, Switzerland, 2014. [Google Scholar]
- Pecharsky, V.K.; Gschneidner, K.A. Giant magnetocaloric effect in Gd-5(Si2Ge2). Phys. Rev. Lett. 1997, 78, 4494–4497. [Google Scholar] [CrossRef]
- Gschneidner, K.A.; Pecharsky, V.K. Thirty years of near room temperature magnetic cooling: Where we are today and future prospects. Int. J. Refrig. 2008, 31, 945–961. [Google Scholar] [CrossRef] [Green Version]
- Bez, H.N.; Eggert, B.G.F.; Lozano, J.A.; Bahl, C.R.H.; Barbosa, J.R.; Teixeira, C.S.; Wendhausen, P.A.P. Magnetocaloric effect and H gradient in bulk La(Fe,Si)(13)H-y magnetic refrigerants obtained by HDSH. J. Magn. Magn. Mater. 2015, 386, 125–128. [Google Scholar] [CrossRef] [Green Version]
- Fukamichi, K.; Fujita, A.; Fujieda, S. Large magnetocaloric effects and thermal transport properties of La(FeSi)13 and their hydrides. J. Alloys Compd. 2006, 408–412, 307–312. [Google Scholar] [CrossRef]
- Wada, H.; Tanabe, Y. Giant magnetocaloric effect of MnAs1-xSbx. Appl. Phys. Lett. 2001, 79, 3302–3304. [Google Scholar] [CrossRef]
- Wada, H.; Morikawa, T.; Taniguchi, K.; Shibata, T.; Yamada, Y.; Akishige, Y. Giant magnetocaloric effect of MnAs1-xSbx in the vicinity of first-order magnetic transition. Phys. B 2003, 328, 114–116. [Google Scholar] [CrossRef]
- Tegus, O.; Bruck, E.; Buschow, K.H.J.; de Boer, F.R. Transition-metal-based magnetic refrigerants for room-temperature applications. Nature 2002, 415, 150–152. [Google Scholar] [CrossRef]
- Katter, M.; Zellmann, V.; Reppel, G.W.; Uestuener, K. Magnetocaloric Properties of La(Fe, Co, Si)(13) Bulk Material Prepared by Powder Metallurgy. IEEE Trans. Magn. 2008, 44, 3044–3047. [Google Scholar] [CrossRef]
- Katter, M.; Zellmann, V.; Barcza, A. Sintering behaviour and thermally induced decomposition and recombination (TDR) PROCESS OF LaFe13-x-yCoxSiy alloys. In Proceedings of the 4th International Conference of IIR on Magnetic Refrigeration at Room Temperature, Baotou, Inner Mongolia, China, 23–27 August 2010; pp. 49–62. [Google Scholar]
- Fujita, A.; Akamatsu, Y.; Fukamichi, K. Itinerant electron metamagnetic transition in La(FexSi1-x)(13) intermetallic compounds. J. Appl. Phys. 1999, 85, 4756–4758. [Google Scholar] [CrossRef]
- Fujita, A.; Fujieda, S.; Fukamichi, K.; Mitamura, H.; Goto, T. Itinerant-electron metamagnetic transition and large magnetovolume effects in La(FexSi1-x)(13) compounds. Phys. Rev. B 2002, 65, 6. [Google Scholar] [CrossRef]
- Barcza, A.; Katter, M.; Zellmann, V.; Russek, S.; Jacobs, S.; Zimm, C. Stability and Magnetocaloric Properties of Sintered La(Fe, Mn, Si)13Hz Alloys. IEEE Trans. Magn. 2011, 47, 3391–3394. [Google Scholar] [CrossRef]
- Wang, C.; Long, Y.; Ma, T.; Fu, B.; Ye, R.; Chang, Y.; Hu, F.; Shen, J. The hydrogen absorption properties and magnetocaloric effect of La0.8Ce0.2(Fe1−xMnx)11.5Si1.5Hy. J. Appl. Phys. 2011, 109, 07A910. [Google Scholar] [CrossRef]
- Basso, V.; Küpferling, M.; Curcio, C.; Bennati, C.; Barzca, A.; Katter, M.; Bratko, M.; Lovell, E.; Turcaud, J.; Cohen, L.F. Specific heat and entropy change at the first order phase transition of La(Fe-Mn-Si)13-H compounds. J. Appl. Phys. 2015, 118, 053907. [Google Scholar] [CrossRef]
- Wood, M.E.; Potter, W.H. General-analysis of magnetic refrigeration and its optimization using a new concept—Maximization of refrigerant capacity. Cryogenics 1985, 25, 667–683. [Google Scholar] [CrossRef]
- Chen, Y. Chapter 3—Solid-state formation of carbon nanotubes. In Carbon Nanotechnology; Dai, L., Ed.; Elsevier: Amsterdam, The Netherlands, 2006; pp. 53–80. [Google Scholar] [CrossRef]
- Phejar, M.; Paul-Boncour, V.; Bessais, L. Structural and magnetic properties of magnetocaloric LaFe13-xSix compounds synthesized by high energy ball-milling. Intermetallics 2010, 18, 2301–2307. [Google Scholar] [CrossRef]
- Passamani, E.C.; Takeuchi, A.Y.; Alves, A.L.; Demuner, A.S.; Favre-Nicolin, E.; Larica, C.; Proveti, J.R.; Gomes, A.M. Magnetocaloric properties of (La,RE)Fe11.4Si1.6 compounds (RE=Y,Gd). J. Appl. Phys. 2007, 102, 4. [Google Scholar] [CrossRef]
- Mandal, K.; Gutfleisch, O.; Yan, A.; Handstein, A.; Muller, K.H. Effect of reactive milling in hydrogen on the magnetic and magnetocaloric properties of LaFe11.57Si1.43. J. Magn. Magn. Mater. 2005, 290, 673–675. [Google Scholar] [CrossRef]
- Mandal, K.; Pal, D.; Gutfleisch, O.; Kerschl, P.; Muller, K.H. Magnetocaloric effect in reactively-milled LaFe11.57Si1.43Hy intermetallic compounds. J. Appl. Phys. 2007, 102, 5. [Google Scholar] [CrossRef]
- Blázquez, J.S.; Ipus, J.J.; Moreno-Ramírez, L.M.; Borrego, J.M.; Lozano-Pérez, S.; Franco, V.; Conde, C.F.; Conde, A. Analysis of the Magnetocaloric Effect in Powder Samples Obtained by Ball Milling. Metall. Mater. Trans. E 2015, 2, 131–138. [Google Scholar] [CrossRef] [Green Version]
- Piras, C.C.; Fernandez-Prieto, S.; De Borggraeve, W.M. Ball milling: A green technology for the preparation and functionalisation of nanocellulose derivatives. Nanoscale Adv. 2019, 1, 937–947. [Google Scholar] [CrossRef] [Green Version]
- Kocsor, L.; Peter, L.; Corradi, G.; Kis, Z.; Gubicza, J.; Kovacs, L. Mechanochemical Reactions of Lithium Niobate Induced by High-Energy Ball-Milling. Crystals 2019, 9, 15. [Google Scholar] [CrossRef] [Green Version]
- Begin-Colin, S.; Girot, T.; Mocellin, A.; Le Caër, G. Kinetics of formation of nanocrystalline TiO2 II by high energy ball-milling of anatase TiO2. Nanostructured Mater. 1999, 12, 195–198. [Google Scholar] [CrossRef]
- Sano, T.; Srivatsan, T.S. Advanced Composites for Aerospace, Marine, and Land Applications II; Wiley: Hoboken, USA, 2015. [Google Scholar]
- Ungár, T. Microstructural parameters from X-ray diffraction peak broadening. Scr. Mater. 2004, 51, 777–781. [Google Scholar] [CrossRef]
- Ekström, T.; Chatfield, C.; Wruss, W.; Maly-Schreiber, M. The use of X-ray diffraction peak-broadening analysis to characterize ground Al2O3 powders. J. Mater. Sci. 1985, 20, 1266–1274. [Google Scholar] [CrossRef]
- Navickaite, K.; Bez, H.N.; Lei, T.; Barcza, A.; Vieyra, H.; Bahl, C.R.H.; Engelbrecht, K. Experimental and numerical comparison of multi-layered La(Fe,Si,Mn)(13)H-y active magnetic regenerators. Int. J. Refrig.-Rev. Int. Froid 2018, 86, 322–330. [Google Scholar] [CrossRef]
- Anderson, E.; Clark, R.W.; Dagousset, G.; Demchuk, O.M.; Harsanyi, A. Science of Synthesis Knowledge Updates: 2015/1; Thieme: New York, USA, 2015. [Google Scholar]
- Kim, Y.-Y.; Schenk, A.S.; Ihli, J.; Kulak, A.N.; Hetherington, N.B.J.; Tang, C.C.; Schmahl, W.W.; Griesshaber, E.; Hyett, G.; Meldrum, F.C. A critical analysis of calcium carbonate mesocrystals. Nat. Commun. 2014, 5, 4341. [Google Scholar] [CrossRef] [PubMed] [Green Version]
- Salasin, J.R.; Schwerzler, S.E.A.; Koehler, M.R.; Keffer, D.J.; Rawn, C.J. The effect of process parameters on the amorphous citrate sol-gel synthesis of Cu-doped Ca12Al14O33. Materialia 2018, 4, 466–477. [Google Scholar] [CrossRef]
- Salasin, J.R.; Rawn, C. In-Situ Kinetic Investigation of Calcium Aluminate Formation. Ceramics 2018, 1, 175–197. [Google Scholar] [CrossRef] [Green Version]
- Hergert, W.; Wriedt, T. The Mie Theory: Basics and Applications; Springer: Berlin/Heidelberg, Germany, 2012. [Google Scholar]
Publisher’s Note: MDPI stays neutral with regard to jurisdictional claims in published maps and institutional affiliations. |
© 2021 by the authors. Licensee MDPI, Basel, Switzerland. This article is an open access article distributed under the terms and conditions of the Creative Commons Attribution (CC BY) license (https://creativecommons.org/licenses/by/4.0/).