Article

Development of Magnetic Particle Distribution Imaging Using Magnetic Field Reconstruction for Biopsy of the Sentinel Lymph Node

1
Graduate School of Science, Kobe University, Hyogo 657-8501, Japan
2
Integral Geometry Science Co., Ltd., Hyogo 657-8501, Japan
3
Center for Mathematical and Data Sciences, Kobe University, Hyogo 657-8501, Japan
4
Japan Agency for Medical Research and Development, Tokyo 100-0004, Japan
*
Author to whom correspondence should be addressed.
Magnetochemistry 2021, 7(6), 85; https://doi.org/10.3390/magnetochemistry7060085
Submission received: 19 May 2021 / Revised: 5 June 2021 / Accepted: 9 June 2021 / Published: 15 June 2021
(This article belongs to the Special Issue Quantum Magnetic Sensors and Magnetochemistry)

Abstract

:
The sentinel lymph node is the first lymph-node-draining cancer metastasis. The identification of the sentinel lymph node using magnetic particles and a magnetic sensor has attracted attention in recent years, as this method is less invasive than the conventional method of radiotracer injection. However, the development of a two-dimensional measurement method for sentinel lymph nodes using magnetic nanoparticles remains an issue. In the present study, a method and apparatus for the two-dimensional imaging of magnetic particle distribution were developed to detect a lymph node with magnetic particles concentrated within lymphoid tissues. The method comprises the reconstruction of the magnetic field measured with a high-sensitivity magnetic sensor and with a magnetic detection ability of 2 nT/√Hz at 100 Hz (5 nT/√Hz at 1 Hz). The proposed system measures the two-dimensional magnetic field distribution in an area of up to 25 × 25 mm2 using a coil generating a 0.77 mT external magnetic field applied to the measurement target. The improved spatial resolution of the images makes it possible to use two-dimensional imaging for diagnostics of breast cancer metastases.

1. Introduction

Breast cancer is a disease that includes the growth of cancerous cells and the formation of new blood and lymphatic vessels within these cells from the existing surrounding blood vessels and lymphatic vessels. Because new blood vessels and lymphatic vessels are formed within the tumor, free-floating cancer cells from the breast cancer are transported throughout the body by these vessels and develop metastases at new locations. Specifically, lymph nodes that filter impurities in lymphatic vessels are the most susceptible tissues to cancer cell accumulation and the formation of metastases. A lymph node where the breast cancer first metastasizes is called the sentinel lymph node (SLN). Before breast cancer surgery, sentinel lymph node biopsy is performed in order to confirm whether the cancer has metastasized or not [1,2,3,4,5]. There are multiple lymph nodes in lymphoid tissues [1], and the average diameter of a lymph node is approximately 1 cm [4]. At present, the SLN is usually identified by dye-guided [2,3] and radioisotope (RI) methods [6], but the latter method is highly invasive, as a radioactive material is injected into lymphoid tissues as a tracer [7]. In recent years, the identification of the SLN using magnetic particle sensors has attracted attention due to its low invasiveness compared to the conventional methods using radiotracers [8,9]. Nanoparticles [10,11] of ferromagnets materials, such as magnetite (Fe3O4) and ferrite (MO·Fe2O3, MO: metal oxide) possessing superparamagnetic properties that exhibit magnetism and produce heat in response to electromagnetic waves, are already being used in the field of medicine [12]. With the existing dye-guided RI or magnetic particle methods, positions of metastases are manually confirmed using a Geiger counter and magnetic probe; thus, the results strongly depend on the subjective judgment of technicians, and it is difficult to directly ascertain the area of tracer distribution. In addition, identifying the SLN with the highest tracer content in all lymph nodes is challenging to experts (Figure 1a,b). This issue can be resolved by measuring the two-dimensional distribution of tracers in all lymph nodes (Figure 1c,d).
Thus, in the present work, we developed a system and apparatus to measure the two-dimensional distribution of magnetic particles using image reconstruction and a high-sensitivity magnetic sensor and demonstrated the system’s performance.

2. Results

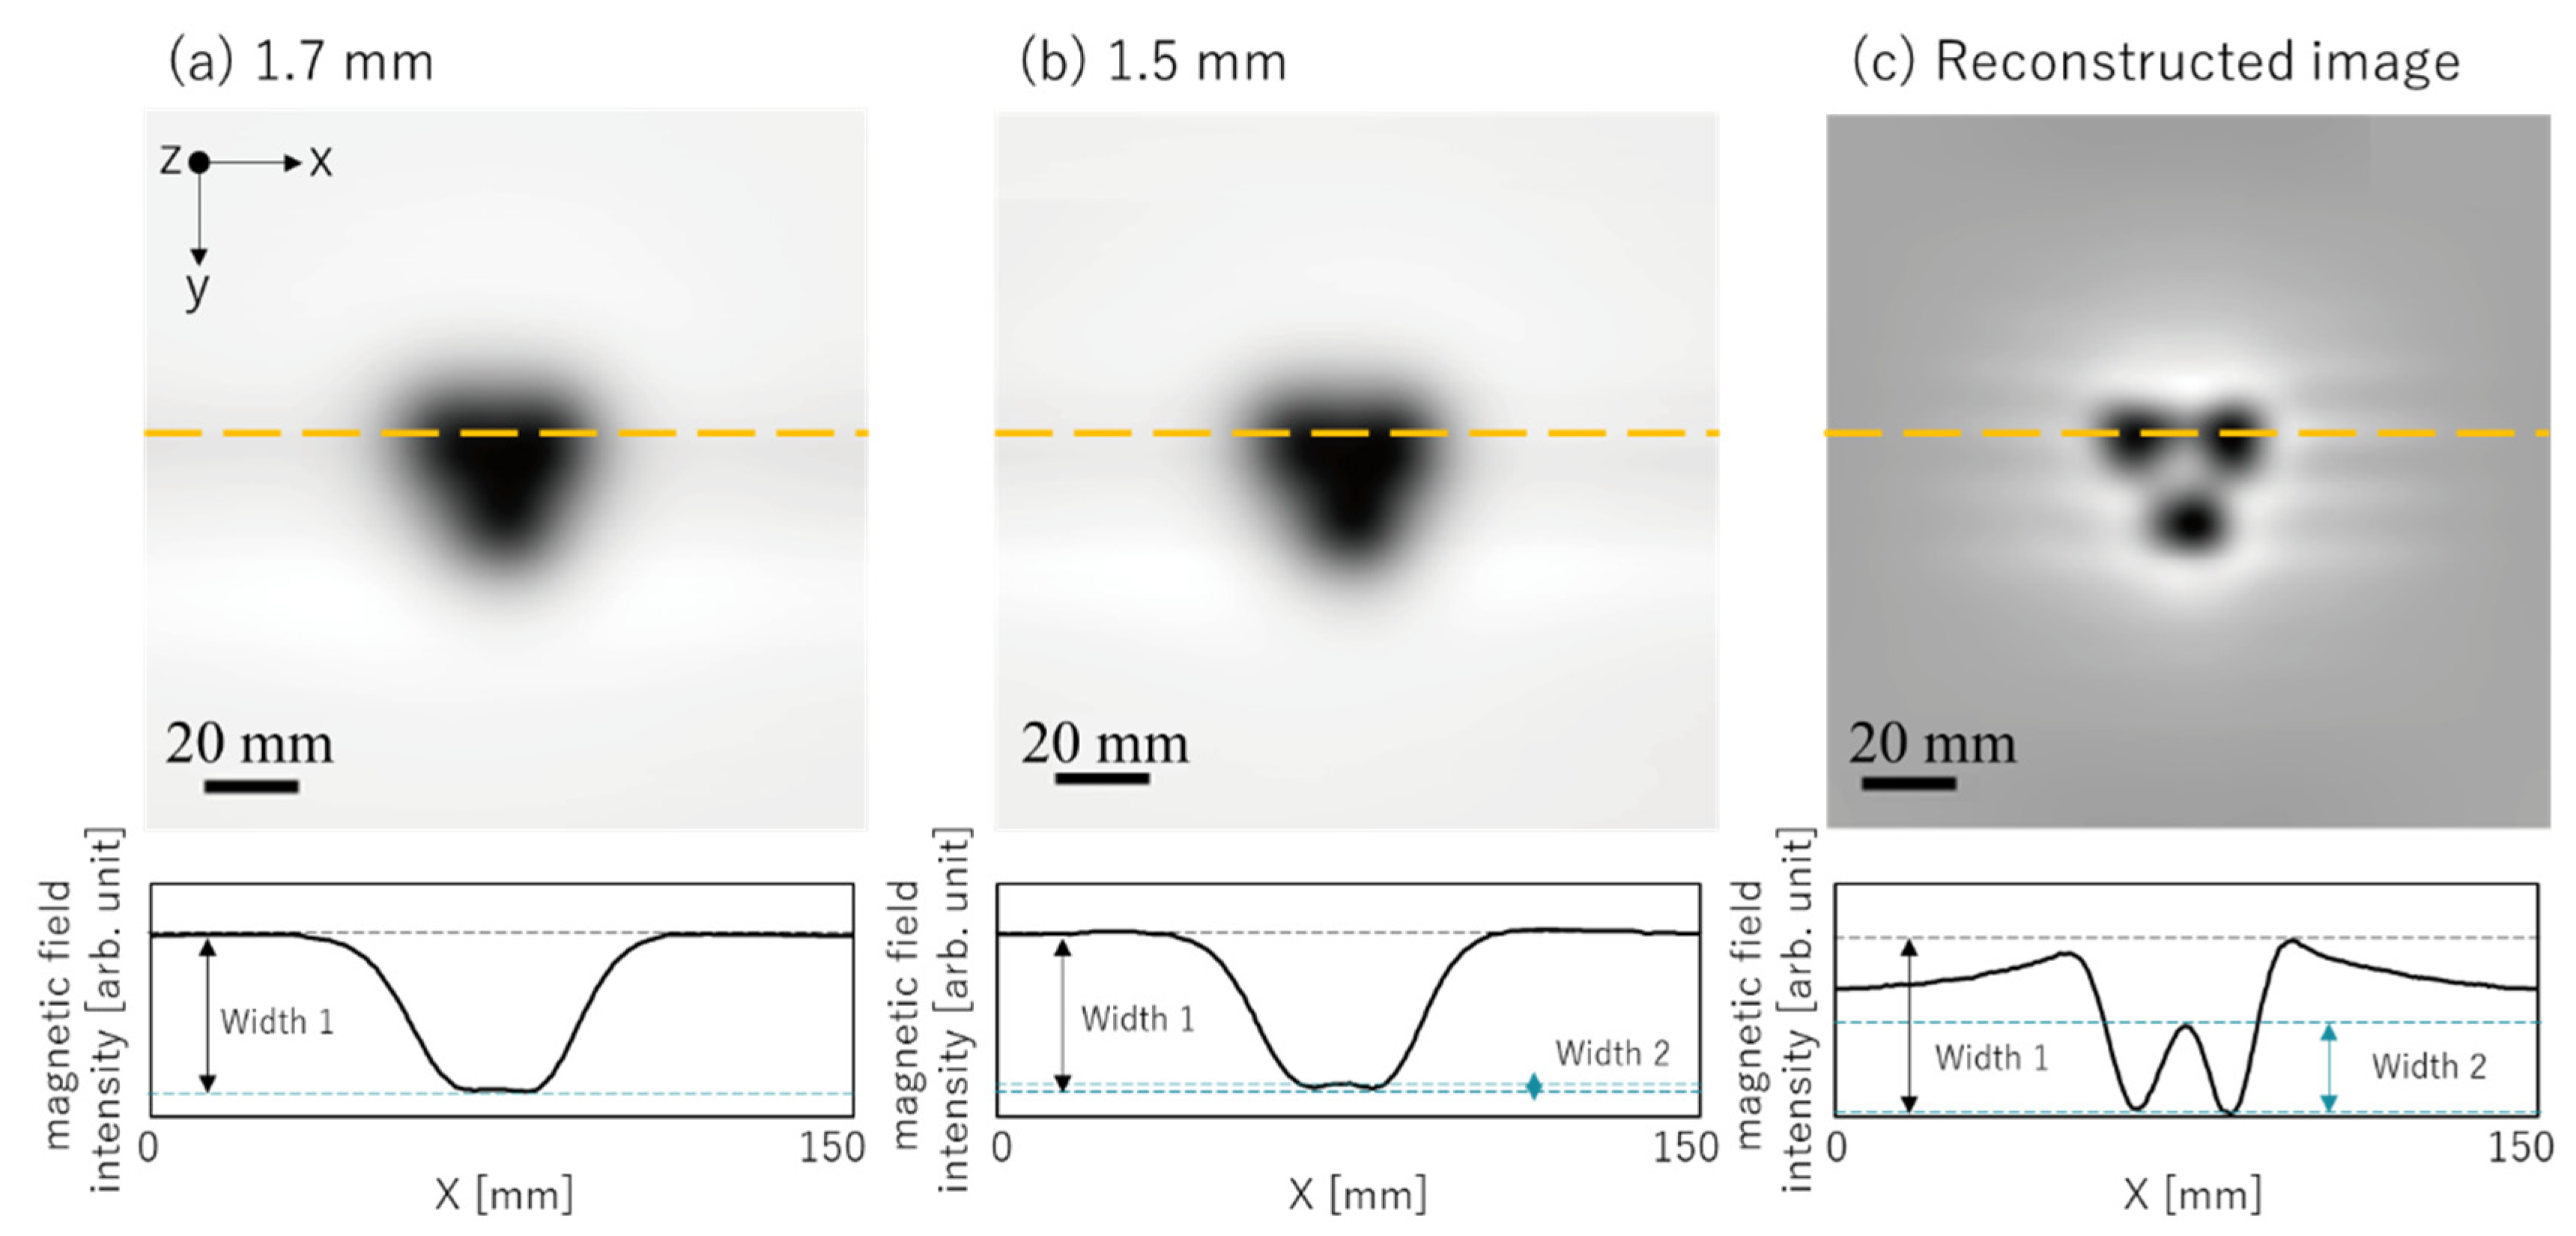
Figure 2 demonstrates the result of a verification experiment of image reconstruction using a ferrite magnet. Figure 2a,b demonstrates a magnetic field distribution measured at 1.5 and 1.7 mm from the ferrite magnet surface. Figure 2c is a reconstructed image using the two magnetic field distributions in Figure 2a,b. The magnetic field distribution images shown in Figure 2a,b detected three ferrite magnets as one object, as they could not differentiate them. However, in the reconstructed image in Figure 2c, the spatial resolution is improved, and the three ferrite magnets can be easily distinguished.
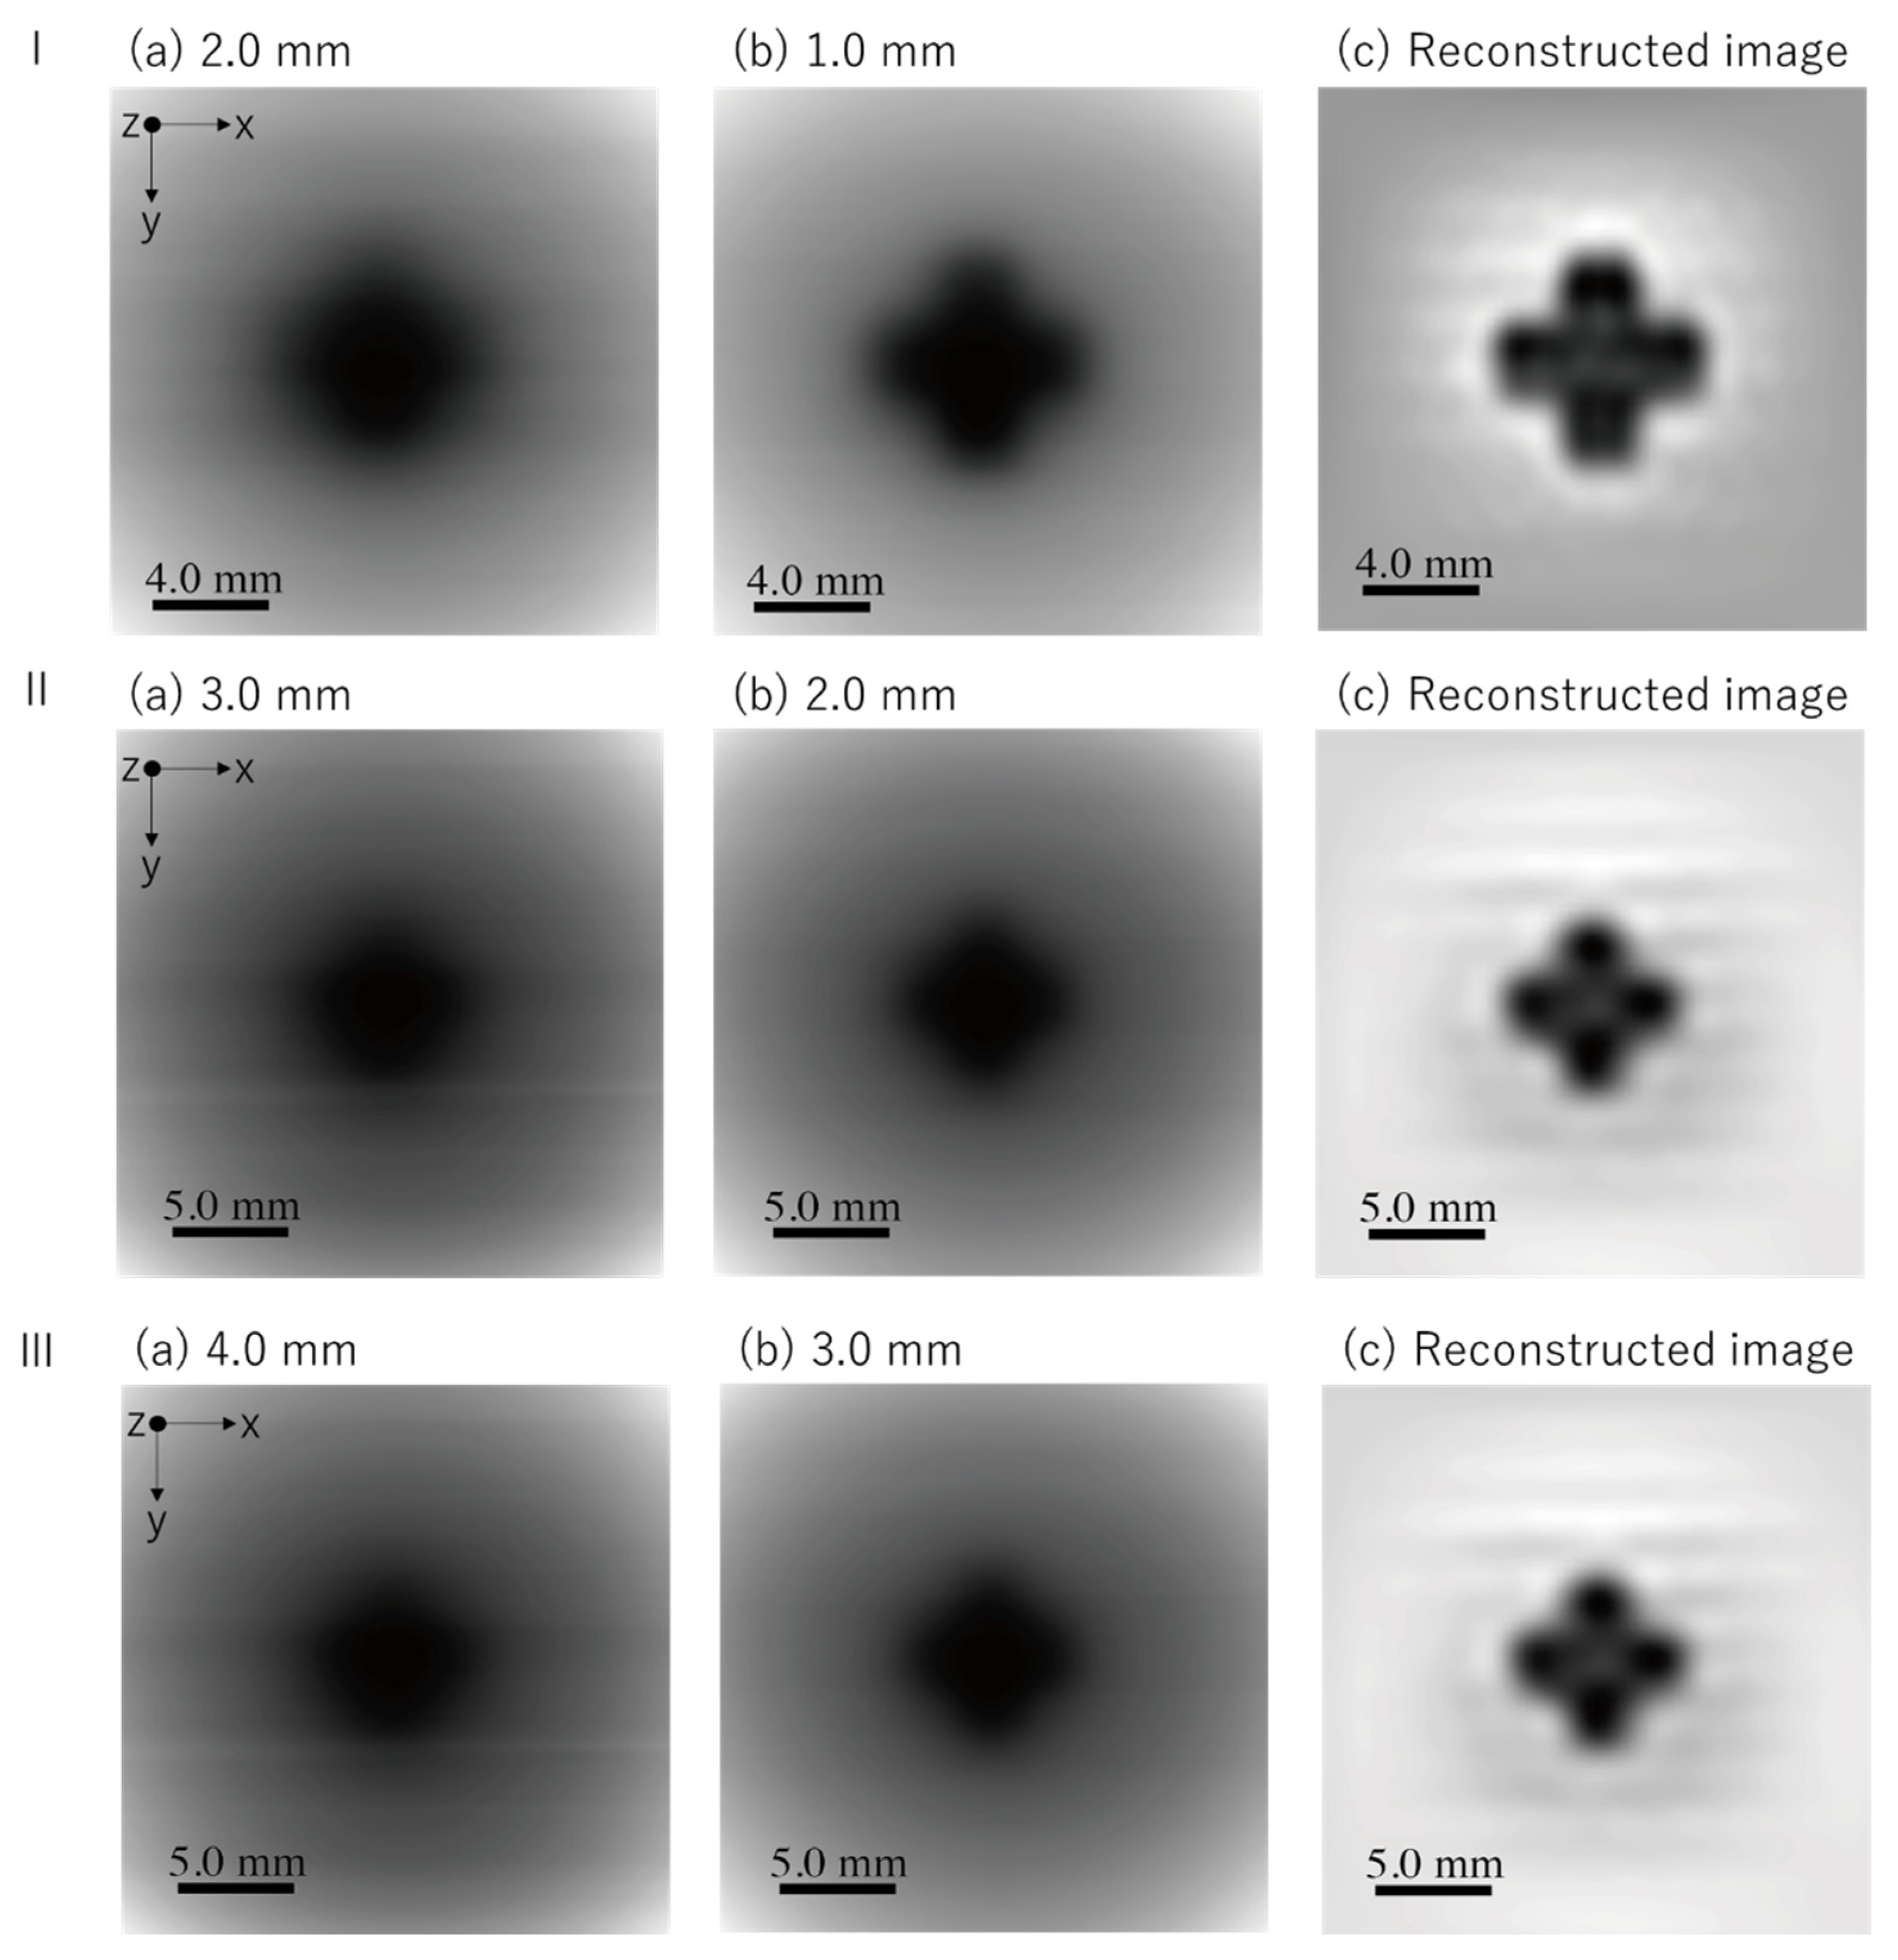
Figure 3 shows the experimental results of experiments I to III, where magnetic particles were measured. The measured magnetic field distributions are demonstrated in Figure 3a,b, respectively, while Figure 3c shows the reconstructed image. In the present experiment, when the distance from the sample surface to the magnetic sensor was 2.0 mm or more, the sample shape could not be visible in the obtained images without reconstruction. In addition, in the experiments where the distance from the magnetic particle sample surface to the magnetic sensor was 4.0 mm or more, a cross-shaped sample could not be distinguished on the image without reconstruction; hence, a magnetic particle distribution could not be detected. In contrast, in the reconstructed images, even in Figure 3II,III, where the shape of the sample cannot be distinguished in the experimental images, the spatial resolution of the reconstructed image is improved to the rate that the sample shape can be distinguished.

3. Discussion

Figure 4 shows magnetic field profiles along the yellow dashed line in the image reconstruction verification experiment using ferrite magnets as the target. In the profiles, the differences between the magnetic field intensities inside and outside of the ferrite magnet’s location (Width 1) and the difference between the intensities on ferrite magnets and between them are shown (Width 2). Relative ratios of Width 2 compared to Width 1 in Figure 4a,b are 0.5% and 4.3%, but in Figure 4c, it is increased up to 51%. Therefore, the spatial resolution was improved using the image reconstruction to a rate providing easy identification of the magnetic source shape.
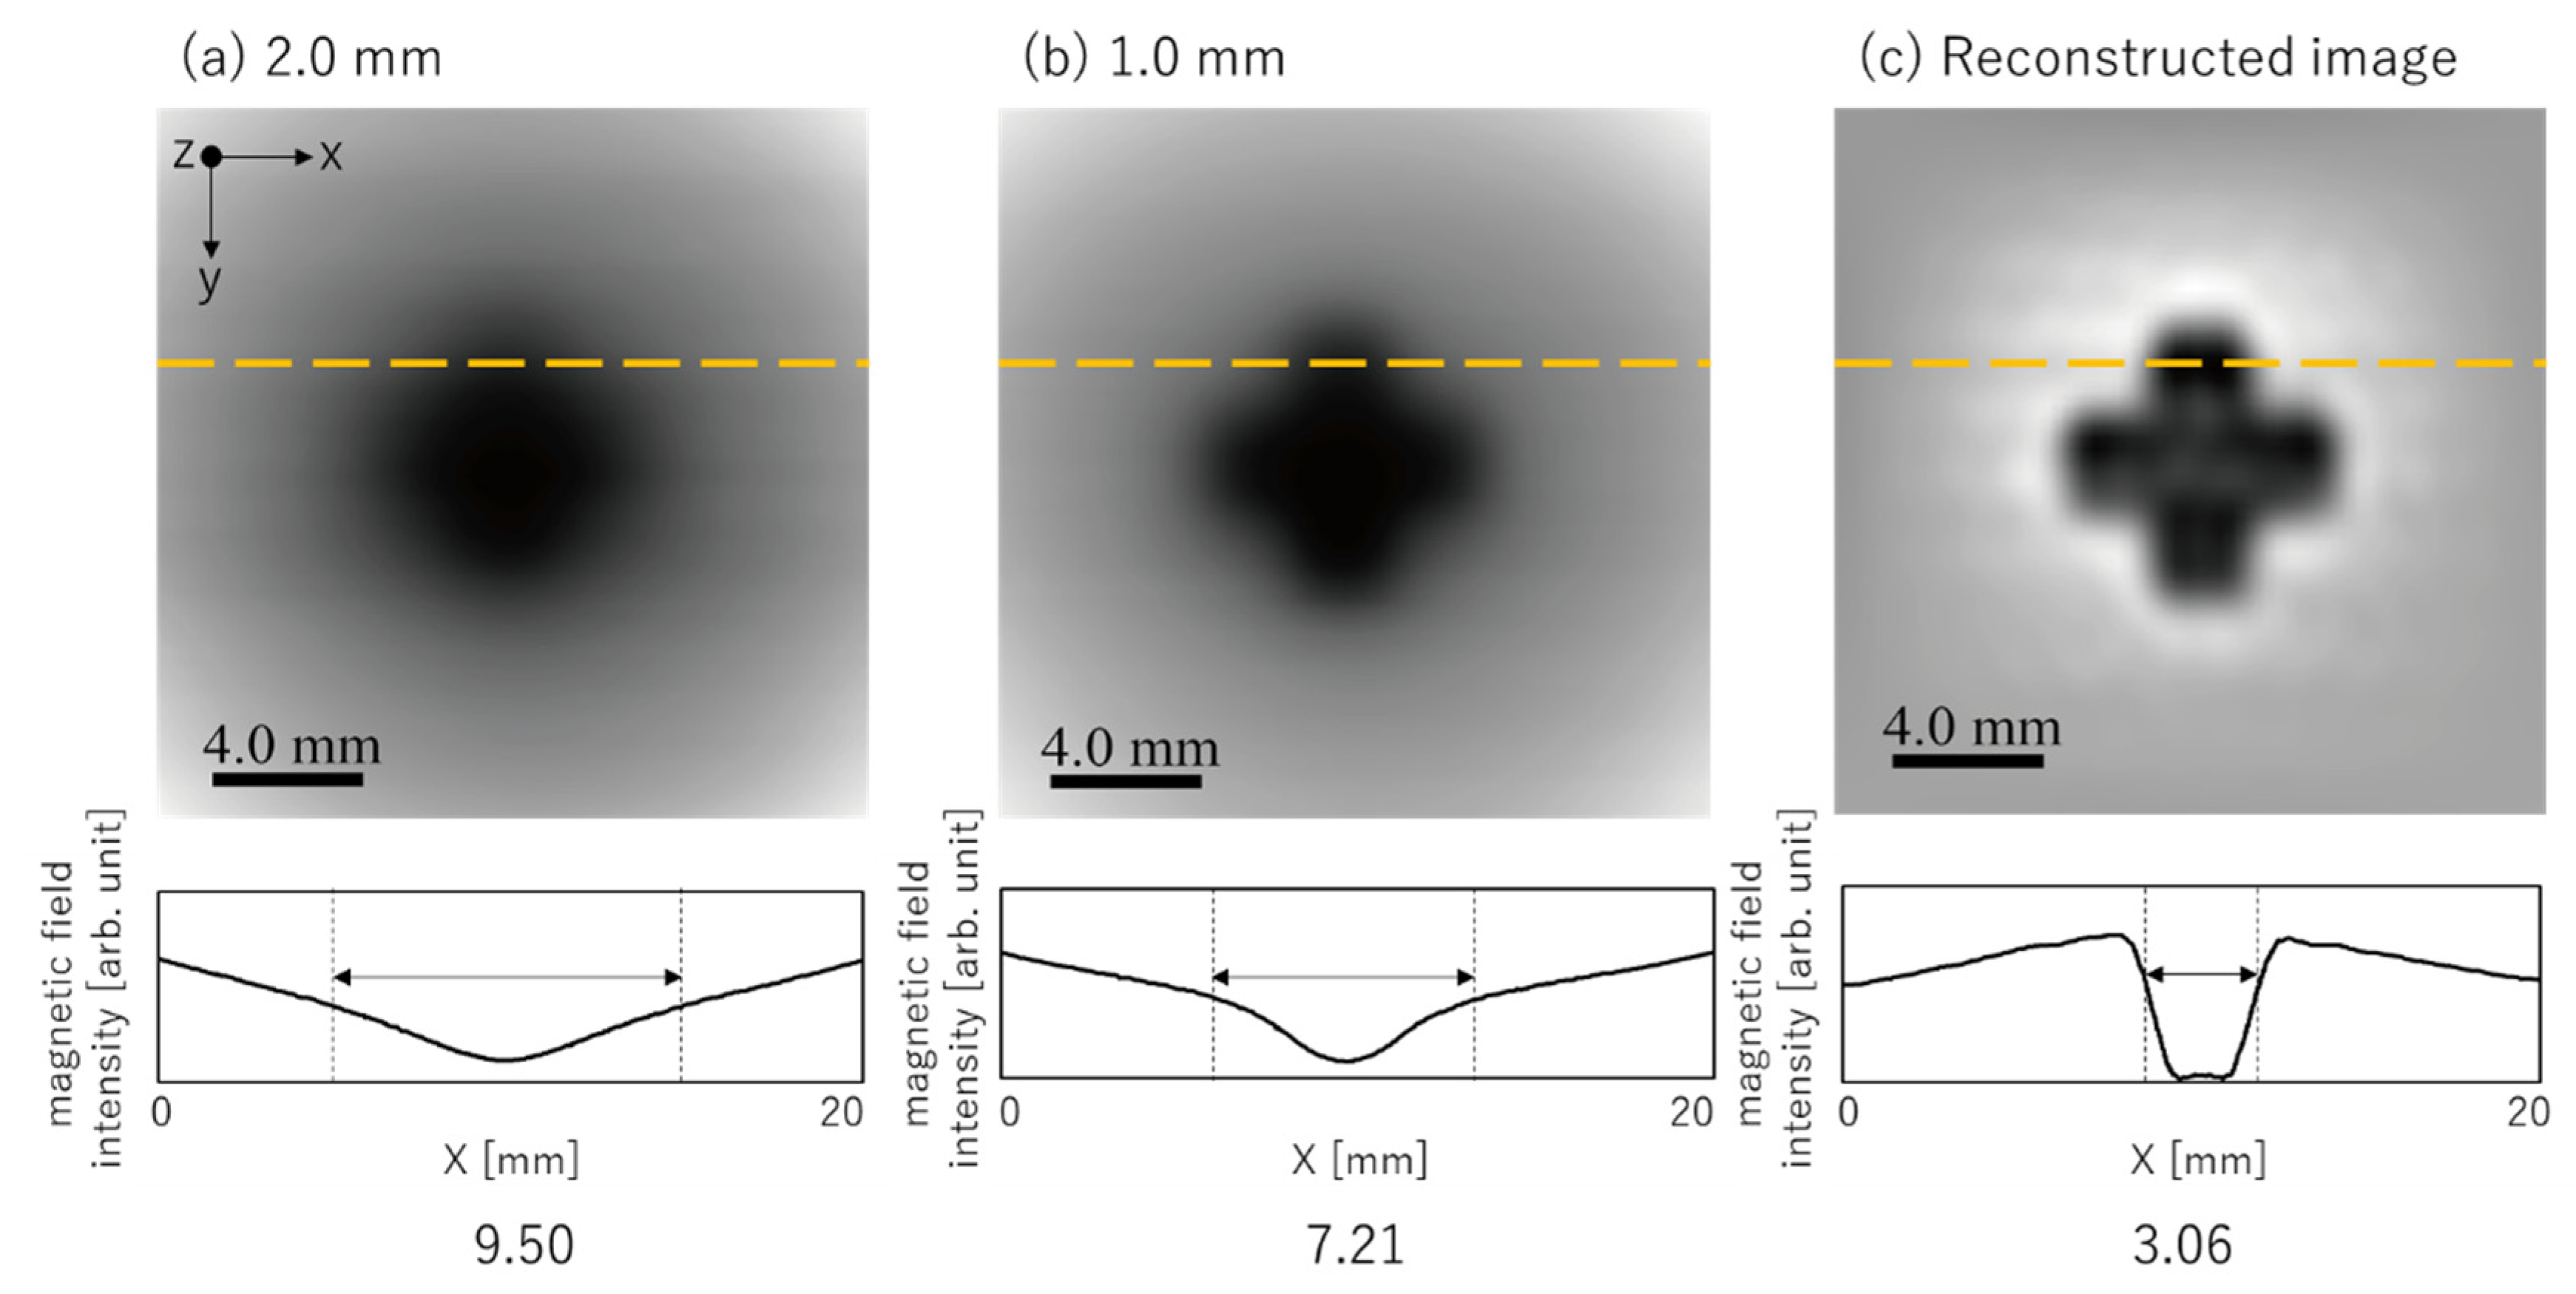
Figure 5 shows the image and line profiles of the sample with embedded magnetic particles. The half-width on the line profile is 9.5, 7.2, and 3.0 mm in Figure 5a–c, respectively. As the sample width along the line was 2.5 mm, the spatial resolution was improved using the electromagnetic field reconstruction. Figure 6c demonstrates a superposition of reconstructed and real images of the measured target. The shape of the magnetic particle distribution delineated in the reconstruction was equivalent to the actual sample shape. Therefore, the two-dimensional magnetic particle distribution measurement system utilizing image reconstruction and a high-sensitivity magnetic sensor enhances the image spatial resolution and provides clear imaging of magnetic particle distribution.

4. Materials and Methods

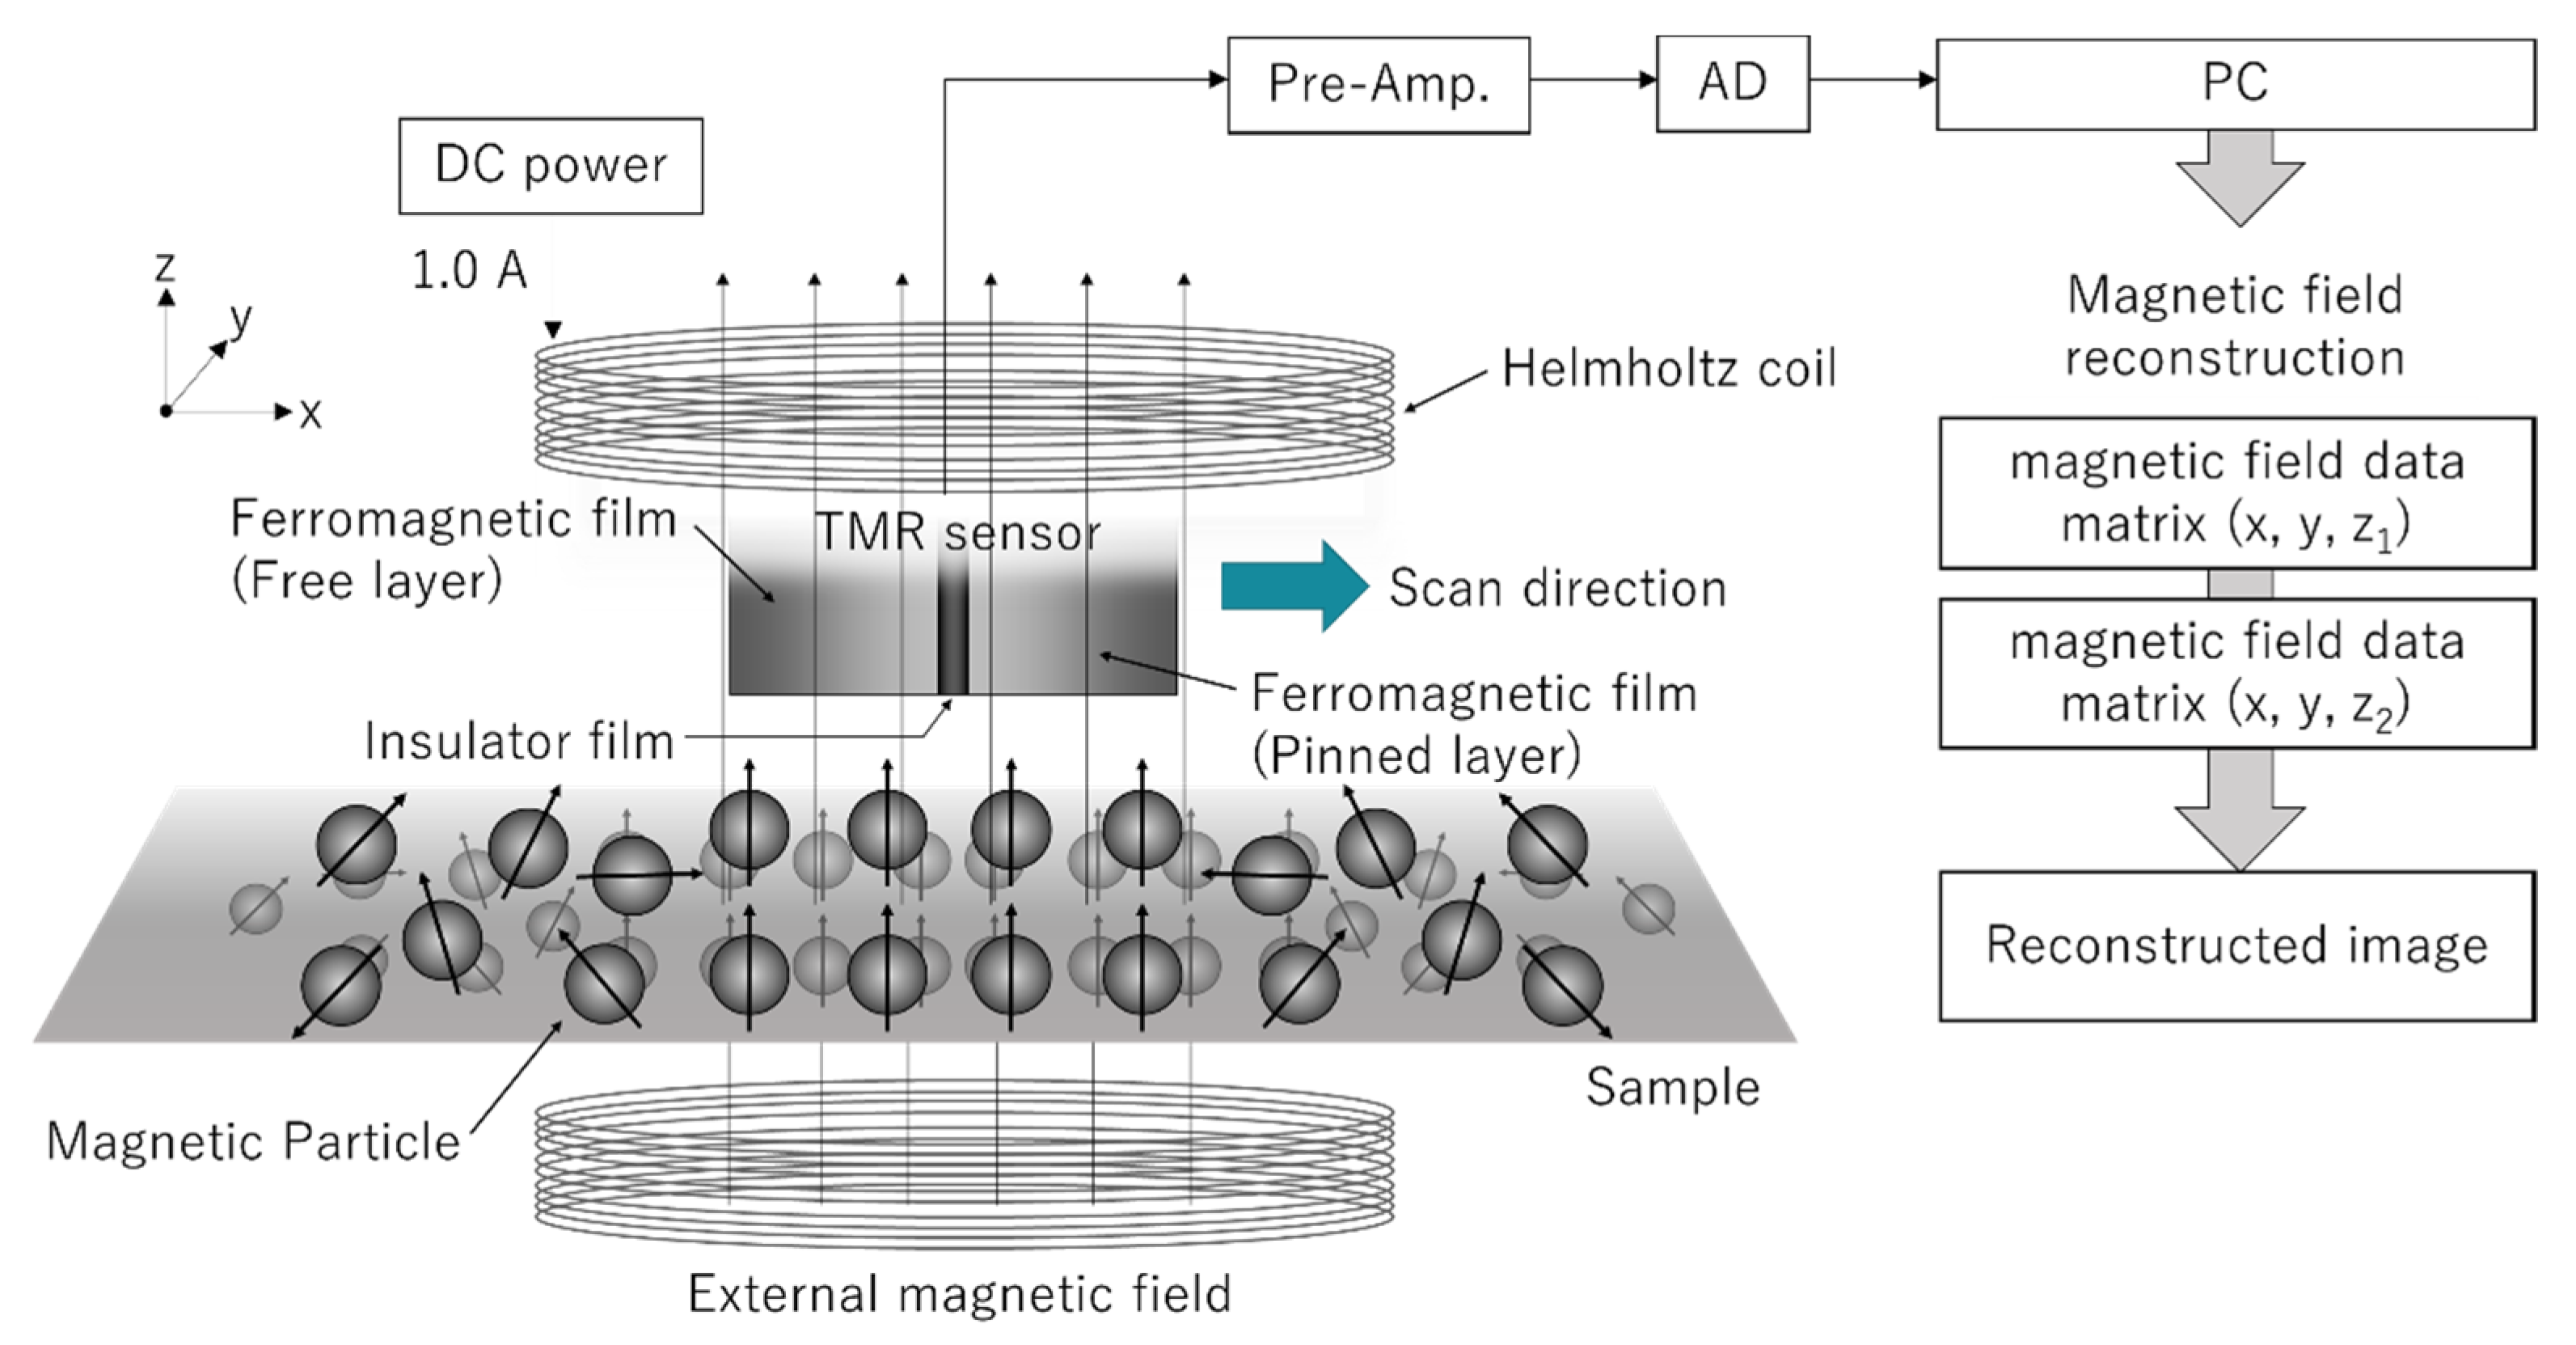
The scheme of a two-dimensional magnetic particle distribution measurement system using image reconstruction and a high-sensitivity magnetic sensor is shown in Figure 7. The developed system consists of hardware that collects the measurement data and image reconstruction software for their analysis. The hardware consists of a high-sensitivity magnetic sensor mounted on an XYZ triaxial positioning stage with stepping motors, a coil generating an external magnetic field, a power source for the coil, a signal amplifier, an AD converter, and a computer to process the signals. As the magnetic sensor, we used the STJ-220 tunneling magnetoresistance device from MicroMagnetics (TMR has a magnetic detection ability of 2 nT/√Hz at 100 Hz (5 nT/√Hz at 1 Hz)). The external field was generated by a Helmholtz coil with a diameter of 8 cm consisting of 2 × 38 turns of a 0.35 mm enamel wire. The 1.0 A direct current was applied to the Helmholtz coil to create an external electric field. The measured sample was placed at the center of the coil. When the measured surface is distant from the magnetic source, the measured magnetic field distribution has a poor spatial resolution. However, this problem was solved using image reconstruction. The magnetic field distribution within the sample was reconstructed from the measurement results by an analytical solution of the governing equation of the static magnetic field (Equation (1)). A variety of magnetic field reconstruction methods have been developed [13,14,15]. Roth’s method [13] takes the magnetic sources at only one side of the two half-spaces divided by the measurement plane. Our method takes the magnetic sources at both sides of the two half-spaces divided by the measurement plane. This provided us with images of magnetic particle distribution within the samples with a high spatial resolution.
The image reconstruction procedure used in the present study is introduced below [16]. As the space between the magnetic sensor and magnetic particles does not contain other magnetic sources, the governing equation of the magnetic field in the free space is expressed by Equation (1):
H i ( x , y , z ) = 0     ( i = x , y , z )
Among magnetic field vectors in a Cartesian coordinate system (x, y, z), in the present study, we measure the magnetic field distribution in the xy plane along the z-direction (see Figure 7). The solution for the H z component in Equation (1) is as follows;
H z ( x , y , z ) = 1 ( 2 π ) 2 e i k x x + i k y y { a ( k x , k y ) e z k x 2 + k y 2 + b ( k x , k y ) e z k x 2 + k y 2 } d k x d k y
where k x   and   k y are wavenumbers in the x- and y-directions, respectively. By determining a ( k x ,   k y ) and b ( k x ,   k y ) from Equation (2), H z ( x ,   y ,   z ) can be reconstructed. a ( k x ,   k y ) and b ( k x ,   k y ) are calculated from the two-dimensional magnetic field distribution at z = 0 , H z ( x ,   y ,   0 ) , and two-dimensional magnetic field gradient distribution, H z ( x , y , z ) / z | z = 0 are set as the boundary conditions. Equation (3) is derived by substitution of a ( k x ,   k y ) and b ( k x ,   k y ) into Equation (2) with f ( k x ,   k y ) and g ( k x ,   k y ) , as well as the Fourier transform of H z ( x ,   y ,   0 ) and H z ( x , y , z ) / z | z = 0 .
H z ( x , y , z ) = 1 ( 2 π ) 2   e i k x x + i k y y { 1 2 ( f ( k x , k y ) + g ( k x , k y ) k x 2 + k y 2 ) e z k x 2 + k y 2 + 1 2 ( f ( k x , k y ) g ( k x , k y ) k x 2 + k y 2 ) e z k x 2 + k y 2 } d k x d k y
Therefore, magnetic field distribution in the free space can be reconstructed using the measured distributions of the two-dimensional magnetic field and its gradient. In the present system, these distributions were determined by measuring two two-dimensional magnetic field distributions at different z positions.
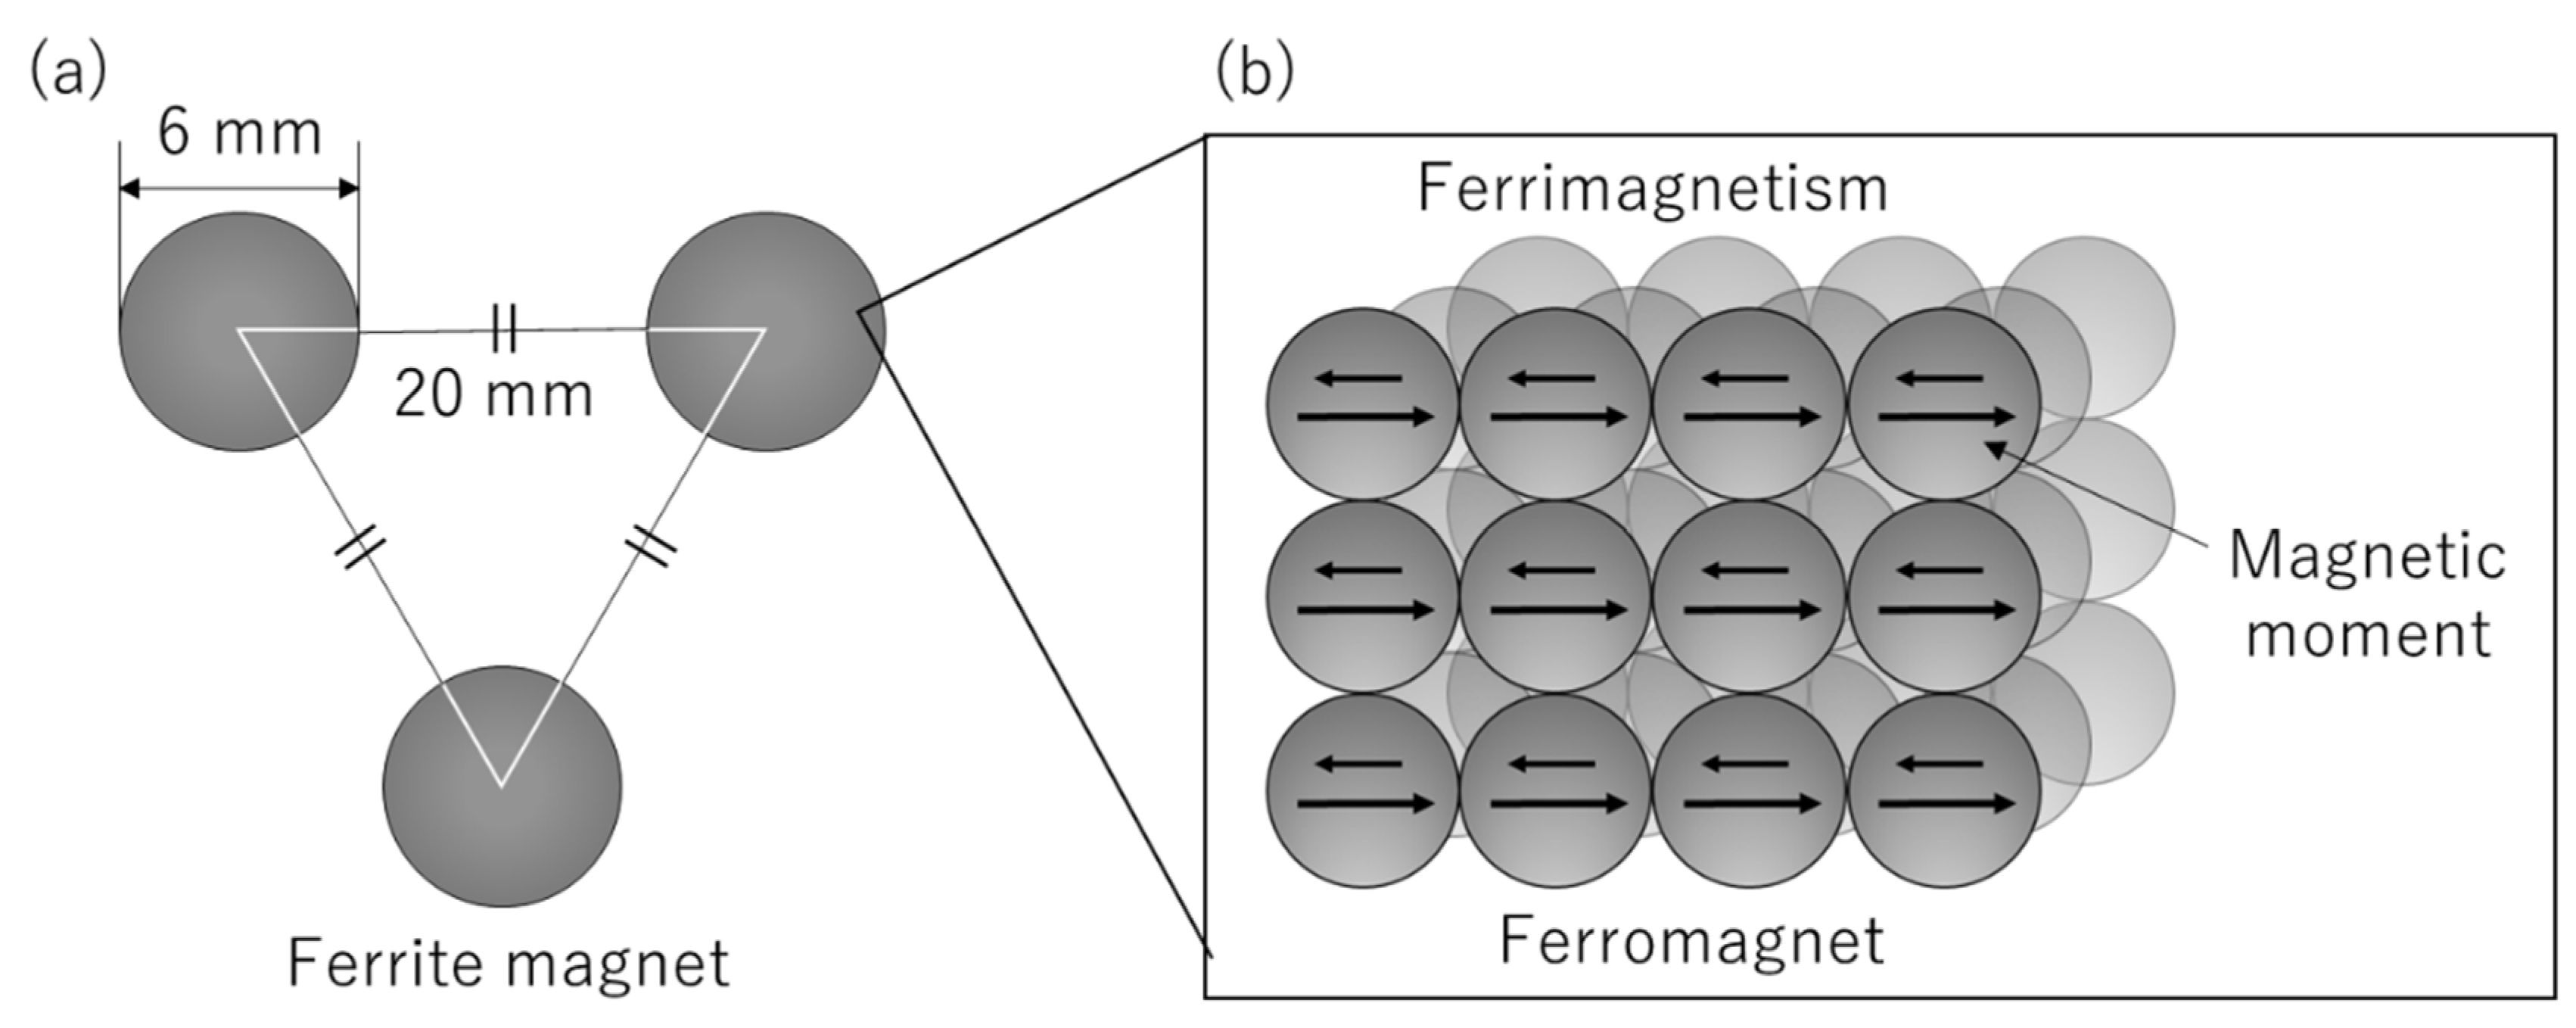
In this paper, we firstly performed the image reconstruction with a ferrite magnet used as the measurement target. This experiment was conducted for the purpose of verifying the performance of the developed system. The ferrite magnet exhibits residual magnetization, so the experiment was conducted with the Helmholtz coil removed from the measurement system shown in Figure 7. First, in order to confirm the performance of the developed system, we measured a general magnet without applying a magnetic field. For the measurements, we used a sample comprising circular ferrite magnets with a diameter of 6 mm placed at the top of an equilateral triangle with a side length of 2 cm (Figure 8). Measurements were taken at distances of 1.5 and 1.7 mm from the TMR sensor to the sample surface. The images had a 128 × 128 pixel resolution, while the scanning area was 150 × 150 mm2.
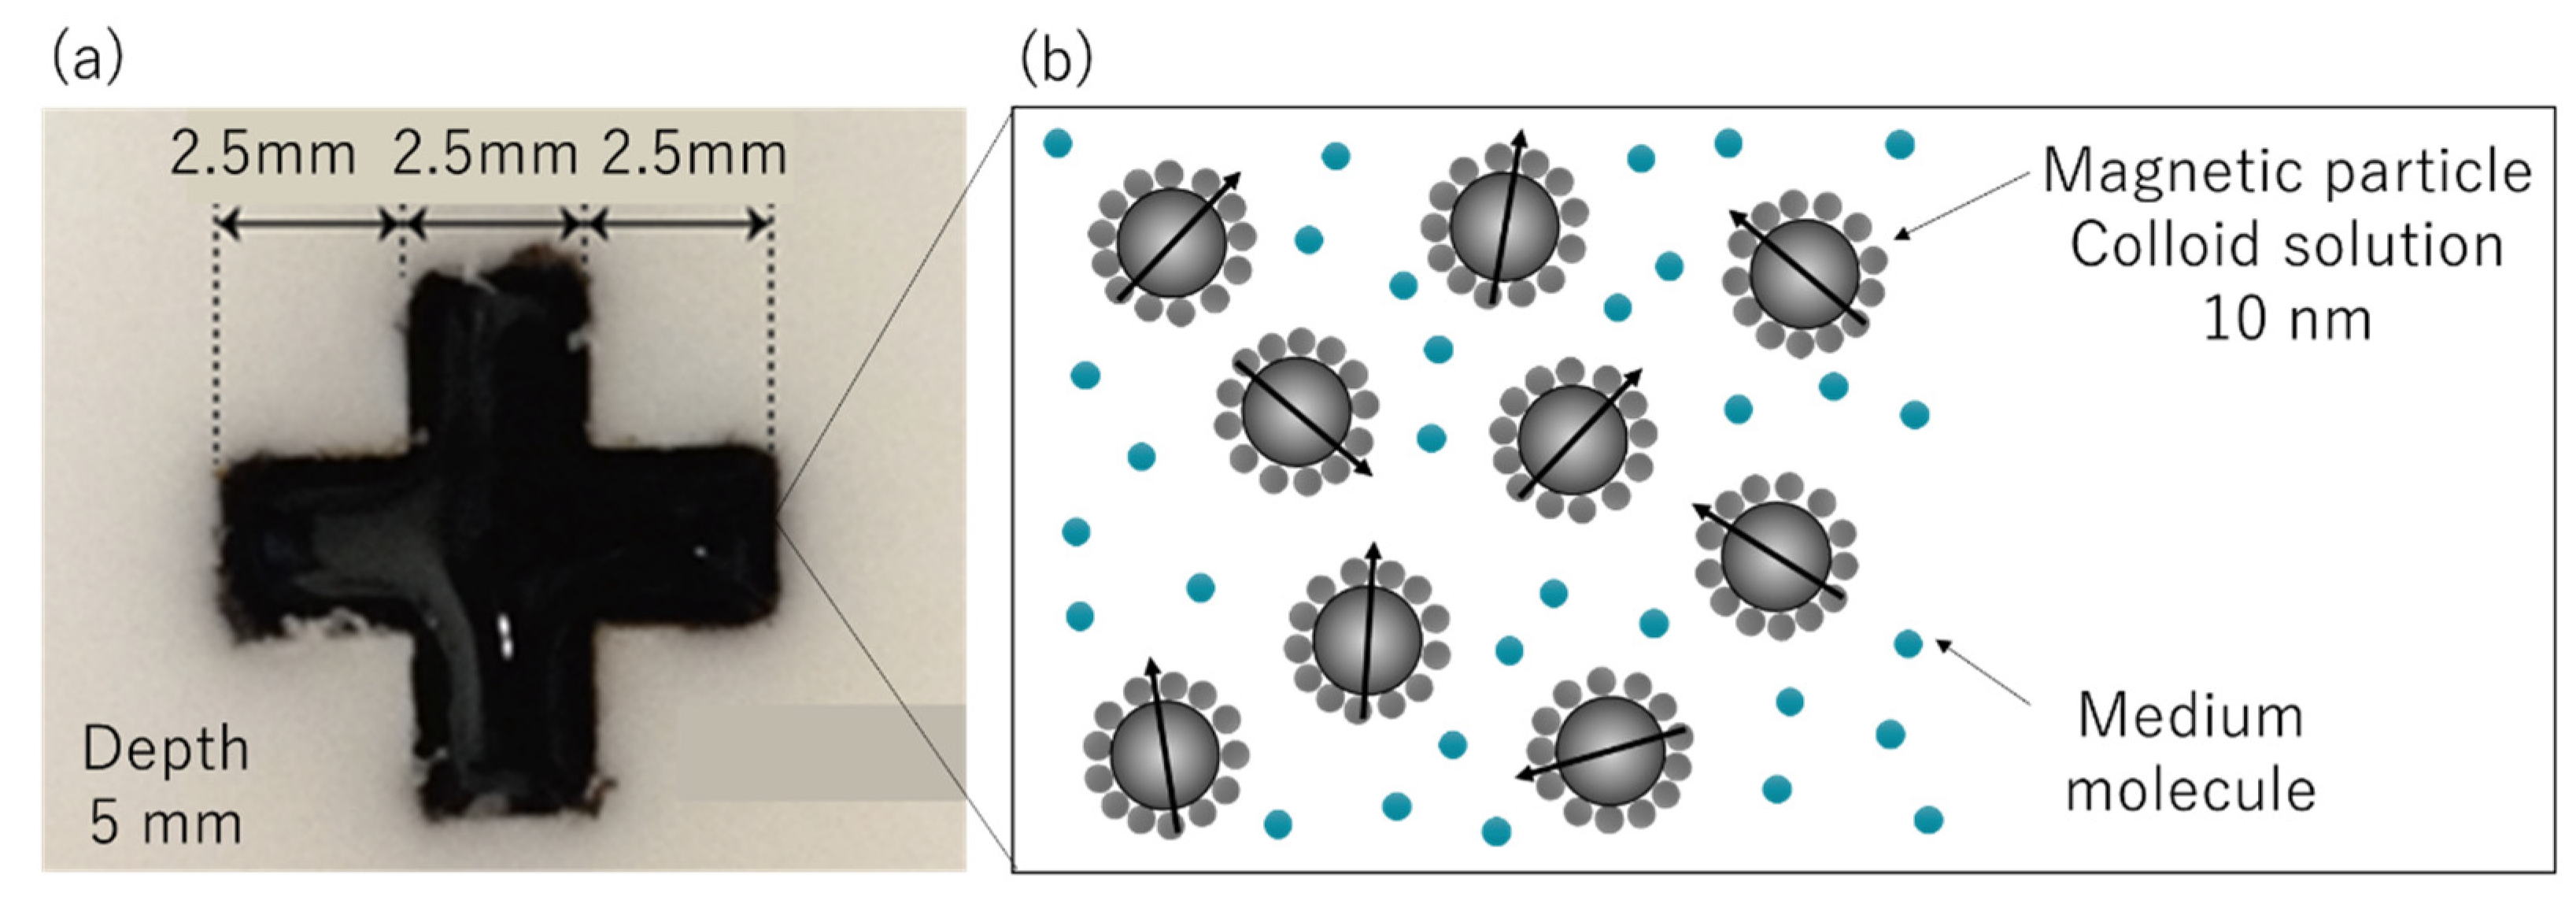
We then registered the response from magnetic particles magnetized by the coil and examined the two-dimensional magnetic particle distribution measurement system utilizing image reconstruction of high-sensitivity magnetic sensor data. Figure 9 shows the structure of the studied sample. Magnetic particles with a diameter of 10 nm were dispersed within the organic solvent. The saturation magnetization was 44 mT, and the initial magnetic susceptibility was 2.64. Measurements were taken at the following six conditions. Density at 25 °C was 1.21 × 10³ kg/m3, and magnetic particle concentration was 7.9 vol %.
I (a) Distance between sensor and sample: 2.0 mm, scanning area: 20 mm × 20 mm. I (b) Distance between sensor and sample: 1.0 mm, scanning area: 20 mm × 20 mm. II (a) Distance between sensor and sample: 3.0 mm, scanning area: 20 mm × 20 mm. II (b) Distance between sensor and sample: 2.0 mm, scanning area: 20 mm × 20 mm. Ш (a) Distance between sensor and sample: 4.0 mm, scanning area: 25 mm × 25 mm. Ш (b) Distance between sensor and sample: 3.0 mm, scanning area: 25 mm × 25 mm.
Under these six conditions, the image resolution was 64 × 64 pixels.

5. Conclusions

The two-dimensional magnetic particle distribution measurement system utilizing image reconstruction and a high-sensitivity magnetic sensor provides a two-dimensional visualization of magnetic particle distribution with a high spatial resolution, even when the magnetic source is distant from the measurement surface. Therefore, the SLN can be detected with magnetic particles injected into the body using a magnetic sensor located near the skin surface. In this paper, the maximum distance between the magnetic sensor and the magnetic source was 4 mm. When the distance between the magnetic sensor and the magnetic source is far, low-spatial-frequency components in the Fourier-transformed data of the magnetic field distribution expand to the far side, but the high-spatial-frequency components become weak. Therefore, to achieve high spatial resolution at a distance, it is important to detect the weak high-spatial-frequency components [17].
Following the obtained results, the studies are in progress toward the application of a method for the biopsy of the SLN.

Author Contributions

A.I., T.S., Y.M., and K.K. were involved in the planning of the experiments, the implementation of the experiments, and the data analysis. A.I., T.S., Y.M., and K.K. were involved in the data interpretation. All authors have read and agreed to the published version of the manuscript.

Funding

Japan Agency for Medical Research and Development.

Institutional Review Board Statement

Not applicable.

Informed Consent Statement

Not applicable.

Data Availability Statement

Not applicable.

Acknowledgments

We thank Crimson Interactive Pvt. Ltd. (Ulatus, Maharashtra, India)—www.ulatus.jp for their assistance in manuscript translation and editing.

Conflicts of Interest

To the best of our knowledge, the named authors have no conflict of interest, financial or otherwise.

References

  1. D’Angelo-Donovan, D.D.; Dickson-Witmer, D.; Petrelli, N.J. Sentinel lymph node biopsy in breast cancer: A history and current clinical recommendations. J. Surg. Oncol. 2012, 21, 196–200. [Google Scholar] [CrossRef] [PubMed]
  2. Ahmed, M.; Purushotham, A.D.; Douek, M. Novel techniques for sentinel lymph node biopsy in breast cancer: A systematic review. Lancet Oncol. 2014, 15, e351–e362. [Google Scholar] [CrossRef]
  3. Giuliano, A.E.; Kirgan, D.M.; Guenther, J.M.; Morton, D.L. Lymphatic mapping and sentinel lymphadenectomy for breast cancer. Ann. Surg. 1994, 220, 391–401. [Google Scholar] [CrossRef] [PubMed]
  4. Lymphoid tissues. In Gray’s Anatomy: The Anatomical Basis of Clinical Practice, 41st ed.; Standring, S. (Ed.) Elsevier: Philadelphia, PA, USA, 2016; Volume 4, pp. 73–74. [Google Scholar]
  5. Morton, D.L.; Wen, D.; Wong, J.H.; Economou, J.S.; Cagle, L.A.; Storm, F.K.; Foshag, L.J.; Cochran, A.J. Technical details of intraoperative lymphatic mapping for early stage melanoma. Arch. Surg. 1992, 127, 392–399. [Google Scholar] [CrossRef] [PubMed]
  6. Krag, D.N.; Weaver, D.L.; Alex, J.C.; Fairbank, J.T. Surgical resection and radiolocalization of the sentinel lymph node in breast cancer using a gamma probe. Surg. Oncol. 1993, 2, 335–340. [Google Scholar] [CrossRef]
  7. Linehan, D.C.; Hill, A.D.K.; Akhurst, T.; Yeung, H.; Yeh, S.D.; Tran, K.N.; Borgen, P.I.; Cody, H.S., III. Intradermal radiocolloid and intraparenchymal blue dye injection optimize sentinel node identification in breast cancer patients. Ann. Surg. Oncol. 1999, 6, 450–454. [Google Scholar] [CrossRef] [PubMed]
  8. Shiozawa, M.; Lefor, A.T.; Hozumi, Y.; Kurihara, K.; Sata, N.; Yasuda, Y.; Kusakabe, M. Sentinel lymph node biopsy in patients with breast cancer using superparamagnetic iron oxide and a magnetometer. Breast Cancer 2013, 20, 223–229. [Google Scholar] [CrossRef] [PubMed]
  9. Sekino, M.; Kuwahata, A.; Ookubo, T.; Shiozawa, M.; Ohashi, K.; Kaneko, M.; Saito, I.; Inoue, Y.; Ohsaki, H.; Takei, H.; et al. Handheld magnetic probe with permanent magnet and Hall sensor for identifying sentinel lymph nodes in breast cancer patients. Sci. Rep. 2018, 8, 1195. [Google Scholar] [CrossRef] [PubMed] [Green Version]
  10. Lu, A.-H.; Salabas, E.; Schüth, F. Magnetic nanoparticles: Synthesis, protection, functionalization, and application. Angew. Chem. Int. Ed. 2007, 46, 1222–1244. [Google Scholar] [CrossRef] [PubMed]
  11. Salata, O. Applications of nanoparticles in biology and medicine. J. Nanobiotechnology 2004, 2, 3. [Google Scholar] [CrossRef] [PubMed] [Green Version]
  12. Mornet, S.; Vasseur, S.; Grasset, F.; Veverka, P.; Goglio, G.; Demourgues, A.; Portier, J.; Pollert, E.; Duguet, E. Magnetic nanoparticle design for medical applications. Prog. Solid State Chem. 2006, 32, 237–247. [Google Scholar] [CrossRef]
  13. Roth, B.J.; Sepulveda, N.G.; Wikswo, J.P. Using a magnetometer to image a two-dimensional current distribution. J. Appl. Phys. 1989, 65, 361–372. [Google Scholar] [CrossRef]
  14. Shi, R.; Jung, J.-H.; Schweser, F. Twodimensional local Fourier image reconstruction via domain decomposition Fourier continuation method. PLoS ONE 2019, 14, e0197963. [Google Scholar] [CrossRef] [PubMed]
  15. Liyakathunisa; Ravi Kumar, C.N. A novel super resolution reconstruction of low reoslution images progressively using dct and zonal filter based denoising. Int. J. Comput. Sci. Inf. Technol. 2011, 3, 1. [Google Scholar] [CrossRef]
  16. Mima, Y.; Kimura, K.; Inao, T.; Oyabu, N.; Kimura, N. Failure analysis of electric circuit board by high resolution magnetic field microscopy. In Proceedings of the 2013 3rd IEEE CPMT Symposium Japan, Kyoto, Japan, 11–13 November 2013; pp. 1–4. [Google Scholar]
  17. Kimura, K.; Mima, Y.; Inao, T.; Oyabu, N.; Inao, T.; Kimura, N. Development of High-resolution Magnetic Imaging Method with Tunneling Magnetoresistance Device to Inspect Reinforcing Steels Inside a Concrete Building. J. Jpn. Soc. Non-Destr. Insp. 2013, 62, 527–528. (In Japanese) [Google Scholar]
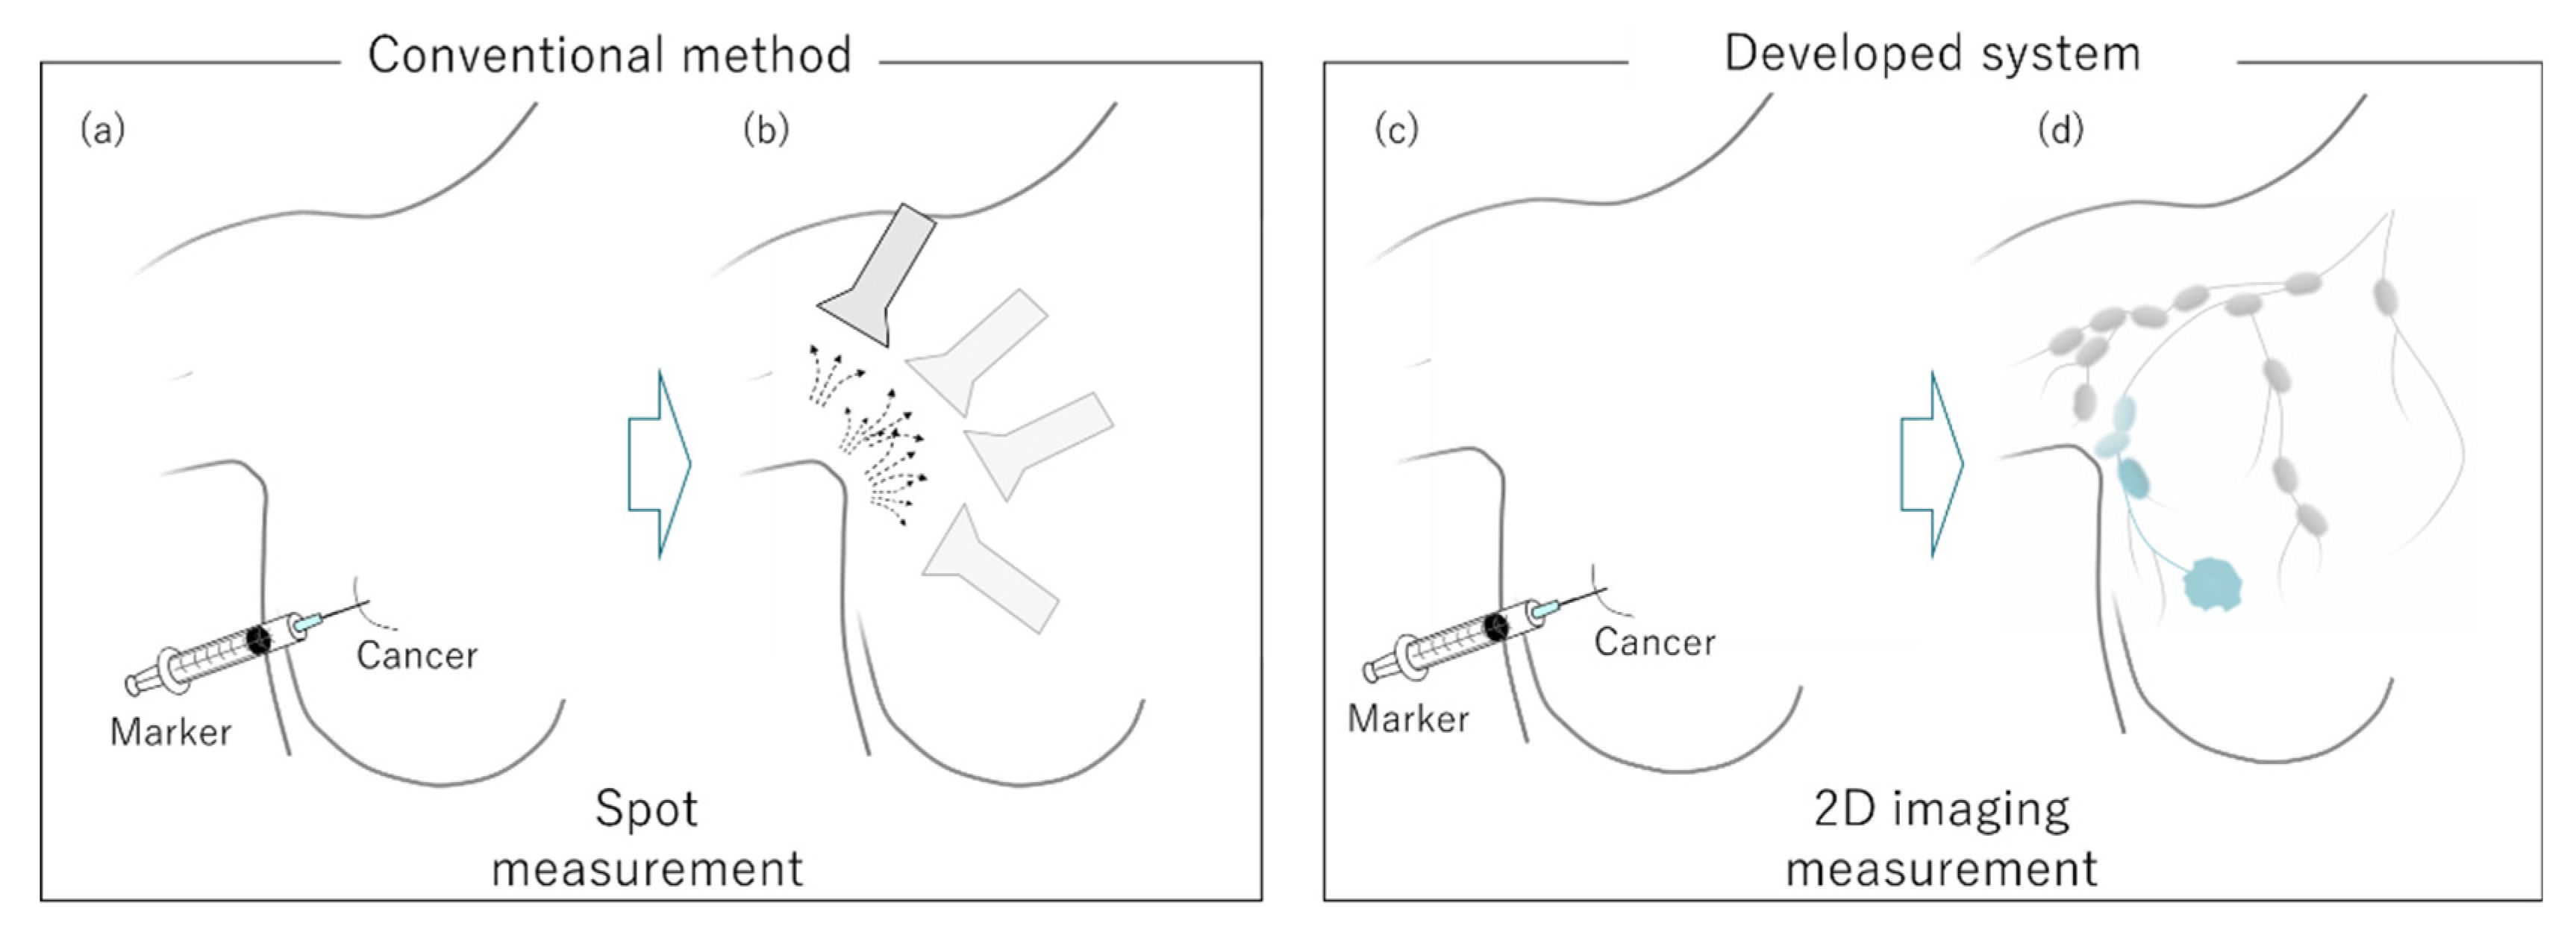
Figure 1. Methods of the sentinel lymph node identification. The position of a tracer injected into a breast cancer (a) in the conventional method is manually detected with a detector by the location of the sentinel lymph node (b). According to the proposed method, magnetic particles are injected as a tracer to the breast cancer (c), and then the spatial distribution of the magnetic particles is determined by a two-dimensional scan with a magnetic sensor (d).
Magnetochemistry 07 00085 g001
Figure 2. Verification experiments of image reconstruction: magnetic field distribution measured at 1.7 mm (a) and 1.5 mm (b) above the ferrite magnet sample surface; reconstruction (c) based on images (a,b).
Magnetochemistry 07 00085 g002
Figure 3. Two-dimensional magnetic particle distributions (I, II, and III): (a,b) measurement image; (c) reconstruction image based on (a,b).
Magnetochemistry 07 00085 g003
Figure 4. Two-dimensional magnetic particle distributions: I images and magnetic field intensity profiles measured at 1.7 mm (a) and 1.5 mm (b) distances from the magnetic source, and reconstruction I (c) based on Images I (a) and I (b).
Magnetochemistry 07 00085 g004
Figure 5. Two-dimensional magnetic particle distributions: I images and magnetic field intensity profiles measured at 2.0 mm (a) and 1.0 mm (b) from the magnetic source, and reconstruction I (c) based on Images I (a) and I (b).
Magnetochemistry 07 00085 g005
Figure 6. Comparison of the sample photo and its image reconstruction; (c) overlapped (a,b) images.
Magnetochemistry 07 00085 g006
Figure 7. Two-dimensional magnetic particle distribution measurement system utilizing image reconstruction and a high-sensitivity magnetic sensor. A magnetic field from the Helmholtz coil is applied to magnetic particles, while a magnetic sensor scans magnetic field distribution along the surface using the stepping motor. The Helmholtz coil is not used in the case of a magnet not requiring magnetization. Image reconstruction was performed on the basis of obtained magnetic field measurement data.
Magnetochemistry 07 00085 g007
Figure 8. A ferrite magnet sample used in the measurements: schematic of the sample (a) and its structure (b).
Magnetochemistry 07 00085 g008
Figure 9. A magnetic-particle-containing sample used in the measurements: (a) optical image of the sample; (b) schematic of the sample structure.
Magnetochemistry 07 00085 g009
Publisher’s Note: MDPI stays neutral with regard to jurisdictional claims in published maps and institutional affiliations.