Article

Disclosing the Ligand- and Solvent-Induced Changes on the Spin Transition and Optical Properties of Fe(II)-Indazolylpyridine Complexes

1
Laboratoire de Chimie Quantique, Université de Strasbourg, 4 rue Blaise Pascal, F-67000 Strasbourg, France
2
Departament de Química Física and Institut de Química Teòrica i Computacional (IQTCUB), Universitat de Barcelona, Av. Diagonal 645, 08028 Barcelona, Spain
*
Author to whom correspondence should be addressed.
Magnetochemistry 2016, 2(1), 6; https://doi.org/10.3390/magnetochemistry2010006
Submission received: 8 January 2016 / Revised: 22 January 2016 / Accepted: 29 January 2016 / Published: 5 February 2016
(This article belongs to the Special Issue Spin Crossover (SCO) Research)

Abstract

:
The family of the spin crossover (SCO) compounds based on the 1-bpp unit has furnished striking examples of how subtle changes in the crystal packing have important consequences in their spin transition. Small modifications of the 1-bpp unit itself have been recently reported, obtaining the indazolyl and pirazolyl derivatives [FeII(1-bip)]2+ (1, 1-bip = 2,6-bis(indazol-1-yl)pyridine), [FeII(1,2-bip)]2+ (2, 1,2-bip = 2-(indazol-1-yl)-6-(indazol-2-yl)pyridine), [FeII(2-bip)]2+ (3, 2-bip = 2,6-bis(indazol-2-yl)pyridine), [FeII(1-ipp)]2+ (4, 1-ipp = 2-(indazol-1-yl)-6-(pyrazol-1-yl)pyridine) and [FeII(2-ipp)]2+ (5, 2-ipp = 2-(indazol-2-yl)-6-(pyrazol-1-yl)pyridine). In this work we study the consequences of a change in the ligand structure and solvent on the SCO of 15. More specifically, we demonstrate that their different behavior is not due to an intraligand H···H contact, as suggested experimentally, but to an unfavorable arrangement of the FeN6 core that some of the ligands might create, which destabilizes their Low Spin (LS) state structure and, thus, alters the transition temperature. Further, by means of solid state calculations, we disclose the effect of the solvent on the structure and crystal cohesion of the crystals. Finally, we analyze the emission and adsorption properties of 15, with special interest in the evolution of the absorption spectroscopy of the ligands upon complexation, and its relation with the spin multiplicity of the iron ion.

Graphical Abstract

1. Introduction

Spin crossover-based (SCO) compounds are excellent materials to be applied as molecular switches in technology devices, due to the possible coexistence of their magnetically-silent and magnetically-active phases [1,2,3,4]. In the case of octahedral Fe(II)-based species, the largest family of SCO complexes [5], the electronic configuration of the diamagnetic phase has the six electrons distributed in the three nonbonding “3d” orbitals of the metal (t2g), which yields a S = 0 (Low spin, LS) state. This phase is stabilized by the larger enthalpy (H) that results from the effective coordination of the metal and the ligands. In turn, the paramagnetic phase exists due to the entropy-favorable un-pairing of those six d-electrons, yielding an S = 2 state (High Spin, HS). As a result, the antibonding eg orbitals become populated, which implies the weakening of the metal-ligand coordination (i.e., enthalpy loss), and a notable increase on the associated vibrational and electronic entropy (S). The fragile equilibrium of those two phases determines the magnetic profile of the compounds, and can be altered due to the application of external stimuli, most usually temperature. Beyond those thermodynamic considerations, kinetics also plays a role in the spin transition and, as a consequence, different shapes for the χ(T) curve (i.e., gradual, abrupt or hysteretic) can be found depending on the degree of “cooperativity” of the transition. The idea of cooperativity is naively associated to the effect that a transiting SCO unit has on its neighbors during the transition with larger cooperativity values leading to abrupt or even hysteretic transitions. Consequently, dense networks have been designed in order to enhance cooperativity by means of strong covalent [6,7] or van der Waals interactions [8,9,10] between SCO molecules. However, even if few remarkable computational studies have dealt with the effect of crystal packing and cooperativity on SCO materials [11,12], (including phenomenological models [13,14]) progress in the field has been hindered by the difficulty of establishing general structure-function correlations in the solid state, which should incorporate the effect of counterions and solvent molecules beyond the SCO molecules itself (not to mention the importance of polymorphism [15,16]).
So far, the application of quantum chemistry to aid in this quest has been limited by the lack of an accurate and computationally-efficient methodology to work in the solid state of those compounds and, apart from few exceptions [6,17,18,19,20], it has been essentially focused on the study of the individual molecules [21]. However, some advances have been made in the field and, especially, in the application of DFT + U to calculate the adiabatic energy difference between the LS and HS phases of SCO compounds in their unit cells, thus, accounting for all the crystal packing effects and weak interactions [22]. This is a promising strategy that paves the way for the close collaboration of experimentalists and theoreticians in the quest for SCO compounds presenting a wide hysteresis loop that encompasses room temperature. Herein, we continue our inspections on one of the most prominent families of SCO compounds, the one based on the [FeII(1-bpp)]2+ core (1-bpp = 2,6-di(pyrazol-1-yl)pyridine) [10], which has reported striking examples on how subtle modifications on the crystal packing may lead to notably-different SCO behaviors. For instance, the use of BF4 as the counterion results into a full SCO transition with a small hysteresis loop [23], whereas the use of ClO4 results in the SCO molecules being kinetically trapped in its HS state [19,24]. Alternatively, modifications of the 1-bpp unit have been recently reported, obtaining (among others [25,26]) the indazolyl and pirazolyl derivatives [FeII(1-bip)]2+ (1), [FeII(1,2-bip)]2+ (2), [FeII(2-bip)]2+ (3), [FeII(1-ipp)]2+ (4) and [FeII(2-ipp)]2+ (5) [27]. Even though the structure of the ligands is similar (see Scheme 1), their SCO properties are remarkably different, with transition temperatures of ca. 340 K for compounds 2 and 4 and ca. 240 K for 3 and 5. Certainly, the vast amount of reported 1-bpp derivatives [10,28] represents an excellent opportunity to scrutinize the relation between chemical constituents and magnetic response of molecular-based compounds.
Scheme 1. Structure of ligands 15.
Magnetochemistry 02 00006 g010
The results gathered in the present paper have been organized into three sections. The first one is devoted to investigate the role of the solvent molecules in the spin transition of compound 3, the only one for which experimental data of its transition has been reported. The second section, in turn, is devoted to the effect of ligands 2, 3, 4 and 5 on the HS-LS stability when attached to Fe(II) and, in particular, we analyze how their structural constrains may affect the spin transition of the parent SCO materials. Finally, in the third section we analyze the UV-visible spectroscopy of the different complexes and isolated ligands by means of TD-DFT calculations. Both absorption and emission properties are studied, with special interest in the evolution of the absorption spectroscopy upon complexation and its relation with the spin multiplicity of the iron ion.

2. Results and Discussion

2.1. Crystalline Phase Calculations

Experimentally, it has been observed that the spin transition of compound 3 is significantly different depending on whether the material is freshly prepared or dried after a cooling-heating cycle. In the first case, MeNO2 molecules are present in the crystalline phase (i.e., 3[BF4]2·2MeNO2), the transition is reproducible and occurs at around 320 K. After a cooling-heating cycle, the solvent molecules evaporate and the dried sample (i.e., 3[BF4]2) undergoes a transition centered at 266 K with a small hysteresis loop of ca. 20 K. In order to investigate the effect of the solvent on the SCO transition of 3[BF4]2, we have performed solid state calculations of the HS and LS phases with and without MeNO2 in the crystalline cell. It is reported in the experimental paper that the crystal of 3[BF4]2 is not isostructural to 3[BF4]2·2MeNO2, but that it retains the terpyridine embrace structure [27]. Given the absence of X-ray data for 3[BF4]2, we have simply assumed that the MeNO2 molecules evaporate without major changes in the crystal. Of course, this implies that those calculations do not exactly compare with the experimental measurements of the solvent-free phase but, indeed, they allow for a more direct comparison of the effect of the solvent in the energetics of 3[BF4]2. Therefore, the unit cells evaluated in this section contain four SCO molecules and eight BF4 counterions for 3[BF4]2 and also eight MeNO2 molecules for [BF4]2·2MeNO2. Those unit cells have undergone a variable-cell optimization procedure to achieve the different HS and LS minima. Any major changes are observed in the optimized structures with respect to the starting ones, and the relative energy differences ( Δ H elec ) are collected in Table 1. First, one must notice that Δ H elec is not comparable to the experimental Δ H value, since the latter includes the vibrational contribution to enthalpy ( Δ H vibr ) that is not evaluated here. That said, the computed Δ H elec is 28.5 kJ/mol for the dried sample 3[BF4]2 and 38.0 kJ/mol for the 3[BF4]2·2MeNO2. This increase in Δ H elec is in agreement with the fact that the solvent-containing sample undergoes the transition at higher temperatures and, thus, indicates that the presence of solvent has an effect of ca. 10 kJ/mol on Δ H elec (i.e., 38.0–28.5 kJ/mol, see Table 1).
Table 1. Adiabatic energy gaps   ( Δ H elec ) associated to the spin transition of compound 3 obtained in the crystalline phase with and without solvent. Contribution of the molecular geometries of the Spin Crossover (SCO) units to   Δ H elec , obtained from calculations on isolated molecules   ( Δ H elec iso ) . Contribution of the intermolecular interactions between SCO, counterion and solvent molecules to   Δ H elec ( Δ H elec int ). Negative (Positive) values for those contributions indicate that the High Spin (Low Spin) state is favored. Note that in the calculation of   Δ H elec iso , only SCO are included in the calculation, even if their minima are computed in unit cells that include solvent molecules and counterions. Energies are given in kJ/mol.
Unit cell Δ H e l e c Δ H e l e c i s o Δ H e l e c i n t
3[BF4]228.515.513.0
3[BF4]2·2MeNO238.020.517.5
At this point, one must notice that the stability of the different unit cells depends on (i) the geometry of the constituents and on (ii) the intermolecular interactions that arise between them. In order to evaluate both effects, we have first performed another set of calculations in which we have calculated the energy of the isolated SCO molecules in its solid state minima, but without any counterion or solvent molecules in the unit cell and, thus, being completely isolated (obtaining Δ H elec iso ). Notice that the Δ H elec iso values account for all the effects based on the spin transiting units (such as their internal geometry) and excludes the influence of any sort of intermolecular interactions between SCO, counterions (CI) and solvent molecules. Those calculations predict quite different adiabatic energy gaps between the crystal and the isolated molecules for both the 3[BF4]2 and 3[BF4]2·2MeNO2 minima (compare Δ H elec and Δ H elec iso , in Table 1), which indicates that the molecular geometries are only partially responsible for the ΔH values. The main structural parameters are given in Table 2 (for unit cell parameters see Table S1). In addition, by looking at the absolute energy of the isolated molecules in the 3[BF4]2 and 3[BF4]2·2MeNO2 minima, one can see that the HS molecules are destabilized (have less absolute energy than in 3[BF4]2) in the presence of solvent, whereas the opposite is seen for the LS molecules. This explains the 5 kJ/mol difference between 15.5 and 20.5 kJ/mol. In the next section we analyze the effect that the ligand distortions have on the SCO behavior of those compounds.
Table 2. Absolute energies (in Ry) and geometries of isolated molecules of compound 3 in the LS and HS minima obtained from the crystalline phase with (3[BF4]2·2MeNO2) and without (3[BF4]2) solvent. It is shown the mean Fe-N distances (in Å), and the two angles that define the distortion of the ligands [28]. Given that four non-identical SCO molecules are present in each unit cell, all shown values correspond to an average.
MinimaAbsolute Energyd(Fe–N)φ (°)θ (°)
3HS [BF4]2−914.290322.17176.2082.71
3HS [BF4]2·2MeNO2−914.288732.16168.4781.55
3LS [BF4]2−914.302151.94178.3789.17
3LS [BF4]2·2MeNO2−914.304401.93177.0888.35
Apart from the effect of the solvent in the geometries, the calculated Δ H elec values also depend on the amount of intermolecular interactions that are established in the LS and HS minima. The magnitude and sign of this effect corresponds to the difference between Δ H elec and   Δ H elec iso , and has been also collected in Table 1 as   Δ H elec int . Those values mean that the intermolecular interactions are 13.0 and 17.5 kJ/mol more attractive in the LS than in the HS state for the dried and solvated crystals, respectively. In other words, the solvent molecules give rise to larger amount of intermolecular interactions in the LS crystals, effectively over-stabilizing them. This is probably due to a more-densely packed crystal structure as a result of the compression of the FeN6 core of the SCO units. Notice that these intermolecular interactions can be originated between the different constituents of the unit cell, that is, between the SCO, the solvent and the CI molecules. We have attempted to obtain an approximate quantification of each of those interactions separately, but it has not been possible due to the difficulty to define appropriate cluster models. So, in summary, the presence of solvent molecules effectively contributes to the stabilization of the LS phase for two reasons: (1) a distortion of the molecular structures from their minima, which penalizes (stabilizes) the HS (LS) molecules (ca. 5 kJ/mol), and (2) the creation of larger intermolecular interactions in the LT phase (ca. 4.5 kJ/mol).

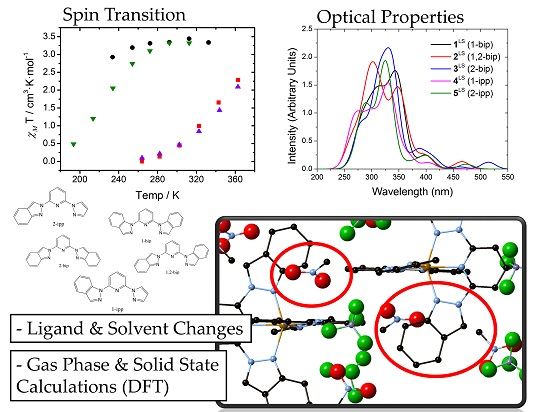
2.2. Gas Phase Calculations

In addition to compound 3, other ligands were investigated in solvent conditions when forming a complex with iron(II) [27]. Compounds 2, 3, 4 and 
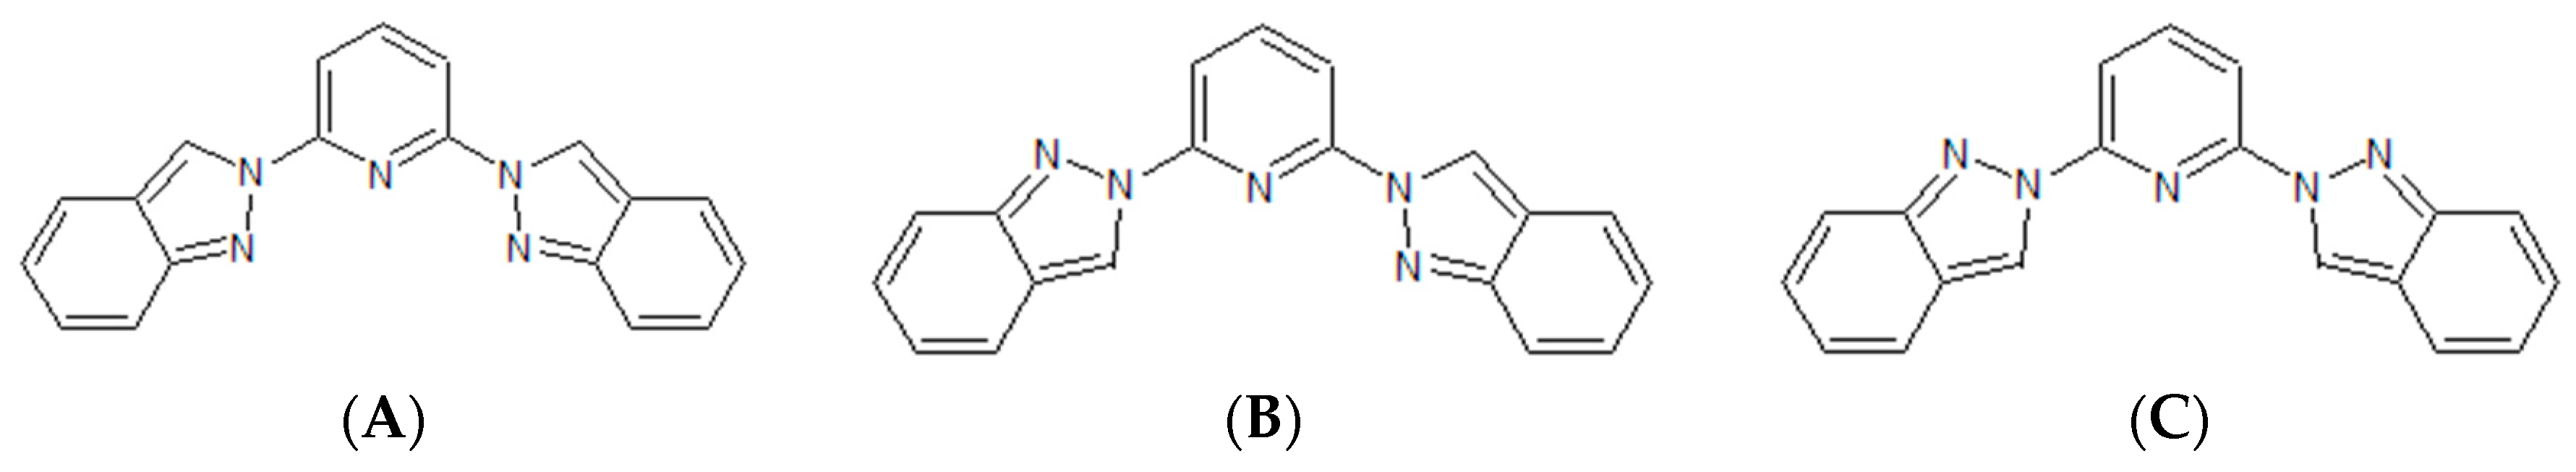
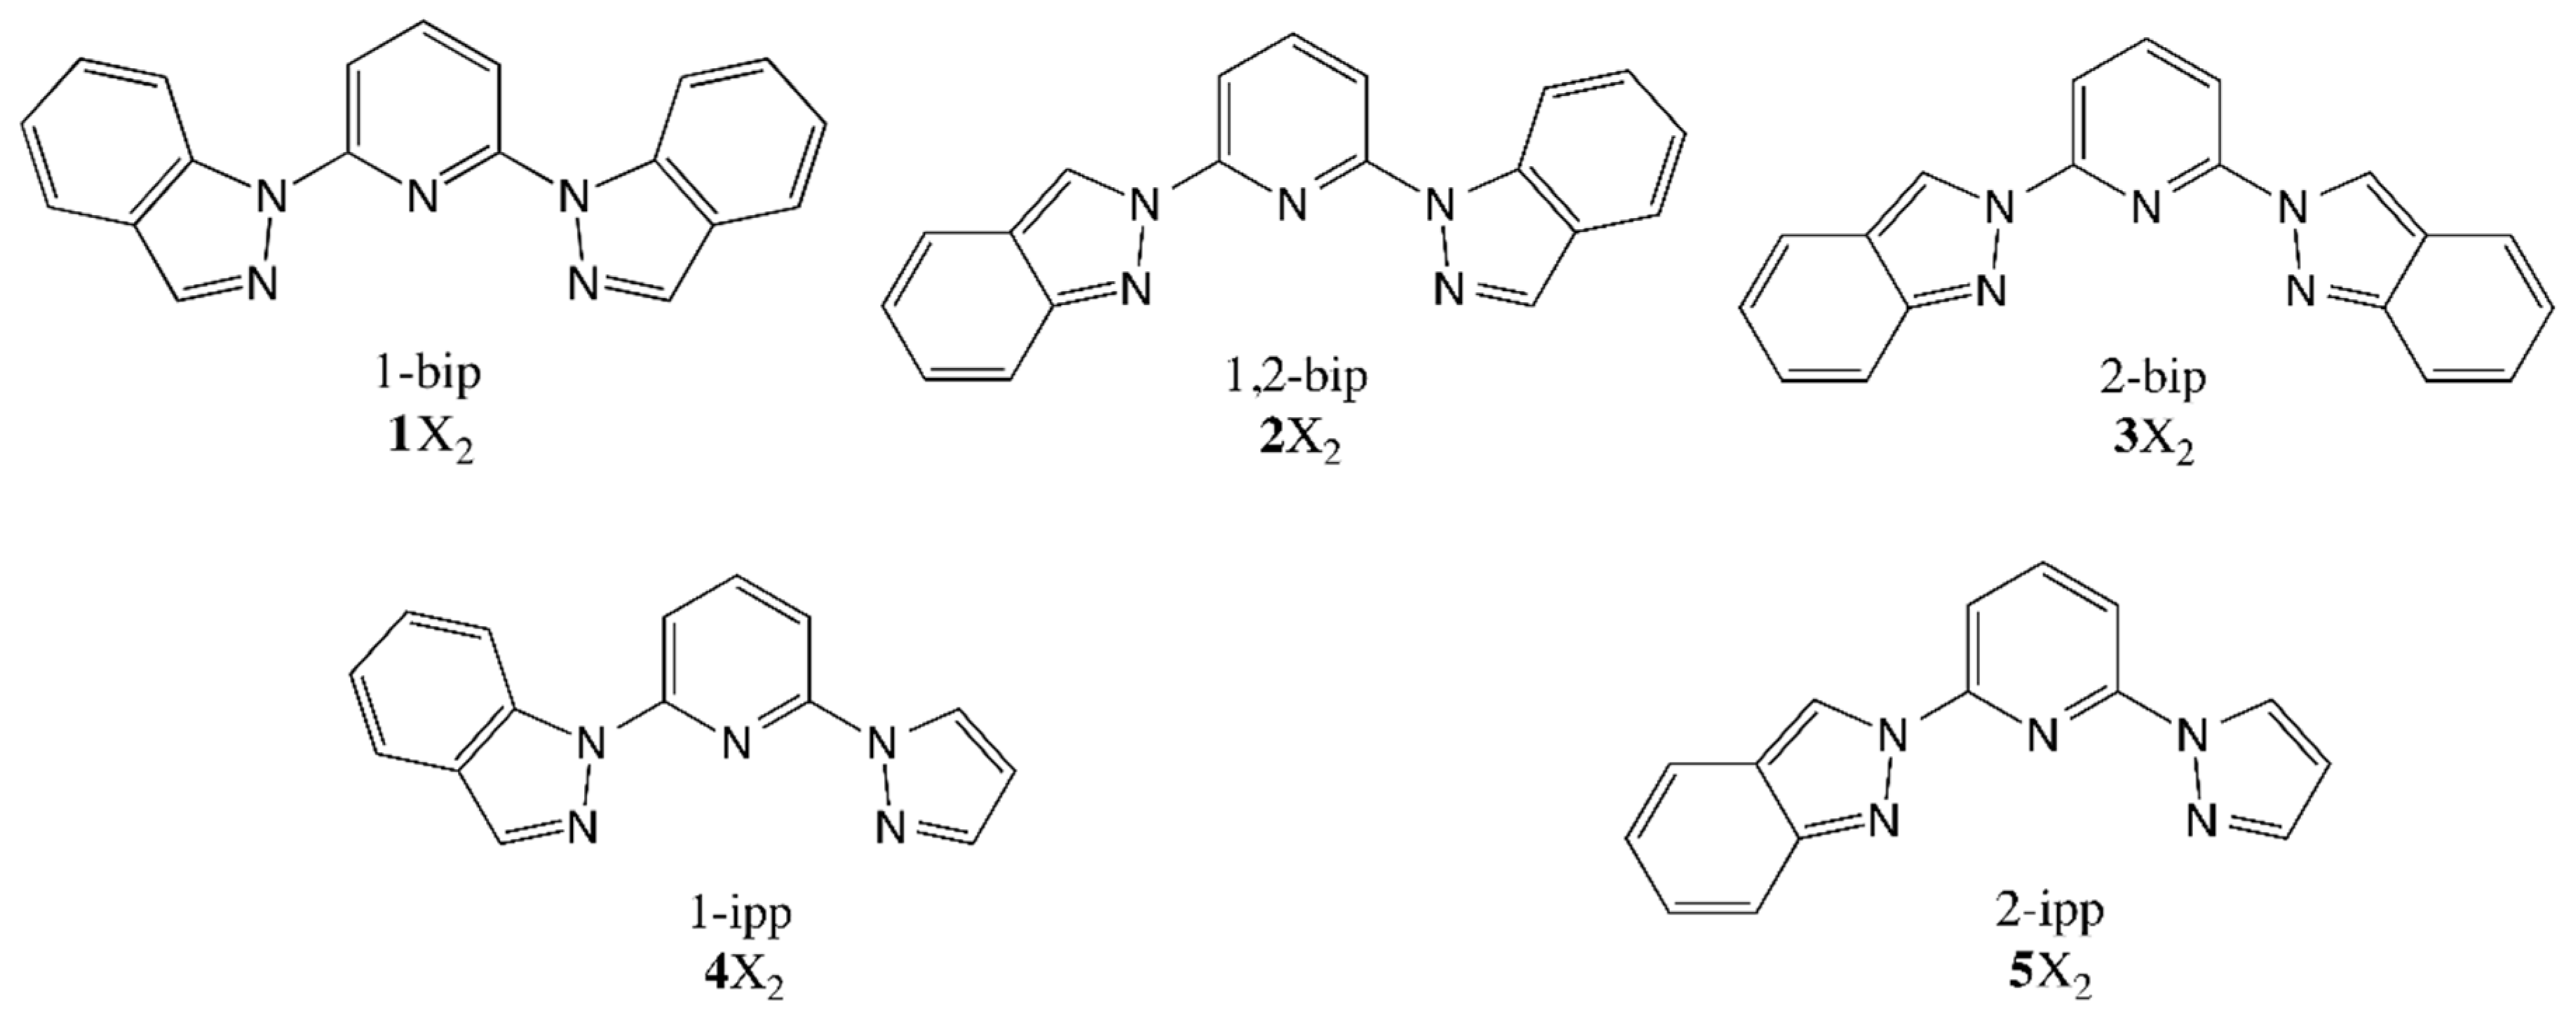
5 have different ligands based on a central pyridine and two lateral aromatic groups attached to it (see Scheme 1). In the case of the ligands employed for 2 (1,2-bip) and 3 (2-bip), those groups are indazol-1-yl and indazol-2-yl, respectively. In turn, the ones used for 4 (1-ipp) and 5 (2-ipp) hold one pyrazol-1-yl moiety and either an indazol-1-yl (4) or an indazol-2-yl (5) moiety. Therefore, ligands 2 and 3 (and also 4 and 5) have the same chemical formula and, thus, can be easily compared. As we will show in the following paragraphs, the structural difference between the ligands 1,2-bip and 2-bip is responsible for a notable change in the SCO properties of 2 and 3 and, interestingly, this effect is also experienced by compounds 4 and 5 as a result of a change in their constituent 1-ipp and 2-ipp ligands, respectively.
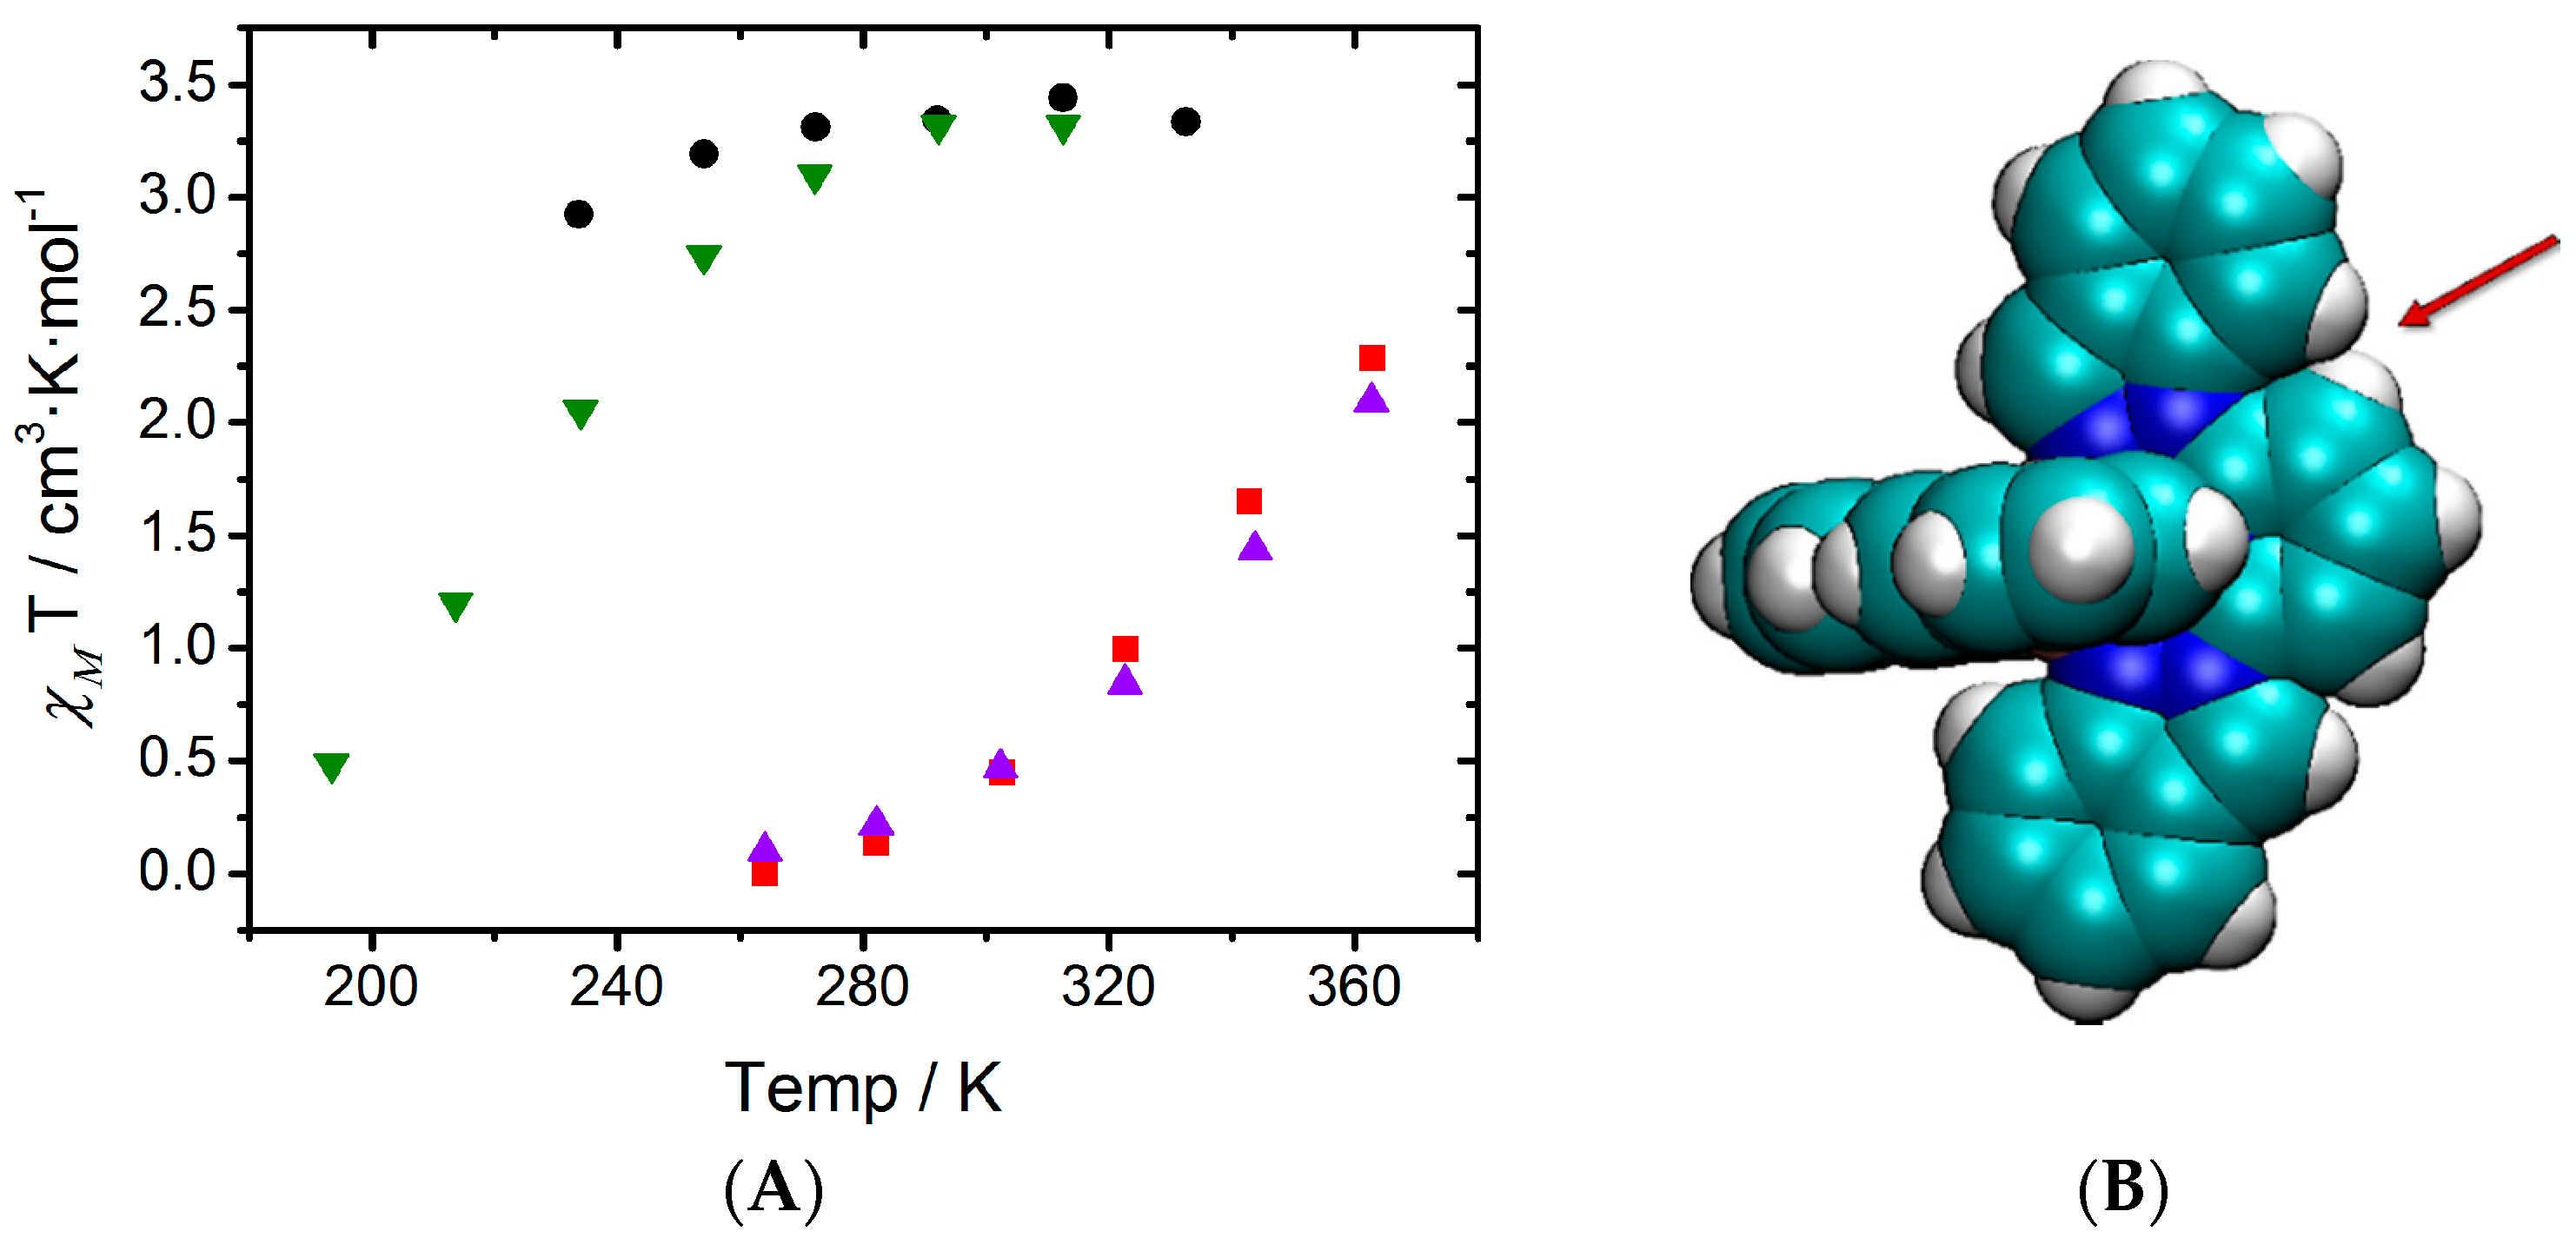
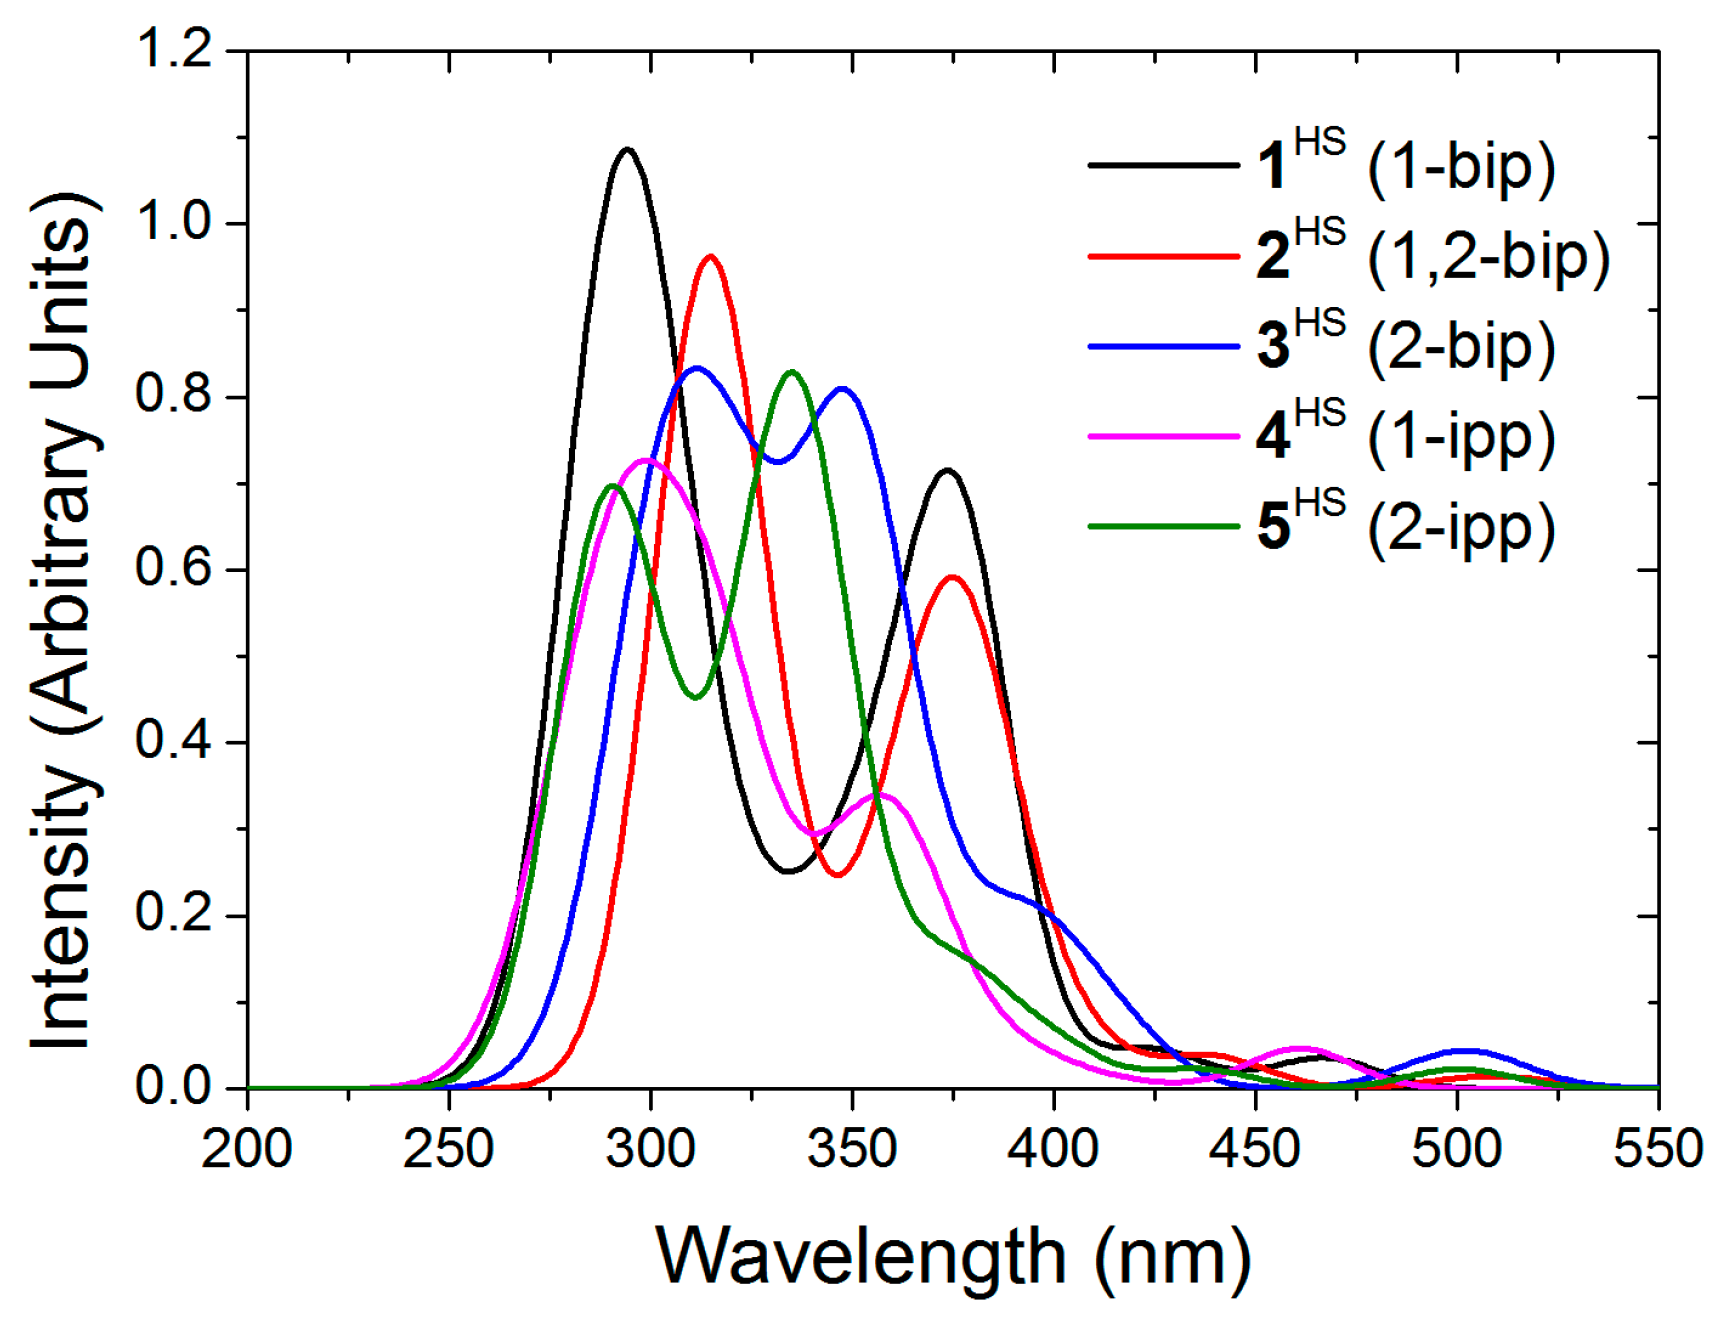
It has been experimentally observed that solutions of 2 and 4 at room temperature are mostly in the LS state, whereas 3 and 5 are fully HS (see Figure 1A). These results were ascribed to conformational rigidity, imposed as a consequence of intra-ligand H···H contacts (see Figure 1) involving the central pyridine and the indazol-1-yl group, the latter present only in 2 and 4. According to this explanation, the expansion of the FeN6 first-coordination sphere as a result of the LS-to-HS transition would imply a distortion of the ligand, that would penalize 2HS and 4HS, but not 3HS and 5HS, since the aforementioned H···H contact would not be relevant when indazol-2-yl groups are present, such as in those compounds. Note that this argument implies that 2LS and 4LS do not suffer from an energy penalty, and that a double penalty would be present in 2 than in 4, since the former has two indazol-1-yl groups while the latter has only one. In the following lines we will demonstrate that this is, indeed, not the case, and that the different LS/HS relative stability in 2 and 4 with respect to 3 and 5 arises from the inter-ligand interactions that penalize the stability of 3LS and 5LS FeN6 first-coordination sphere. In order to investigate this issue, we have first computed the adiabatic energy difference ( Δ H elec ) associated to the four compounds both in gas phase and in their solvent, simulated using a self-consistent continuum solvation (SCCS) approach (see Table 3). It is observed that Δ H elec is larger for 2 and 4 than for 3 and 5, in agreement with experiment, both in gas phase and in solution. Notably interesting is that in all cases the LS state is largely stabilized by the solvent conditions, whose general effect on Δ H elec is not negligible (8 kJ·mol−1 in average, see Table 3).
Figure 1. (adapted from [27]): (A) Solution-phase magnetic susceptibility data of 2[ClO4]2 in CD3NO2 (red), 3[ClO4]2 in CD3CN (black), 4[ClO4]2 in CD3NO2 (violet) and 5[ClO4]2 in (CD3)2CO (green); (B) view of compound 4 highlighting the intra-ligand H···H contact.
Magnetochemistry 02 00006 g001
Table 3. Adiabatic energy differences ( Δ H elec ) associated to the spin transition of compounds 25 in gas- and solvent-phase, simulated using the PCM approach. Energies are given in kJ·mol−1.
Compound Δ H e l e c (Gas Phase) Δ H e l e c (Solvent Phase)Effect of Solvent
225.633.98.3
314.217.43.2
425.637.612.0
513.422.89.4
At this point, we shall now determine the origin of the different spin-state stability between 2 and 3 (and between 4 and 5). To do so, we have first excised the nuclear coordinates of the ligand from the optimized structures of the HS and LS minima of the studied compounds and then evaluated their absolute energy (see Table 4). It can be seen that, for each pair of comparable ligands: 1,2-bip (2) vs. 2-bip (3), and 1-ipp (4) vs. 2-ipp (5), the ligands tend to be destabilized when its structure “points” to the metal coordination center, that is, it is destabilized in compounds 3 and 5 with respect their analogues 2 and 4, respectively (for instance: −330.884 vs. −330.873 a.u. for the HS structures of 2 and 3, see Table 4). However, once we compare the energy difference within the same ligand in its geometry extracted from the HS and LS minima of the corresponding SCO molecule, it can be seen that for both comparable pairs of ligands the energy difference is essentially the same (ca. −24 kJ/mol for 1,2-bip vs. 2-bip and ca. −26 kJ/mol for 1-ipp and 2-ipp). If the adiabatic gap of these compounds was governed by the structure of the ligand, 2 and 3 should have equivalent energy differences, and, analogously, should 4 and 5 (see Table 3). Therefore, the different LS/HS relative stability found between 2 and 3 (or 4 and 5) cannot be originated in a larger energy penalty of the ligands in the HS state of 2 (4) with respect to 3 (5), but in its effect on the FeN6 coordination sphere.
Table 4. Absolute energy and energy difference (ΔE) between the geometries of (left) each ligand, and (right) that of the FeN6 first coordination sphere, both extracted from the HS and LS minima of each complex. Absolute energies in Ry. Energy differences in kJ·mol−1.
MinimaLigand StructuresΔE[Fe(NCH)6]2+ StructuresΔE
1,2-bip2HS−330.8842LS−330.865−24.892HS−446.9752LS−447.00134.63
2-bip3HS−330.8733LS−330.855−24.103HS−446.9753LS−446.99425.14
1-ipp4HS−282.9994LS−282.979−26.274HS−446.9774LS−447.00131.92
2-ipp5HS−282.9845LS−282.963−27.405HS−446.9615LS−446.98328.84
In order to investigate this issue, we have again taken the nuclear coordinates of the LS and HS minima of compounds 25 and removed all but the FeN6 coordination sphere. Then, we have attached a –CH group to each N atom, yielding eight [Fe(NCH)6]2+ complexes with different geometries (i.e., four from HS geometries and four from LS) whose energy has been then evaluated (Table 4). Note that the –CH groups were positioned at 180° of the Fe–N bond, being all C–N distances 1.15 Å and all C-H distances 1.07 Å. In these results an important difference can be seen in the adiabatic gaps that result from the 2- and 3-derived [Fe(NCH)6]2+ compounds (34.6 vs. 25.1 kcal/mol), and the same between those related to 4 and 5 (31.9 vs. 28.8 kcal/mol). This means that the shape of the FeN6 first-sphere of coordination, which results from the use of the four different ligands, has an important influence in the adiabatic gap of compounds 25. In particular, it can be seen in Table 4 that, whereas the absolute energy of the HS [Fe(NCH)6]2+ complexes is very similar, that of the LS derivatives is more different. As a result, we believe that the spin state stability of the [Fe(NCH)6]2+ complexes (and, thus, also of compounds 25) is mostly dictated by the stability of the FeN6 core when it is in the LS state.
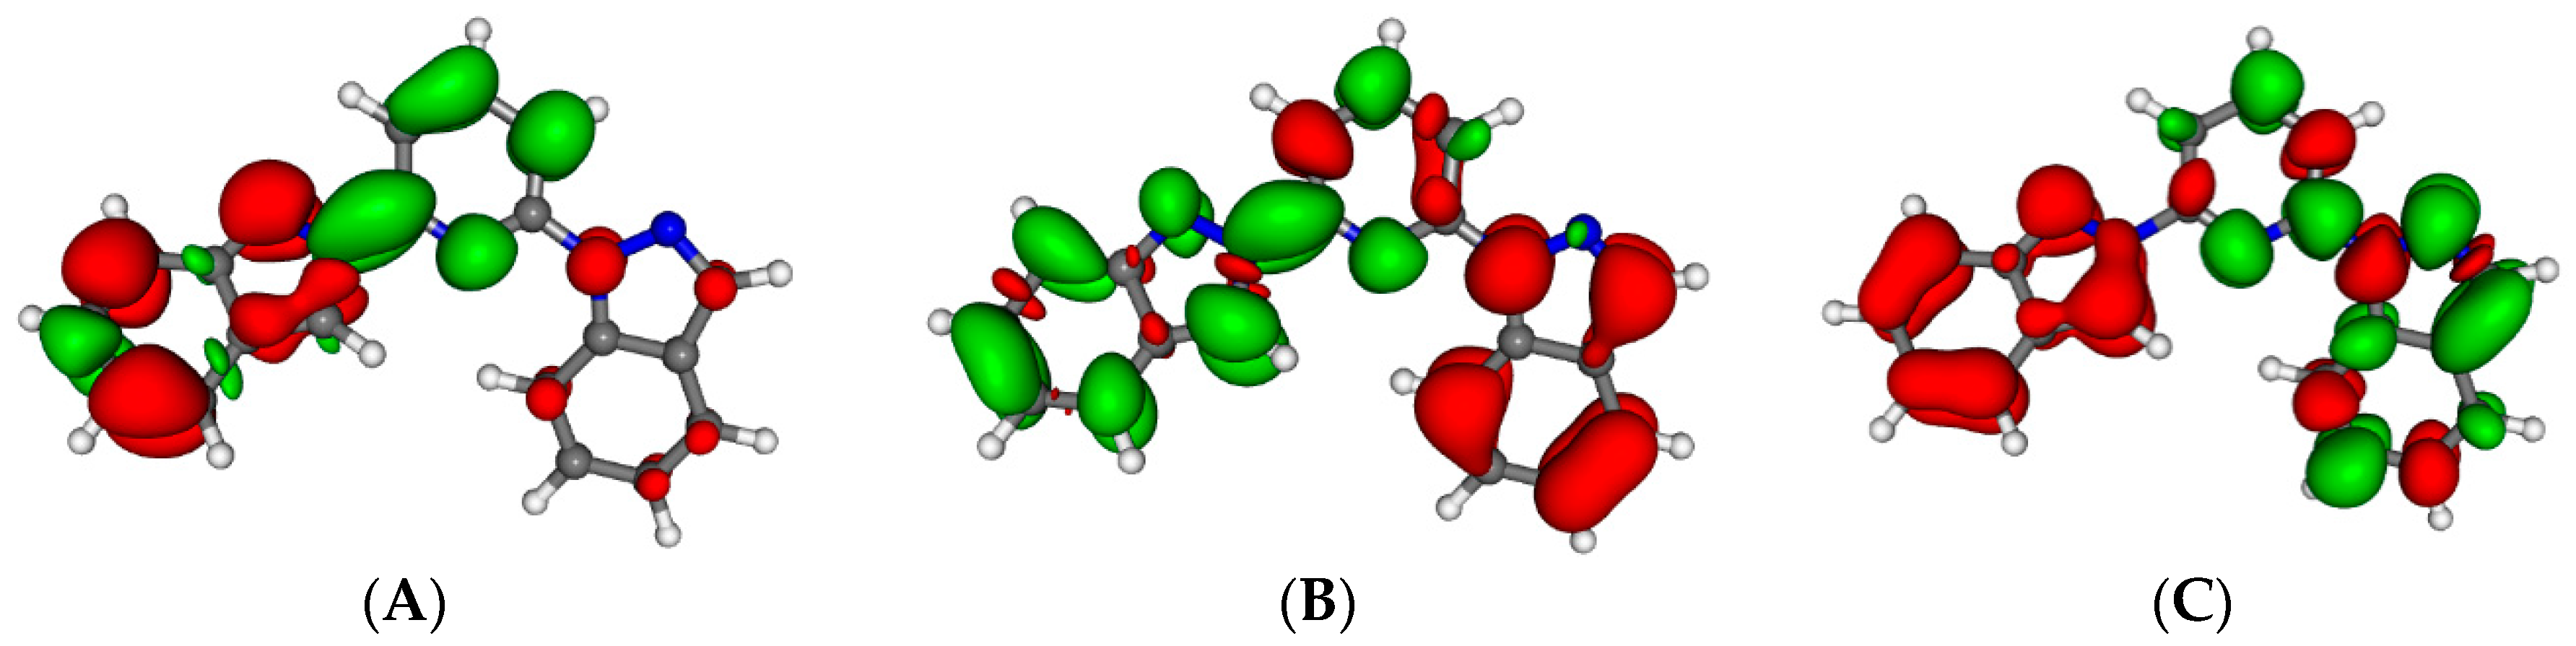
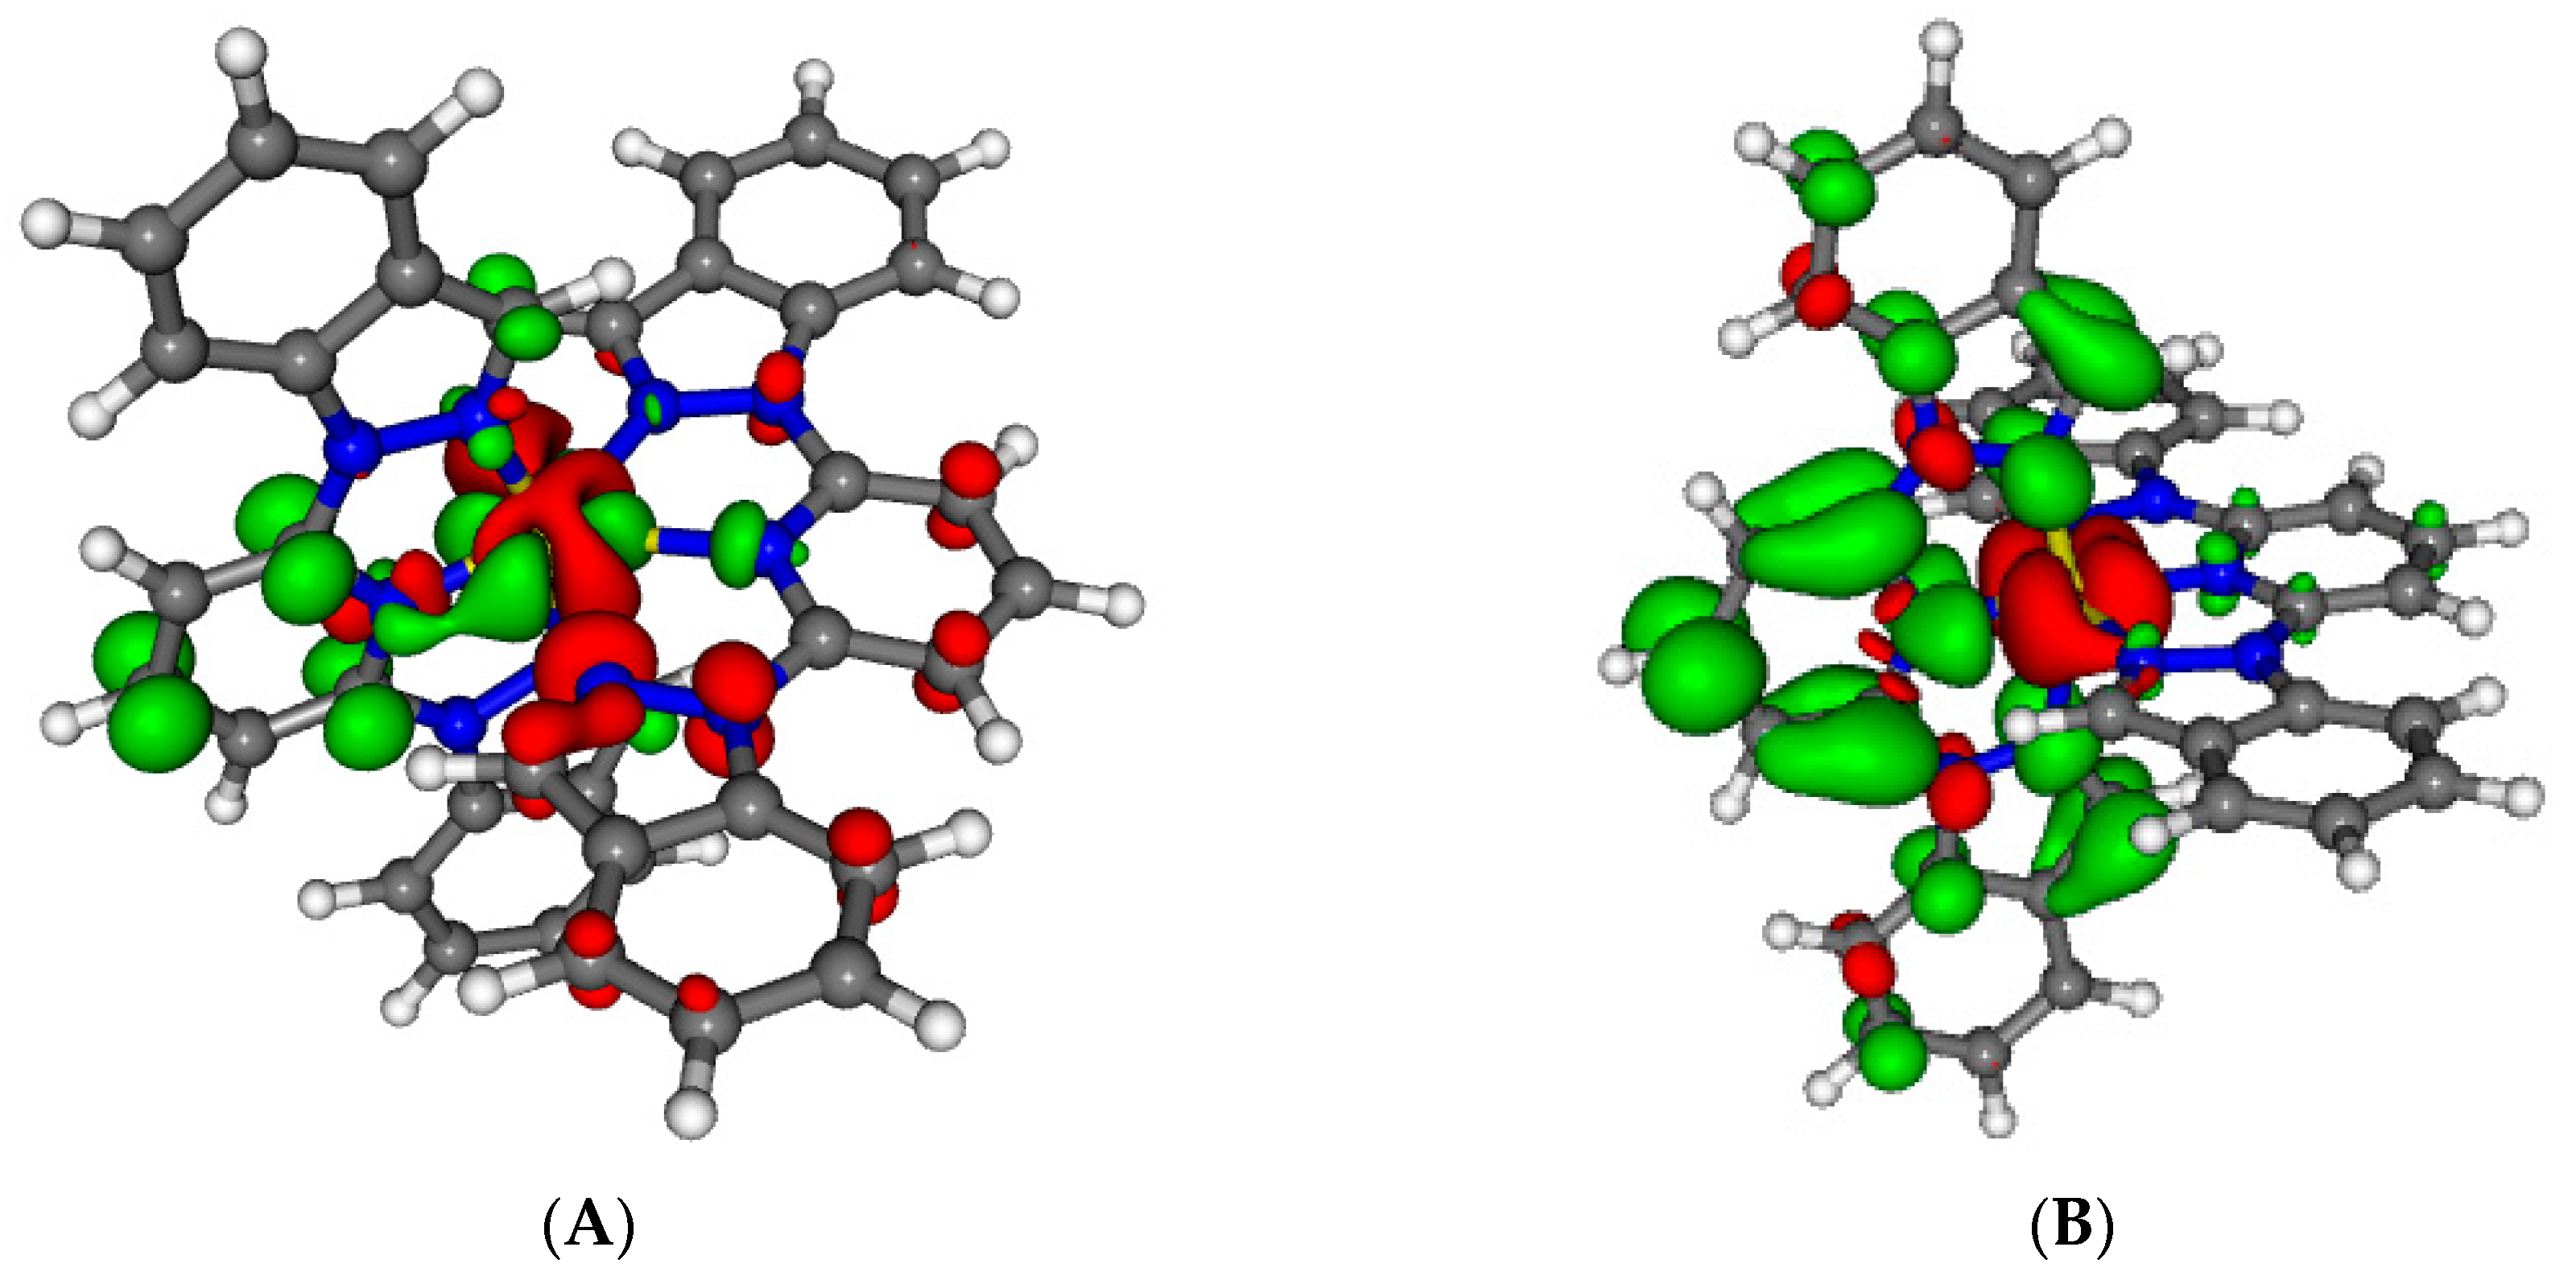
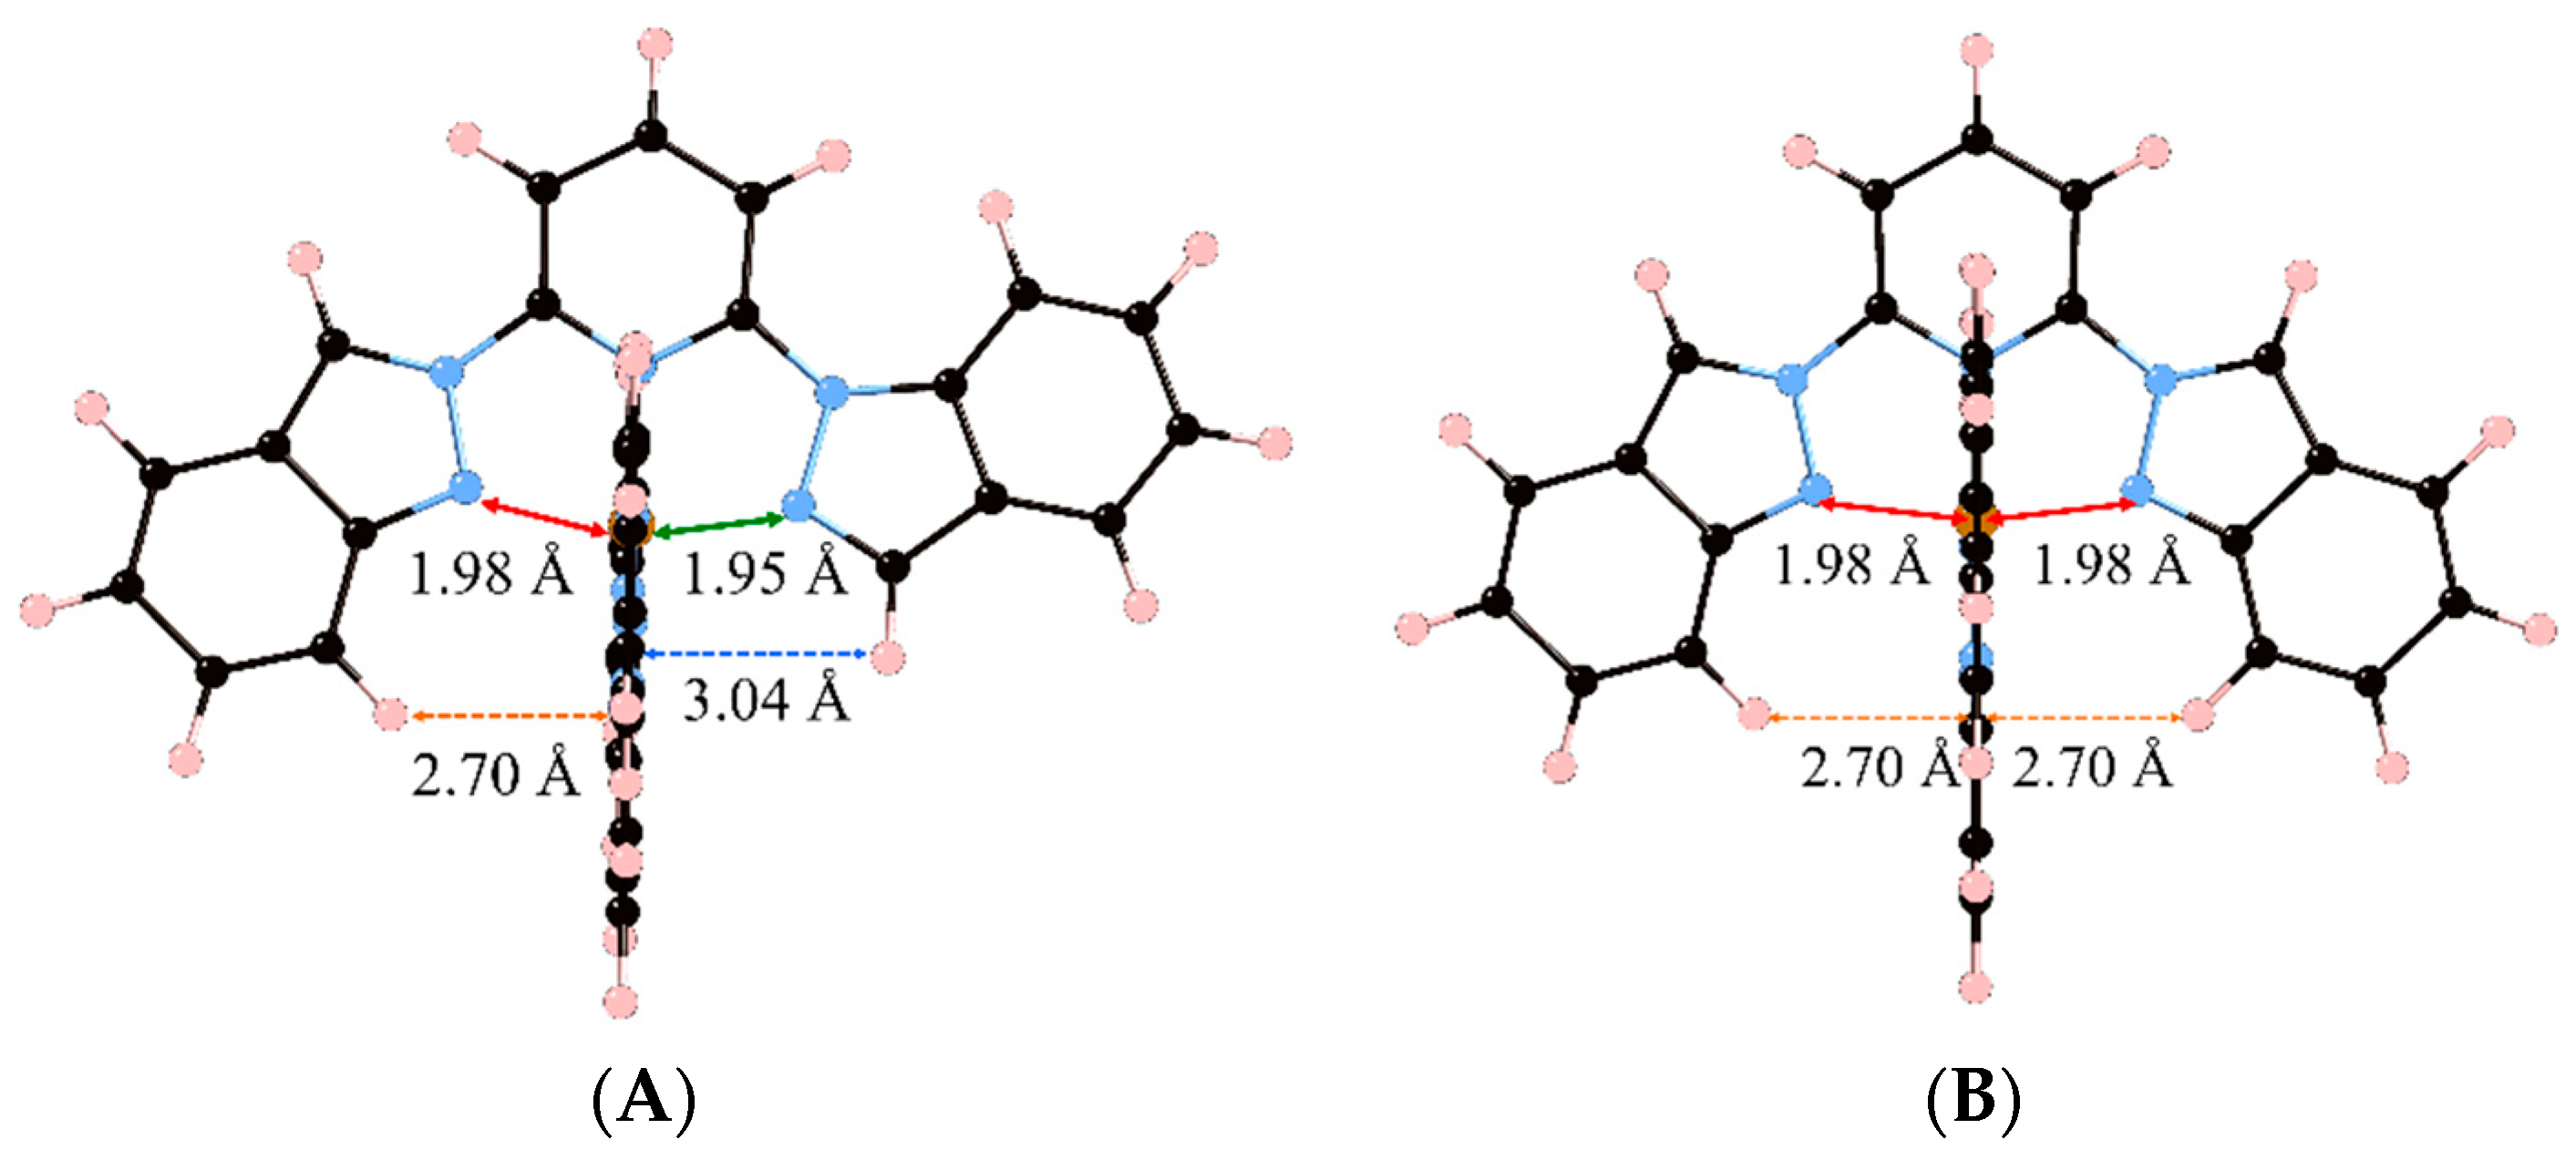
At this point, it is worth analyzing which structural constraints are responsible for this observation. To do so, we must compare the LS minima of compounds 2 and 3 (again, the same conclusions can be extracted for the pair of compounds 4 and 5), which are shown in Figure 2. First, one must keep in mind that compounds 2 and 3 only differ by one of the groups that is attached to the central pyridine in each of the two tridentate ligands. As mentioned before, the ligand used in compound 2 (1,2-bip) has both an indazol-1-yl and an indazol-2-yl group, whereas the ligand used in compound 3 (2-bip) has two symmetric indazol-2-yl moieties. By looking at the two minima (2LS and 3LS), it can be seen that the indazol-1-yl group is associated with an Fe-N distance of 1.95 Å (green line) and an inter-ligand distance of 3.04 Å (blue dashed line), whereas the indazol-2-yl group is associated with an Fe-N distance of 1.98 Å (red line) and an inter-ligand distance of ca. 2.70 Å (orange dashed line). Our hypothesis is that compound 3LS suffers from a double energy penalty with respect to 2LS due to its structural arrangement. For the [Fe(NCH)6]2+ model complex, the optimum Fe–N distances are about 1.90 Å in the LS state due to its bonding character [29]. However, the presence of two indazol-2-yl moieties in the ligands in compound 3 leads to a minimum energy structure that shows four Fe–N distances of about 1.98 Å (Figure 2B) while the distance between the iron and pyridine is ca. 1.91 Å. This large structural difference between the LS of the model complex and 3LS arises from the tridentate ligand rigidity but also from the inter-ligand interactions within the complex. The later effect can be demonstrated by analyzing the optimum geometry of 2LS, and is crucial for understanding their different LS stability. In 2LS, the optimum Fe–N distances between the iron(II) and the indazol-1-yl moieties are reduced until 1.95 Å (Figure 2A). This decrease in the Fe-N distance can only be originated in the lack of steric repulsion between ligands in the complex, and only limited by the rigidity of the tridentate ligand. It is worth mentioning that, although these decrease in the Fe-N distance is extremely small, about 0.03 Å, its effect when evaluating the relative stability of the spin states can be highly significant in these complexes (note that 0.008 Ry correspond to 10 kJ/mol, which can lead to a significant shift in T1/2 [29,30]). Notice that structural distortions in the coordination geometries have also led to remarkable changes in the SCO behavior of other families of compounds [31].
Figure 2. Minimum energy structures of compounds 2 (A) and 3 (B) in its Low Spin state. Important Fe–N distances and inter-Ligand distances have been highlighted (see main text).
Magnetochemistry 02 00006 g002

2.3. Structure and Absorption and Emission Spectroscopy

2.3.1. Isolated Ligand

All isolated ligand structures were optimized in chloroform. One must note that the conformation adopted by the ligand molecules when attached to the Iron ion is not the one adopted when they are free. First, to minimize steric congestion, a strong out-of-plane distortion appears so that the ligand is no longer planar. Second, when in the complex, the three binding nitrogen are necessarily in the same side of the molecule, whereas in the free ligand four conformations are possible (in-in, out-in/in-out, out-out, see Scheme 2), depending on whether the coordinating nitrogen atoms of each of the two lateral groups is in the same side (in) to that of the central pyridine, or not (out). For all cases, the out-out conformation is the most stable in agreement with the experimental crystal structures [27]. However, the energy differences between the different conformers remain small (see Table 5) especially for in-in and in-out. Therefore, several conformers are probably present in solution, with out-out as a major conformer and in-out or out-in as minors.
Scheme 2. Representation of in-in (A), in-out (B) and out-out (C) conformers of the 2-bip ligand.
Magnetochemistry 02 00006 g011
Table 5. Energy difference (in kJ·mol−1) for each ligand between the trans-trans conformer (the most stable) and the other ones.
Ligandin-inin-outout-inout-out
1-bip20.27.4-0.0
1,2-bip22.810.510.70.0
2-bip26.214.5-0.0
1-ipp23.28.29.90.0
2-ipp25.212.814.00.0
Regarding the stability of the out-out conformation, the steric congestion does not seem to play the key role. Instead, its enhanced stability is probably due to the lack of lone pair repulsion between the nitrogen atoms. Apart from that, one must notice that in 1,2-bip, the inversion of one or the other side chain leads to the same energy gain (10.5 vs. 10.7 kJ/mol, see Table 5). Similarly, inversion of the imidazole of the other side chain in 1-ipp or 2-ipp is close in energy, being more costly the inversion of the 2-ipp. Given that the out-out conformation is the most stable in solution, the absorption spectra of ligands 15 were computed on these structures (see Figure 3). As experimentally observed [27] all ligands exhibit a strong absorption around 300 nm with small shoulders around 350 nm (2-ipp for example). Strong absorption peaks lie at smaller wavelength but they are not represented in the experimental spectra (cut at 300 nm).
Figure 3. Computed absorption spectra of the out-out conformers of the free ligands in chloroform.
Magnetochemistry 02 00006 g003
Figure 4 presents the nature of the five lowest excited states (S1–S5) for the isolated 1,2-bip ligand in its out-out conformation. All are very similar and consist on a combination of π–π* transition and charge transfer. The state S1 (absorbing at 343 nm, oscillator strength (fosc) = 0.19) consists mainly in a charge transfer from the 2-bip side chain towards the pyridine with some * transition on this side chain. S2 (337 nm, fosc = 0.26) is a charge transfer from the 1-bip side chain towards the 2-bip side chain with some π–π* contribution on the pyridine. S3 (313 nm, fosc = 0.53) is a mixture of a π–π* excitation on the pyridine—1-bip fragment with some charge transfer from the 2-bip side chain towards the fragment. S4 (307 nm, fosc = 0.06) mainly consists into a charge transfer from the 2-bip side chain towards the pyridine and 1-bip fragments. Finally, the S5 transition (290 nm, fosc = 0.54) is a mixture of π–π* transition on the 2-bip side chain and a charge transfer from the 1-bip towards the 2-bip side chains. The main characteristics of all these transition are their tendency to electronically deplete the lateral side chains to enrich the central pyridine. The spectroscopy is not strongly affected by the change in conformation as shown in Figure S1. The nature of the bands is the same, only band shifts (around 20 nm) are observed. The other ligands exhibit very similar transitions (nature, wavelength and oscillator strength) with many states between 280 and 350 nm (see details in Table S2), in line with their very similar experimental absorption spectra.
Figure 4. Electron density differences between the excited state and the ground state for the isolated 1,2-bip ligand for S1 (A); S2 (B); S3 (C); S4 (D) and S5 (E). Areas electronically depleted (enriched) upon transition are in red (green).
Magnetochemistry 02 00006 g004aMagnetochemistry 02 00006 g004b
To compute the emission wavelength, the lowest excited singlet states of each compound were optimized. The results are reported in Table 6.
Table 6. Lowest experimental and calculated emission wavelength (nm) computed for each ligand in chloroform in the out-out conformation [27].
LigandExperimentalCalculated
1-bip405376
1,2-bip410395
2-bip410399
1-ipp347366
2-ipp392396
The experimental emission spectra exhibit several maxima [27]. We tried to optimize several excited states identified in the absorption spectra. However, because of state crossing and the proximity of the different excited state each attempt ends in the same minima for all molecules and, thus, only one excited state, the S1, could be successfully optimized (see Figure 5). The nature of the emitting state is determined by which nitrogen the indazolyl group is bonded to the pyridine. Binding through position 1 (1-bip and 1-ipp) leads to an emitting state, which is mainly a charge transfer from the pyridine group towards the indazolyl group. Conversely, binding through a position two (2-bip and 2-ipp) leads to the opposite situation: a charge transfer from the indazolyl group to the pyridine. In the 1,2-bip, where both situations are present; the lowest state is similar to that of 2-bip and 2-ipp. This in line with the orbital order of the ground state: the LUMO leads to this emitting state. Emission similar to that of 1-ipp and 1-bip would be generated by the LUMO + 1.
To investigate the effect of the presence of a positive charge on the ligand properties, we studied the characteristics of the protonation of 1-bip ligand 1. Protonation of the 1-bip completely change the stability of the different conformers. The most stable structure is now the in-in one with the pyridine nitrogen being protonated. The conformer with protonation of the indazolyl is 28 kJ·mol−1 less stable. The out-out conformer with the proton on the pyridine ring is the second most stable conformer though being 18.5 kJ·mol−1 above its in-in equivalent. Protonation also has an important influence on the spectroscopic properties. The whole spectra is red-shifted (Figure S2), the lowest absorbing band moving from 321 nm towards 385 nm upon protonation. The nature of the lowest electronic transition is also reversed. In the neutral ligand, upon excitation, the pyridine ring is electronically impoverished (Figure 5) whether it is enriched in the protonated species (Figure S3). Similarly, the lowest emission band, is strongly red-shifted moving from 376 nm (Table 6) towards 724 nm.
Figure 5. Electron density differences between the optimized first excited state and the ground state at the geometry of the first excited state for 1-bip (A); 1,2-bip (B); 2,bip (C); 1-ipp (D) and 2-ipp (E). Areas electronically depleted (enriched) upon transition are in red (green).
Magnetochemistry 02 00006 g005

2.3.2. Low Spin Iron Complexes

The structures of all iron complexes were optimized in acetonitrile. In Table 7 we report the optimized Fe-N distances, which agree fairly well with the experimental data. It must be noted that the Fe-N coordination bond with the pyridine is shorter than those with the indazolyl or pyrazolyl groups (the same is observed and discussed in Section 2.2). The absorption spectra has been computed on these optimized structures, and have been collected in Figure 6. These spectra are all similar with a main absorption band localized between 300 and 350 nm, and with a lower absorption tail up to 500 nm (550 nm for 2-bip). The spectra are in fair agreement with the experimental ones [27] in which the main band was found to have the same characteristics. The nature of the lowest and main absorbing bands for 2 are detailed in Figure 7. The absorption spectrum for this complex is characterized by one absorbing state above 500 nm with almost no intensity, well separated from a large band starting around 450 nm. This band extends towards the blue gaining in intensity with a maximum at 297 nm and is characterized by a very high density of states. The main experimental peak at 328 nm is the result of merging five major contributions. The nature of the lowest absorbing state is very mixed (see Figure 7). Furthermore, this transition does not involve the LUMO (ligand π* orbitals) of the complex but higher virtual ones including the unoccupied d orbitals of the Fe. This explains the Metal-Centered (MC) character of the transition along with Ligand-Centered (LC) contribution. This MC nature disappear in the main absorbing states (see Figure 7), which are a mixing of Metal-to-Ligand (MLCT) excitation and LC states. This description of the 1,2-bip complex 2 can be generalized to the other ones which have the same characteristics.
Table 7. Computed (and experimental [27]) Fe-N distances (in Å) in complexes 1–5.
Distance 1 (1-bip)2 (1,2-bip)3 (2-bip)4 (1-ipp)5 (2-ipp)
Fe–N(pyridine)1.9131.9151.913 (1.884)1.914 (1.896)1.914
Fe–N(indazol-1-yl)1.9801.980-1.983 (1.941)-
Fe–N(indazol-2-yl)-2.0072.008 (1.968)-2.011
Fe–N(pyrazol-1-yl)---1.995 (1.971)1.995
Figure 6. Computed absorption spectra of the low spin complexes 15 in acetonitrile.
Magnetochemistry 02 00006 g006
Figure 7. Electron density differences between the ground and lowest excited states of 2 at 553 nm (A, fosc = 3.5 × 10⁻⁵) and the main absorbing states at 315 nm (B, fosc = 0.354), 312 nm (C, fosc = 0.453) and 297 nm (D, fosc = 0.794). Areas electronically depleted (enriched) upon transition are in red (green).
Magnetochemistry 02 00006 g007
We tried to study the emission spectra of those complexes and we optimized the lowest excited states. However, we first need to note that the experimentally observed fluorescence occurs at shorter wavelength than the lowest absorbing state. This suggests that the emission comes from higher excited states and that the complexes are excited in their main absorbing band (from 300 to 327 nm). Indeed, the optimization of the complexes lowest excited states leads to a strong red shift between the absorption and emission wavelength of these states. This is consistent with the fact that the first excited singlet Potential Energy Curve (PES) crosses the ground state PES leading to a more stable triplet state, a well-known scenario for iron complexes [32]. This is due to the change in character of the transition, which becomes an almost pure MC state after symmetry breaking. This is associated to a strong geometry distortion due to Fe-N bond lengthening. For example, the lowest excited state for the 1-bip ligand is a pure MC state (see Figure 8), which is more stable in the triplet configuration than in the singlet one at this geometry. A possible state contributing to the emission has been localized for this complex at 399 nm (fosc = 0.10). It is a MLCT state (with weak π–π* transition) from the iron to one of the bip ligand (Figure 8) and mainly to the pyridine moiety. It is of A1 symmetry of the D2 subgroup. Optimization after symmetry breaking has not been possible because of the high density of states present and the numerous crossings it generates. This scheme of a lowest singlet excited state becoming a pure MC is general for the five studied complexes. The fluorescence spectra can be explained by emission from the main absorbing band composed of a number of mixed MLCT and LC states.
Figure 8. Electron density differences between the optimized first excited state and the ground state of 1 at the geometry of the excited state. A is the nature of the lowest excited state found (without symmetry) and B is one possible emitting state (assuming C2v symmetry). Areas electronically depleted (enriched) upon transition are in red (green).
Magnetochemistry 02 00006 g008
As experimentally observed [28], the main absorbing band is shifted towards the red upon iron complexation. For the 1-bip ligand, in its free situation the main absorption is at 314 nm which is red-shifted at 348 nm in iron complex. This supports the statement that complexation of a Fe2+ cation mimics that of protonation. The main absorbing band is red-shifted and the transition involved is similar in the isolated protonated ligand and in the complex (Figure S1 and Table S2). In both case it is mainly a charge transfer from the indazolyl moieties towards the pyridine ring. Though two points should be addressed. In the complex, the concerned transition also involved the metal orbital. Also, the nature of the transition changes in the free ligand upon protonation.

2.3.3. High Spin Iron Complexes

We performed the optimization of the high spin state (quintet state) of the complex with the unrestricted approach (see Table 8). Again, the obtained geometries are very similar to the experimental ones, and the trends found for Δ H elec at the B3LYP-DFT level are also in agreement. For the 1-bip (1), 1,2-bip (2) and 1-ipp (4) complexes the LS state is more stable whereas the HS is more stable for the 2-bip (3) and 2-ipp (5) complexes. The difference with respect to the results obtained with DFT + U (see Table 3) was expected, since the larger amount of HF exchange tends to overstabilize the HS state [33,34].
Table 8. Calculated (and experimental) Fe-N distances (Å) in the 5 complexes and relative stability between LS and HS (in kJ/mol).
Distance & ΔH1-bip1,2-bip2-bip1-ipp2-ipp
Fe–N(pyridine)2.1322.1472.145 (2.138)2.1342.140
Fe–N(indazol-1-yl)2.1702.143-2.191-
Fe–N(indazol-2-yl)-2.2112.184 (2.177)-2.165
Fe–N(pyrazol-1-yl)---2.1682.207
Δ H e l e c (B3LYP)23.40.2−17.89.0−7.6
Δ H e l e c (PBE+U)-33.9017.3937.5822.81
On the optimized structures we have computed the absorption spectra of the five complexes (Figure 9). The singlet and quintet absorption spectra share many characteristics. The main absorbing bands are localized around 300 nm with less intense peaks around 375 nm. Much less intense electronic transitions appear at longer wavelength (400 to 550 nm). Even weaker transitions are present at lower energy. The absorption spectra extend far in the infrared domain up to 6000 nm (1-ipp complex). These last transitions correspond to beta d–d transitions on the cation. The nature of the other bands is very similar to that of the low spin spectra. The domain between 400 and 550 nm is composed of MLCT transitions whereas at higher energy it is a mixture of LC and MLCT.
Figure 9. Computed absorption spectra of the high spin complexes 15 in acetonitrile.
Magnetochemistry 02 00006 g009
Experimentally, the 1-bip and 1-ipp complexes are in the low spin configuration. For the 1-bip complex the most intense peak is localized at 323 nm. The theoretical peak is slightly blue shifted and, for low spin complexes, it is the result of the merging of several transitions: 289 (fosc = 0.131), 289 (fosc = 0.159), 290 (fosc = 0.177), 290 (fosc = 0.157), 303 (fosc = 0.196) and 305 nm (0.110). All these transitions are mainly LC transitions with very small MLCT contribution. This is consistent with the experimental observation, the 1-bip complex and free ligand absorb at the same wavelengths. For the 1-ipp complex the main peak is localized at 322 nm. It is also issued from the merging of two transitions at 316 (fosc = 0.155) and 315 nm (0.132). These transitions are also almost pure LC transitions. This is again consistent with the fact that the 1-ipp complex and free ligand absorb at very close wavelengths, 316 and 322 nm, respectively.
The characteristics of the absorption and emission spectra of the free ligand, low spin and high spin complexes explain the experimental observations. For all iron complexes, the main absorption peaks are mainly LC transitions with very few MLCT contributions. This explains the great proximity between the absorption of the free ligand and the iron complexes regardless of the spin state of the complex. However, our calculations show that, even if it is weakly, the cation is involved in the transition of the main absorbing band, slightly shifting the absorption wavelength. Furthermore, the change in the ligand geometry between its free situation and in the complex may have an influence on the spectra.
We were not able to optimize the emitting states. Only the lowest excited states have been studied though their emission wavelengths are too red compared to the experimental fluorescence spectra. However, we can easily deduce their nature from the emission wavelengths. In all compounds, the laser excites the molecules in the main absorption band (300–335 nm). Then the iron complexes emits in the UV domain at higher energy than where the MLCT absorb. Consequently, the emitting states can only originate from LC states, which explains the similarity between the emission of the free ligands and of the complexes. This is also the reason why the emission only weakly depends on the cation spin state. Again, if these states are almost pure LC states, our calculations show that there is a tiny contribution of MLCT transitions in these high-energy emitting states making the spectra sensitive, even if weakly, to the cation spin state.

3. Computational Details

All energy evaluations in Section 2.1 and Section 2.2 have been performed using the Quantum Espresso package (QE) Version 5.1 [35], using the PBE + U functional with a U parameter of 2.65 eV parameter on the “d” orbitals of iron, within the spin unrestricted formalism, the D2 correction of Grimme, Vanderbilt pseudopotentials and a Γ-point sampling of the Brillouin zone. For the solid state calculations, the minimum energy structure of the HS and LS crystals has been obtained by performing successive variable-cell geometry relaxations, in which the lattice parameters as well as the atomic positions are optimized simultaneously until the atomic forces are smaller than 1.0 × 10⁻⁵ atomic units. In these calculations, the number of plane waves has been kept constant at a kinetic energy cutoff of 70 Ry throughout the variable-cell relaxations. A constant number of plane waves imply no Pulay stress but a decreasing precision of the calculation as the volume of the super-cell increases. The large cutoff employed in these calculations ensures that the artifacts arising from this change of precision are negligible. The spin state of the iron atoms is obtained by defining an appropriate initial guess (LS or HS) that is maintained along the optimization. For the gas-phase and solvent calculations, the HS and LS minima have been calculated in a cubic cell of 60 Bohr3, which ensures that the molecules are effectively isolated from their virtual counterparts. The solvent has been included using the SCCS model developed recently, a continuum solvation model similar to PCM but designed to work in periodic boundary conditions [36]. For these calculations at a constant cell size, the number of plane waves has been kept constant at a kinetic energy cutoff of 25 Ry.
All calculations in Section 2.3 have been performed using the ADF 2013 package (Vrije Universiteit, Amsterdam, The Netherlands, 2013) [37]. Slater type orbitals have been used with all-electrons triple-ζ quality basis sets at DFT level of theory using the hybrid B3LYP functional. Scalar relativistic effects were included through ZORA Hamiltonian [38]. Solvation effects were included through PCM model of chloroform for the isolated ligands and of acetonitrile for the iron complexes. Open-shell systems were treated within the unrestricted scheme; in all cases the spin contamination was checked and found to be negligible. All structures were fully optimized and the absorption spectra computed on the final structure. The ligand emission wavelengths of the ligand were computed after excited state geometry optimization at the same level of theory.

4. Conclusions

In summary, we have evaluated the effect of the MeNO2 solvent molecules in the crystalline phase of 3[BF4]2, we have shown that the over-stabilization of the LS phase in the solvent-containing crystal is due to two effects. On one hand, the destabilization of the HS geometries of the individual SCO units, probably as a result of a more-densely-packed crystal structure. On the other hand, due to the creation of more stabilizing intermolecular interactions in the LS phase. Then, we have demonstrated that the different SCO behavior (in solvent-phase) of the compounds presenting indazol-1-yl (2 and 4) and those having indazol-2-yl (3 and 5) does not originate in a H···H contact that penalizes the stability of 2HS and 4HS, as experimentally suggested. Instead, it is due to the destabilization of 3LS and 5LS due the unfavorable arrangement of their FeN6 core as a consequence of inter-ligand interactions.
Finally, we have studied the emission and absorption properties of the free ligands and the HS and LS complexes. We have assigned the nature of all the computed bands in the absorption spectra. Moreover, and even though we were not able to optimize the states that originate the fluorescence, we could deduce a qualitative scheme for the spectroscopy of 25. The complex main absorbing bands originate from LC states modulated by weak MLCT contribution. This explains the small red shift observed between the free ligand and the complex absorption in experimental measurements. The spin state of the Fe might weakly influence the spectra, since in the high-spin state there is an even smaller MLCT contribution, thus leading to a smaller red shift. We believe that this observation is also valid for the emission properties.

Supplementary Files

Supplementary File 1

Acknowledgments

Maria Fumanal and Jordi Ribas-Arino acknowledge the Spanish Government for financial support (Projects MAT2011-25972 and MAT2014-54025-P) and a “Ramón y Cajal” fellowship to Jordi Ribas-Arino. We also acknowledge Universitat de Barcelona for a Ph.D grant to Maria Fumanal and the Catalan Government (Grant 2014SGR1422). Sergi Vela is also thankful to the LabEx-Chemistry of Complex Systems for a post-doctoral grant (Grant ANR-10-LABX-0026CSC). The authors acknowledge the regional High-Performance Computing (HPC) center in Strasbourg for computational resources.

Author Contributions

Sergi Vela, Christophe Gourlaouen and Maria Fumanal performed the calculations. Sergi Vela, Christophe Gourlaouen, Maria Fumanal and Jordi Ribas-Arino analyzed data and contributed to the writing of the manuscript.

Conflicts of Interest

The authors declare no conflict of interest.

References

  1. Halcrow, M.A. Spin-Crossover Materials: Properties and Applications; Wiley: Oxford, UK, 2013. [Google Scholar]
  2. Létard, J.-F.; Guionneau, P.; Goux-Capes, L. Towards Spin Crossover Applications. In Spin Crossover in Transition Metal Compounds III; Springer: Berlin/Heidelberg, Germany, 2004; Volume 235, pp. 221–249. [Google Scholar]
  3. Kahn, O.; Martinez, C.J. Spin-transition polymers: From molecular materials toward memory devices. Science 1998, 279, 44–48. [Google Scholar] [CrossRef]
  4. Miyamachi, T.; Gruber, M.; Davesne, V.; Bowen, M.; Boukari, S.; Joly, L.; Scheurer, F.; Rogez, G.; Yamada, T.K.; Ohresser, P.; et al. Robust spin crossover and memristance across a single molecule. Nat. Commun. 2012, 3, 938–944. [Google Scholar] [CrossRef] [PubMed]
  5. Gütlich, P.; Garcia, Y.; Goodwin, H.A. Spin crossover phenomena in Fe(II) complexes. Chem. Soc. Rev. 2000, 29, 419–427. [Google Scholar] [CrossRef]
  6. Munoz Lara, F.J.; Gaspar, A.B.; Aravena, D.; Ruiz, E.; Munoz, M.C.; Ohba, M.; Ohtani, R.; Kitagawa, S.; Real, J.A. Enhanced bistability by guest inclusion in Fe(II) spin crossover porous coordination polymers. Chem. Commun. 2012, 48, 4686–4688. [Google Scholar] [CrossRef] [PubMed]
  7. Gómez, V.; Sáenz de Pipaón, C.; Maldonado-Illescas, P.; Waerenborgh, J.C.; Martin, E.; Benet-Buchholz, J.; Galán-Mascarós, J.R. Easy excited-state trapping and record high ttiesst in a spin-crossover polyanionic Fe(II) trimer. J. Am. Chem. Soc. 2015, 137, 11924–11927. [Google Scholar] [CrossRef] [PubMed]
  8. Guionneau, P.; Letard, J.-F.; Yufit, D.S.; Chasseau, D.; Bravic, G.; Goeta, A.E.; Howard, J.A.K.; Kahn, O. Structural approach of the features of the spin crossover transition in iron (II) compounds. J. Mater. Chem. 1999, 9, 985–994. [Google Scholar] [CrossRef]
  9. Craig, G.A.; Roubeau, O.; Aromí, G. Spin state switching in 2,6-bis(pyrazol-3-yl)pyridine (3-bpp) based Fe(II) complexes. Coord. Chem. Rev. 2014, 269, 13–31. [Google Scholar] [CrossRef]
  10. Halcrow, M.A. Iron(II) complexes of 2,6-di(pyrazol-1-yl)pyridines—A versatile system for spin-crossover research. Coord. Chem. Rev. 2009, 253, 2493–2514. [Google Scholar] [CrossRef]
  11. Kepenekian, M.; Guennic, B.L.; Robert, V. Primary role of the electrostatic contributions in a rational growth of hysteresis loop in spin-crossover Fe(II) complexes. J. Am. Chem. Soc. 2009, 131, 11498–11502. [Google Scholar] [CrossRef] [PubMed]
  12. Kepenekian, M.; Costa, J.S.; le Guennic, B.; Maldivi, P.; Bonnet, S.; Reedijk, J.; Gamez, P.; Robert, V. Reliability and storage capacity: A compromise illustrated in the two-step spin-crossover system [Fe(bapbpy)(NCS)2]. Inorg. Chem. 2010, 49, 11057–11061. [Google Scholar] [CrossRef] [PubMed]
  13. Pavlik, J.; Boča, R. Established static models of spin crossover. Eur. J. Inorg. Chem. 2013, 2013, 697–709. [Google Scholar] [CrossRef]
  14. Slichter, C.P.; Drickamer, H.G. Pressure-induced electronic changes in compounds of iron. J. Chem. Phys. 1972, 56, 2142–2160. [Google Scholar] [CrossRef]
  15. Tao, J.; Wei, R.-J.; Huang, R.-B.; Zheng, L.-S. Polymorphism in spin-crossover systems. Chem. Soc. Rev. 2012, 41, 703–737. [Google Scholar] [CrossRef] [PubMed]
  16. Matouzenko, G.S.; Bousseksou, A.; Lecocq, S.; van Koningsbruggen, P.J.; Perrin, M.; Kahn, O.; Collet, A. Polymorphism in spin transition systems. Crystal structure, magnetic properties, and mössbauer spectroscopy of three polymorphic modifications of [Fe(dppa)(NCS)2] [dppa = (3-aminopropyl)bis(2-pyridylmethyl)amine]. Inorg. Chem. 1997, 36, 5869–5879. [Google Scholar] [CrossRef] [PubMed]
  17. Bucko, T.; Hafner, J.; Lebegue, S.; Angyan, J.G. Spin crossover transition of Fe(phen)2(NCS)2: Periodic dispersion-corrected density-functional study. Phys. Chem. Chem. Phys. 2012, 14, 5389–5396. [Google Scholar] [CrossRef] [PubMed]
  18. Lebègue, S.; Pillet, S.; Ángyán, J.G. Modeling spin-crossover compounds by periodic DFT + U approach. Phys. Rev. B 2008, 78, 024433. [Google Scholar] [CrossRef]
  19. Vela, S.; Novoa, J.J.; Ribas-Arino, J. Insights into the crystal-packing effects on the spin crossover of [FeII(1-bpp)]2+-based materials. Phys. Chem. Chem. Phys. 2014, 16, 27012–27024. [Google Scholar] [CrossRef] [PubMed]
  20. Lemercier, G.; Bréfuel, N.; Shova, S.; Wolny, J.A.; Dahan, F.; Verelst, M.; Paulsen, H.; Trautwein, A.X.; Tuchagues, J.-P. A range of spin-crossover temperature T1/2 > 300 K results from out-of-sphere anion exchange in a series of ferrous materials based on the 4-(4-imidazolylmethyl)-2-(2-imidazolylmethyl)imidazole (trim) ligand, [Fe(trim)2]X2 (X = F, Cl, Br, I): Comparison of experimental results with those derived from density functional theory calculations. Chem. Eur. J. 2006, 12, 7421–7432. [Google Scholar] [PubMed]
  21. Paulsen, H.; Schünemann, V.; Wolny, J.A. Progress in electronic structure calculations on spin-crossover complexes. Eur. J. Inorg. Chem. 2013, 2013, 628–641. [Google Scholar] [CrossRef]
  22. Vela, S.; Fumanal, M.; Ribas-Arino, J.; Robert, V. Towards an accurate and computationally-efficient modelling of Fe(II)-based spin crossover materials. Phys. Chem. Chem. Phys. 2015, 17, 16306–16314. [Google Scholar] [CrossRef] [PubMed]
  23. Holland, J.M.; McAllister, J.A.; Lu, Z.; Kilner, C.A.; Thornton-Pett, M.; Halcrow, M.A. An unusual abrupt thermal spin-state transition in [FeL2][BF4]2 [L = 2,6-di(pyrazol-1-yl)pyridine]. Chem. Commun. 2001, 577–578. [Google Scholar] [CrossRef]
  24. Carbonera, C.; Kilner, C.A.; Letard, J.-F.; Halcrow, M.A. Anion doping as a probe of cooperativity in the molecular spin-crossover compound [FeL2][BF4]2 [L = 2,6-di(pyrazol-1-yl)pyridine]. Dalton Trans. 2007, 1284–1292. [Google Scholar] [CrossRef] [PubMed]
  25. Kershaw Cook, L.J.; Thorp-Greenwood, F.L.; Comyn, T.P.; Cespedes, O.; Chastanet, G.; Halcrow, M.A. Unexpected spin-crossover and a low-pressure phase change in an iron(II)/dipyrazolylpyridine complex exhibiting a high-spin jahn–teller distortion. Inorg. Chem. 2015, 54, 6319–6330. [Google Scholar] [CrossRef] [PubMed]
  26. Kershaw Cook, L.J.; Halcrow, M. Synthesis of 4-hydroxy-2,6-di(pyrazol-1-yl)pyridine, and the spin state behaviour of its iron(II) complex salts. Magnetochemistry 2015, 1, 3–16. [Google Scholar] [CrossRef]
  27. Santoro, A.; Kershaw Cook, L.J.; Kulmaczewski, R.; Barrett, S.A.; Cespedes, O.; Halcrow, M.A. Iron(II) complexes of tridentate indazolylpyridine ligands: Enhanced spin-crossover hysteresis and ligand-based fluorescence. Inorg. Chem. 2015, 54, 682–693. [Google Scholar] [CrossRef] [PubMed]
  28. Halcrow, M.A. Structure: Function relationships in molecular spin-crossover complexes. Chem. Soc. Rev. 2011, 40, 4119–4142. [Google Scholar] [CrossRef] [PubMed]
  29. Kepenekian, M.; Le Guennic, B.; Robert, V. Magnetic bistability: From microscopic to macroscopic understandings of hysteretic behavior using ab initio calculations. Phys. Rev. B 2009, 79, 094428. [Google Scholar] [CrossRef]
  30. Suaud, N.; Bonnet, M.-L.; Boilleau, C.; Labèguerie, P.; Guihéry, N. Light-induced excited spin state trapping: Ab initio study of the physics at the molecular level. J. Am. Chem. Soc. 2009, 131, 715–722. [Google Scholar] [CrossRef] [PubMed]
  31. Yang, Q.; Cheng, X.; Gao, C.; Wang, B.; Wang, Z.; Gao, S. Structural distortion controlled spin-crossover behavior. Cryst. Growth Des. 2015, 15, 2565–2567. [Google Scholar] [CrossRef]
  32. Cannizzo, A.; Milne, C.J.; Consani, C.; Gawelda, W.; Bressler, C.; van Mourik, F.; Chergui, M. Light-induced spin crossover in Fe(II)-based complexes: The full photocycle unraveled by ultrafast optical and X-ray spectroscopies. Coord. Chem. Rev. 2010, 254, 2677–2686. [Google Scholar] [CrossRef]
  33. Reiher, M.; Salomon, O.; Artur Hess, B. Reparameterization of hybrid functionals based on energy differences of states of different multiplicity. Theor. Chem. Acc. 2001, 107, 48–55. [Google Scholar] [CrossRef]
  34. Slimani, A.; Yu, X.; Muraoka, A.; Boukheddaden, K.; Yamashita, K. Reparametrization approach of DFT functionals based on the equilibrium temperature of spin-crossover compounds. J. Phys. Chem. A 2014, 118, 9005–9012. [Google Scholar] [CrossRef] [PubMed]
  35. Giannozzi, P.; Baroni, S.; Bonini, N.; Calandra, M.; Car, R.; Cavazzoni, C.; Ceresoli, D.; Chiarotti, G.L.; Cococcioni, M.; Dabo, I.; et al. QUANTUM ESPRESSO: A modular and open-source software project for quantum simulations of materials. J. Phys.: Condens. Matter 2009, 21, 395502. [Google Scholar] [CrossRef] [PubMed]
  36. Timrov, I.; Andreussi, O.; Biancardi, A.; Marzari, N.; Baroni, S. Self-consistent continuum solvation for optical absorption of complex molecular systems in solution. J. Chem. Phys. 2015, 142, 034111. [Google Scholar] [CrossRef] [PubMed]
  37. ADF2013, SCM, Theoretical Chemistry, Vrije Universiteit, Amsterdam, The Netherlands. Available online: http://www.scm.com (accessed on 4 February 2016).
  38. Van Lenthe, E.; van Leeuwen, R.; Baerends, E.J.; Snijders, J.G. Relativistic regular two-component hamiltonians. Int. J. Quantum Chem. 1996, 57, 281–293. [Google Scholar] [CrossRef]

