Article

Mössbauer Research and Magnetic Properties of Dispersed Microspheres from High-Calcium Fly Ash

by
Elena V. Fomenko
1,*,
Yuriy V. Knyazev
2,
Galina V. Akimochkina
1,
Sergey V. Semenov
2,
Vladimir V. Yumashev
1,
Leonid A. Solovyov
1,
Natalia N. Anshits
1,
Oleg A. Bayukov
2 and
Alexander G. Anshits
1
1
Institute of Chemistry and Chemical Technology, Federal Research Center “Krasnoyarsk Science Center of the Siberian Branch of the Russian Academy of Sciences”, Akademgorodok 50/24, Krasnoyarsk 660036, Russia
2
Kirensky Institute of Physics, Federal Research Center “Krasnoyarsk Science Center of the Siberian Branch of the Russian Academy of Sciences”, Akademgorodok 50/24, Krasnoyarsk 660036, Russia
*
Author to whom correspondence should be addressed.
Magnetochemistry 2025, 11(9), 72; https://doi.org/10.3390/magnetochemistry11090072
Submission received: 26 July 2025 / Revised: 18 August 2025 / Accepted: 22 August 2025 / Published: 23 August 2025

Abstract

High-calcium fly ash (HCFA), produced from the lignite combustion, has emerged as a global concern due to its fine particle size and adverse environmental impacts. This study presents the characteristics of dispersed microspheres from HCFA obtained using modern techniques, such as XRD, SEM-EDS, 57Fe Mössbauer spectroscopy, DSC-TG, particle size analysis, and magnetic measurements. It is found that an increase in microsphere size is likely due to the growth of the silicate glass-like phase, while the magnetic crystalline phase content remains stable. According to the 57Fe Mössbauer spectroscopy, there are two substituted Ca-based ferrites—CaFe2O4 and Ca2Fe2O5 with a quite different magnetic behavior. Besides, the magnetic ordering temperature of the brownmillerite (Ca2Fe2O5) phase increases with the average diameter of the microspheres. FORC analysis reveals enhanced magnetic interactions as microsphere size increases, indicating an elevation in the concentration of magnetic microparticles, primarily on the microsphere surface, as supported by electron microscopy data. The discovered the magnetic crystallographic phases distribution on the microsphere’s surface claims the accessibility for further enrichment of the magnetically active particles and the possible application of fly ashes as a cheap source for magnetic materials synthesis.

1. Introduction

High-calcium fly ash (HCFA), also known as Class C fly ash, is a by-product of lignite combustion at thermal power plants. They contain large quantities of dispersed particles. The interest in dispersed particles sized <10 μm is driven by various factors. The first one is related to their harmful environmental impact. These particles, often of spherical shape, can be dissipated in the environment by wind and water, potentially affecting soil, water, and air quality [1,2]. Furthermore, they contain the products of thermochemical transformation of iron-bearing components with aluminosilicate minerals from the original coal, such as magnetite, maghemite, and metal ferrites [3]. These compounds are responsible for the magnetic properties of the finely dispersed components of fly ash, thus contributing to magnetic pollution of the environment and potentially interfering with natural magnetic fields [4,5]. Magnetic particles affect human health, causing respiratory issues, neurodegenerative diseases, and cardiovascular disorders [6,7,8]. For minimizing the environmental impact of fly ash, it is crucial to develop methods for its safe disposal and management.
The second reason behind the interest in finely dispersed particles is associated with the composition and properties of fly ash microspheres. It has been demonstrated that the narrow fractions of high-iron microspheres having constant composition and exhibiting reproducible magnetic properties, referred to as ferrospheres, can be employed as catalysts [9]. The use of ferrospheres as catalysts is due to the fact that they contain ferrospinel, hematite, and other magnetic iron-bearing phases. Calcium-rich ferrospheres were found to contain calcium ferrites [10].
In the MO–Fe2O3 system (where M stands for a metal ion having a 2+ charge), ferrites with the crystal-chemical formula (M)[Fe]2O4 and a spinel structure crystallizing in the cubic system (Fd3m space group) are formed at comparable ionic radii of M and Fe [11]. In this case, metal cations occupy both tetrahedral and octahedral oxygen coordination sites. If M is represented by cations with an ionic radius >1.0 Å (e.g., Ca, Ba, and Sr), ferrites crystallizing in the orthorhombic system (Pnam space group) are formed [12]. In these ferrites, iron occupies octahedral positions only, while alkaline earth metal cations are surrounded by nine-coordinate oxygen. Calcium ferrites are of particular interest. In particular, CaFe2O4 is widely used in various fields, including dye degradation, heavy metal ion removal, transesterification reaction, gas sensing, photocatalytic water splitting, and drug delivery. CaFe2O4 exhibits photocatalytic properties due to its narrow band gap (1.9 eV) and large surface area [13]. Calcium aluminoferrite (brownmillerite) plays a crucial role in Portland cement clinker, being responsible for its binding properties. It is formed as an intermediate phase and acts as a “reservoir” for many minor elements in the clinker. Most transition metals in cement exist within the ferrite phase [14].
It is almost impossible to produce stoichiometric calcium ferrite CaFe2O4 in the case of nonequilibrium content of reacting oxides and oxygen deficiency: conditions characterizing the coal combustion process; therefore, the brownmillerite phase Ca2Fe2O5 often appears in fly ashes from coal-fired power plants [10,15]. Since the magnetic ordering temperature of CaFe2O4 is TN ≈ 175 K [16], while ordering of Ca2Fe2O5 takes place at a much higher temperature (TN ≈ 670 K [17]), this difference in magnetic properties allows one to perform magnetic separation of these phases even at room temperature [18]. It can be used for removing impurities or designing functional materials based on waste produced by coal-fired power plants [19]. These two compounds are interrelated, and experimental findings have already demonstrated that CaFe2O4 and Ca2Fe2O5 can efficiently bind heavy metals during coal combustion by both physical and chemical adsorption [20].
In this context, characterizing dispersed fly ash particles is a relevant problem that needs to be solved for assessing the risks of anthropogenic impact on the environment caused by industrial coal combustion as well as for identifying promising applications of microspheres as functional materials exhibiting improved properties.

2. Materials and Methods

2.1. Materials

Fly ash obtained as a byproduct of combustion of B2-grade lignite mined at the Irsha-Borodinsky deposit of the Kansk–Achinsk coal basin was used as raw material to produce narrow fractions of dispersed microspheres with dav ≤ 2.5 µm.
The narrow-dispersed fractions were separated using the technological scheme involving several successive cycles of aerodynamic classification conducted on a 50 ATP centrifugal laboratory classifier (Hosokawa Alpine, Augsburg, Germany). The design and operating principle of the classifier, the separation process and operating parameters of the classifier were outlined in ref. [21].
Table 1 summarizes the bulk density, particle size distribution, and chemical composition of the narrow fractions of dispersed microspheres (FG178, FG179, and FG180). Bulk density increases with the average particle diameter for the series FG178 → FG179 → FG180. The analyzed microspheres are characterized by high calcium oxide (CaO) content compared to other oxides. The total content of SiO2 + Al2O3 + Fe2O3 + CaO + MgO is 84 wt %. Chemical analysis revealed significant sulfur content, ranging from 4.6 to 9.6 wt % (Table 1).
The phase composition of the studied narrow fractions of microspheres (Table 2) depends on mineral components of the original coal that had undergone thermochemical transformations upon high-temperature pulverized combustion. The content of the X-ray amorphous phase in the microspheres ranges from 40 to 47 wt %. The total content of crystallites of calcium compounds (calcium aluminoferrite (brownmillerite), tricalcium aluminate, calcium sulfate, calcium hydroxide, and smaller quantities of calcium carbonate and calcium oxide) is 40–50 wt %. Magnesium oxide was found at a smaller concentration. Minor quantities of quartz and ferrospinel were detected.

2.2. Characterization Methods

The macrocomponent composition was determined by chemical analysis in conformity with the Russian State Standard 5382-2019, with the standard errors in determination for the major components depending on their content, i.e., Sn = ±0.35 to ±0.60 for SiO2; ±0.30 to ±0.40 for Al2O3; ±0.15 to ±0.30 for Fe2O3; and ±0.04 to ±0.10 for Ca, Mg, Na, K, and Ti oxides [22].
The bulk density was determined using the measuring container method for three parallel measurements in accordance with the State Standard GOST 16190-70 [23], according to which the discrepancy between the results of these measurements should not exceed 1.5 abs % of their arithmetic mean.
The quantitative phase composition of the microspheres was determined using the X-ray powder diffraction (XRD) analysis with the full-profile Rietveld method [24] and the derivative difference minimization (DDM). The X-ray powder diffraction patterns were recorded in the reflection geometry on a PANalytical X’Pert PRO diffractometer (CoKα radiation) equipped with a PIXcel detector (PANalytical, Almelo, The Netherlands). The weight content of the X-ray amorphous component was determined by the external standard method with corundum used as the standard. The absorption coefficients of the samples for the CoKα radiation were calculated from the total elemental composition according to the chemical analysis data.
The globule morphology and surface structure of microspheres was investigated by scanning electron microscopy (SEM) on an ultra-high resolution Hitachi S-5500 microscope (High Technologies Corporation, Hitachi, Tokyo, Japan).
The elemental composition of individual globules was determined by SEM-EDS analysis on a TM-4000Plus scanning electron microscope (High Technologies Corporation, Hitachi, Tokyo, Japan) equipped with a Quantax 70 (Bruker Nano GmbH, Berlin, Germany) microanalysis system and an energy-dispersive X-ray spectrometer Bruker XFlash 430H (Bruker Corporation, Billerica, MA, USA) at 1000× magnification and accelerating voltage of 15 kV. Powder samples were fixed on Carbon Conductive double-coated tape (Ted Pella Inc., Altadena, CA, USA) attached to a flat polymethyl methacrylate substrate 30 mm in diameter and 1–3 mm thick (Duopur, Adler, Schwaz, Austria). A 20 nm platinum coating was deposited onto the sample surfaces using an Emitech K575XD Turbo Sputter Coater (Quorum Technologies Limited, Lewes, UK) to ensure conductivity. The data acquisition time was at least 300 s to enable quantitative spectrum processing. The contents of elements (Si, Al, Fe, Ca, Mg, K, Na, Ti, Mn, S) were determined for each globule, converted to oxide basis, and their sum was then normalized to 100%.
Simultaneous thermal analysis (TG-DSC) was conducted in a dynamic gas atmosphere (20%O2 + 80%Ar) with the total flow rate of 50 cm3 (normal thermodynamic conditions)/min; the mass change (TG, DTG), the heat flux (DSC), and the composition of gaseous products were recorded simultaneously using a Jupiter STA 449C instrument (Netzsch, Selb, Germany) coupled with an Aëolos QMS 403C mass spectrometer (Netzsch, Selb, Germany)). Samples (20.0 ± 0.1 mg) were heated in open Pt–Rh crucibles at a heating rate of 10 °C/min in the temperature range of 40–1100 °C. The raw thermogravimetric data (mass changes in the TG curves; onset, peak, and end temperatures in the DSC curve) were processed using the NETZSCH Proteus software (v.4.8.4).
The Mössbauer spectra of the samples were recorded using an MS-1104Em spectrometer (SFedU, Rostov-on-Don, Russia) at room temperature in the transmission geometry with a 57Co(Rh) radioactive source. Spectral analysis involved two stages. Potential nonequivalent positions of iron atoms in the samples were determined at the first stage by calculating the probability distribution of quadrupole splitting and hyperfine fields. A preliminary model spectrum of the sample was constructed according to the results obtained. At the second stage, the model spectra were fitted to the experimental data by varying the complete set of hyperfine parameters using the least squares method in the linear approximation.
Magnetic measurements were performed on a LakeShore 8604 vibrating sample magnetometer (LakeShore Cryotronics, Inc., Westerville, OH, USA) in the temperature range of 77–300 K in DC magnetic fields of 0–15,000 Oe. First-order reversal curve (FORC) measurements were carried out at 300 K in DC magnetic fields of 0–15,000 Oe with an increment of 50 Oe. The FORC diagrams were calculated using the open-source FORCsensei package, which is freely available from https://forcaist.github.io (accessed on 20 July 2025). The construction of FORC diagrams was described in detail in ref. [25].

3. Results

3.1. SEM-EDS Analysis of Narrow Fractions of Dispersed Microspheres

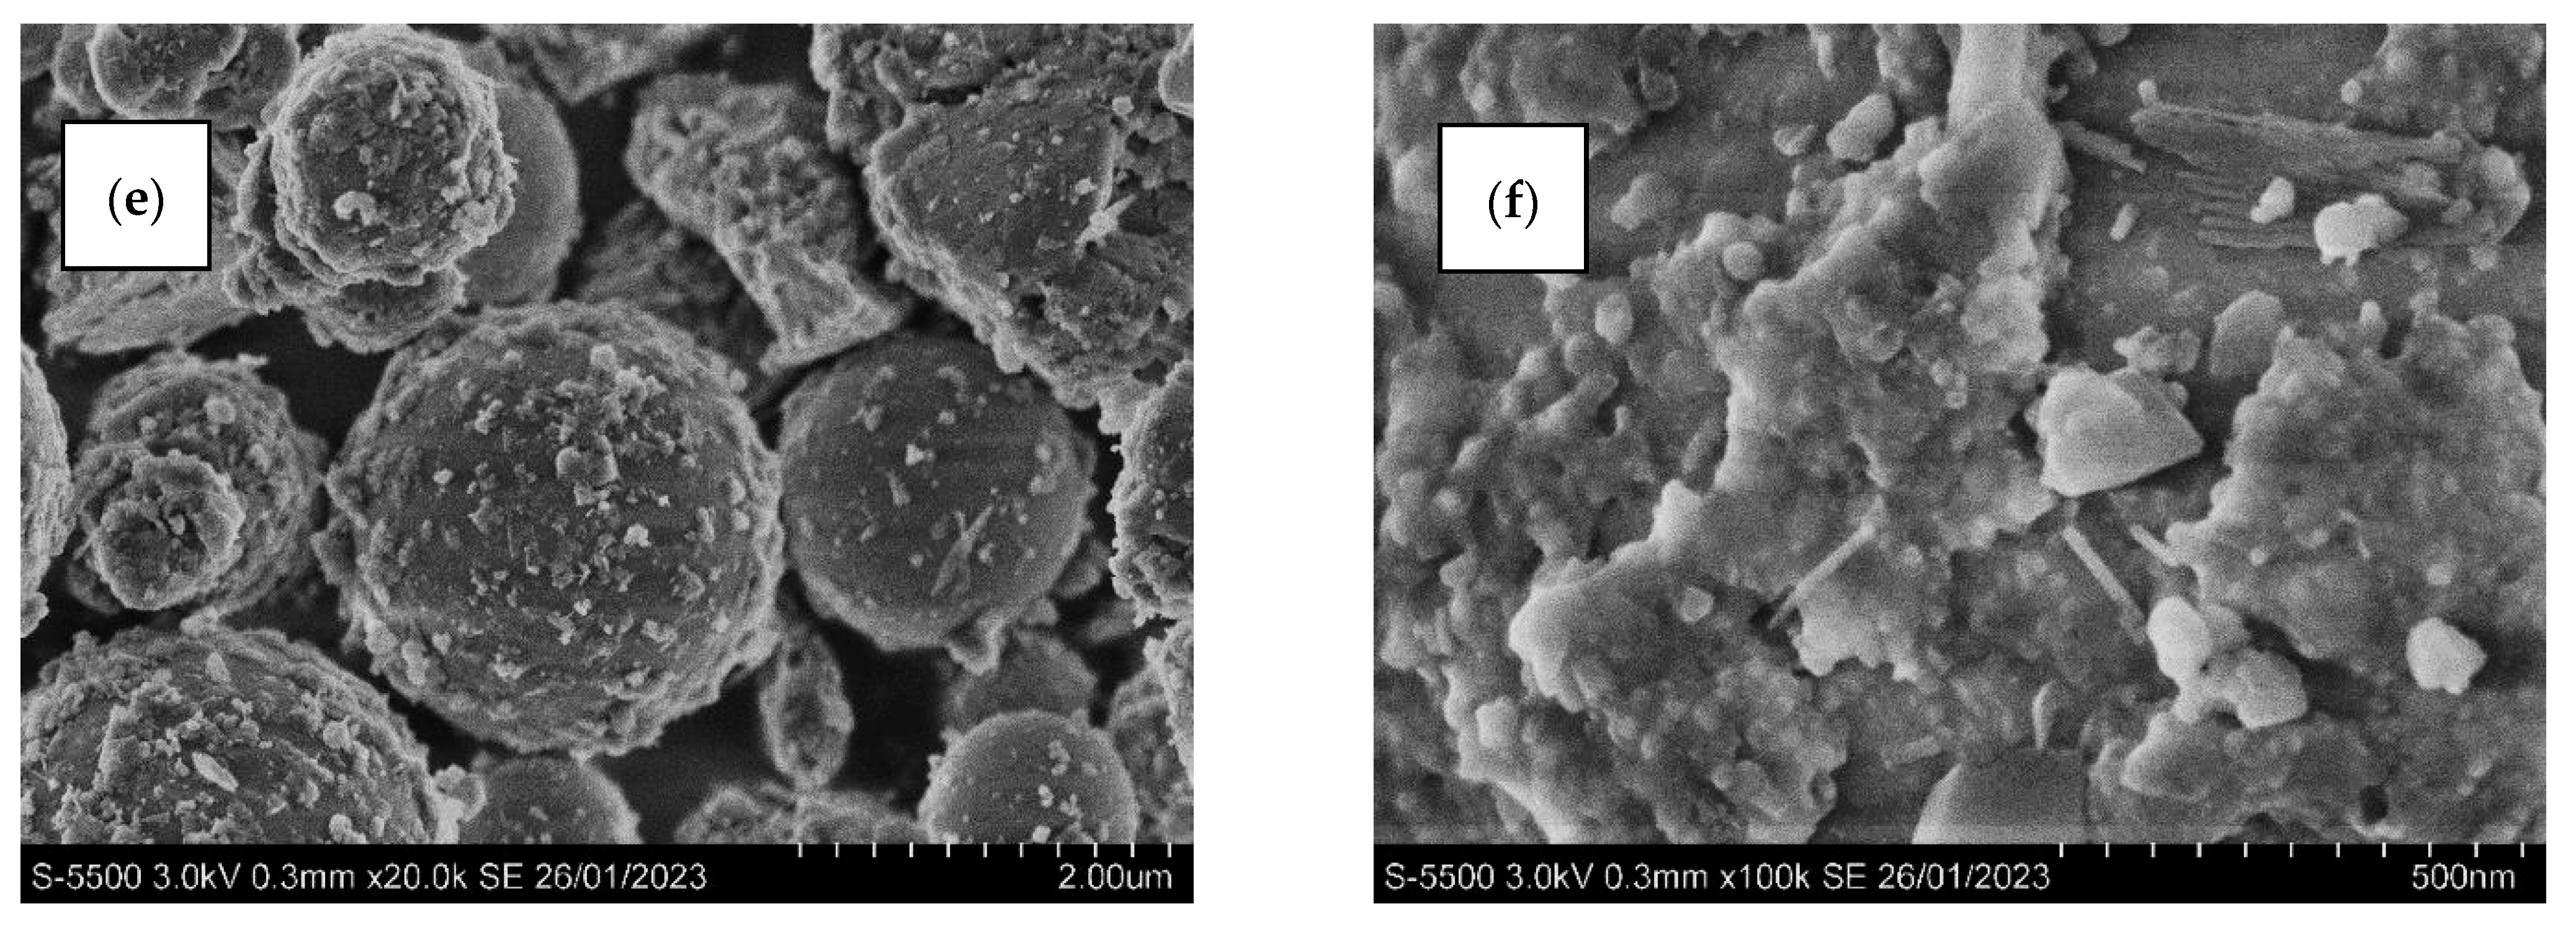
The surface structure of the dispersed microspheres was studied by scanning electron microscopy. The recorded images of the microsphere samples and their surfaces are shown in Figure 1. Dispersed ash particles consist of well-formed spheres with adsorbed or protruding small nano- and submicron-sized crystalline particles on their surfaces. As the average size of the microsphere fraction increases, the sphere surface becomes enriched in these particles, with the size of surface crystallites increasing simultaneously. Meanwhile, small-sized nanoparticles are also observed on the microsphere surface along with relatively large crystallites.
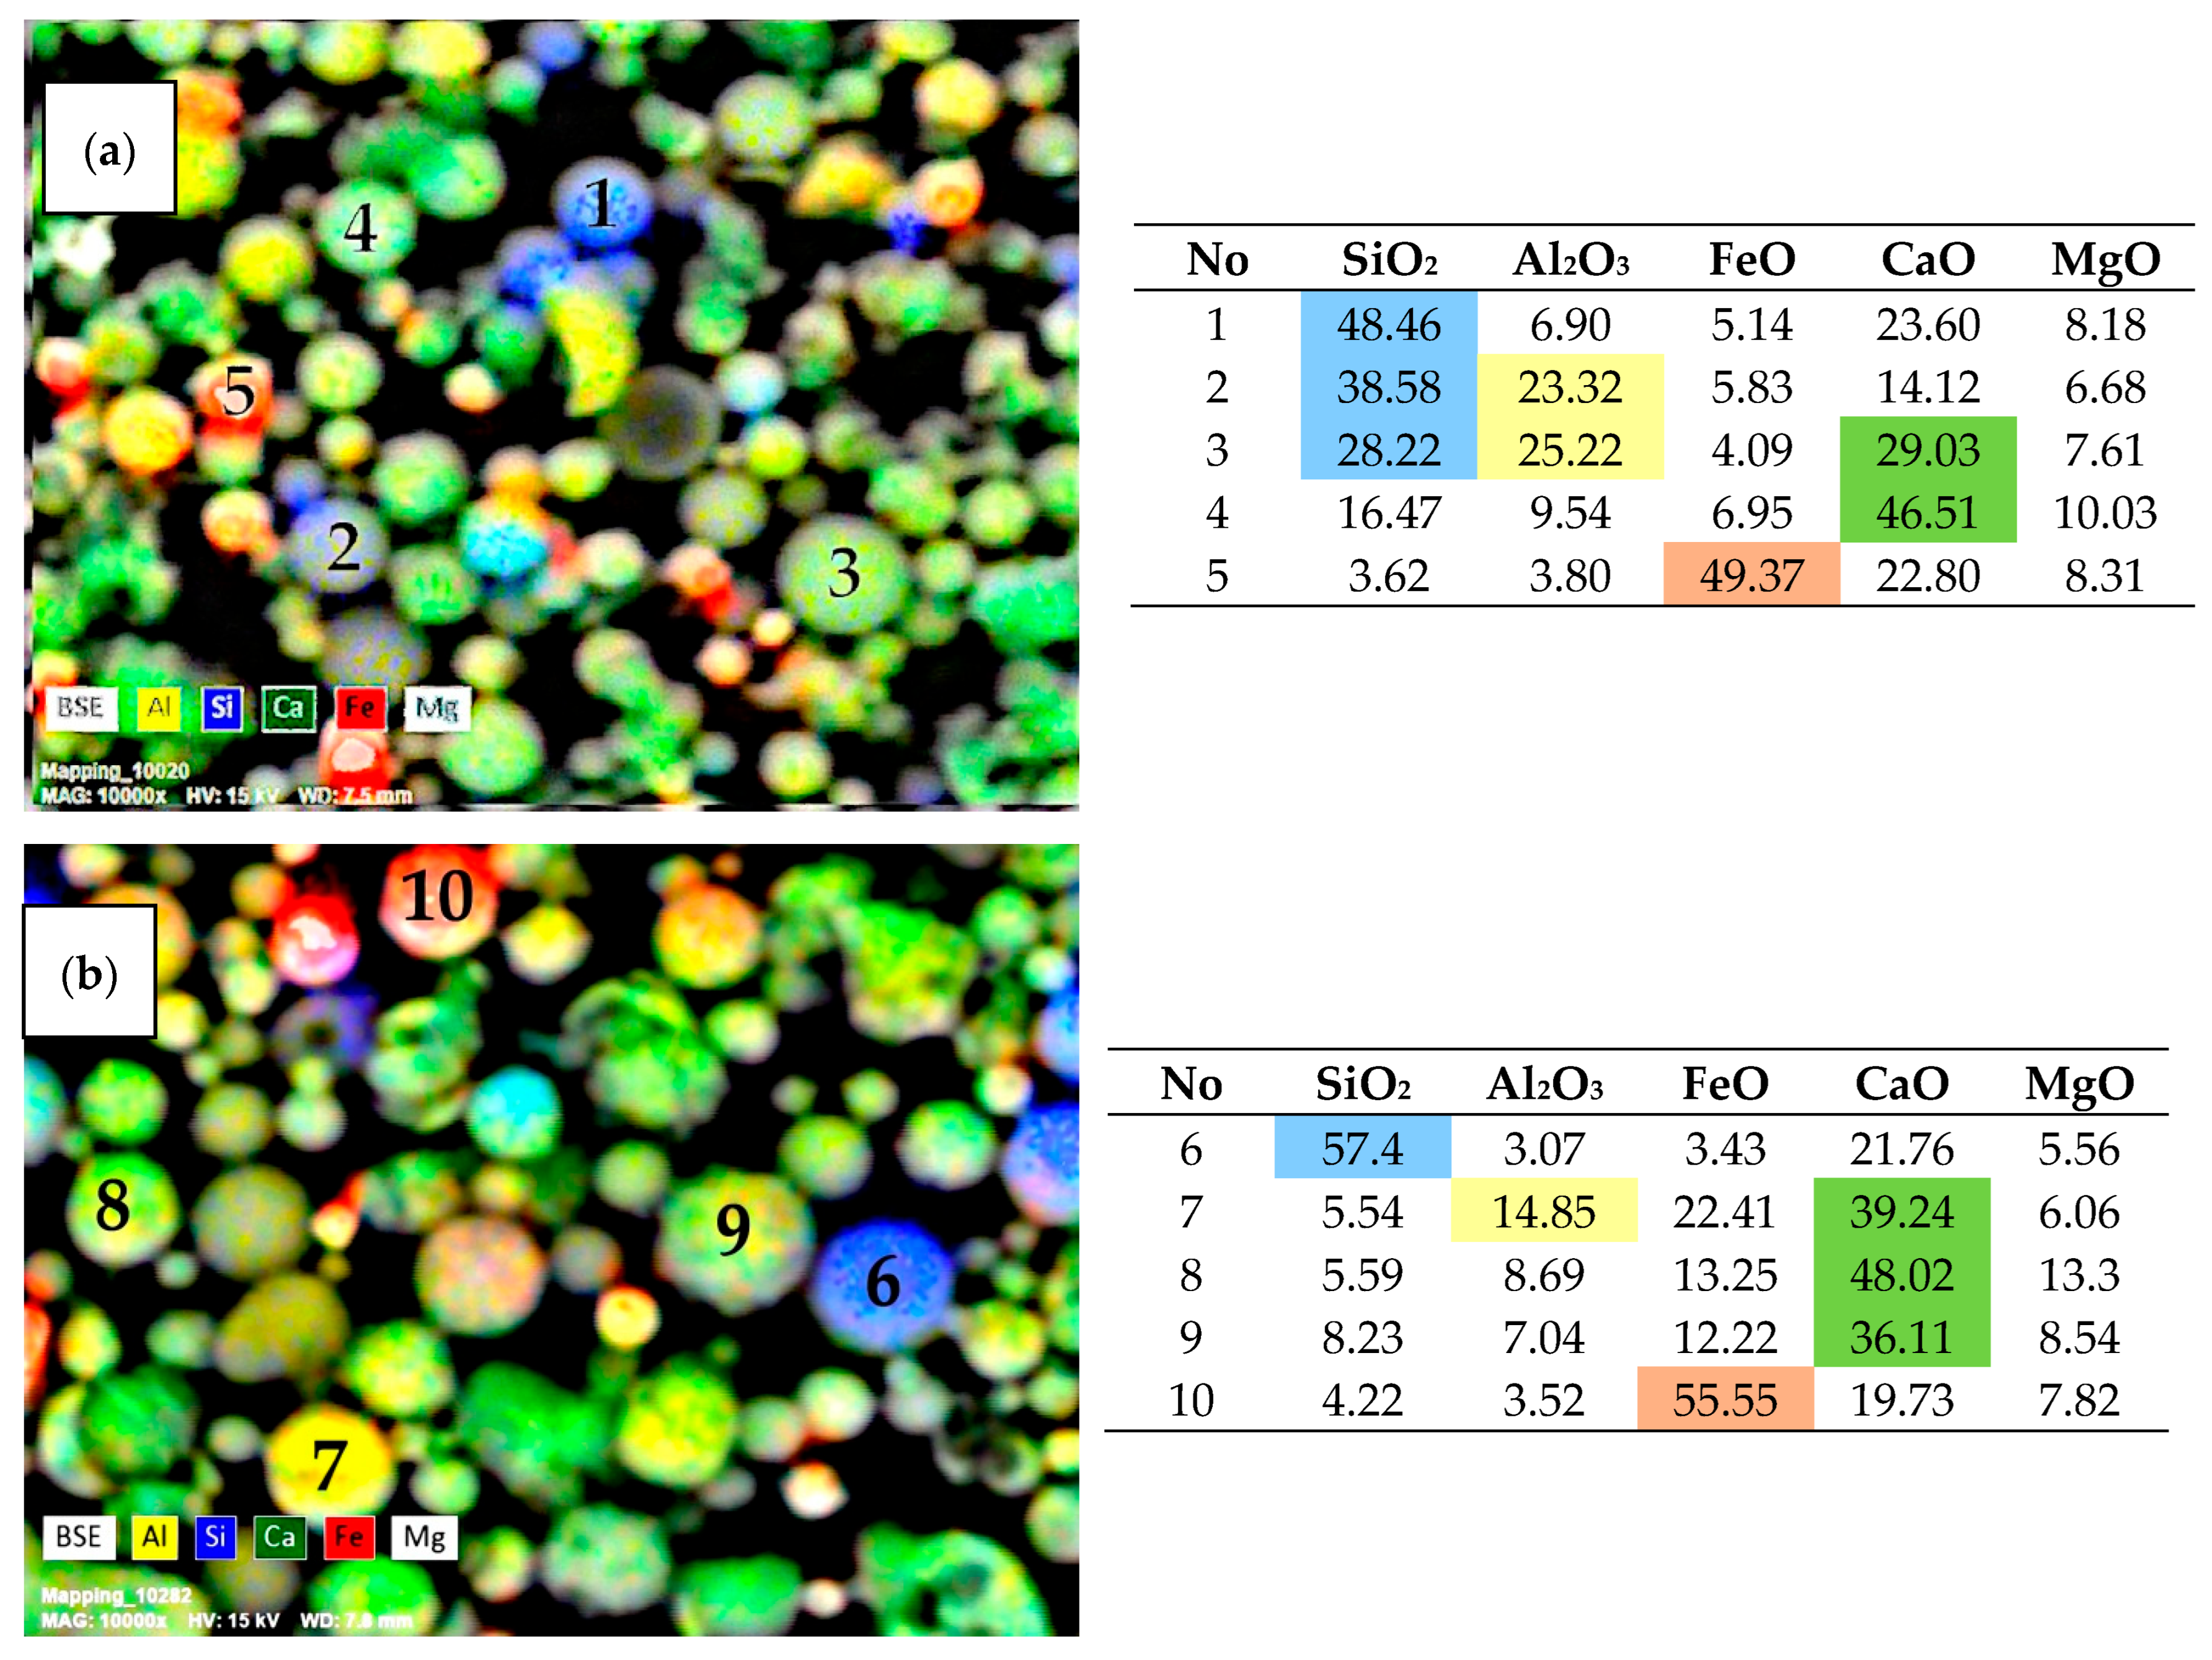
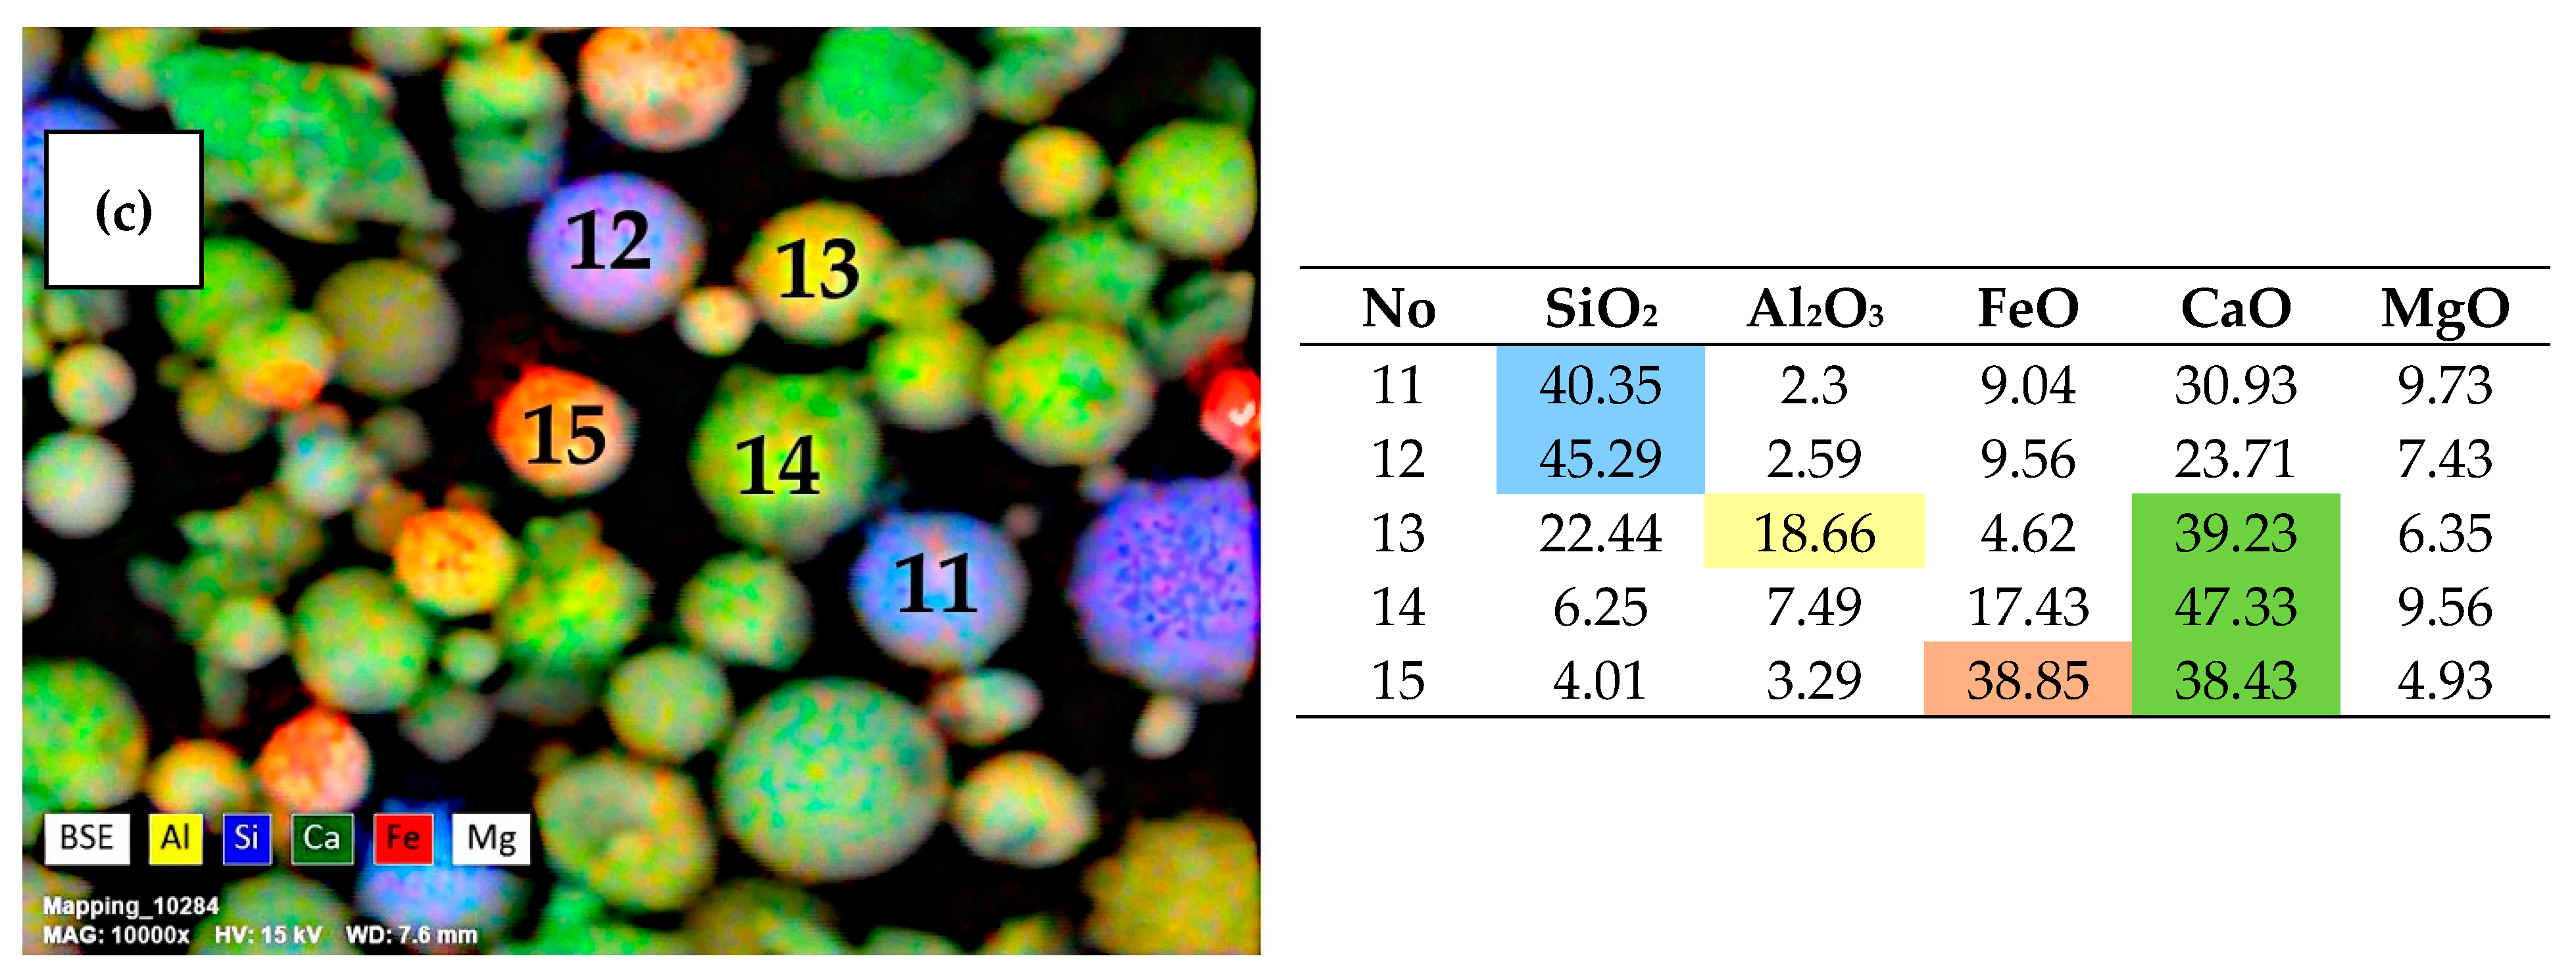
SEM-EDS was employed for systematic investigation of the chemical composition of individual microspheres of the three studied fractions with dav ≤ 2.5 µm. Figure 2 shows the SEM images of the investigated fraction in the elemental mapping mode. A total of 650 microspheres were analyzed. The study revealed that dispersed particles constitute a complex multicomponent system containing compounds of the following elements: Ca, Si, Al, Fe, Mg, S, Na, K, Ti, and O. Oxides CaO, SiO2, Al2O3, Fe2O3, and MgO were the key macrocomponents.
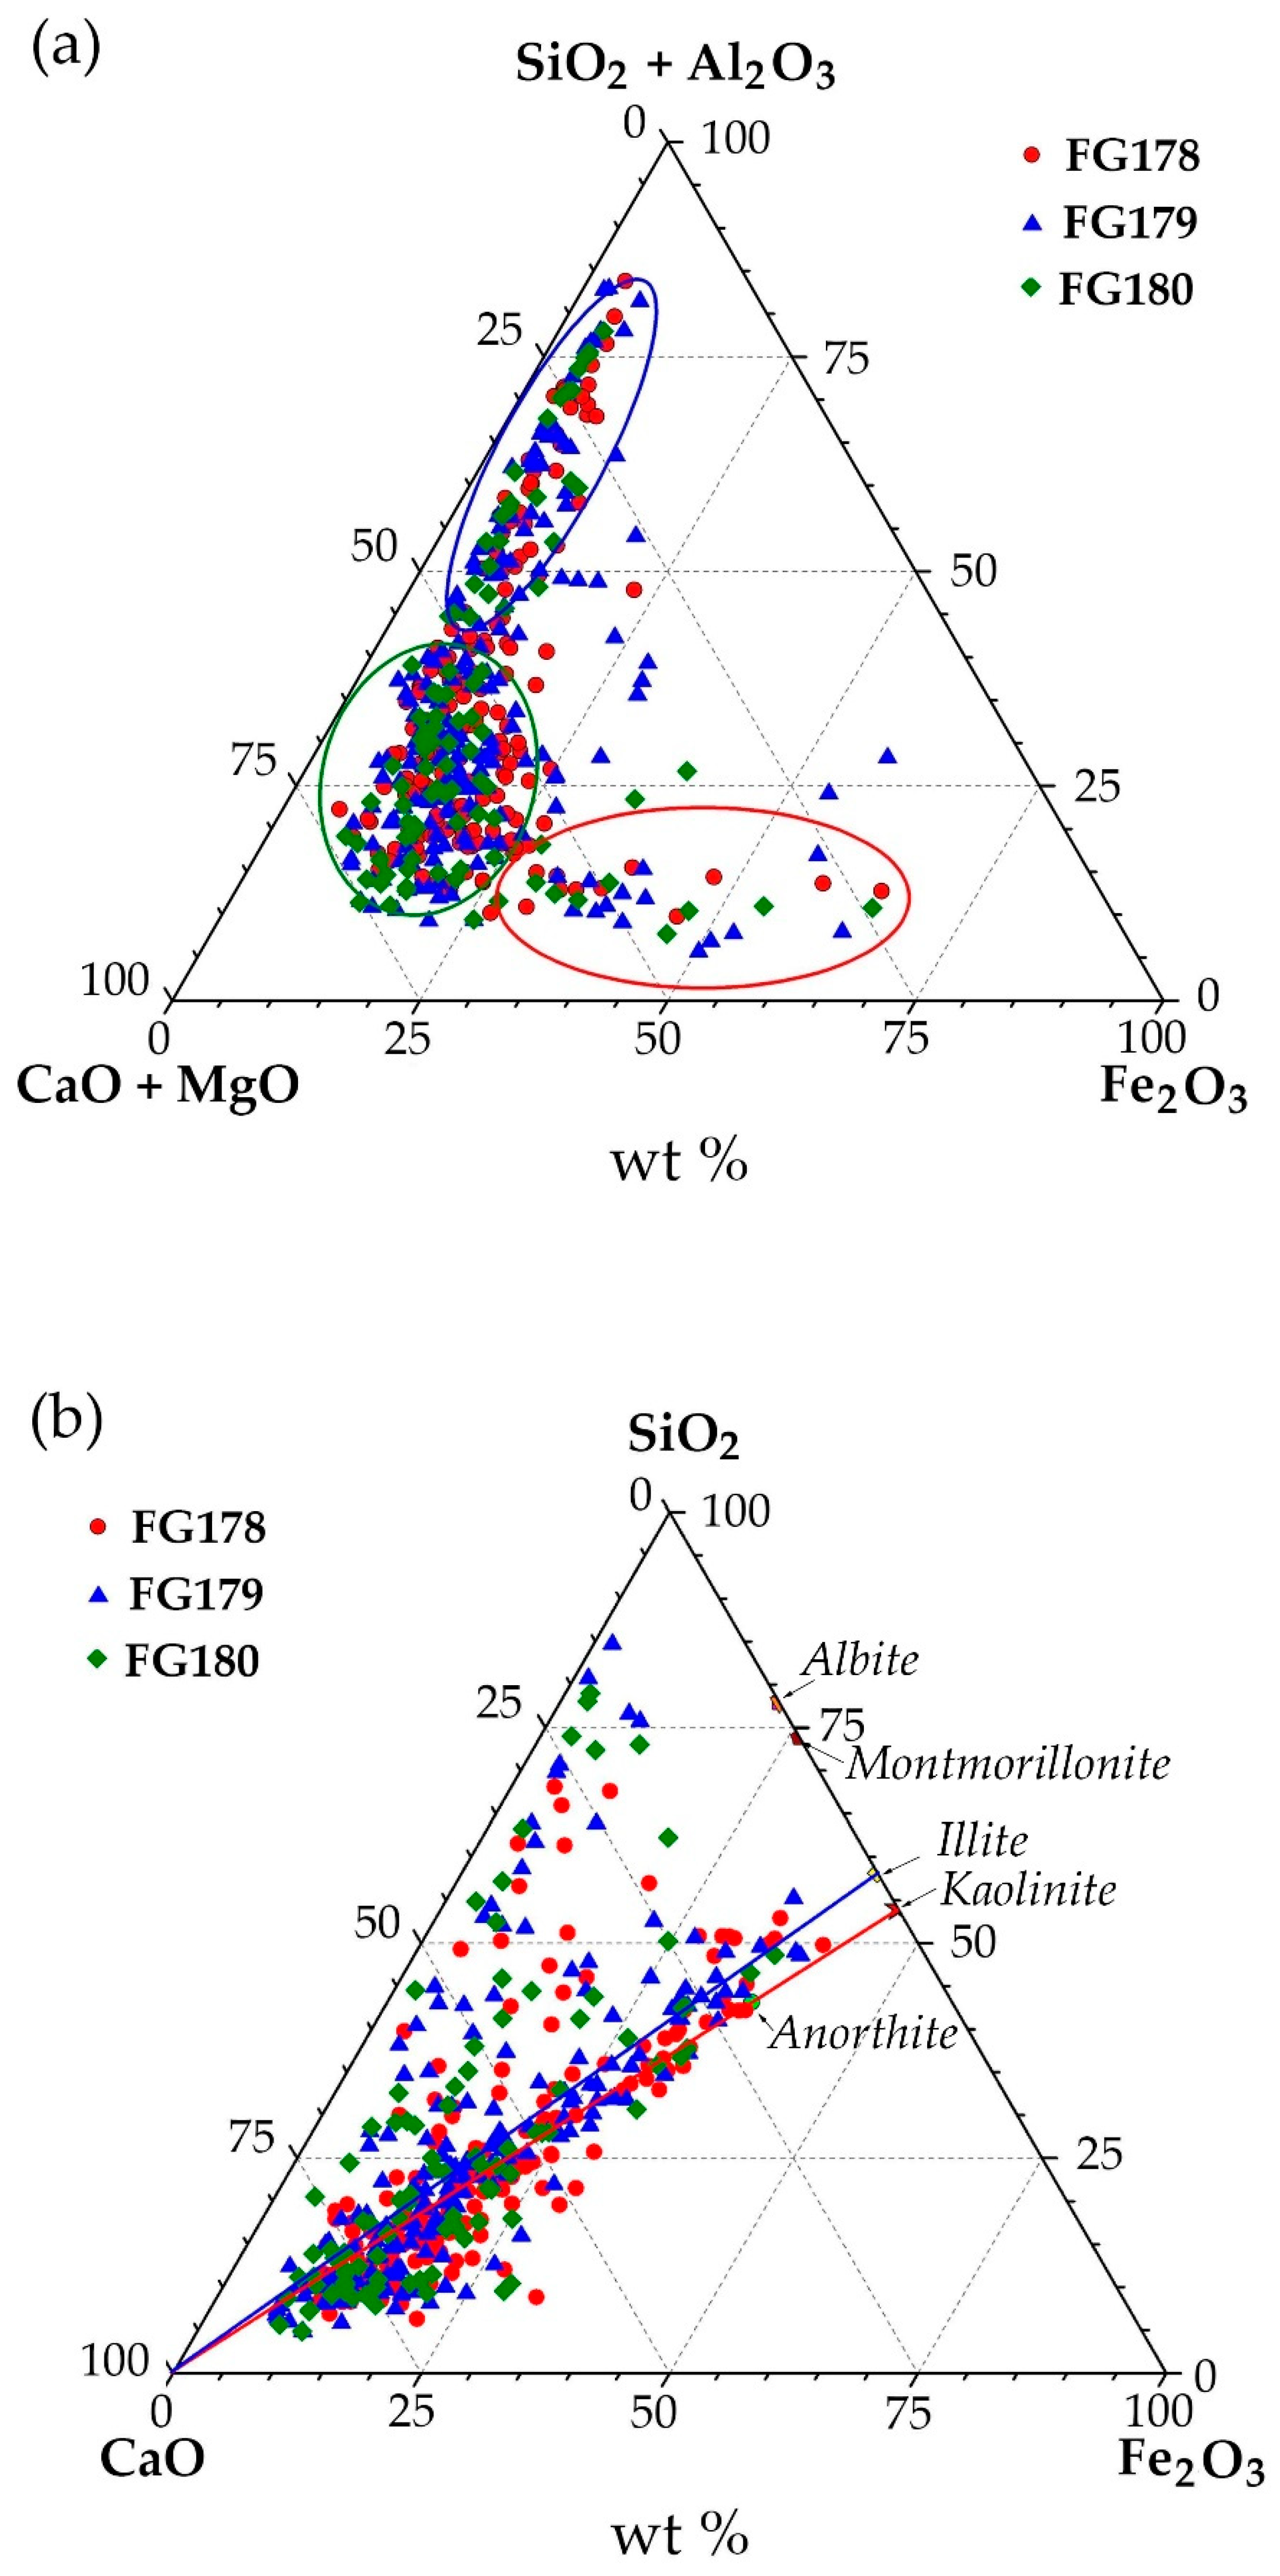
Three groups of microspheres can be differentiated based on chemical composition analysis (Figure 3a):
  • Group 1 (shown in green) contains microspheres where CaO content is >40 wt % and the total content of SiO2 and Al2O3 is ≤35 wt %. Approximately 2/3 of investigated particles meet these composition criteria.
  • Group 2 (shown in blue) consists of microspheres with elevated SiO2 and Al2O3 contents: the total content of these oxides in globules increases significantly (from 40 to 75 wt %), which is typical of 1/3 of all microspheres.
  • Group 3 (shown in red) contains microspheres with high FeO content (from 30 to 60 wt %), which is typical of only 3% of the investigated globules.
Figure 3b shows the ternary plot of compositions of dispersed particles in the SiO2–Al2O3–CaO coordinates. Mineral precursors of the investigated microspheres formed during lignite combustion are feldspars (in particular, anorthite) and complex Ca, Mg, Fe-humates. During lignite combustion, the feldspars melt to form a vitreous phase, while the organically bound Ca, Mg, and Fe give rise to highly reactive oxides as primary products upon oxidation of humates. These oxides readily interact with each other and with SiO2, becoming incorporated into aluminosilicate glass to form complex compounds. It has been demonstrated that the majority of individual microsphere compositions lie within the compositional range of anorthite, kaolinite, and illite, the principal mineral precursors of fly ash particles produced upon lignite combustion [26].

3.2. DSC-TG-DTG Analysis of the Narrow Fractions of Dispersed Microspheres

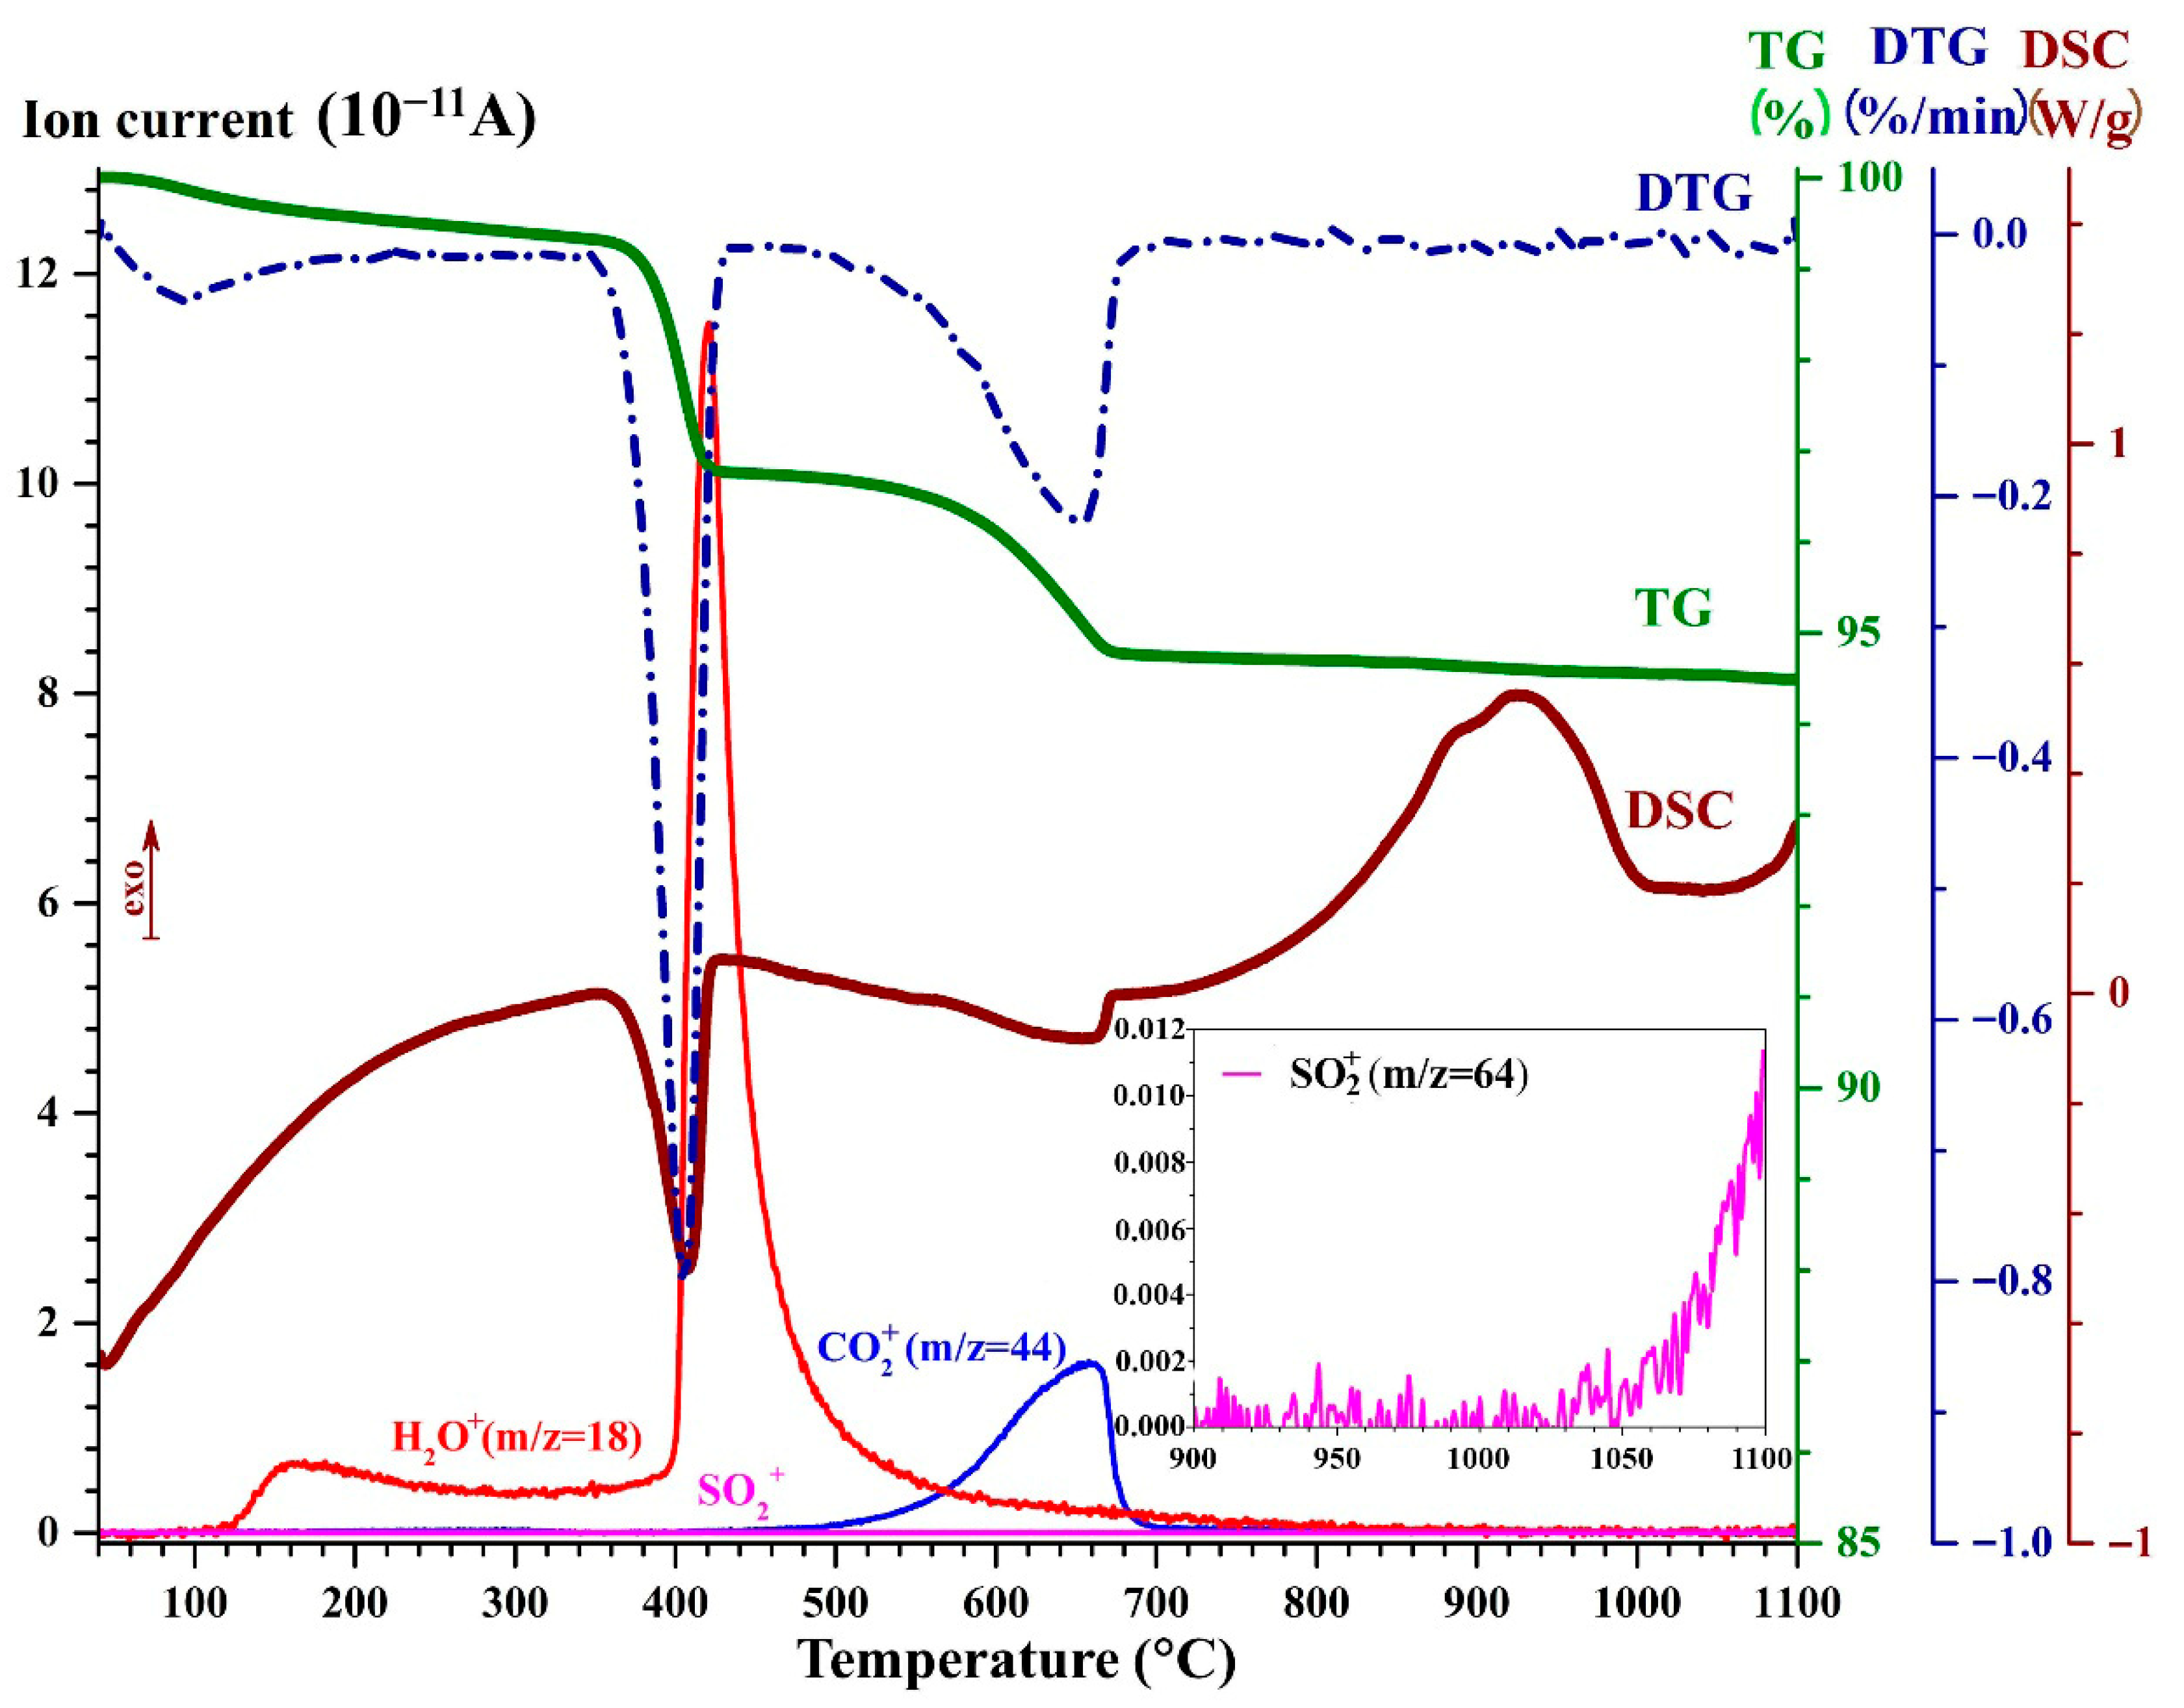
Detailed analysis of the narrow-fraction samples of high-calcium ash (FG178, FG179, and FG180) was conducted by synchronous thermal analysis. The DSC, TG, and DTG curves of molecular ions H2O+, CO2+, and SO2+ are shown in Figure 4 as an example for the FG179 sample.
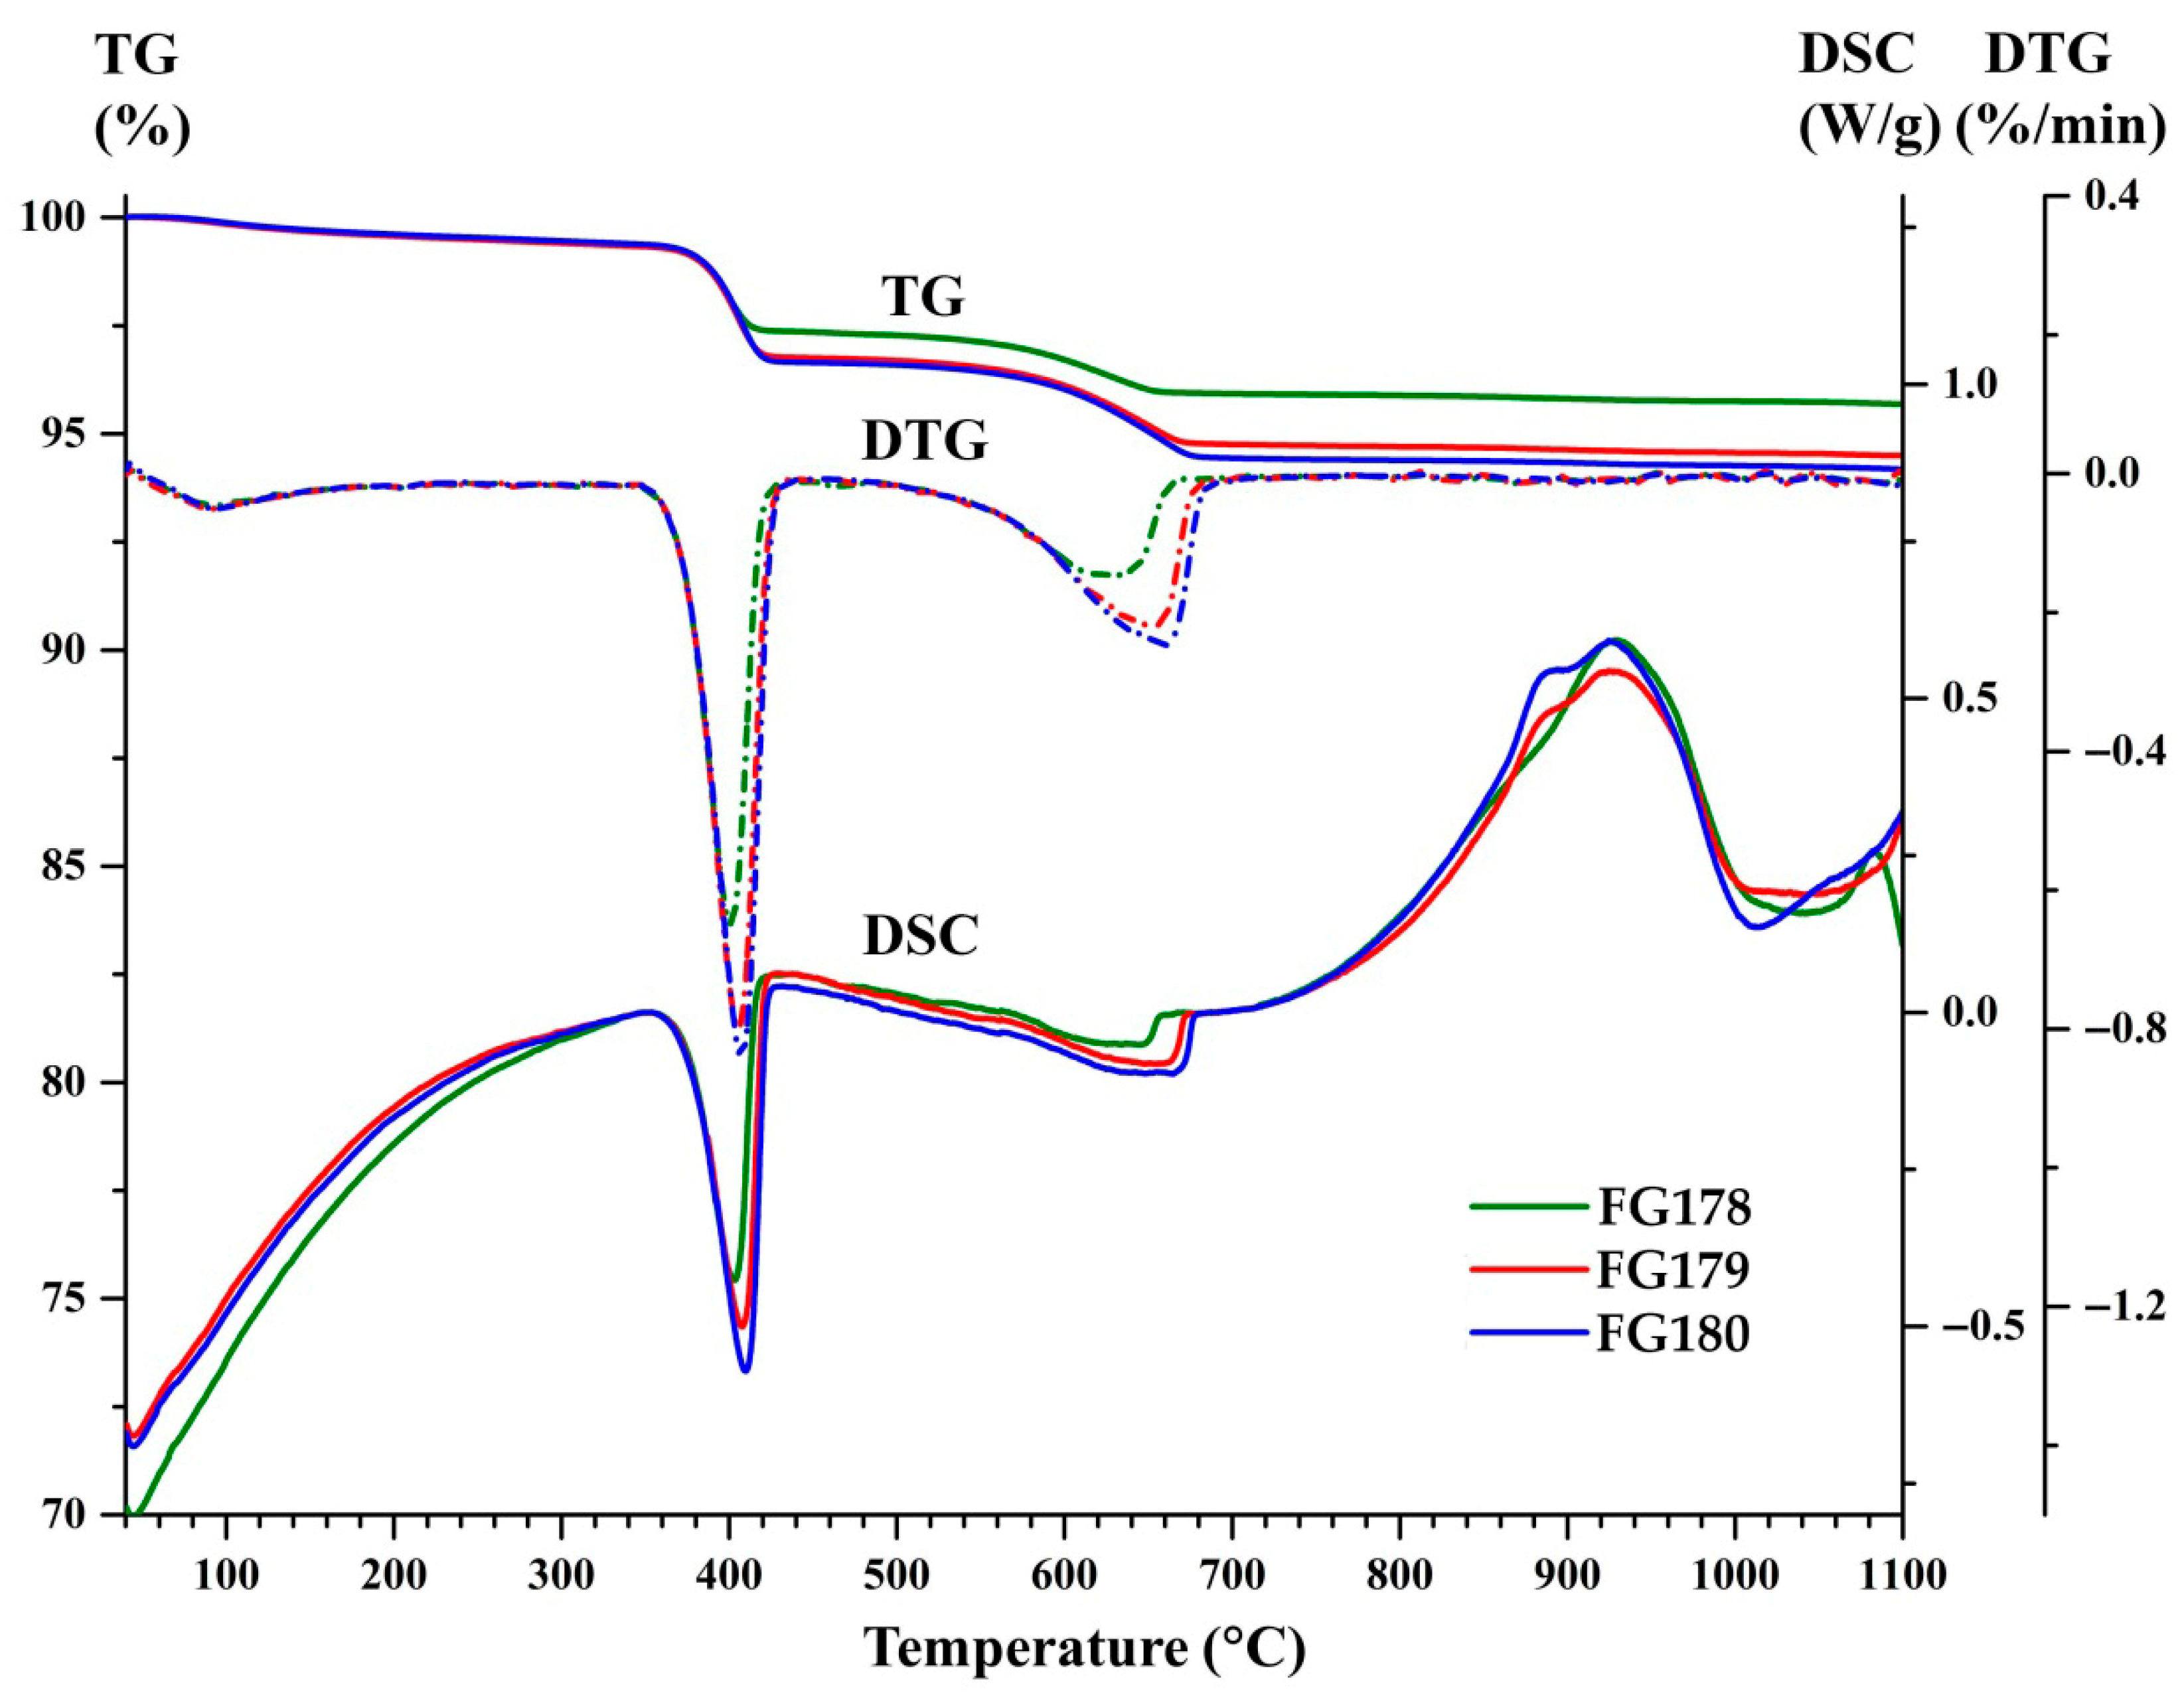
It has been demonstrated that at least four solid-phase processes take place for all the analyzed FG series samples (Table 3, Figure 5):
  • dehydration in the temperature range of 40–244 °C, mainly due to thermal desorption of hygroscopic moisture, being accompanied by mass loss (0.46–0.50 wt.%) and an endothermic effect with maxima at 95 °C;
  • dissociation of Ca(OH)2 in the temperature range of 244–437 °C being accompanied by mass loss (2.17–2.89 wt %) and an endothermic effect with maxima at 403–410 °C;
  • dissociation of calcium carbonate (or solid solutions based on it with the net formula Ca(1−x−y)MgxFeyCO3) in the temperature range of 437–810 °C, being accompanied by mass loss (1.48–2.27 wt %) and an endothermic effect as a bimodal peak with the global maxima in the temperature range of 644–664 °C and local maxima, in the temperature range of 623–630 °C;
  • crystallization of a new phase/phases (presumedly, wollastonite and/or pseudowollastonite with the net formula CaSiO3) in the temperature range of 810–1100 °C, being accompanied by exothermic effects as a bimodal peak with the global maxima in the temperature range of 930–935 °C and local maxima, in the temperature range of 854–886 °C.
We would like to specifically mention the feature of complex exothermic peaks corresponding to crystallization of a new phase (presumedly, CaSiO3) in the temperature range of 810–1100 °C: the contribution of the low-temperature component (with maxima at 854–886 °C) correlates with the total mass loss caused by decomposition of calcium hydroxide and carbonate (technically, with the amount of newly formed CaO that enters the solid-phase reaction with the aluminosilicate component of the sample. The key component of the complex peak with the global maximum at 925–930 °C is most likely to be caused by high-temperature devitrification of the calcium-containing aluminosilicate component of the sample. The negligible mass loss in the specified temperature range (0.20–0.21 wt %) is related to continuous emission of CO2, and, for the FG178 sample at T > 1050 °C, additionally to SO2.
Furthermore, two processes overlap in the DSC curve of the FG178 sample at T > 1050 °C: the exothermic peak of crystallization of another phase (presumedly, anorthite CaO·Al2O3·2SiO2) and the start of the second crystallization peak (an exothermic effect), which is overlapped with endothermic decomposition of CaSO4 accompanied by release of SO2+ (a molecular ion with m/z = 64).
The exothermic effect in the temperature range of 700–1050 °C corresponds to devitrification of a vitreous phase with the CaO/SiO2 molar ratio = 0.94, resulting in the formation of crystals of a new phase, presumably wollastonite (CaSiO3, CaO/SiO2 molar ratio = 1). This process is characterized by distinct maxima at 885 °C and 925 °C (Figure 3). According to the published data [27], crystallization of wollastonite (CaCO3) from coal combustion ash samples manifests itself as a complex DSC exothermic peak with two maxima in the temperature ranges of 823–870 °C and 903–926 °C. In another study [28], wollastonite crystallization was observed in the temperature range of 847–938 °C. A hypothesis can be put forward that the formation of the wollastonite phase is an intermediate stage upon high-temperature formation of phases such as larnite (Ca2SiO4) and other calcium silicates/aluminosilicates, which most commonly have the formula CaAl2Si2O8.

3.3. 57Fe Mössbauer Spectroscopy

The local atomic structure of magnetic microsphere samples was studied by Mössbauer spectroscopy. The 57Fe Mössbauer spectra of these samples were recorded at room temperature in the transmission geometry on an MS-1104Em spectrometer and are presented in Figure 6.
Since the samples constitute a complex system with low iron content but high content of iron-bearing and substituted compounds, it becomes especially challenging to identify their phase compositions. Nevertheless, we have successfully identified the key iron-bearing components in the microspheres by using a combination of 57Fe Mössbauer spectroscopy and X-ray diffraction analysis data. The 57Fe Mössbauer hyperfine parameters are summarized in Table 4, with all the values referenced to α-Fe.
The study demonstrates that the investigated microsphere samples contain iron atoms in both magnetically ordered and paramagnetic states. As for the paramagnetic component, the Mössbauer parameters obtained from spectral analysis can be interpreted as a mixture of two calcium ferrites and Ca2Fe2O5 (brownmillerite) with a significant degree of cationic substitution by diamagnetic cations as revealed by chemical analysis of the microspheres. Ca2Fe2O5 is characterized by two nonequivalent positions (octahedral and tetrahedral ones, having significantly different degrees of local distortion). However, the spectrum contains only octahedral states, which can be attributed to the high substitution rate. A 57Fe Mössbauer spectroscopy study of aluminum substitution for iron in brownmillerite demonstrated that substitution occurs predominantly at tetrahedral positions [29]. This observation is consistent with the situation observed for the samples in this study.
Furthermore, substitutions in the Ca2Fe2O5 structure affect the magnetic ordering temperature, which is 725 K for pure Ca2Fe2O5 [30,31]. Magnetic ordering temperature is significantly reduced for the high degree of substitution with diamagnetic cations (Al/Fe > 1.0); as a result, the compound can exhibit paramagnetic behavior at 300 K [30,32]. Importantly, a structural transition from the Pnma space group to the I2bm space group takes place at a concentration x(Al) > 0.6 [32,33,34]. This transition was also observed upon heating of unsubstituted brownmillerite above 1000 K. However, the structural transition was reversible in this case: cooling of the sample led to transition back to the Pnma space group [32].
Another ferrite, CaFe2O4, also has two nonequivalent positions of iron with octahedral environment, which are identically represented in the crystal structure and differ by the degree of local distortions [35,36]. Meanwhile, nonuniform occupational density of these positions is often observed for it, especially for short annealing duration [35], which is typical of coal burning conditions. Therefore, taking into account the insufficient quality of recorded spectra, we observed only one quadrupole doublet.
The magnetic components of the spectra exhibit broadened sextet lines, proving the significant inhomogeneity in the near-range environment of iron and resulting in wide distribution of hyperfine fields. This phenomenon can be attributed to substitution with such atoms as Mg and Al. Generally speaking, the hyperfine parameters of the magnetic spectral components correspond to iron states in the Ca2Fe2O5 structure with varying degrees of substitution [29,32]. All samples were found to display a sextet with a substantially reduced hyperfine field (<300 kOe), which correspond to tetrahedrally coordinated iron according to the isomeric shift value [37] and evidently features significant degree of substitution with aluminum. Two additional sextets with larger hyperfine fields, as judged from their chemical shift values, can be assigned to octahedral sites in Ca2Fe2O5.
Hence, the samples are a complex system of iron-bearing crystal phases characterized by a high substitution degree and significant nonstoichiometry. The high substitution degree leads to formation of distorted local crystallographic (the paramagnetic portion of the spectra), nonequivalent magnetic (the magnetic portion of the spectra) environment of iron in microspheres and partial loss of magnetic ordering in the Ca2Fe2O5 structure.

3.4. Magnetization Measurements

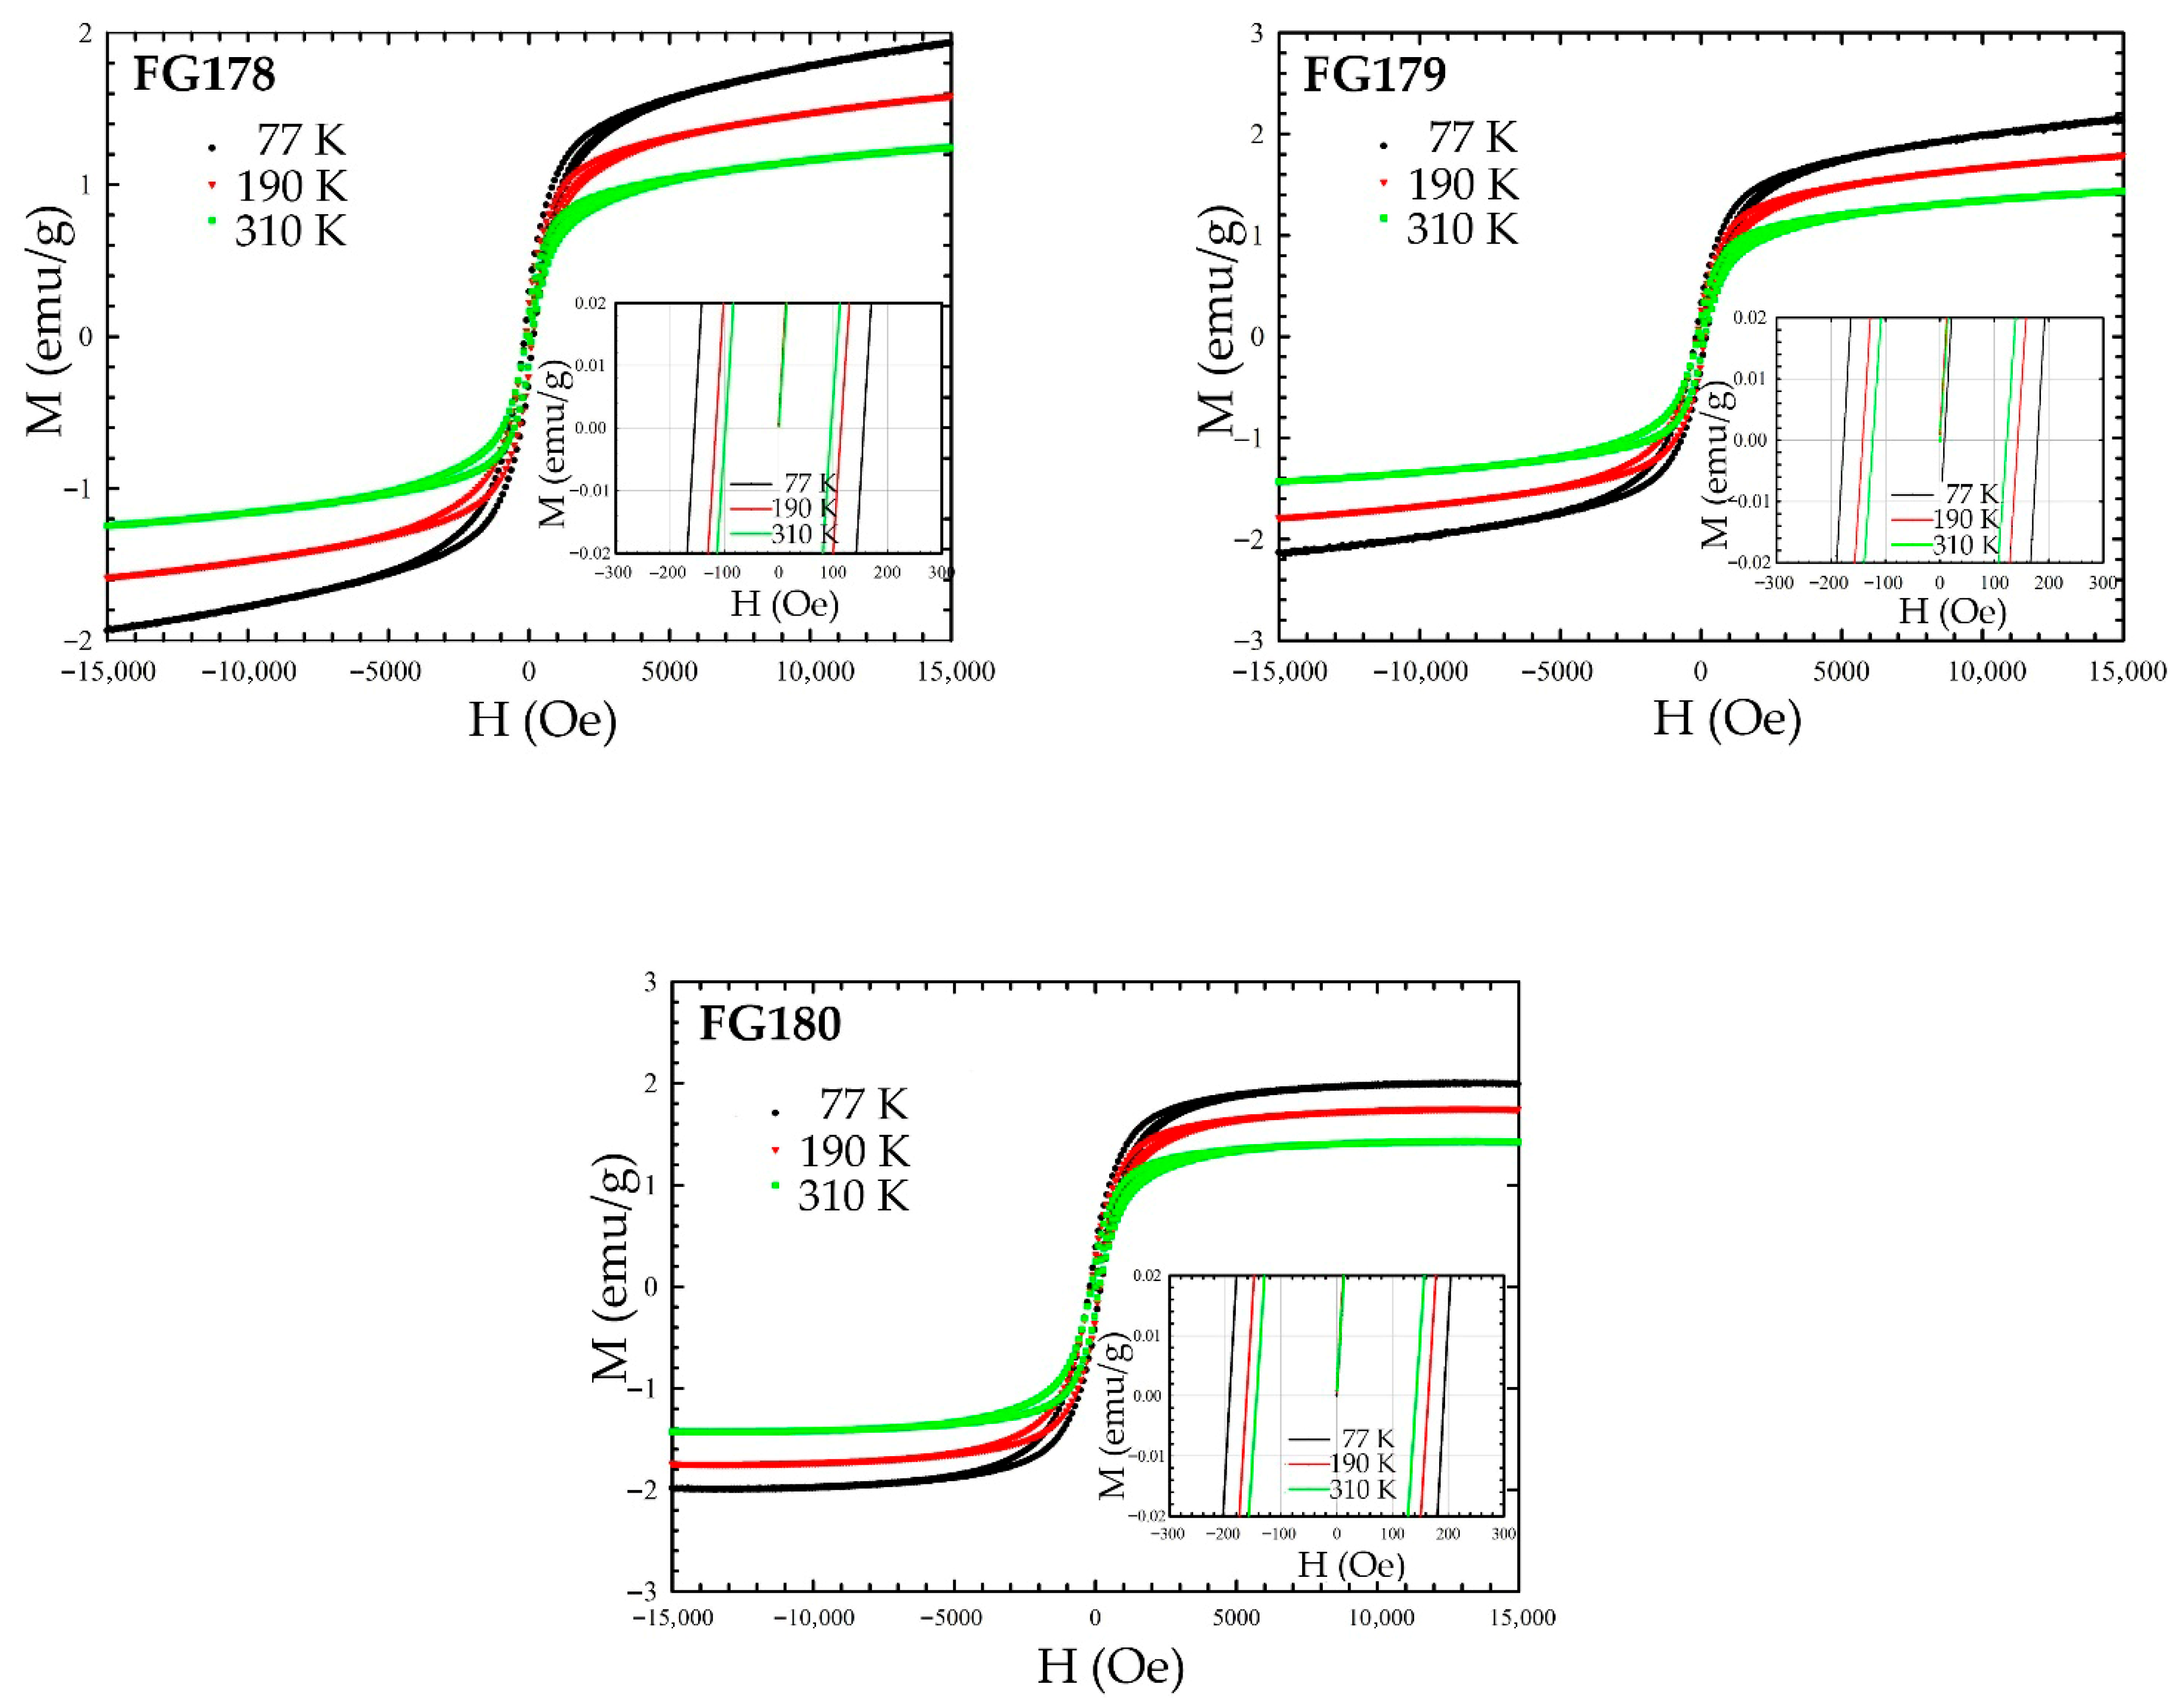
Figure 7 shows the field dependences of magnetization. All the samples are found to make multiple contributions to the hysteresis loop. The nonzero coercive field observed for all the samples indicates that they contain a magnetically ordered phase. Meanwhile, the noticeable slope in the high-field region is responsible for the paramagnetic contribution to the field dependence of magnetization. In general, the magnetic measurements support the Mössbauer spectroscopy data. The analysis of different magnetic contributions was conducted using the temperature dependences of coercive field, remanence magnetization, and saturation magnetization.
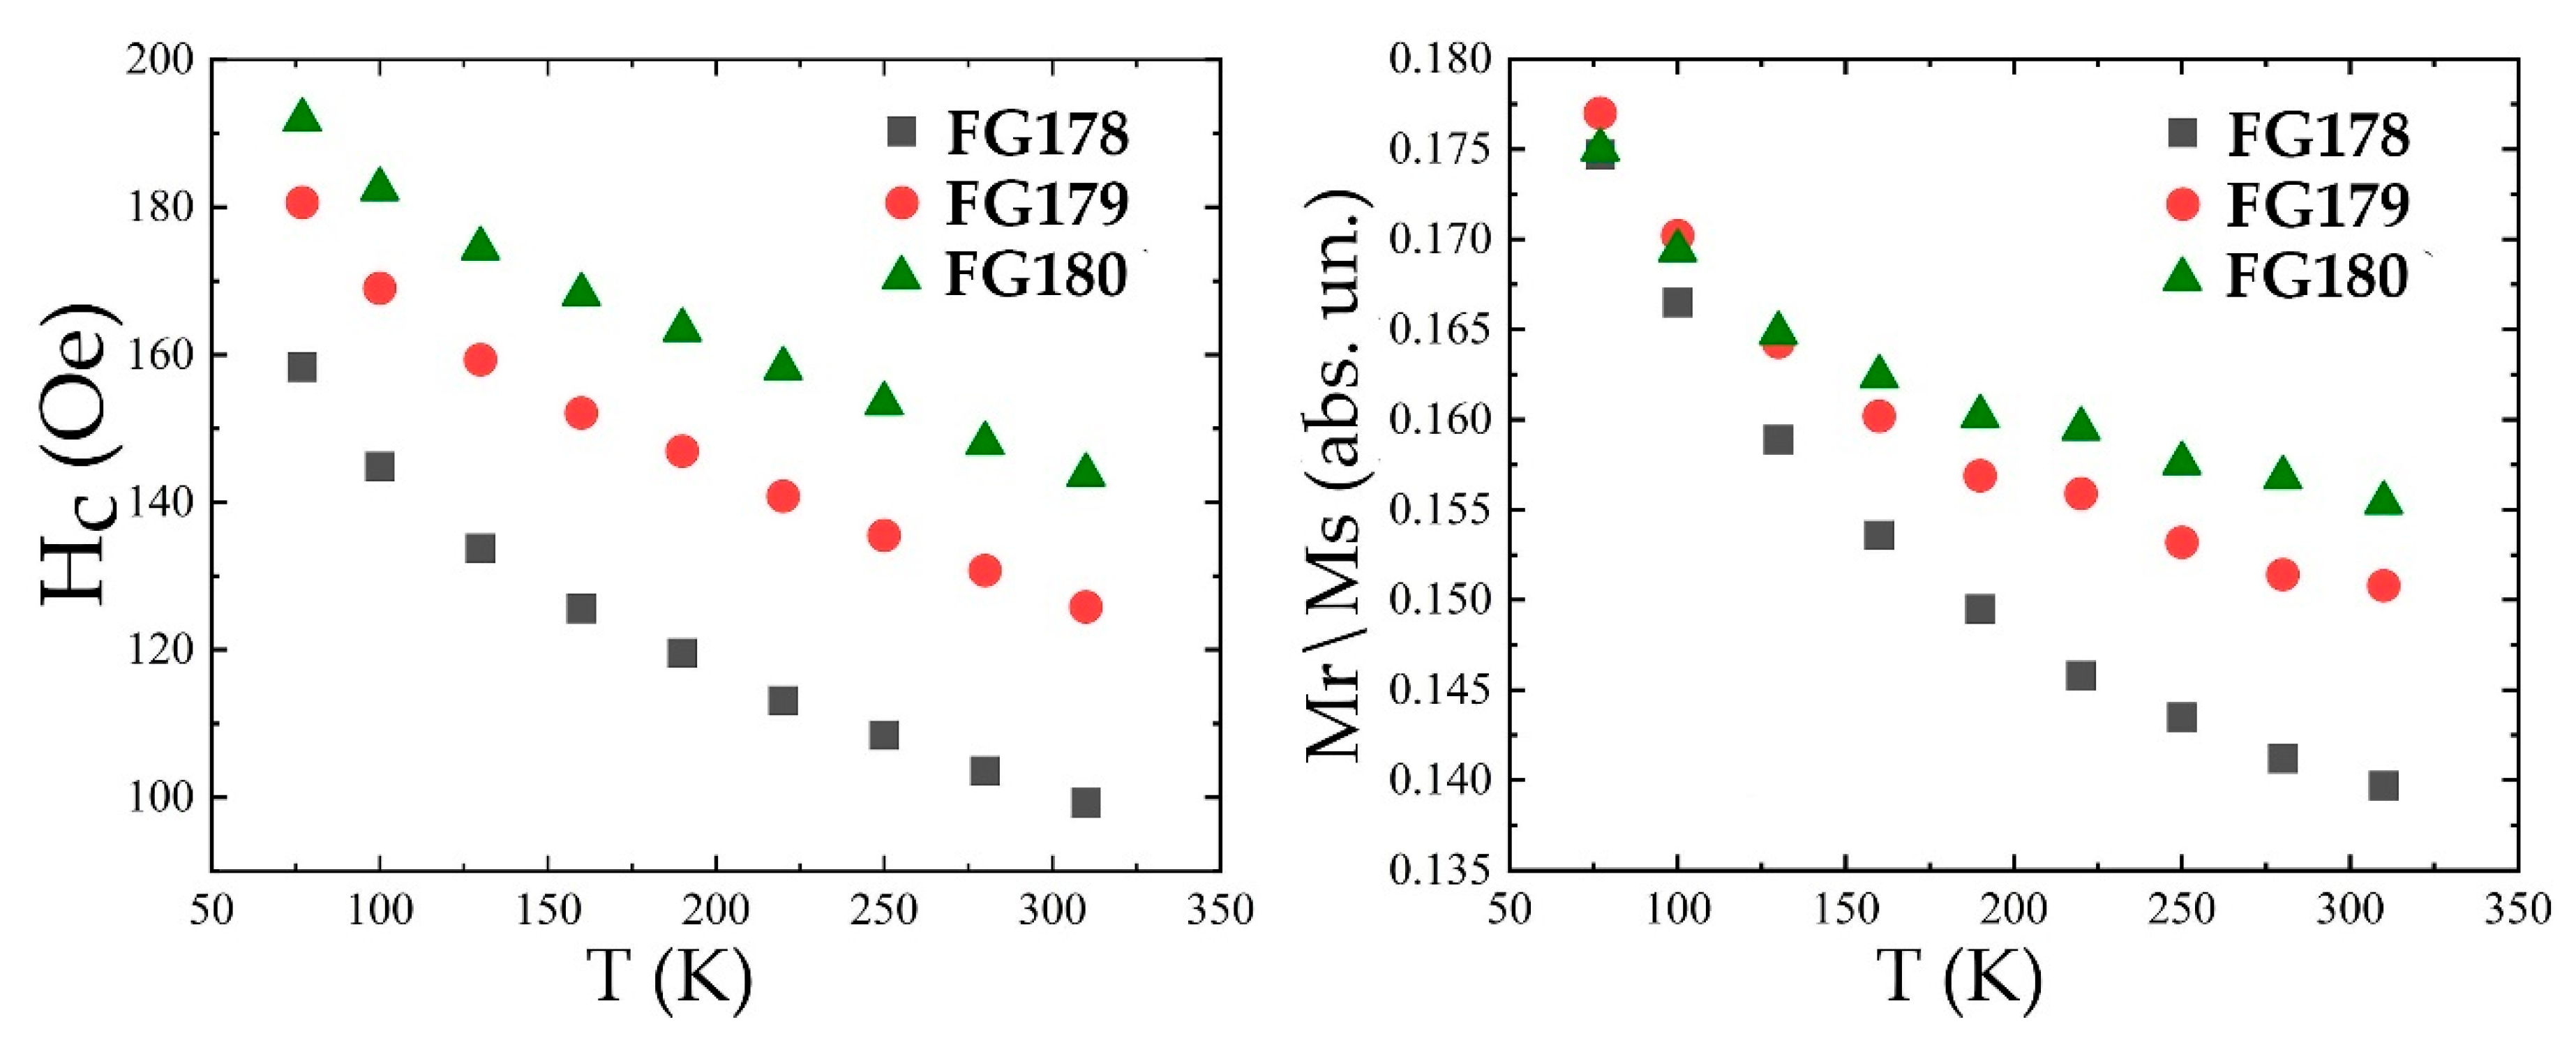
Figure 8 shows the temperature dependences of the coercive field and the ratio between saturation magnetization and remanence magnetization. These dependences demonstrate that the magnetic parameters increase with rising average microsphere size in the range of 77–300 K.
The first-order reversal curve (FORC) method is based on the classical Preisach model of a hysteresis loop with uniaxial anisotropy, unit coercivity and magnetization [38] and enables analysis of the collective behavior of magnetically multiphase samples. The FORC diagrams are a map of magnetic response of all the particles in a sample with irreversible magnetization in terms of coercivity and distribution of the magnetic interaction field (axes Hc and Hu, respectively). The resulting diagrams are shown in Figure 9 in the identical scale for illustrative assessment of the behavior of magnetic microsphere samples.
The FORC distributions measured for the magnetic microsphere samples have a concentrated pattern along the Hu axis and approximately symmetric distribution with respect to the Hc axis, showing slight predominance in the negative Hu direction. Whereas the overall distribution shape remains largely consistent across samples, dispersion of coercivity of magnetic particles within the microspheres is observed as the average microsphere diameter increases (transition from sample FG178 to FG180). As for the Hu axis, the SEM images of the microspheres clearly indicate that concentration of surface magnetic particles rises with increasing microsphere size; therefore, magnetostatic interactions are enhanced, manifesting itself as increased peak intensity in the FORC diagrams.
For non-interacting single-domain particles, FORC diagrams feature a central peak at a certain coercive field value [39]. It should be mentioned that FORC curves for single-domain small particles usually have specific features. The first one is the distinct central peak (with a nonzero Hc parameter), the second is subsidiary negative peak in the lower left-hand corner of the FORC diagram [25]. It is in contradiction with current FORC diagrams, which show diverging patterns. It has been widely observed in Preisach and FORC diagrams for geological samples [40,41]. We observe the FORC diagrams have a triangular shape with predominant vertical distribution, where signal intensity decreases with increasing coercive force. Similar FORC diagram patterns were observed for natural multi-domain and pseudo-single-domain particles [40,41,42]. Besides, refs. [40,42,43] demonstrated that the classical Néel domain wall pinning model fails to describe the mechanism of coercivity formation. Considering the curve shape and distribution along the Hu and Hc axes, it is fair to say that both the average size of the magnetic phase in the sample and the intensity of magnetic interactions between these particles within the microsphere matrix increase with the rise of the microsphere’s average size.

4. Discussion

The 57Fe Mössbauer spectroscopy data reveal that portion of the magnetic part of the spectrum increases with the average size of microspheres in the series FG178–FG179–FG180, which correlates with the content of the phase of substituted brownmillerite according to the XRPD data. The mass fractions of SiO2 and the vitreous phase according to the XRPD and chemical analysis data increase. Simultaneously, chemical analysis shows that the content of calcium cations in microspheres rises, while magnesium and aluminum contents remain virtually unchanged. This fact can be attributed to the formation of the CaFe2O4 ferrite phase (paramagnetic at 300 K), whose fraction increases as demonstrated by the 57Fe Mössbauer spectroscopy data. Hence, we observe that the SiO2 content grows with increasing average diameter of spheres, while the weight fractions of Fe2O3 and CaO decrease. It is fair to say that the fraction of the magnetically ordered portion declines monotonically as the microsphere size increases, thus indicating that crystallites of the magnetic phase in the nonmagnetic matrix of the microsphere consisting of the SiO2 vitreous phase is diluted.
Analyzing the magnetic properties of the samples is impeded by the fact that the magnetization signal is an integral parameter that comprises magnetization from all the possible crystalline and X-ray amorphous phases, including those that contain no Fe atoms and are not observed in the Mössbauer effect. Nevertheless, the dilution proposed above is expected to affect the magnetic characteristics of the samples, thus influencing the field dependences of magnetization within the range of 77–300 K and magnetic fields with intensity up to 15 kOe that exhibit an increase in saturation magnetization and coercivity, which can be attributed to larger size of magnetic crystallites in microspheres. Since the magnetic ordering temperature of a substance goes down as one proceeds to the nano-sized scale [44,45], assessment of the magnetic transition temperature in the samples can show changes in their average grain size. The temperature dependence of spontaneous magnetization of ferromagnetics within the temperature range significantly lower than the Curie point (TC) looks as:
M ( T ) = M ( 0 ) · [ 1 a ( T T C ) 3 / 2 ]
where a is a constant characteristic of a particular substance. This equation is known as Bloch’s law and describes the reduction of magnetization with rising temperature, which is caused by disruption of the ideal magnetic order existing at T = 0 K due to the thermal motion of atoms. In this case, however, the ordering temperature should mean an effective temperature unrelated to a specific crystallographic phase.
Figure 10 shows analytical fitting of the experimental data using Equation (1). There is an overall trend toward reduction of the effective magnetic ordering temperature with decreasing microsphere size (684 K → 651 K → 616 K for the sample series FG180, FG179, and FG178). This can be attributed to the fact that the effective (average) size of particles adsorbed onto the microsphere surface could be characterized by broader size distribution, thereby enhancing magnetic disorder in the system. The rise in the calculated magnetic ordering temperature across the FG178–FG179–FG180 series can suggest that the average size of magnetic particles within the microspheres increases.

5. Conclusions

The findings demonstrate that the rise in microsphere size observed upon coal combustion is likely to be caused only by the increase in the content of the silicate vitreous phase, while the content of magnetic crystalline phases remains virtually unchanged. However, magnetic measurements have demonstrated that the magnetic ordering temperature of the brownmillerite magnetic phase increases with the average diameter of microspheres. It can be related both to the enlargement of magnetic particles inside a microsphere due to sintering and to the decline in the content of diamagnetic impurities in the brownmillerite structure. FORC analysis of magnetic interactions in microspheres demonstrates that they are enhanced as the microsphere size increases, which can be interpreted as elevation of concentration of magnetic microparticles, which apparently takes place on the microsphere surface considering the electron microscopy data. It is fair to say that the magnetic crystalline phases are displaced to the microsphere’s surface. Hence, we can claim that the magnetic particles, which are formed due to the vitreous phase under the nonequilibrium coal combustion conditions, are available for their separation and the possible applications in areas such as magnetic sorbents, catalysis, and electromagnetic devices. Nevertheless, we note that possible routes for production and tailoring of the magnetic materials could be achieved using the magnetic separation of the fly ash and is the subject of further research.

Author Contributions

Conceptualization, E.V.F., Y.V.K., S.V.S. and A.G.A.; methodology, E.V.F., Y.V.K., L.A.S., V.V.Y., S.V.S. and O.A.B.; software, Y.V.K., L.A.S., V.V.Y. and S.V.S.; validation, E.V.F., G.V.A., Y.V.K. and N.N.A.; formal analysis, E.V.F., G.V.A., Y.V.K., L.A.S., V.V.Y. and S.V.S.; investigation, E.V.F., Y.V.K., S.V.S., G.V.A., L.A.S. and V.V.Y.; resources, E.V.F., Y.V.K., N.N.A. and A.G.A.; data curation, E.V.F., Y.V.K., S.V.S., O.A.B. and A.G.A.; writing—original draft preparation, E.V.F., Y.V.K., G.V.A., V.V.Y., S.V.S. and N.N.A.; writing—review and editing, E.V.F., N.N.A. and Y.V.K.; visualization, E.V.F., Y.V.K., V.V.Y., G.V.A. and N.N.A.; supervision, A.G.A.; project administration, E.V.F.; funding acquisition, E.V.F., Y.V.K., N.N.A. and A.G.A. All authors have read and agreed to the published version of the manuscript.

Funding

This research was funded by the budget project FWES 2021–0013 for the Institute of Chemistry and Chemical Technology SB RAS.

Institutional Review Board Statement

Not applicable.

Informed Consent Statement

Not applicable.

Data Availability Statement

The data presented in this study are available on request from the corresponding author.

Acknowledgments

The reported study was conducted using equipment from the Krasnoyarsk Regional Research Equipment Center of SB RAS (FRC KSC SB RAS).

Conflicts of Interest

The authors declare no conflicts of interest.

References

  1. Roy, W.R.; Thiery, R.G.; Schuller, R.M.; Subway, J.J. Coal Fly Ash: A Review of the Literature and Proposed Classification System with Emphasis on Environmental Impacts; State Geological Survey Division: Champaign, IL, USA, 1981; p. 69. [Google Scholar]
  2. Rodrigues, P.; Silvestre, J.D.; Flores-Colen, I.; Viegas, C.A.; Ahmed, H.H.; Kurda, R.; de Brito, J. Evaluation of the Ecotoxicological Potential of Fly Ash and Recycled Concrete Aggregates Use in Concrete. Appl. Sci. 2020, 10, 351. [Google Scholar] [CrossRef]
  3. Fomenko, E.V.; Anshits, N.N.; Solovyov, L.A.; Knyazev, Y.V.; Semenov, S.V.; Bayukov, O.A.; Anshits, A.G. Magnetic Fractions of PM2.5, PM2.5–10, and PM10 from Coal Fly Ash as Environmental Pollutants. ACS Omega 2021, 6, 20076–20085. [Google Scholar] [CrossRef] [PubMed]
  4. Gune, M.; Harshavardhana, B.G.; Balakrishna, K.; Udayashankar, H.N.; Shankar, R.; Manjunatha, B.R. Rock magnetic finger-printing of soil from a coal-fired thermal power plant. Environ. Monit. Assess. 2016, 188, 272. [Google Scholar] [CrossRef] [PubMed]
  5. Kim, W.; Doh, S.-J.; Yu, Y. Anthropogenic contribution of magnetic particulates in urban roadside dust. Atmos. Environ. 2009, 43, 3137–3144. [Google Scholar] [CrossRef]
  6. Cohen, A.J.; Brauer, M.; Burnett, R.; Anderson, H.R.; Frostad, J.; Estep, K.; Balakrishnan, K.; Brunekreef, B.; Dandona, L.; Dandona, R.; et al. Estimates and 25-year trends of the global disease burden attributable to ambient air pollution: An analysis of data from the global burden of diseases study 2015. Lancet 2017, 389, 1907–1918. [Google Scholar] [CrossRef]
  7. Newell, K.; Kartsonaki, C.; Lam, K.B.H.; Kurmi, O.P. Cardiorespiratory health effects of particulate ambient air pollution exposure in low-income and middle-income countries: A systematic review and meta-analysis. Lancet Planet. Health 2017, 1, e368–e380. [Google Scholar] [CrossRef]
  8. Meo, S.A.; Salih, M.A.; Al-Hussain, F.; Alkhalifah, J.M.; Meo, A.S.; Akram, A. Environmental pollutants PM2.5, PM10, carbon monoxide (CO), nitrogen dioxide (NO2), sulfur dioxide (SO2), and Ozone (O3) impair human cognitive functions. Eur. Rev. Med. Pharmacol. Sci. 2024, 28, 789–796. [Google Scholar] [CrossRef]
  9. Anshits, A.G.; Bajukov, O.A.; Kondratenko, E.V.; Anshits, N.N.; Pletnev, O.V.; Rabchevskii, E.V. Catalytic Properties and Nature of Active Centers of Ferrospheres in Oxidative Coupling of Methane. Appl. Catal. A Gen. 2016, 524, 192–199. [Google Scholar] [CrossRef]
  10. Anshits, N.N.; Fedorchak, M.A.; Sharonova, O.M.; Kirik, N.P.; Shishkina, N.N.; Zhizhaev, A.M.; Anshits, A.G. Structure–Composition Relationship of Platelike Ferrospheres in Calcium-Rich Power Plant Ash. Inorg. Mat. 2018, 54, 466–472. [Google Scholar] [CrossRef]
  11. Goldman, A. Crystal Structure of Ferrites. In Handbook of Modern Ferromagnetic Materials; The Springer International Series in Engineering and Computer Science; Springer: Boston, MA, USA, 1999; Volume 505, pp. 207–227. [Google Scholar] [CrossRef]
  12. Ni, D.; Cava, R.J. Ferrites without iron as potential quantum materials. Prog. Solid State Chem. 2022, 66, 10034. [Google Scholar] [CrossRef]
  13. Yadav, N.; Ahmaruzzaman, M. Recent advancements in CaFe2O4-based composite: Properties. synthesis. and multiple applications. Energy Environ. 2023, 35, 0958305X2311554. [Google Scholar] [CrossRef]
  14. Taylor, H.F.W. Cement Chemistry, 2nd ed.; Academic Press: London, UK, 1997. [Google Scholar] [CrossRef]
  15. Antunes, I.; Ruivo, L.C.M.; Tarelho, L.A.C.; Yaremchenko, A.; Frade, J. Solid state synthesis of Ca2Fe2O5 by reactive firing of calcite and siderite. Ceram. Int. 2022, 48, 34025–34032. [Google Scholar] [CrossRef]
  16. Songvilay, M.; Petit, S.; Koza, M.; Rols, S.; Suard, E.; Skumryev, V.; Martin, C.; Damay, F. Disorder and magnetic excitations in CaCrxFe2−xO4 (x = 0.5). Phys. Rev. B 2020, 101, 014407. [Google Scholar] [CrossRef]
  17. Geller, S.; Grant, R.W.; Gonser, U. Crystal Chemistry and Magnetic Structures of Substituted Ca2[Fe](Fe)O5. Prog. Solid State Chem. 1971, 5, 1–26. [Google Scholar] [CrossRef]
  18. Itoh, S.; Tsubone, A.; Matsubae-Yokoyama, K.; Nakajima, K.; Nagasaka, T. New EAF Dust Treatment Process with the Aid of Strong Magnetic Field. ISIJ Int. 2008, 48, 1339–1344. [Google Scholar] [CrossRef]
  19. Xue, B.; Jia, L.; Zhang, F. Biodiesel production from soybean and Jatropha oils by magnetic CaFe2O4-Ca2Fe2O5-based catalyst. Energy 2014, 68, 584–591. [Google Scholar] [CrossRef]
  20. You, Z.; Ma, X.; Yu, Z.; Chen, C.; Dong, J.; Yue, W. Application of CaFe2O4/Ca2Fe2O5 to the fixation of heavy metals by co-combustion of coal and coconut shells: Experimental, simulation studies and environmental analysis. Ind. Crops Prod. 2024, 220, 119291. [Google Scholar] [CrossRef]
  21. Fomenko, E.V.; Akimochkina, G.V.; Anshits, A.G. Narrow dispersed fractions of high-calcium fly ash produced from the pulverized combustion of Irsha-Borodinsky coal. Therm. Eng. 2019, 66, 560–568. [Google Scholar] [CrossRef]
  22. GOST 5382-2019; Cements and Materials for Cement Production. Chemical Analysis Methods. Publishing House of Standards: Moscow, Russia, 2019. Available online: https://docs.cntd.ru/document/1200168999 (accessed on 20 July 2025). (In Russian)
  23. State Standard GOST 16190-70; Sorbents. Method of Bulk Density Determination. Publishing House of Standards: Moscow, Russia, 1970. Available online: https://docs.cntd.ru/document/1200018309 (accessed on 20 July 2025). (In Russian)
  24. Rietveld, H.M. A Profile Refinement Method for Nuclear and Magnetic Structures. J. Appl. Crystallogr. 1969, 2, 65–71. [Google Scholar] [CrossRef]
  25. Roberts, A.P.; Heslop, D.; Zhao, X.; Pike, C.R. Understanding fine magnetic particle systems through use of first-order reversal curve diagrams. Rev. Geophys. 2014, 52, 557–602. [Google Scholar] [CrossRef]
  26. Fomenko, E.V.; Akimochkina, G.V.; Anshits, A.G. Investigation of the composition of dispersed particles in fly ash and determination of the routes of PM10 formation from the mineral components of lignite. Chem. Sustain. Dev. 2024, 32, 860–868. [Google Scholar] [CrossRef]
  27. Kaminskas, R.; Kubiliūtė, R. The effect of coal ash on synthesis and properties of tricalcium silicate. Mater. Sci. (Medžiagotyra) 2010, 16, 73–79. [Google Scholar]
  28. Giergiczny, Z. Effect of some additives on the reactions in fly ASH-Ca(OH)2 system. J. Therm. Anal. Calorim. 2004, 76, 747–754. [Google Scholar] [CrossRef]
  29. Redhammer, G.J.; Amthauer, G.; Tippelt, G.; Lottermoser, W.; Roth, G. 57Fe Mössbauer Spectroscopic Investigations on the Brownmillerite Series Ca2(Fe2−xAlx)O5. AIP Conf. Proc. 2005, 765, 179–184. [Google Scholar] [CrossRef]
  30. Eibschütz, M.; Ganiel, U.; Shtrikman, S. Mössbauer and magnetic studies of dicalcium ferrite (Ca2Fe2O5). J. Mater. Sci. 1969, 4, 574–580. [Google Scholar] [CrossRef]
  31. Chakir, A.; Aqdim, S.; Mehdaoui, B.; El Bouari, A. Deciphering driven phase transitions: A study on the dielectric and electrical properties of Ca2Fe2O5. Eur. Phys. J. B 2024, 97, 40. [Google Scholar] [CrossRef]
  32. Redhammer, G.J.; Tippelt, G.; Roth, G.; Amthauer, G. Structural variations in the brownmillerite series Ca2(Fe2−xAlx)O5: Single-crystal X-ray diffraction at 25 °C and high-temperature X-ray powder diffraction (25 °C ≤ T ≤ 1000 °C). Am. Min. 2004, 89, 405–420. [Google Scholar] [CrossRef]
  33. Stöber, S.; Redhammer, G.; Schorr, S.; Prokhnenko, O.; Pöllmann, H. Structure refinements of members in the brownmillerite solid solution series Ca2Alx(Fe0.5Mn0.5)2−xO5+δ with 1/2 ≤ x ≤ 4/3. J. Solid State Chem. 2013, 197, 420–428. [Google Scholar] [CrossRef]
  34. Phan, T.L.; Tran, N.; Kim, D.H.; Tho, P.T.; Huy, B.T.; Dang, N.T.; Yang, D.S.; Lee, B.W. Electronic structure and magnetic properties of Al-doped Ca2Fe2O5 brownmillerite compounds. J. Am. Ceram. Soc. 2018, 101, 2181–2189. [Google Scholar] [CrossRef]
  35. Kharton, V.V.; Tsipis, E.V.; Kolotygin, V.A.; Avdeev, M.; Viskup, A.P.; Waerenborgh, J.C.; Frade, J.R. Mixed Conductivity and Stability of CaFe2O4–δ. J. Electrochem. Soc. 2008, 155, P13–P20. [Google Scholar] [CrossRef]
  36. Knyazev, Y.V.; Tarasov, A.S.; Platunov, M.S.; Trigub, A.L.; Bayukov, O.A.; Boronin, A.I.; Solovyov, L.A.; Rabchevskii, E.V.; Shishkina, N.N.; Anshits, A.G. Structural and electron transport properties of CaFe2O4 synthesized in air and in helium atmosphere. J. Alloys Compd. 2020, 20, 153073. [Google Scholar] [CrossRef]
  37. Gütlich, P.; Bill, E.; Trautwein, A.X. Mössbauer Spectroscopy and Transition Metal Chemistry: Fundamentals and Applications; Springer: Berlin/Heidelberg, Germany, 2010. [Google Scholar] [CrossRef]
  38. Preisach, F. Über die magnetische Nachwirkung. Z. Physik. 1935, 94, 277–302. (In Germany) [Google Scholar] [CrossRef]
  39. Egli, R.; Chen, A.P.; Winklhofer, M.; Kodama, K.P.; Horng, C.S. Detection of noninteracting single domain particles using first-order reversal curve diagrams. Geochem. Geophys. Geosyst. 2010, 11, Q01Z11. [Google Scholar] [CrossRef]
  40. Pike, C.R.; Roberts, A.P.; Dekkers, M.J.; Verosub, K.L. An investigation of multi-domain hysteresis mechanisms using FORC diagrams. Phys. Earth Planet. Inter. 2001, 126, 11–25. [Google Scholar] [CrossRef]
  41. Muxworthy, A.R.; Dunlop, D.J. First-order reversal curve (FORC) diagrams for pseudo-single-domain magnetites at high temperature. Earth Planet. Sci. Lett. 2002, 203, 369–382. [Google Scholar] [CrossRef]
  42. Smirnov, A.V. Low-temperature magnetic properties of magnetite using first-order reversal curve analysis: Implications for the pseudo-single domain state. Geochem. Geophys. Geosyst. 2006, 7, Q11011. [Google Scholar] [CrossRef]
  43. Muxworthy, A.R.; King, J.G.; Heslop, D. Assessing the ability of first-order reversal curve (FORC) diagrams to unravel complex magnetic signals. J. Geophys. Res. 2005, 110, B01105. [Google Scholar] [CrossRef]
  44. Punnoose, A.; Magnone, H.; Seehra, M.S.; Bonevich, J. Bulk to nanoscale magnetism and exchange bias in CuO nanoparticles. Phys. Rev. B 2001, 64, 174420. [Google Scholar] [CrossRef]
  45. Quickel, T.E.; Le, V.H.; Brezesinski, T.; Tolbert, S.H. On the Correlation between Nanoscale Structure and Magnetic Properties in Ordered Mesoporous Cobalt Ferrite (CoFe2O4) Thin Films. Nano Lett. 2010, 10, 2982–2988. [Google Scholar] [CrossRef]
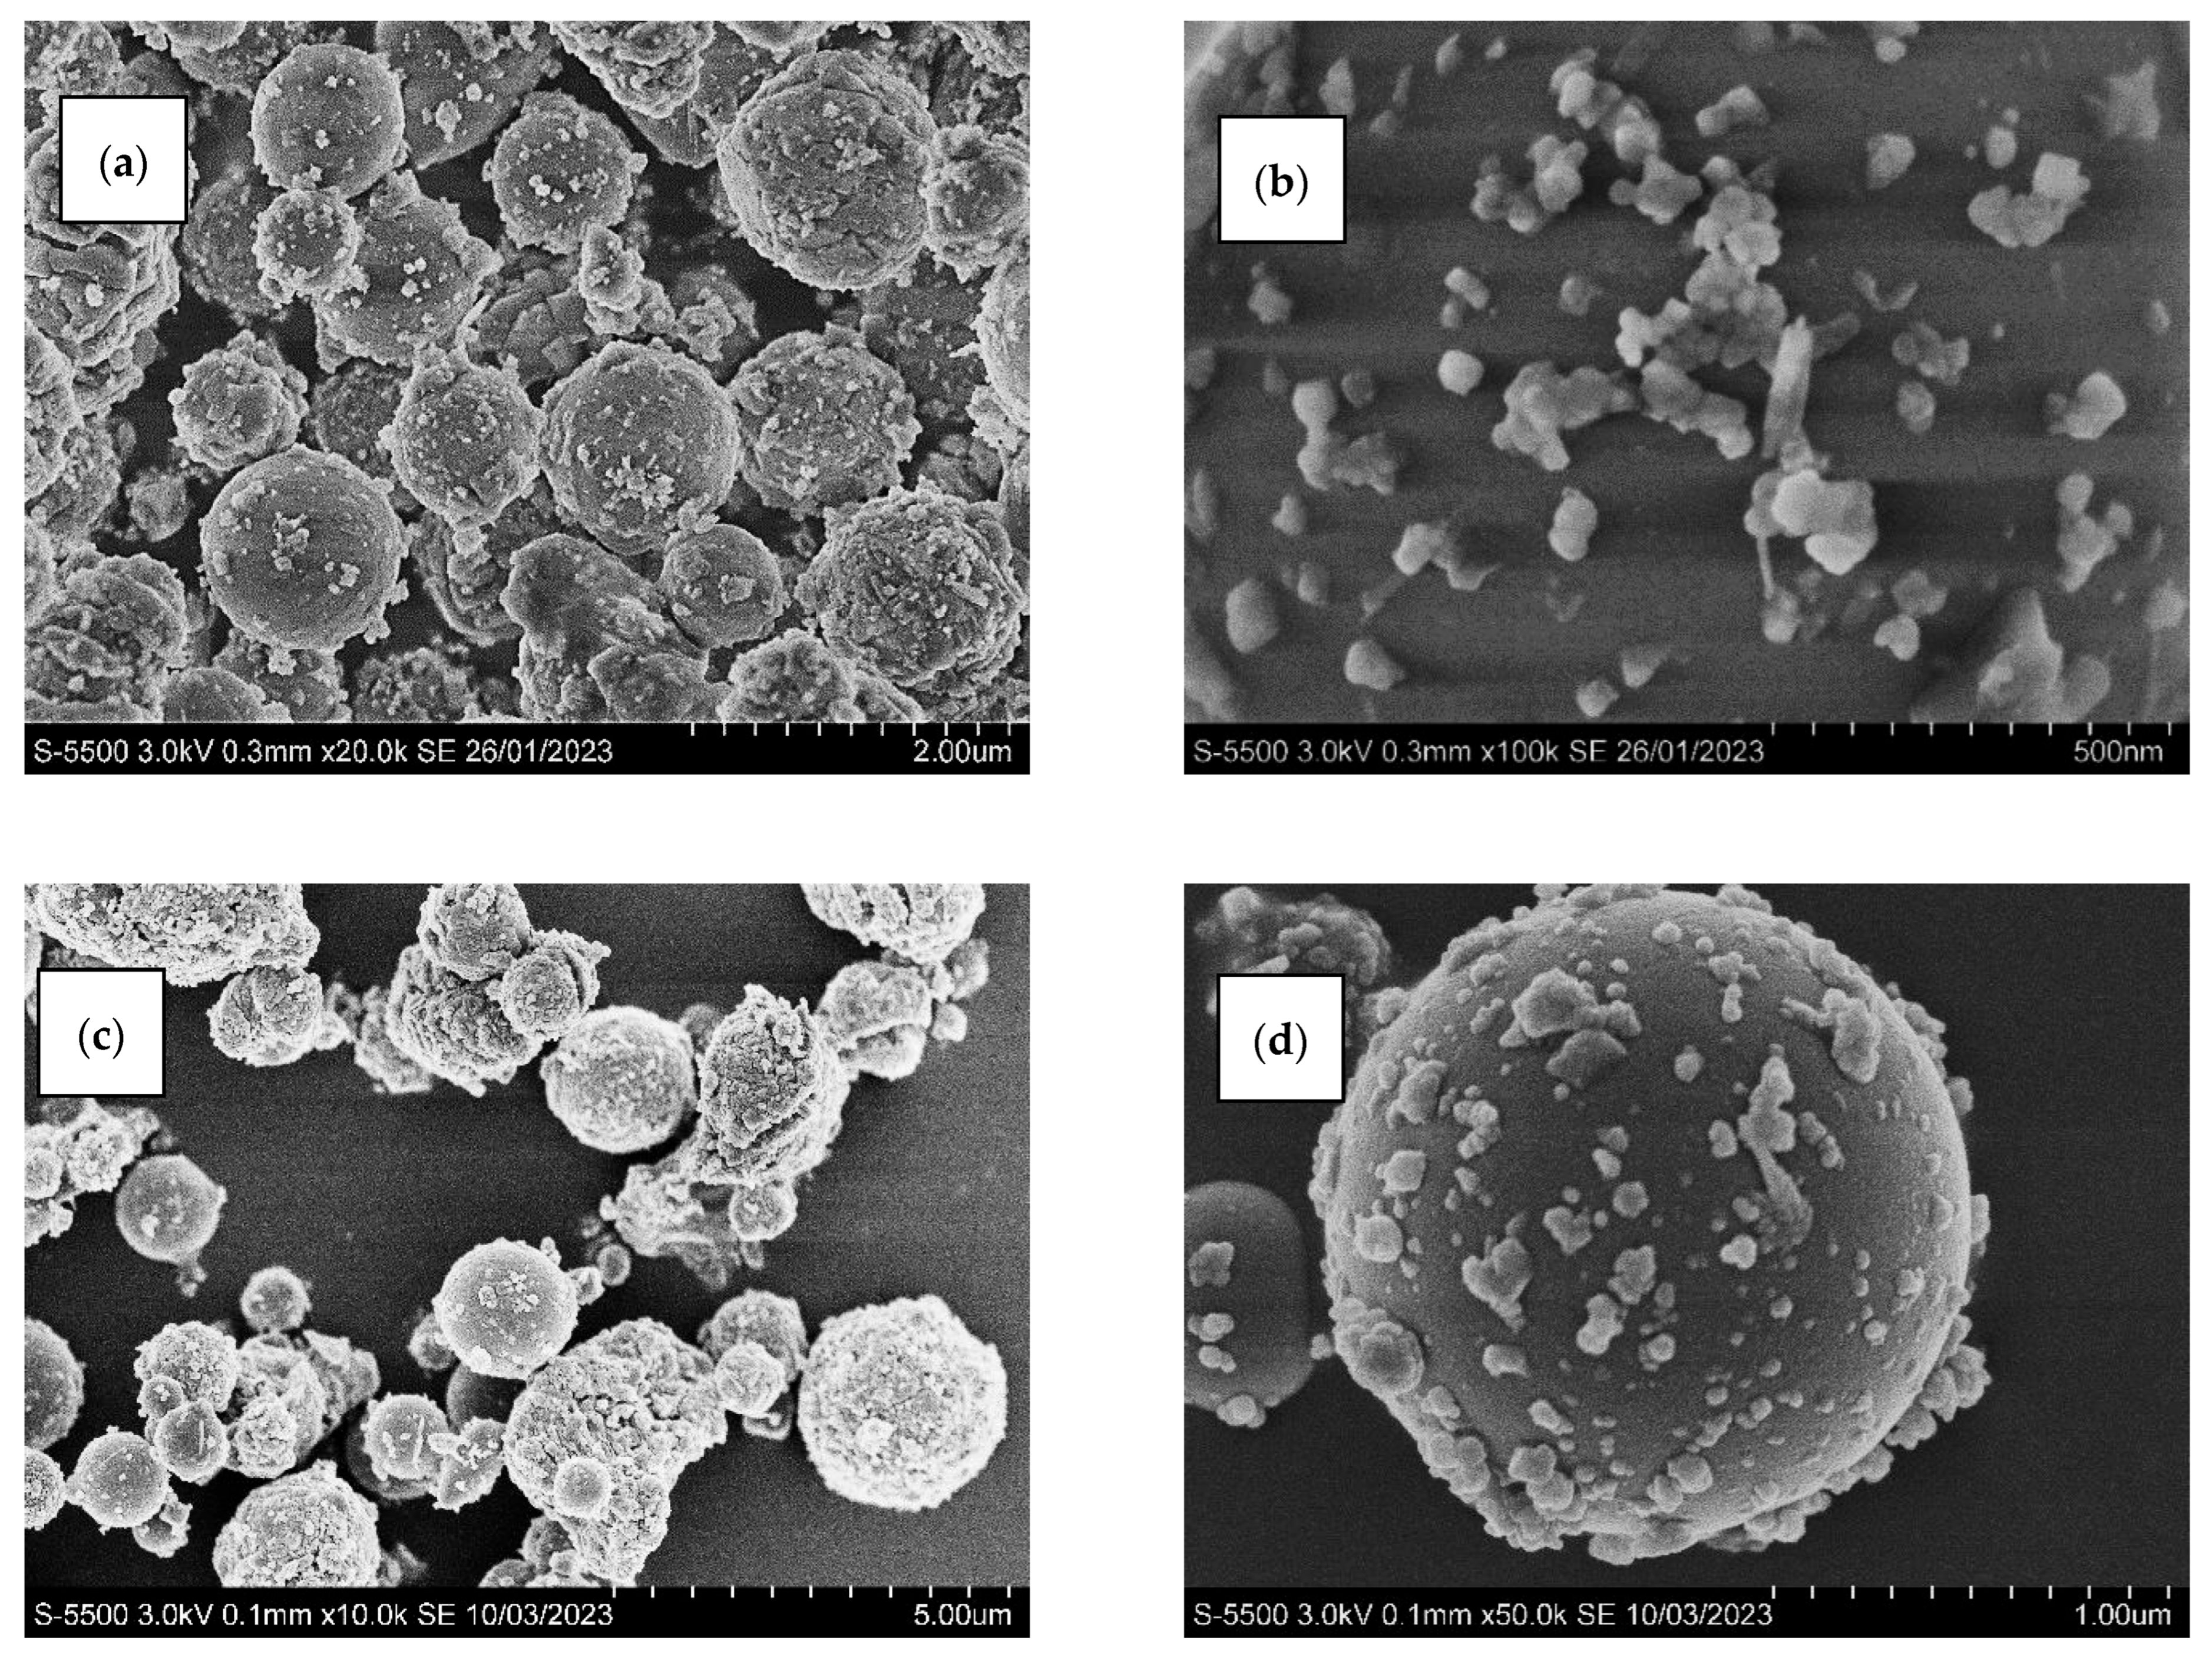
Figure 1. SEM images of the microsphere samples: (a,b) FG178; (c,d) FG179; and (e,f) FG180. The image scale is given in the picture.
Magnetochemistry 11 00072 g001aMagnetochemistry 11 00072 g001b
Figure 2. SEM images of the narrow fraction of dispersed microsphere in the elemental mapping mode and the elemental composition of single globule on an oxide basis: (a) FG178; (b) FG179; and (c) FG180.
Magnetochemistry 11 00072 g002aMagnetochemistry 11 00072 g002b
Figure 3. The ternary plots of compositions of single microspheres in the coordinates of the [SiO2 + Al2O3]–[Fe2O3]–[CaO + MgO] (a) and [SiO2]—[Al2O3]—[CaO] (b) systems.
Magnetochemistry 11 00072 g003
Figure 4. The DSC-TG-MS curves for the FG179 sample in the temperature range of 50–1100 °C.
Magnetochemistry 11 00072 g004
Figure 5. The DSC-TG-DTG curves of thermal transformation of the narrow fraction of dispersed microspheres in the temperature range of 50–1100 °C.
Magnetochemistry 11 00072 g005
Figure 6. The 57Fe Mössbauer spectra of the samples at room temperature. Experimental data are shown by dots. The continuous line under the spectrum shows an error signal. Spectral components are shown as filled areas.
Magnetochemistry 11 00072 g006
Figure 7. Field dependences of magnetization of microsphere samples in the temperature range of 77–300 K.
Magnetochemistry 11 00072 g007
Figure 8. Temperature dependences of the coercive field and the ratio between saturation magnetization and remanence magnetization determined by magnetic measurements.
Magnetochemistry 11 00072 g008
Figure 9. The FORC diagrams of the microsphere samples.
Magnetochemistry 11 00072 g009
Figure 10. Temperature dependence of saturation magnetization of microsphere samples. Fitting using the Bloch’s law is shown with solid lines.
Magnetochemistry 11 00072 g010
Table 1. Bulk density, particle size distribution, and chemical composition of the narrow fractions of dispersed microspheres.
FractionBulk Density
(g/cm3)
Particle Size
Distribution (µm)
Chemical Composition (wt %)
davd10d50d90d99LOISiO2Al2O3Fe2O3CaOMgONa2OK2OTiO2SO3
FG1780.891.60.51.33.15.45.3013.989.1713.9638.508.200.320.180.329.60
FG1791.011.90.61.53.86.65.5015.908.4213.7839.528.250.300.140.257.64
FG1801.122.50.72.04.98.410.8015.887.9913.9638.607.820.270.190.104.62
Table 2. Phase composition of the narrow fractions of dispersed microspheres (wt %).
FractionGlass PhaseCa4Al2Fe2O10Ca3Al2O6CaSO4CaCO3CaOCa(OH)2MgOQuartzFe-Spinel
FG17841.314.58.714.20.91.68.67.01.51.7
FG17940.712.910.211.20.72.011.56.82.02.0
FG18047.511.09.67.60.82.210.46.22.52.2
Table 3. The DSC-TG data of thermal transformation of the narrow fraction of dispersed microspheres.
FractionFG178FG179FG180
TG data
Mass loss, wt %Dehydration 40–244 °C0.470.500.46
Ca(OH)2 = CaO + H2O244–437 °C2.172.742.89
*** (Ca,Mg,Fe)CO3 = (Ca,Mg,Fe)O + CO2437–810 °C1.482.072.27
* Δmtotal40–1100 °C4.325.515.83
DSC data
Ca(OH)2 = CaO + H2O
(endothermic effect)
Tstart, °C373374375
Tmax, °C403408410
Tfin, °C415420422
*** (Ca,Mg,Fe)CO3 = (Ca,Mg,Fe)O + CO2
(endothermic effect)
Tstart, °C544554564
** Tmax, °C623/644624/657630/664
Tfin, °C657671677
Crystallization of a new phase (exothermic effect)Tstart, °C764778772
** Tmax, °C854/930885/925886/925
Tfin, °C10029971003
*—total mass loss according to the TG data in the entire temperature range being measured; **—temperatures of the local peak (shoulder) and the global peak, respectively, on the left and on the right; ***—the total record for the dissociation reactions of carbonates Ca(1−x−y)MgxFeyCO3; the position of Tstart was refined according to the DTG data as it was impossible to do it properly on the DSC curve.
Table 4. The 57Fe Mössbauer parameters for the microsphere samples FG. δ—is the isomeric shift with respect to α-Fe, ±0.005 mm/s; Hhf is the magnetic hyperfine field at iron nuclei, ±1 kOe. Δ—is quadrupole splitting, ±0.01 mm/s; W is the width of the Mössbauer line at half maximum for the lines pair 1–6 and 3–4, ±0.01 mm/s; A denotes the component’s fractional contribution, ±0.5 arb.un.
δHhfΔW34–16A
FG1780.445457−0.681.45–1.590.22[Fe3+]
0.40392−0.040.87–2.970.26[Fe3+]
0.18427101.000.12(Fe3+)
0.2510.820.670.25CaFe2O4
0.2851.580.600.15Ca2Fe2−xAlxO5
FG1790.31480−0.180.80–0.800.12[Fe3+]
0.3542500.79–1.070.20[Fe3+]
0.29283−0.370.53–2.830.21(Fe3+)
0.230.790.660.26CaFe2O4
0.271.570.700.21Ca2Fe2−xAlxO5
FG1800.301480−0.200.43–0.430.10[Fe3+]
0.4074220.120.81–1.490.21[Fe3+]
0.2702930.082.5840.20(Fe3+)
0.270.920.930.28CaFe2O4
0.281.490.770.21Ca2Fe2−xAlxO5
Disclaimer/Publisher’s Note: The statements, opinions and data contained in all publications are solely those of the individual author(s) and contributor(s) and not of MDPI and/or the editor(s). MDPI and/or the editor(s) disclaim responsibility for any injury to people or property resulting from any ideas, methods, instructions or products referred to in the content.