Article

Reentrant Spin Glass and Magnetic Skyrmions in the Co7Zn7Mn6−xFex β-Mn-Type Alloys

by
José F. Malta
1,2,*,†,
Marta S. C. Henriques
1,
José A. Paixão
1 and
António P. Gonçalves
2
1
CFisUC—Centre for Physics of the University of Coimbra, Department of Physics, University of Coimbra, 3004-516 Coimbra, Portugal
2
C2TN—Center for Nuclear Sciences and Technologies, Department of Nuclear Sciences and Engineering, Instituto Superior Técnico, University of Lisbon, 2695-066 Lisbon, Portugal
*
Author to whom correspondence should be addressed.
Current address: IT—Instituto de Telecomunicações, Instituto Superior Técnico, Torre Norte—Piso 10, Av. Rovisco Pais, 1, 1049-001 Lisboa, Portugal.
Magnetochemistry 2024, 10(8), 61; https://doi.org/10.3390/magnetochemistry10080061
Submission received: 2 July 2024 / Revised: 12 August 2024 / Accepted: 14 August 2024 / Published: 16 August 2024
(This article belongs to the Section Spin Crossover and Spintronics)

Abstract

:
Co7Zn7Mn6 is a β -Mn-type alloy belonging to the CoxZnyMnz ( x + y + z = 20 ) family that notoriously features a skyrmionic magnetic phase below the ferromagnetic ordering temperature and, in addition, a reentrant spin glass transition at low temperatures. In this work, we have studied the effect of partial substitution of Mn by Fe in the magnetic properties of this alloy. Samples of Co7Zn7Mn6−xFex, 0 x 1 , were synthesised using the Bridgman–Stockbarger method, and their structure and composition were fully characterised by XRD and EDS. VSM and AC susceptibility measurements show that the partial substitution of Mn by Fe increases T C and the skyrmionic region of the magnetic phase diagram is suppressed for x > 0.5 . The AC susceptibility behaviour at low temperatures can be ascribed to the presence of a reentrant spin glass state observed for all compositions, with a spin glass freezing temperature, T g , that shifts to lower temperatures as the Fe content increases.

1. Introduction

Beta-manganese ( β -Mn)-type alloys, based on CoxZnyMnz stoichiometry ( x + y + z = 20 ), are a family of cubic chiral magnets that crystallise in the P 4 1 32 / P 4 3 32 space groups. They are derivatives from the binary alloy Co8Zn12. The cubic unit cell of these systems, shown in Figure 1, has two occupied crystallographic sites: 8c with 3-fold site symmetry, preferentially occupied by Co atoms, and 12d with 2-fold site symmetry, preferentially occupied by Zn atoms. In the case of Mn atoms, they are dispersed among the 12d and 8c sites [1,2].
The stoichiometry of these alloys has a strong influence on the magnetic ordering temperature. The partial substitutions of Co and Zn by Mn lead to a significant variation of the Curie temperature, T C . Increasing the Mn content decreases T C and it also introduces helimagneticity in such systems that, in turn, are a key ingredient for the presence of skyrmionic phases [3,4,5,6]. Skyrmions are swirling spin structures, mostly found in chiral magnets. These structures may occur due to the competition between isotropic Heisenberg ferromagnetic exchange and Dzyaloshinskii–Moriya (DM) interactions in non-centrosymmetric structures [7,8,9], although other mechanisms have been disclosed that may also stabilise skyrmionic textures of spin, such as geometric frustration of short-range exchange interactions or the interplay between Ruderman–Kittel–Kasuya–Yosida (RKKY) and four-spin interactions associated with s-d or s-f coupling mediated by itinerant electrons [10].
Since their experimental discovery in 2009 in MnSi, magnetic skyrmions have been found in other compounds belonging to the B20 structure [11], in β -Mn-type alloys [3,12], and also in Cu2OSeO3, a chiral insulator antiferromagnet [13]. All these compounds crystallise in non-centrosymmetric space groups but, more recently, skyrmions have also been reported in compounds crystallising in centrosymmetric space groups, such as in GdRu2Si2 [10]. In Co10Zn10, which has no Mn, a modified helical structure was found that can be described as a sequence of ferromagnetic domains with domain walls where helical spin rotation occurs, due to the strong in-plane magnetic anisotropy. Magnetic anisotropy favours the spins to lie in the easy plane, but the anisotropy is reduced with increasing Mn content; the preferred orientation of the helimagnetic propagation vector and its temperature dependence dramatically change upon varying the Mn concentration [14]. Thus, the skyrmion lattice is likely observed along certain preferred directions, as in most of the β -Mn-type alloys.
For stoichiometric amounts of Mn in the range of 3 z 7 , the CoxZnyMnz system ( x + y + z = 20 ) undergoes a reentrant transition to a spin glass state while maintaining the helical order at low temperatures [2,15]. A spin glass is a magnetic state having only local (short-range) order of the magnetic spins that occurs at a defined temperature T g . Below such a temperature, a metastable frozen state appears without the usual magnetic long-range ordering [16]. In contrast to ordinary spin glasses, reentrant spin glasses (RSGs) are ferromagnetic below their Curie temperature, T C , but transform at a lower temperature, T g , to a frozen state [17,18]. Such behaviour is connected with temperature-independent random anisotropy and to the sort of anisotropy associated with the so-called ‘spin freezing’. In the case of the β -Mn-type alloys, the geometric frustration of the Mn moments on the hyper-kagomé coordinated 12 d crystallographic site explains the tendency to such disordered state [2].
Co8Zn8Mn4 presents near room-temperature skyrmions ( T C ∼300 K) and thus it is one of the most promising candidates for foreseen technological applications of skyrmionic materials [19,20]. Also, Co7Zn7Mn6 is known to host disordered skyrmions near T g , in addition to the ordered skyrmionic phase occurring close to T C (∼160 K) [1,19,21]. Different types of skyrmion magnetic textures such as square, triangular, and rhombic, either stable (at equilibrium) or metastable, have been reported in addition to the helical and conical phases. These distinct magnetic arrangements have been identified using a combination of wide-angle and small-angle neutron scattering (SANS) techniques [2,19,21].
This complex magnetic behaviour justifies a thorough study of substitution studies in β -Mn-type alloy systems. In particular, questions such as how Mn substitution by another transition metal atom affects the reentrant spin glass transition and the stability of the skyrmion phases need to be clarified and are important for better understanding the rich magnetic behaviour of these chiral magnets.
In this work, the magnetic properties of Co7Zn7Mn6 alloys with Mn partially substituted by Fe are investigated, with a focus on the evolution of the magnetic phase diagram with the substitution and a detailed study of the reentrant spin glass phase. Mn atoms occupying the 12 d crystallographic positions have been found, by neutron scattering studies [1], to tend to be dynamically disordered at low temperature, with zero average magnetic moment, and only a partial tendency to align in the direction of the Co spins at higher temperatures. Partial substitution of Mn by Fe atoms, that have a stronger ferromagnetic behaviour, raises an interesting question that is addressed in this work, of whether such substitution would suppress spin glass behaviour and intermediate helical and conic phases, thus significantly changing the phase diagram of the parent compound.

2. Materials and Methods

Samples of Co7Zn7Mn6−xFex, x = 0 , 0.25 , 0.50 , 0.75 , 1 were prepared from stoichiometric amounts of the pure elements Co (lump, 99.9%, Alfa Aeser, 26 Parkridge Road Ward Hill, MA 01835, USA), Zn (foil, 0.25 mm thickness, 99.98%, Alfa Aeser, 26 Parkridge Road Ward Hill, MA 01835, USA), Mn (chips, thickness < 2.0 mm, 99%, Sigma Aldrich, Sigma Aldrich, St. Louis, MO, USA), and Fe (pieces, 99.97%, Alfa-Aeser, 26 Parkridge Road Ward Hill, MA 01835, USA), with a total mass of 0.5 g, sealed in evacuated quartz tubes.
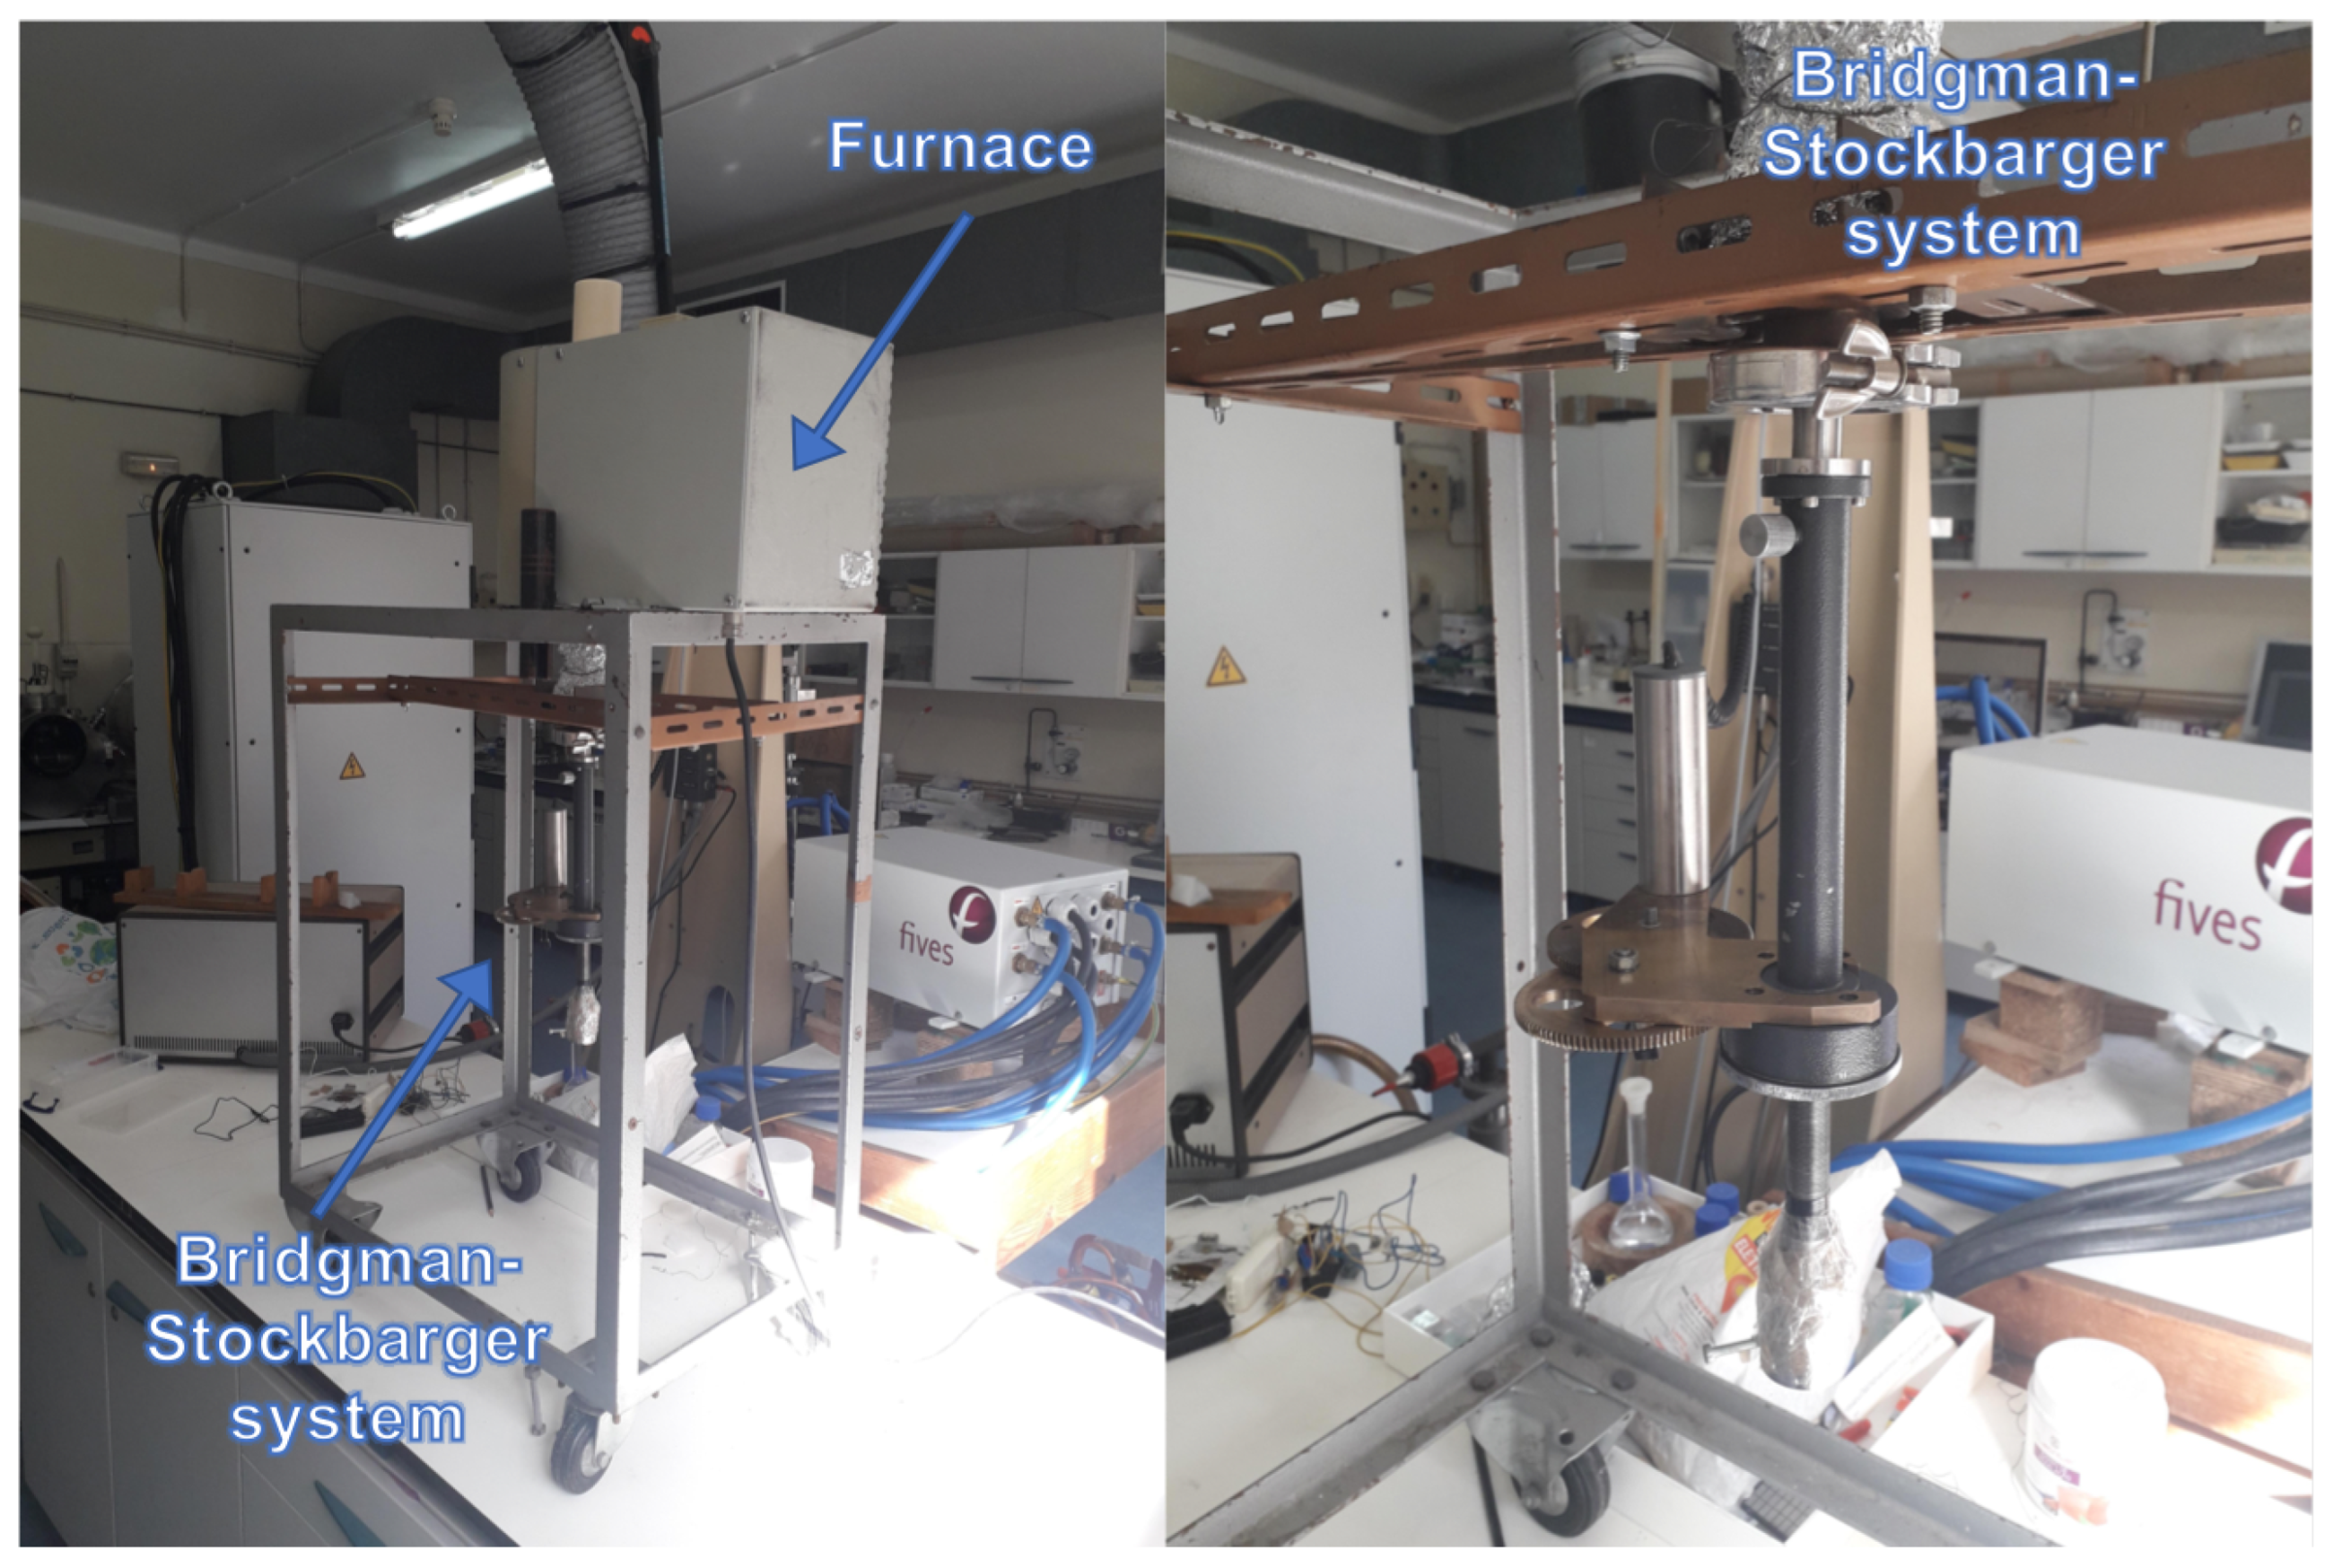
The loaded tubes were placed into a Bridgman–Stockbarger system and heated to 1000 °C. A shacking motor was switched on to vibrate the tube for 30 min to avoid coalescence and to ensure the homogeneity of the tube contents, remaining at 1000 °C for 24 h. Then, the Bridgman motor was activated to slowly displace the quartz tube inside the furnace into a region with a temperature of 900 °C, with a 5 °C/h cooling rate, followed by a fast quenching in water. This procedure afforded single crystals of Co7Zn7Mn6−xFex with relatively large sizes (up to ∼5 mm length). Figure 2 shows the Bridgman–Stockbarger apparatus used to grow high-quality single crystals in this work.

3. Results and Discussion

3.1. Sample Characterisation

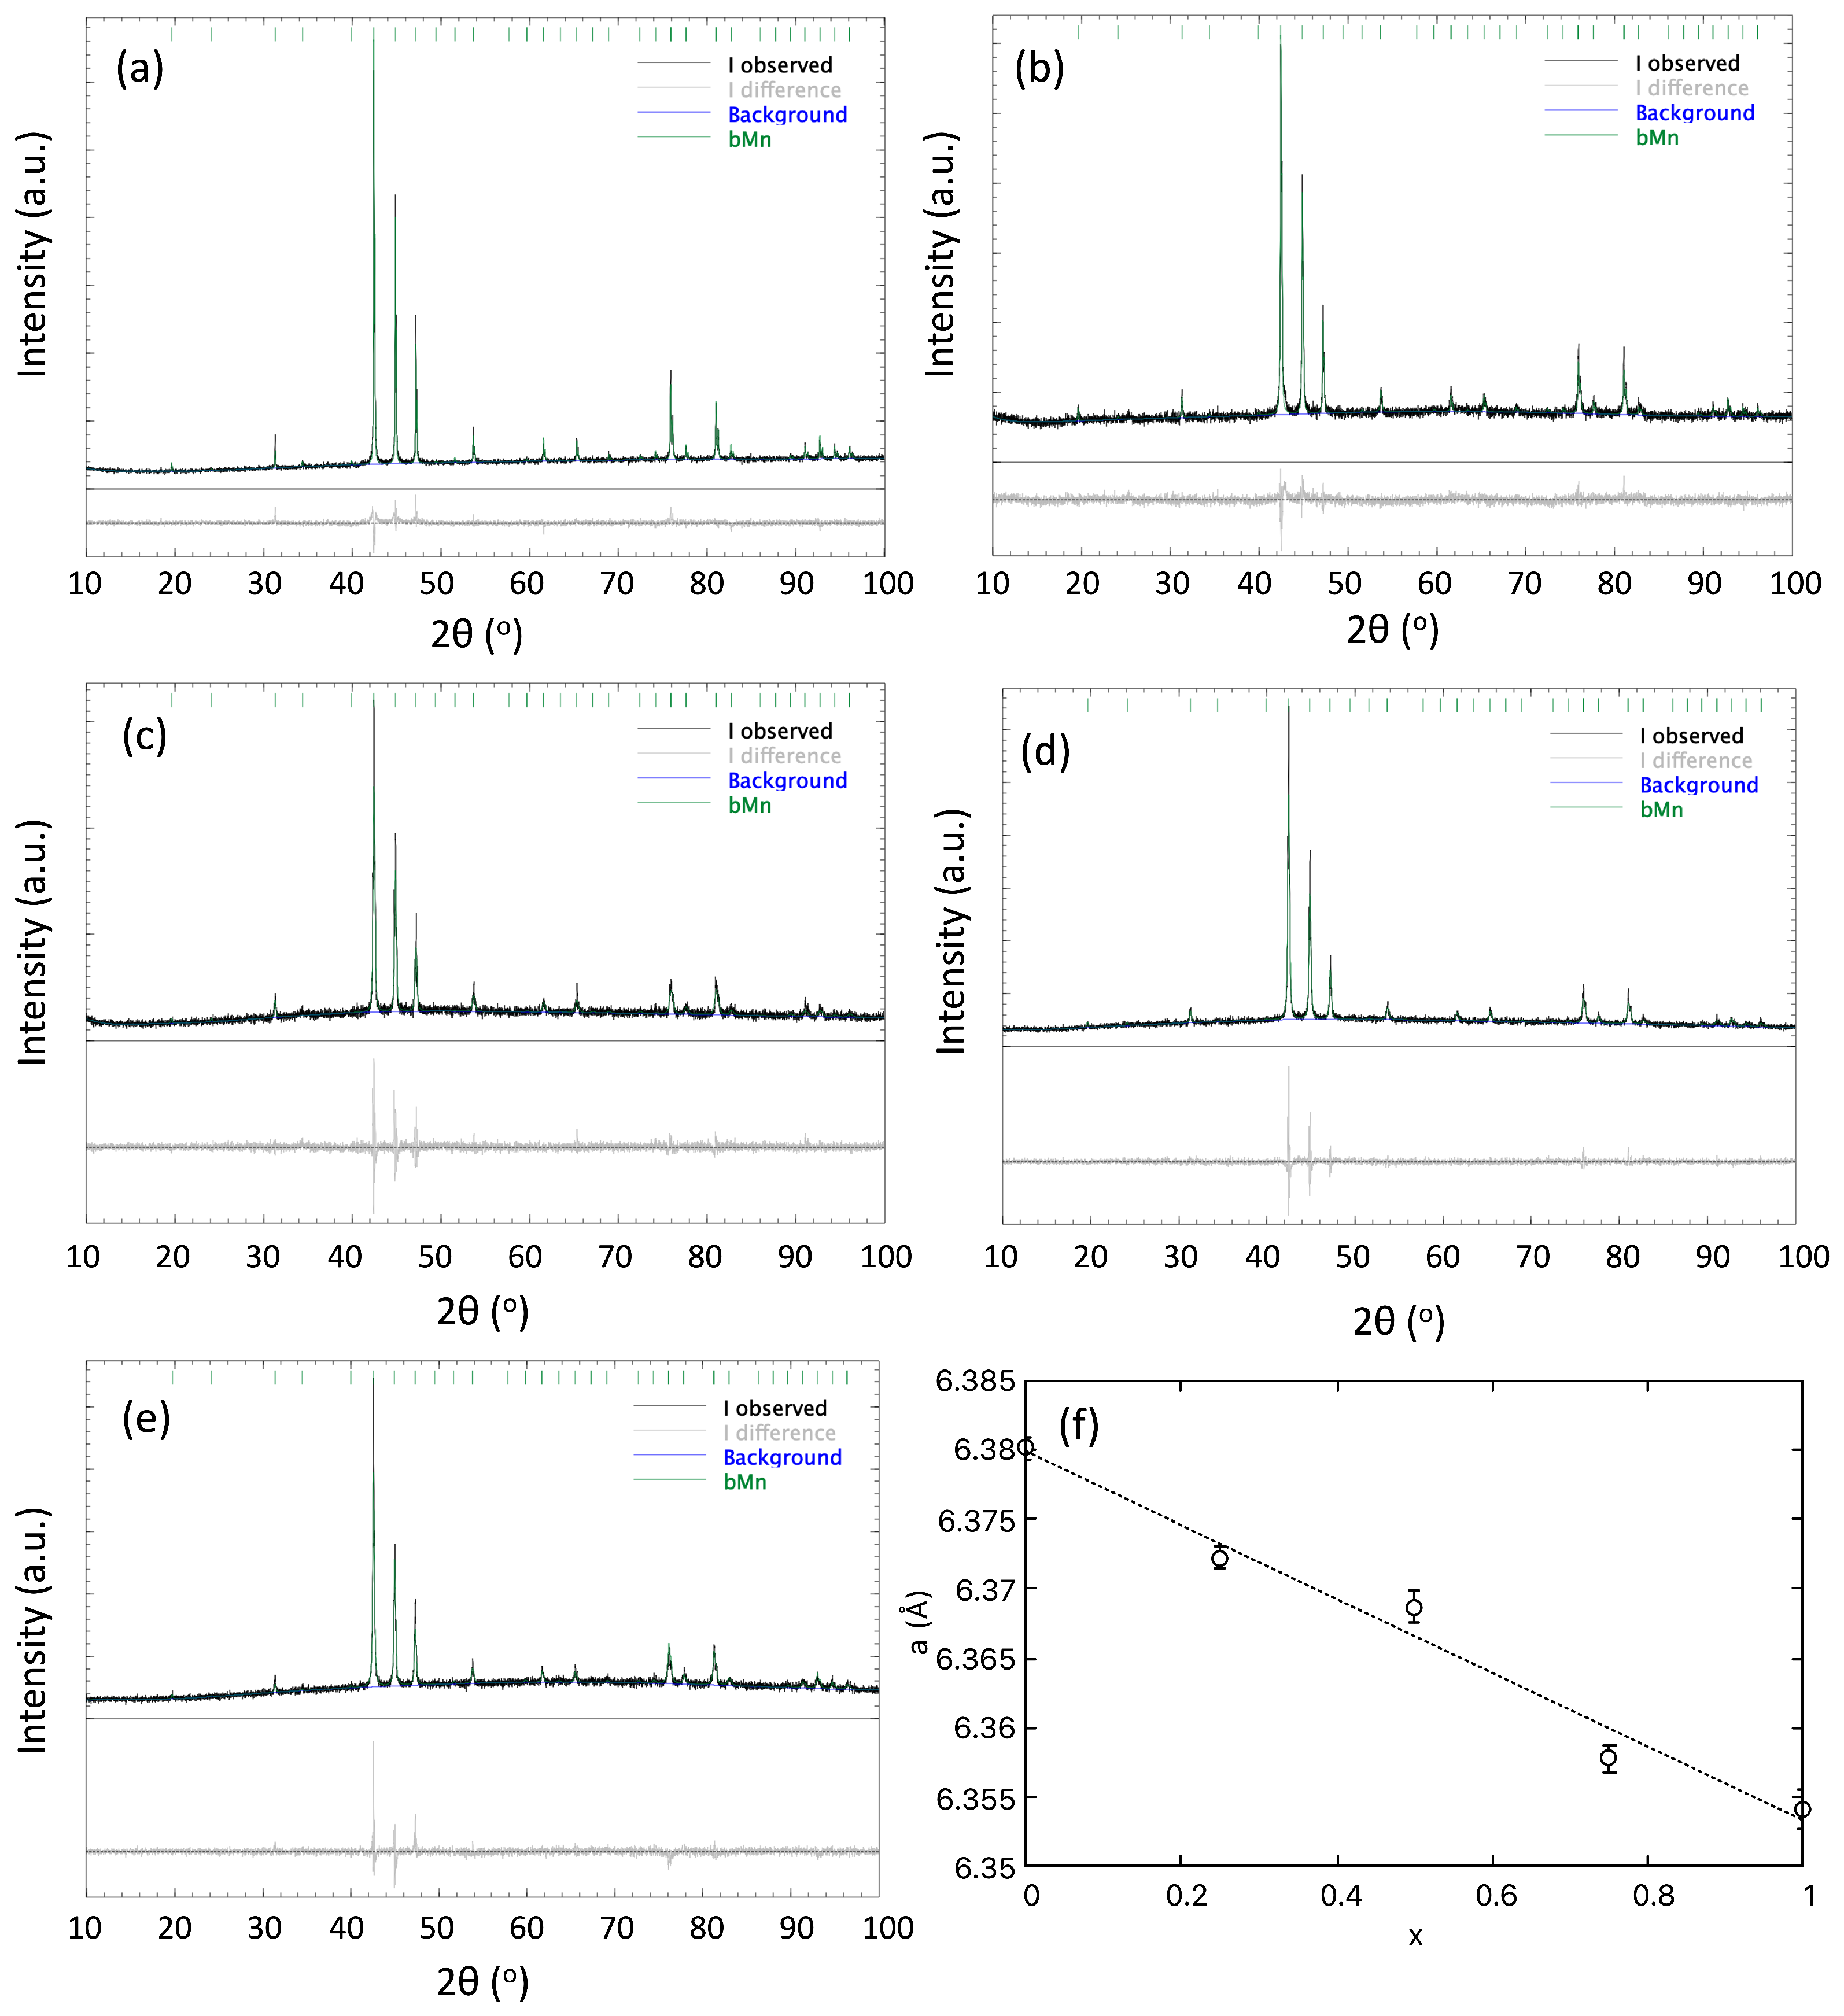
Powder X-ray diffraction (PXRD) data were collected on a Bruker AXS D8 (Karlsruhe, Germany) Advance diffractometer equipped with a Cu tube (K α = 1.5418 Å) in Bragg–Brentano geometry for phase identification and quantification. Finely ground powder samples were deposited on a low-background Si sample holder. Phase identification was performed by a search/match procedure against the JCPDS database. The presence of the β -Mn structure without extraneous phases was confirmed for the prepared five samples. Purity of the samples was further corroborated with a Rietveld refinement of the powder XRD data using the software Profex 5.0 [22], as shown in Figure 3. During refinement, only cell parameters and those related to the assumed Lorentzian size distribution of grain size were allowed to vary; atomic positions and thermal parameters were fixed at the values published for single-crystal XRD data [6]. From the PXRD data it can be inferred that the substitution of Mn by Fe does preserve the chiral space group P 4 1 32 / P 4 3 32 . No additional phases were detected in the diffractograms that could arise from impurities or extraneous phases that could have formed during the synthesis.
As the metallic radius of Fe is slightly smaller than that of Mn, it is expected that the lattice parameter of the Co7Zn7Mn6−xFex alloys decreases as Mn is substituted by Fe. Indeed, the lattice parameter was found to decrease linearly with the Fe content x, as expected from Vegard’s law (Figure 3f). A similar behaviour was found by Menzel et al. in β -Mn-type alloys of Co8Zn8Mn4−xFex stoichiometry [20]. The quality factors of each refinement and the refined lattice parameters are given in Table 1, where R wp = i = 1 n w i ( Y i o b s Y i c a l c ) 2 i = 1 n w i ( Y i Y o b s ) 2 , w i = 1 / σ i 2 is the weighted profile R-factor, R exp = i = 1 n n p i = 1 n w i ( Y i o b s ) 2 is the expected R-factor for n data points and p parameters, χ 2 is the ratio ( R wp / R exp ) 2 , and GOF (goodness of fit), the ratio R wp / R exp .
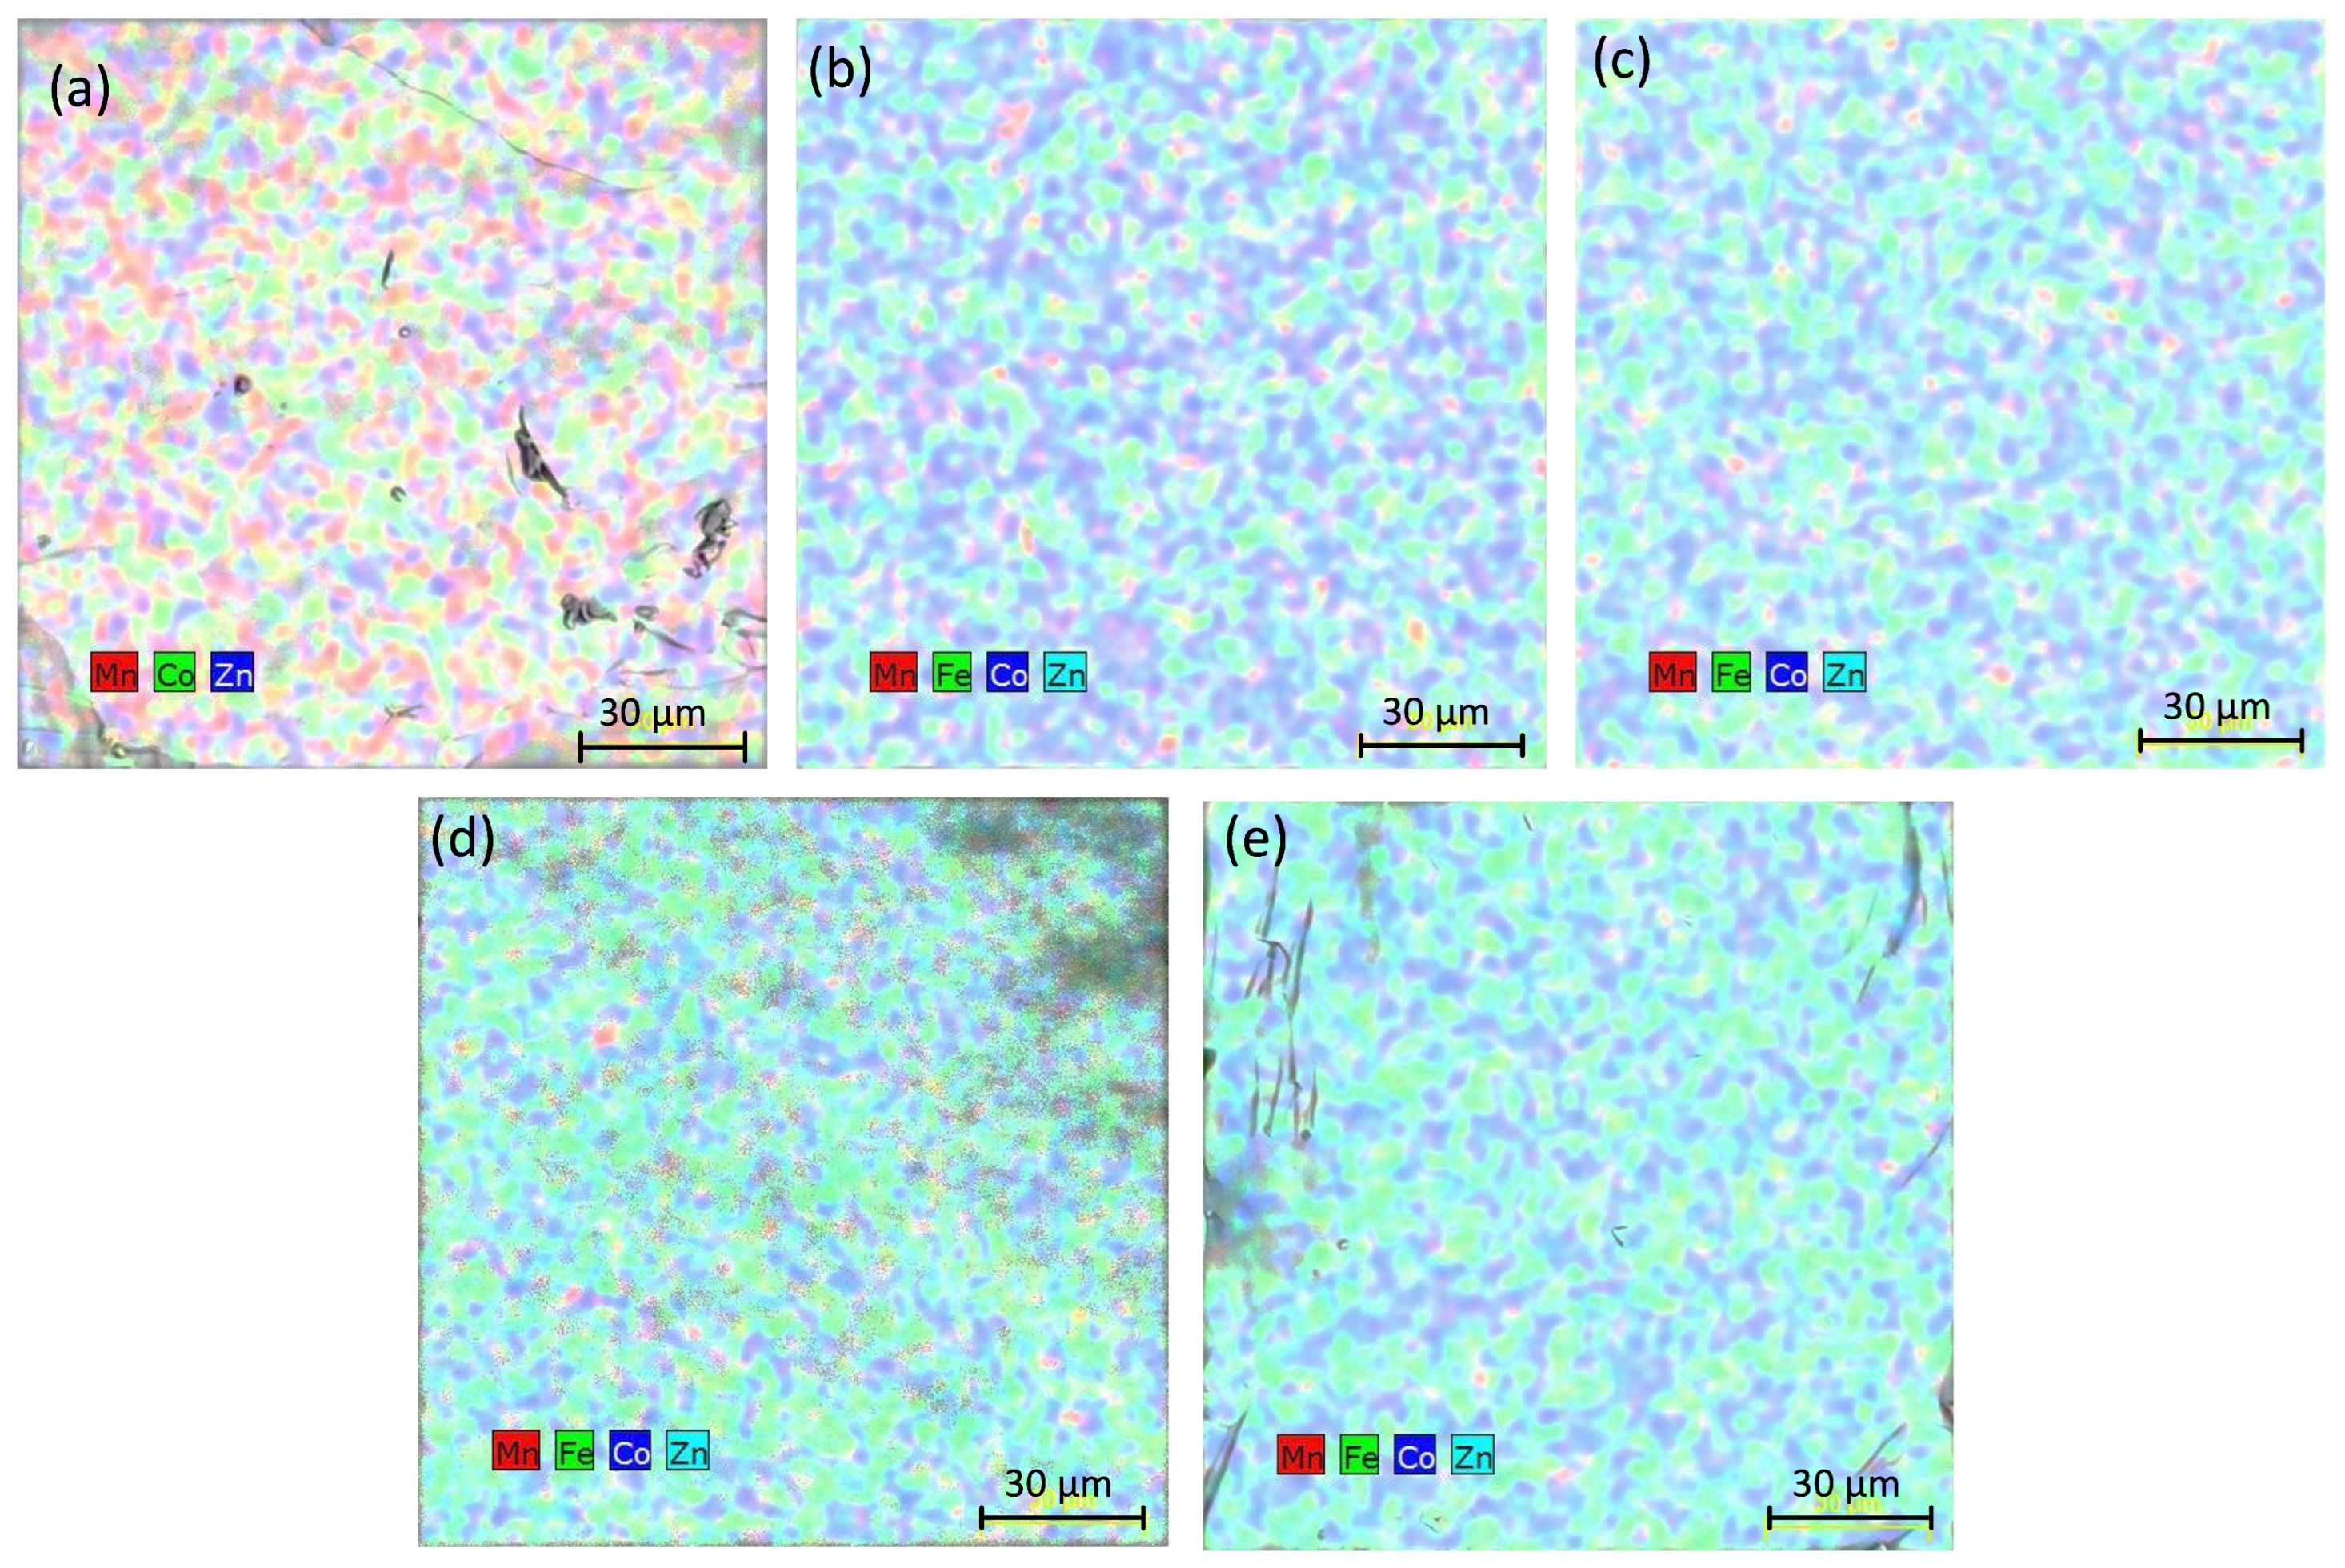
To confirm the composition and the homogeneity of the prepared samples, single-crystal specimens were also examined on a TESCAN Vega3 SBH SEM by EDS mapping using a XFlash 410M detector (Brucker, Karlsruhe, Germany). The EDS elemental maps (Figure 4) show the Mn, Co, Zn, and Fe signals uniformly distributed, confirming the homogeneity.
A quantitative analysis of composition by EDS was also undertaken with the electron beam of 20 keV impinging on different points on the surface of the analysed samples. The average elemental composition determined from the analysis, using a P/B-ZAF fundamentals approach method, is given in Table 2 and was found to be close to nominal, stoichiometric, values. The small deviations from the nominal compositions are not considered significant as they are within the typical ‘ 3 σ ’ error bar of this technique.

3.2. Magnetisation Studies

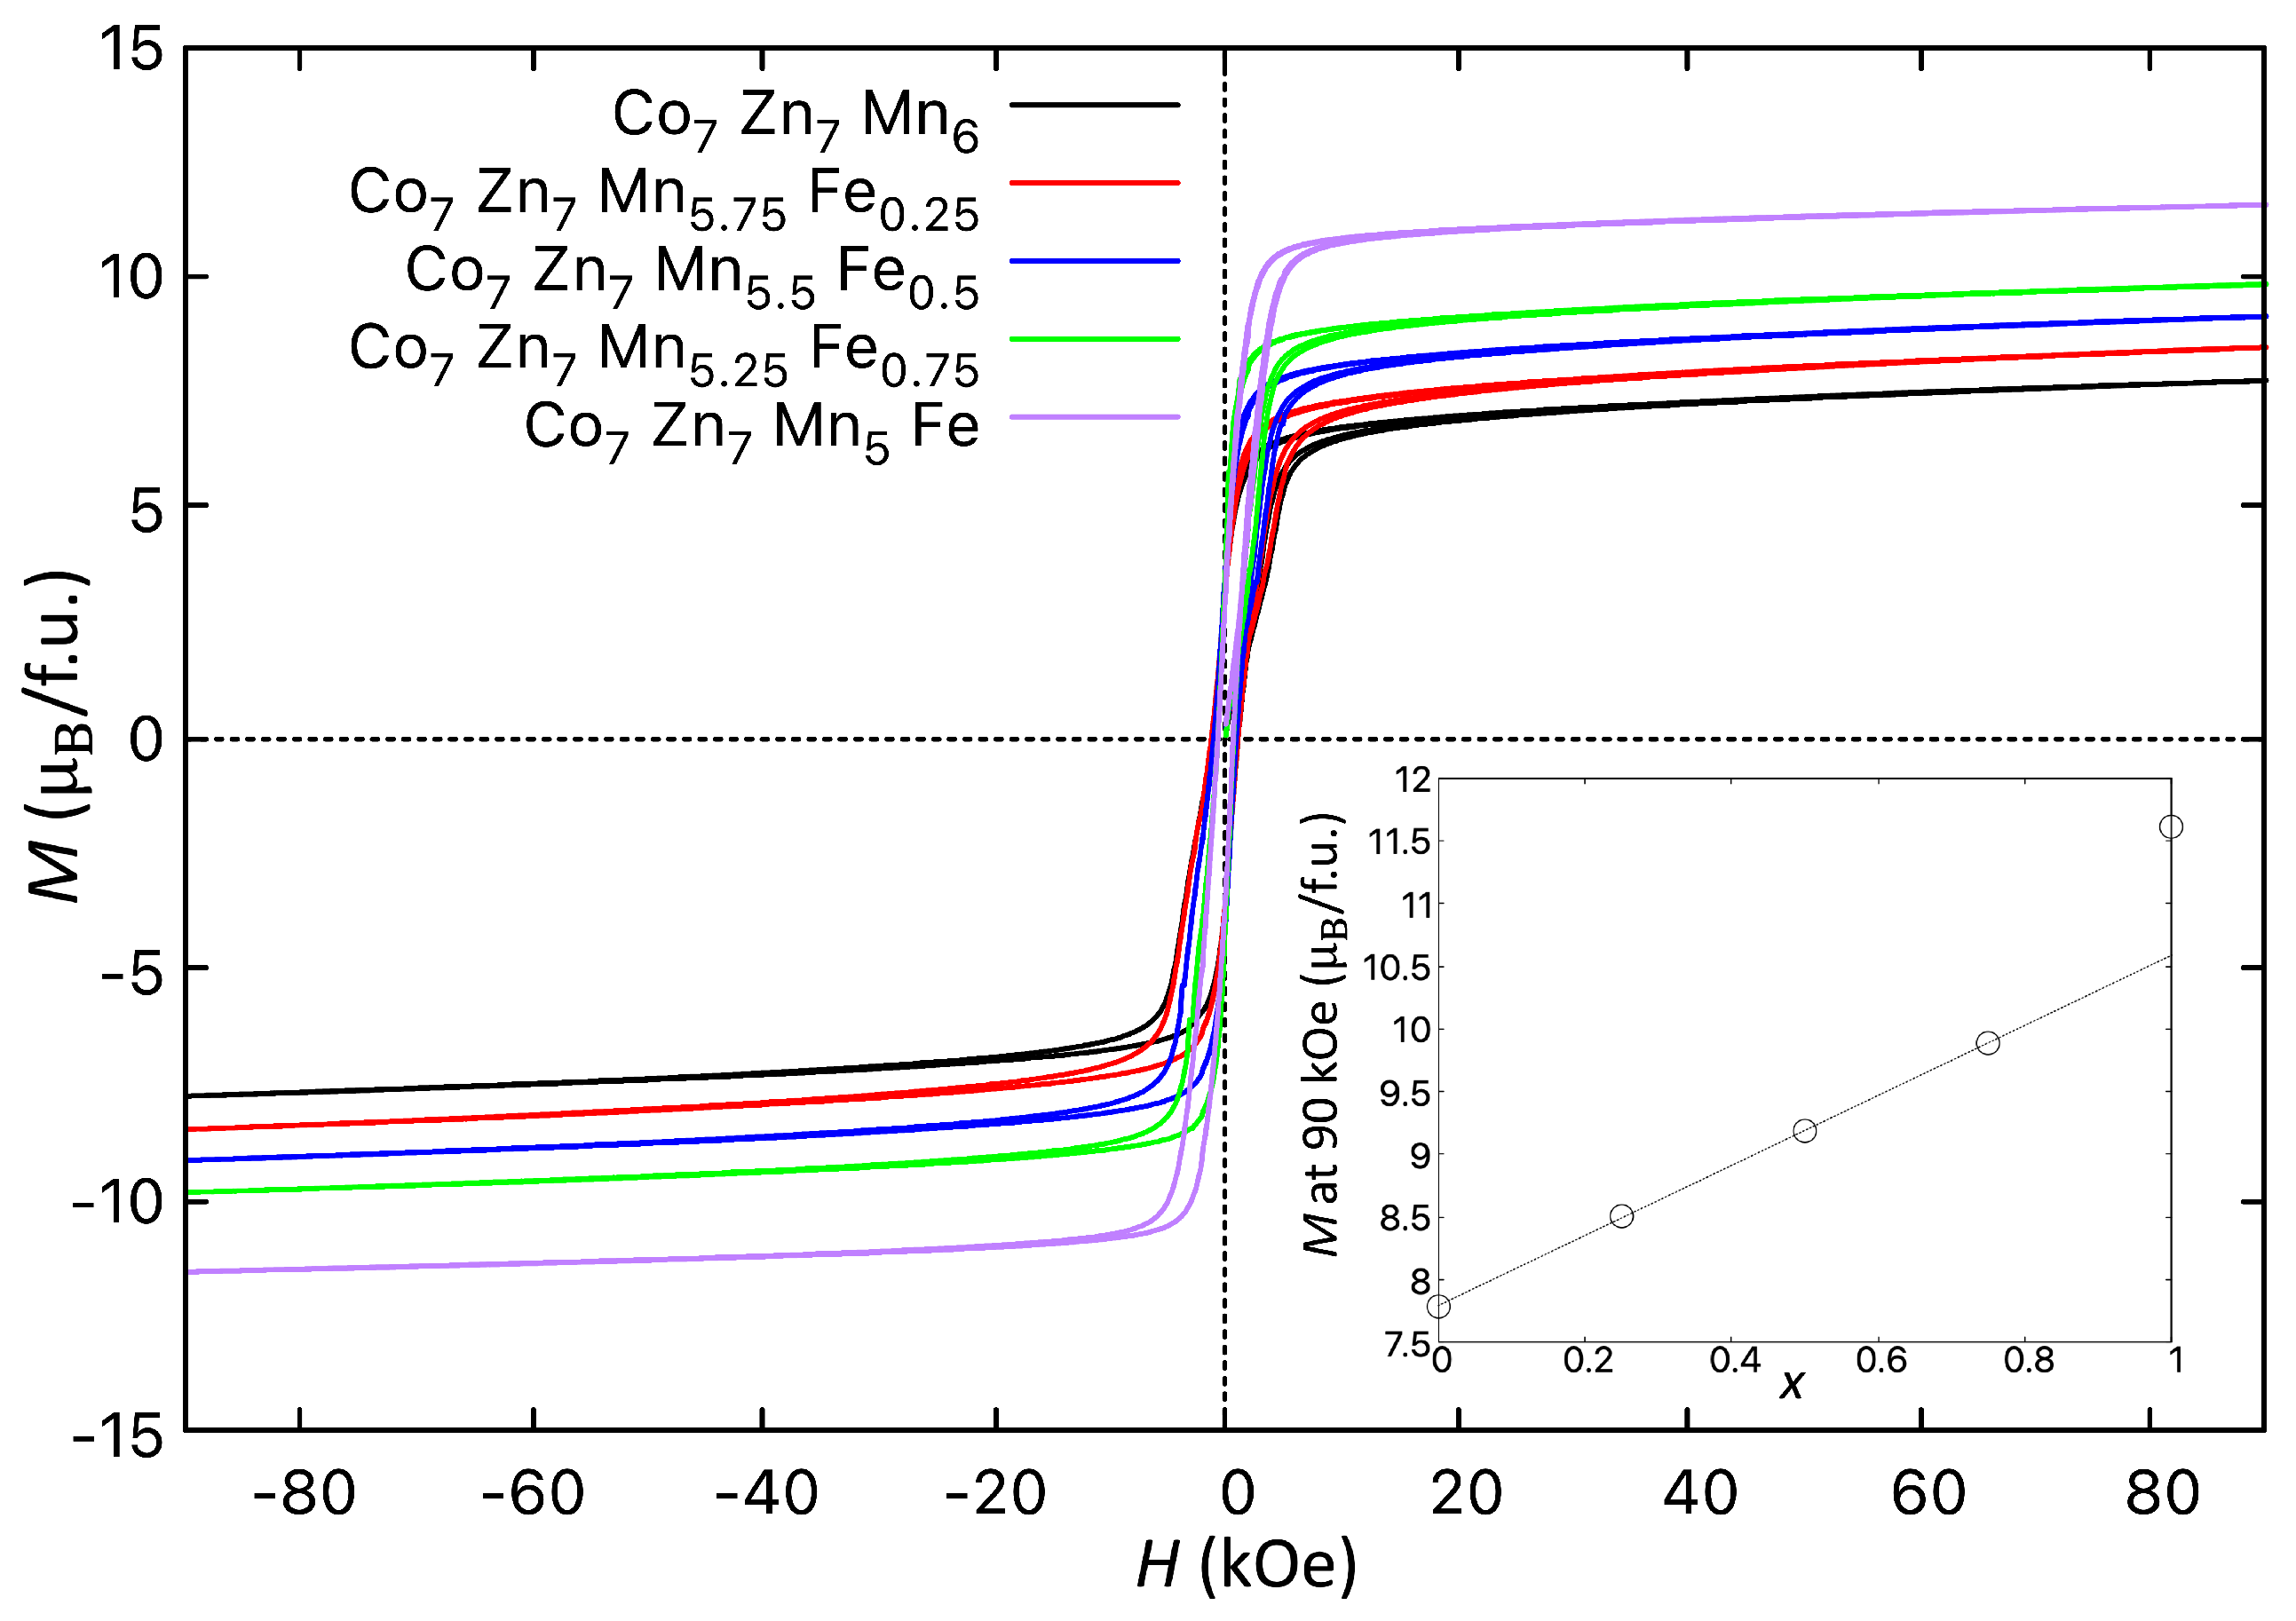
M ( T ) and M ( H ) measurements were performed in a cryogen free Dynacool Quantum Design 9 T PPMS system equipped with a Vibrating Sample Magnetometer (VSM) option. Polycrystalline samples with weights between 2 and 25 mg were packed in a Teflon sample holder. Full M(H) hysteresis cycles were first performed at 2 K for the five compositions, represented in Figure 5. The coercivity, remanence, and magnetisation at 90 kOe derived from the hysteresis cycles are given in Table 3. The magnetic moment per formula unit determined from the magnetisation measured at 90 kOe is represented as a function of the Fe content in the inset of Figure 5. It increases almost linearly up to x = 0.75 ; the value at the end composition ( x = 1 ) is significantly higher than the extrapolated value from the linear region. We have rechecked that no error was made in the normalisation of the measured moments to the masses of each sample. Thus, it would be interesting to measure the evolution of the magnetisation of samples with smaller Mn content ( 0.75 < x < 1 ) in further investigations.
The measured hysteresis cycles denote ferromagnetic behaviour for all compositions, and it is observed that as the Fe content increases, the hysteresis loops become narrower with the coercivity decreasing from ∼1300 Oe for Co7Zn7Mn6 down to roughly half this value for the end composition Co7Zn7Mn5Fe. The remanence and the magnetisation measured at 90 kOe increase as the Fe content increases, but even at the highest applied field, the magnetisation is not yet fully saturated. For all compositions, the slope of the M ( H ) curves in the high field region being (per formula unit) 0.02  μ B /kOe.
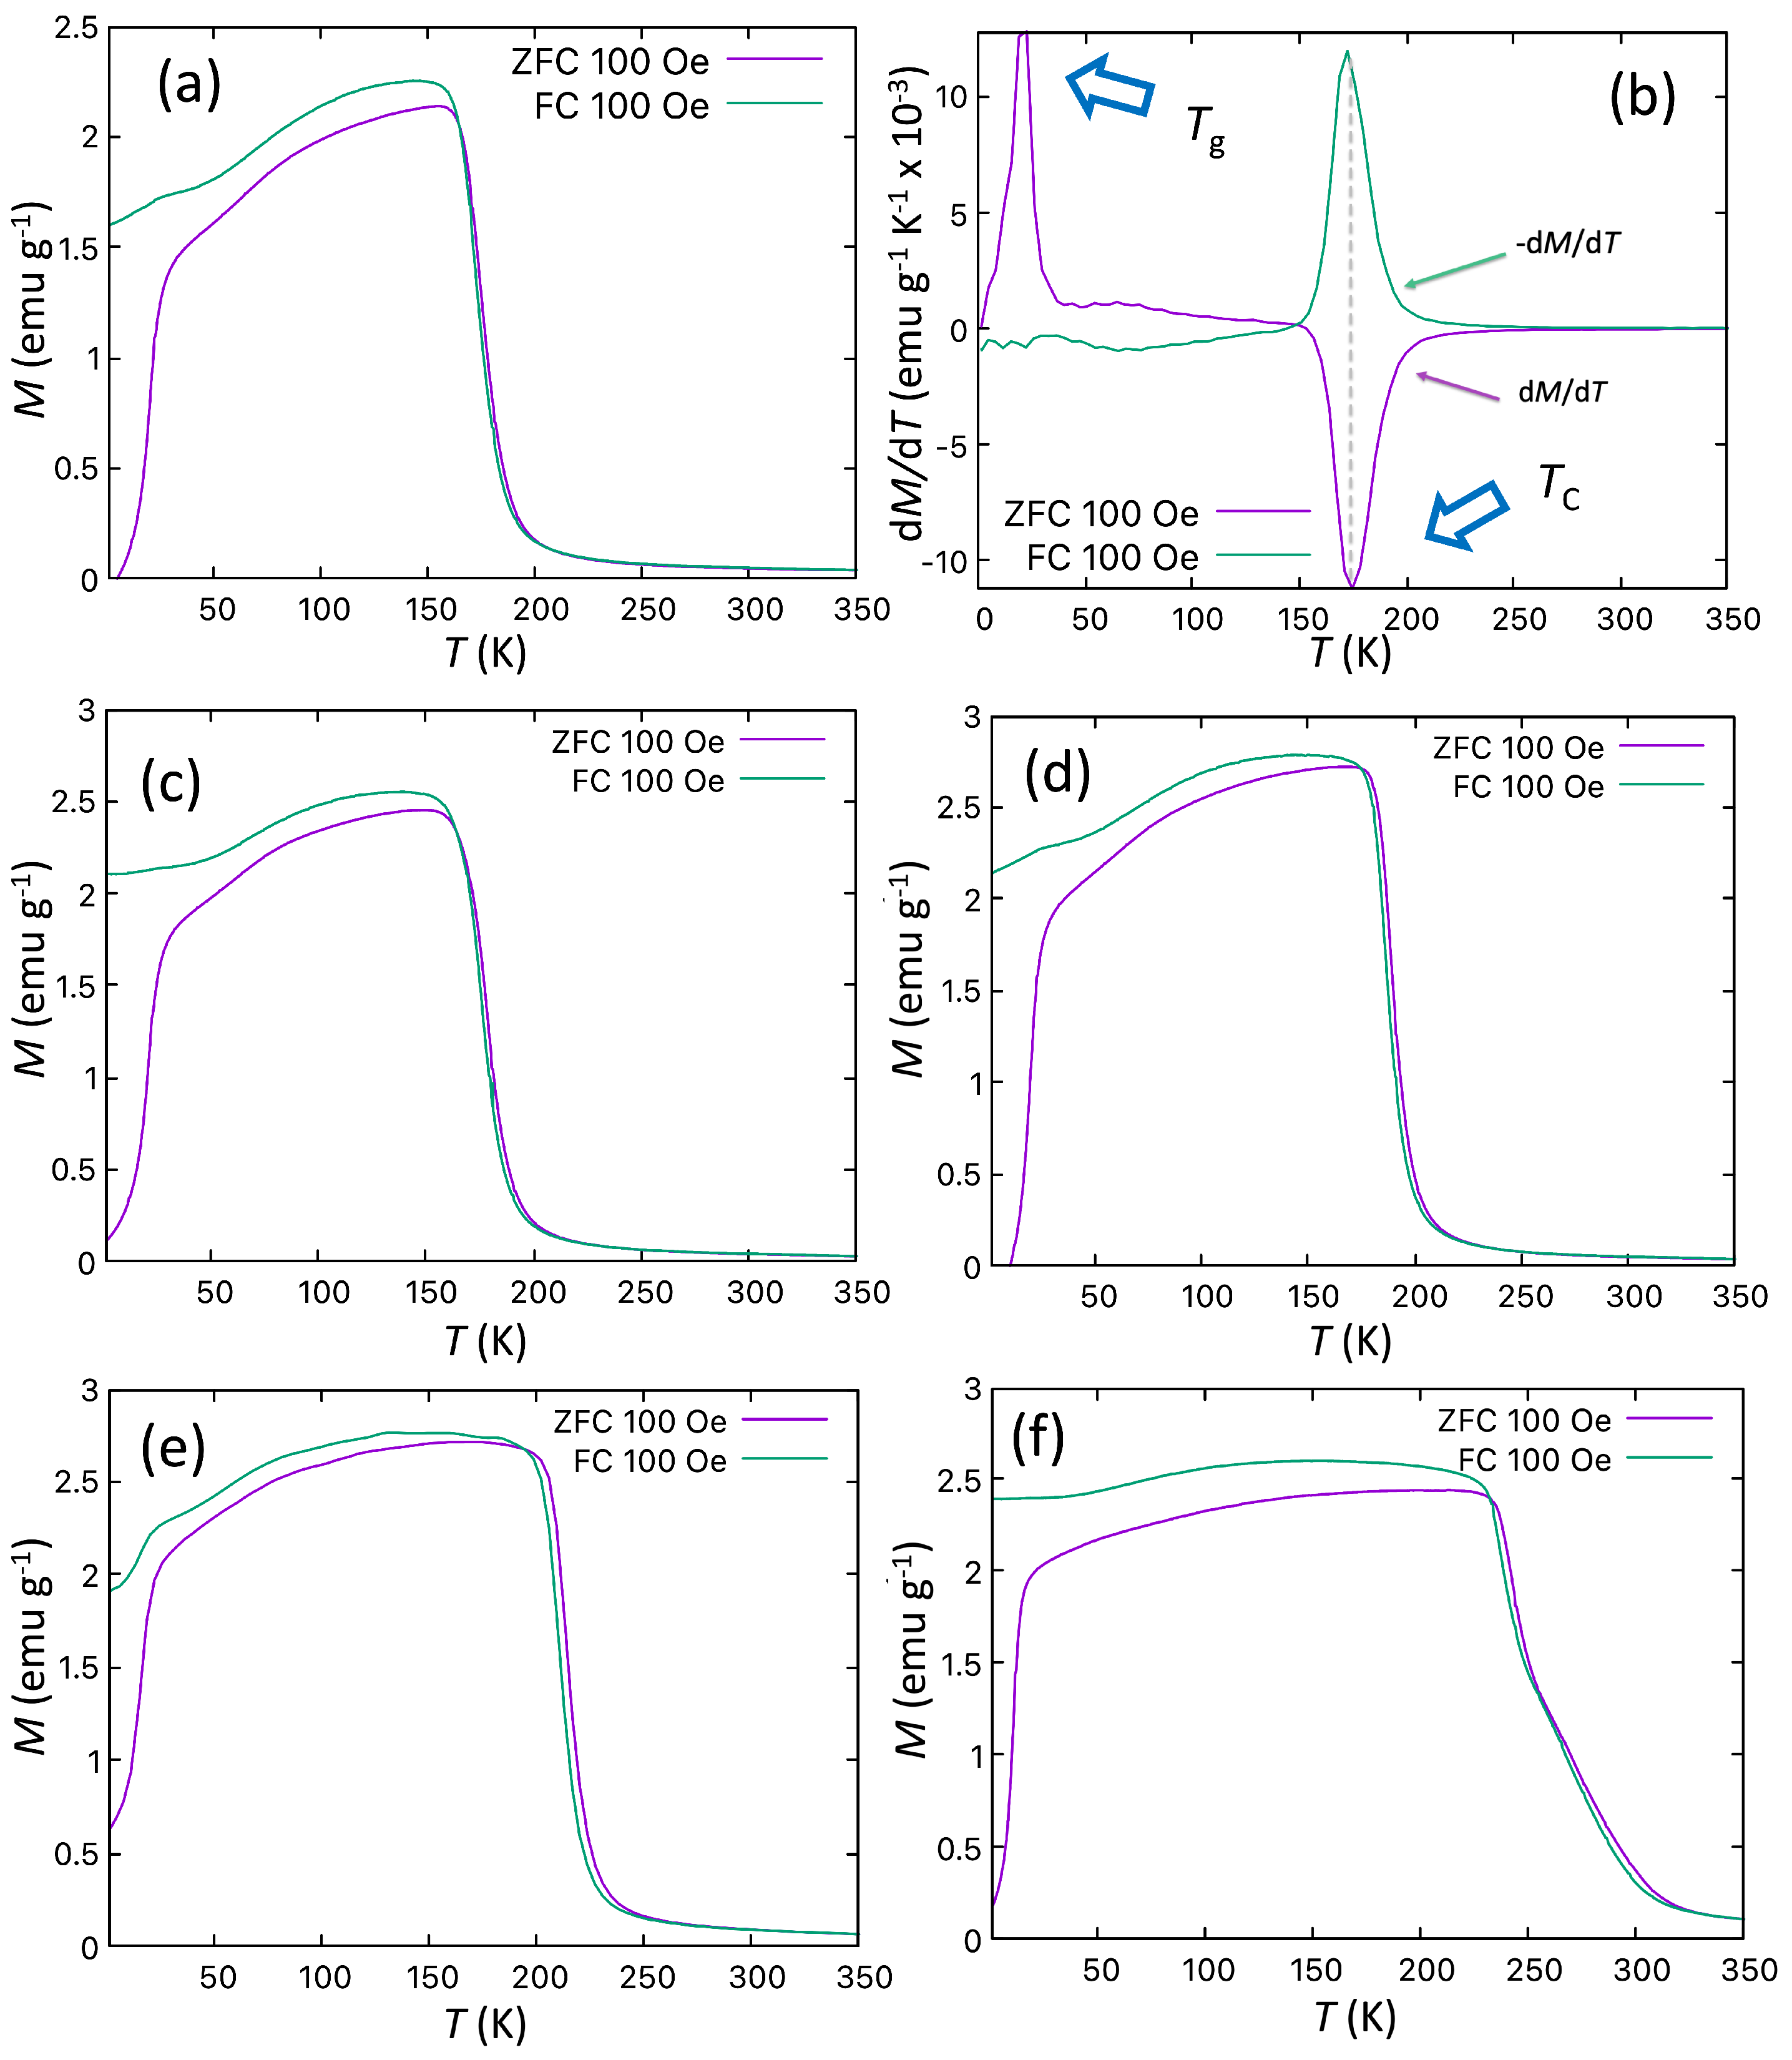
ZFC (Zero-field Cooled) and FC (Field Cooled) thermomagnetic curves, M(T), were also measured for all samples, under a small applied magnetic field of H = 100 Oe. The obtained curves are shown in Figure 6 that also depicts, for the pure Co7Zn7Mn6, the dM/dT curves plotted as a function of temperature. For clarity, the data corresponding to the FC measurement are represented as d M / d T . Two anomalies in the derivatives are observed that were tentatively assigned to the Curie temperature, T C , and to the freezing temperature, T g , of the glassy state.
These thermomagnetic curves show that increasing the Fe content in Co7Zn7Mn6−xFex tends to increase the Curie temperature T C , as expected. A similar situation was also observed in studies of the Co8Zn8Mn4−xFex system reported by Menzel et al. [20]. Moreover, a remarkable difference between ZFC and FC curves at low temperatures, denoting irreversible behaviour, is also observed in all alloys, one of the signatures of spin glass behaviour.
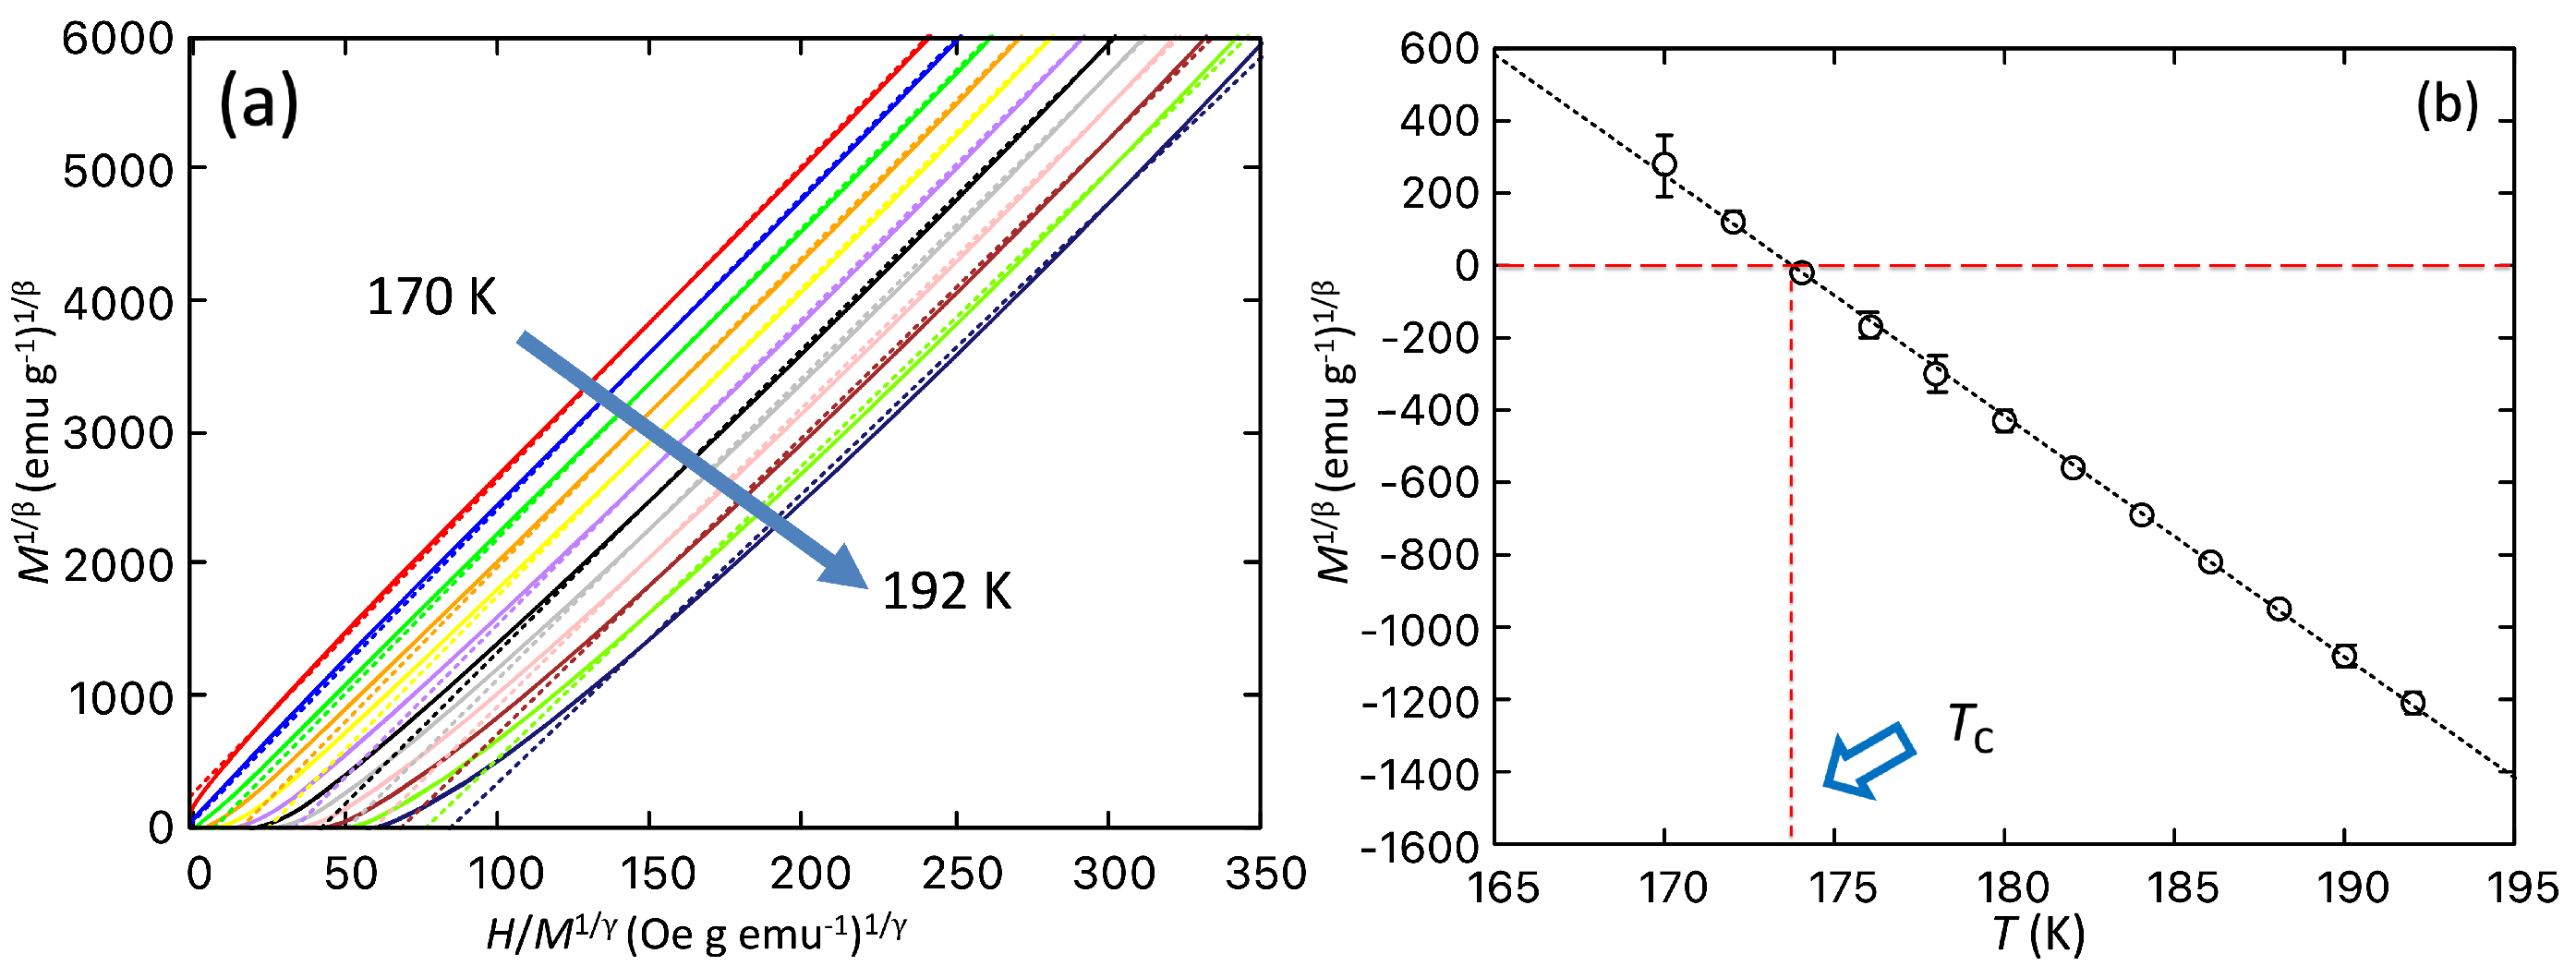
To precisely determine T C , the Arrott method was used in the modified formulation known as the Arrott–Noakes method [23]. For a second order magnetic transition with critical exponents β and γ , it is expected that M 1 / β will be linear with respect to ( H / M ) 1 / γ for temperatures in the vicinity of T C . The curves representing the linear dependence of M 1 / β vs. ( H / M ) 1 / γ should be straight and parallel to each other in the high magnetic field region. These lines have a positive slope and the line passing through the origin is that corresponding to T = T C [24,25]. The values of the exponents β and γ of the second order phase transition on a ferromagnet only depend on the symmetry of the order parameter and on the lattice dimensionality of the system, and they can be classified into different universality classes. In a Landau mean field approach, such exponents take the values β = 0.5 and γ = 1. If such a model applies, M 2 will be linear with respect to the variable H / M , close to T C .
In the case of Co7Zn7Mn6, as with the majority of ferromagnetic materials, the Landau mean-field theory is just a crude approximation. Other models such as the 3D Heisenberg ( β = 0.365, γ = 1.386) [26], the 3D Ising ( β = 0.325, γ = 1.24) [26], the 3D XY ( β = 0.345, γ = 1.316) [27], and the tricritical mean-field model ( β = 0.25, γ = 1.0) [28] may be more appropriate for the Arrott plot analysis. The Arrott–Noakes plot extends the usual Arrott plot by using values of the critical parameters different from the mean-field values.
As in Co7Zn7Mn6, using the 3D Heisenberg model ( β = 0.365, γ = 1.386) for the Fe substituted samples gave the best representation of the data in the Arrott–Noakes plot (widest range of straight line behaviour), shown in Figure 7.
Table 4 gathers the T C values for the Co7Zn7Mn6−xFex samples obtained from the Arrott–Noakes plots that are close to those than can be derived (with lower accuracy) from the dM/dT curves. The dependence of T C on the Fe content x is plotted in Figure 8. It is observed that such dependence follows approximately a quadratic dependence on the Fe content.

3.3. AC Susceptibility Measurements

AC susceptibility measurements were performed using the ACMS II option of the Quantum Design PPMS system with H AC = 5 Oe. Small randomly orientated crystals of each alloy with weights between 2 and 5 mg, were glued to a low-background quartz sample holder for such measurements.
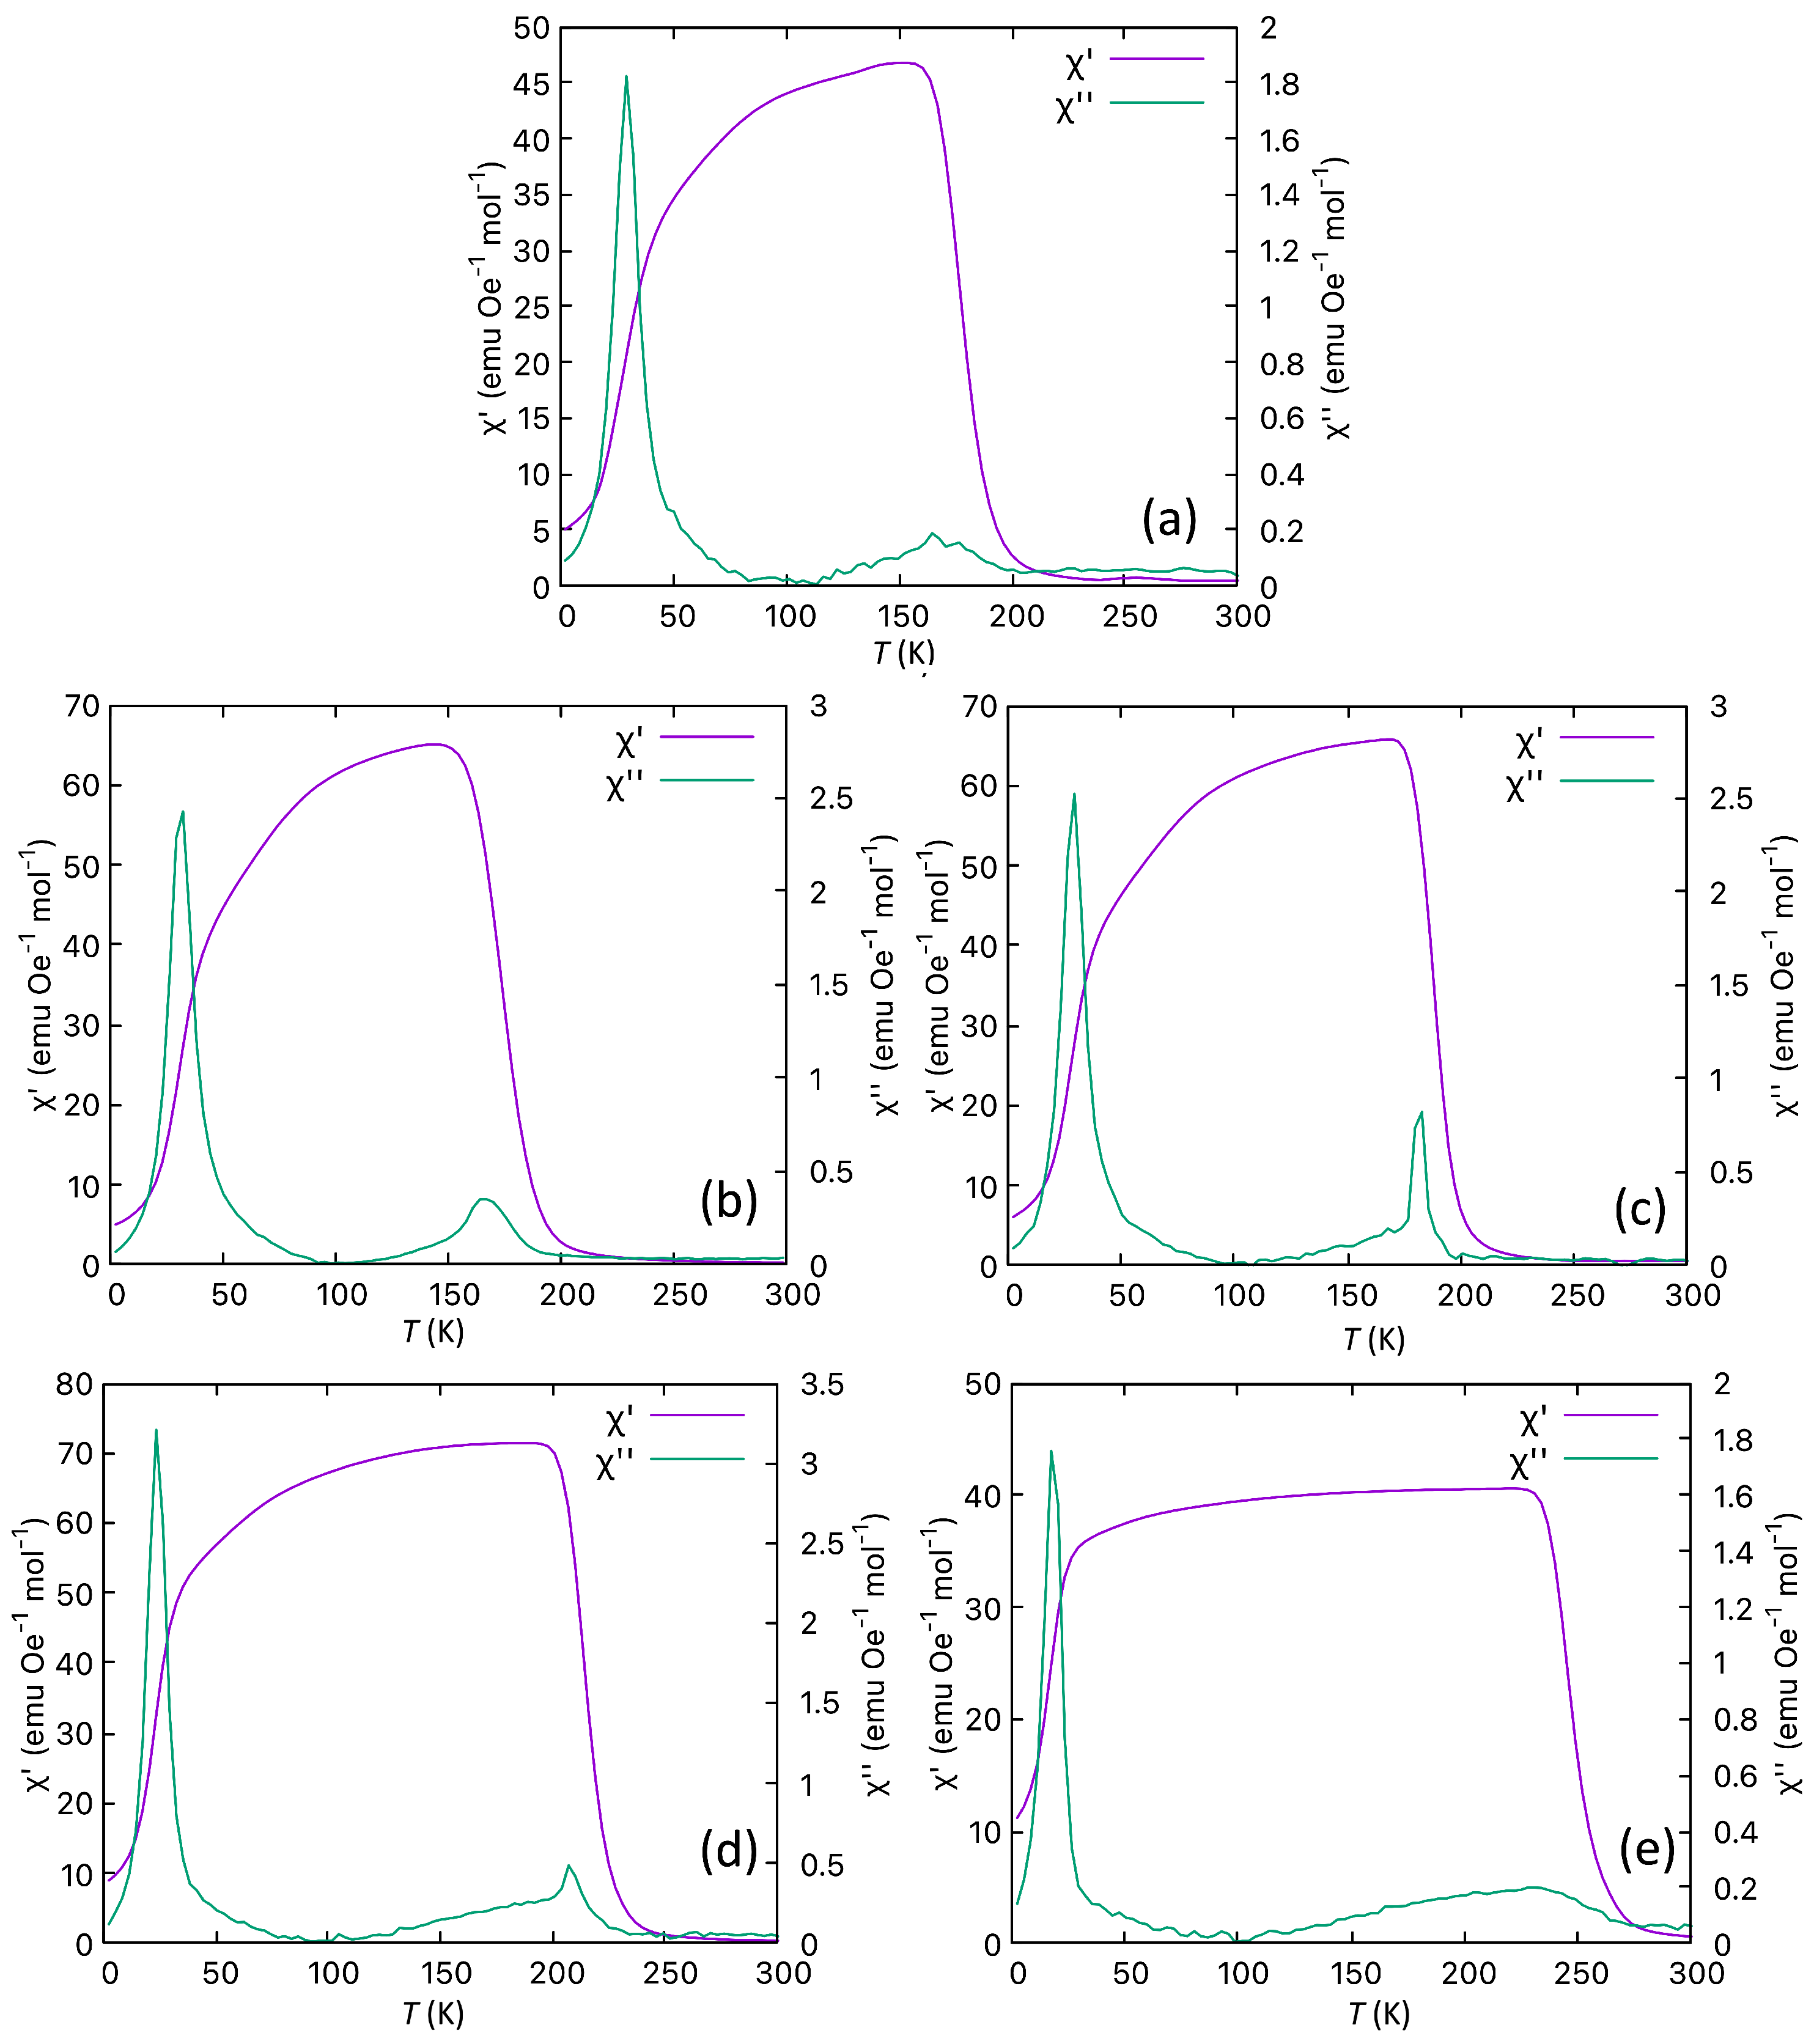
The temperature dependence of the real ( χ ) and imaginary ( χ ) components of the AC susceptibility measured with f = 1000 Hz and H DC = 0 are represented in Figure 9 for all the five alloys.
The χ component of the AC susceptibility curves is consistent with the ZFC M(T) curves represented in Figure 6. In the χ curves of each of the four samples, one can observe a sharp peak associated with the reentrant spin glass transition, as was also observed in pure Co7Zn7Mn6. Such peak deviates to lower temperatures as the Fe content increases, which is similar to the low temperature peak observed in the dM/dT ZFC curves represented in Figure 6b. Also, a small peak close to T C is observed in the χ component of AC susceptibility. In contrast to the sharp peak observed at lower temperatures, this small peak deviates to higher temperatures as the Fe content increases, reassembling the behaviour of the high temperature peak found in the ZFC-FC dM/dT curves.
To investigate in detail the spin glass transition and the possible emergence of skyrmions close to T C , AC susceptibility measurements as a function of temperature and frequency were performed for each individual sample.

3.3.1. Evidence for a Reentrant Spin Glass Phase

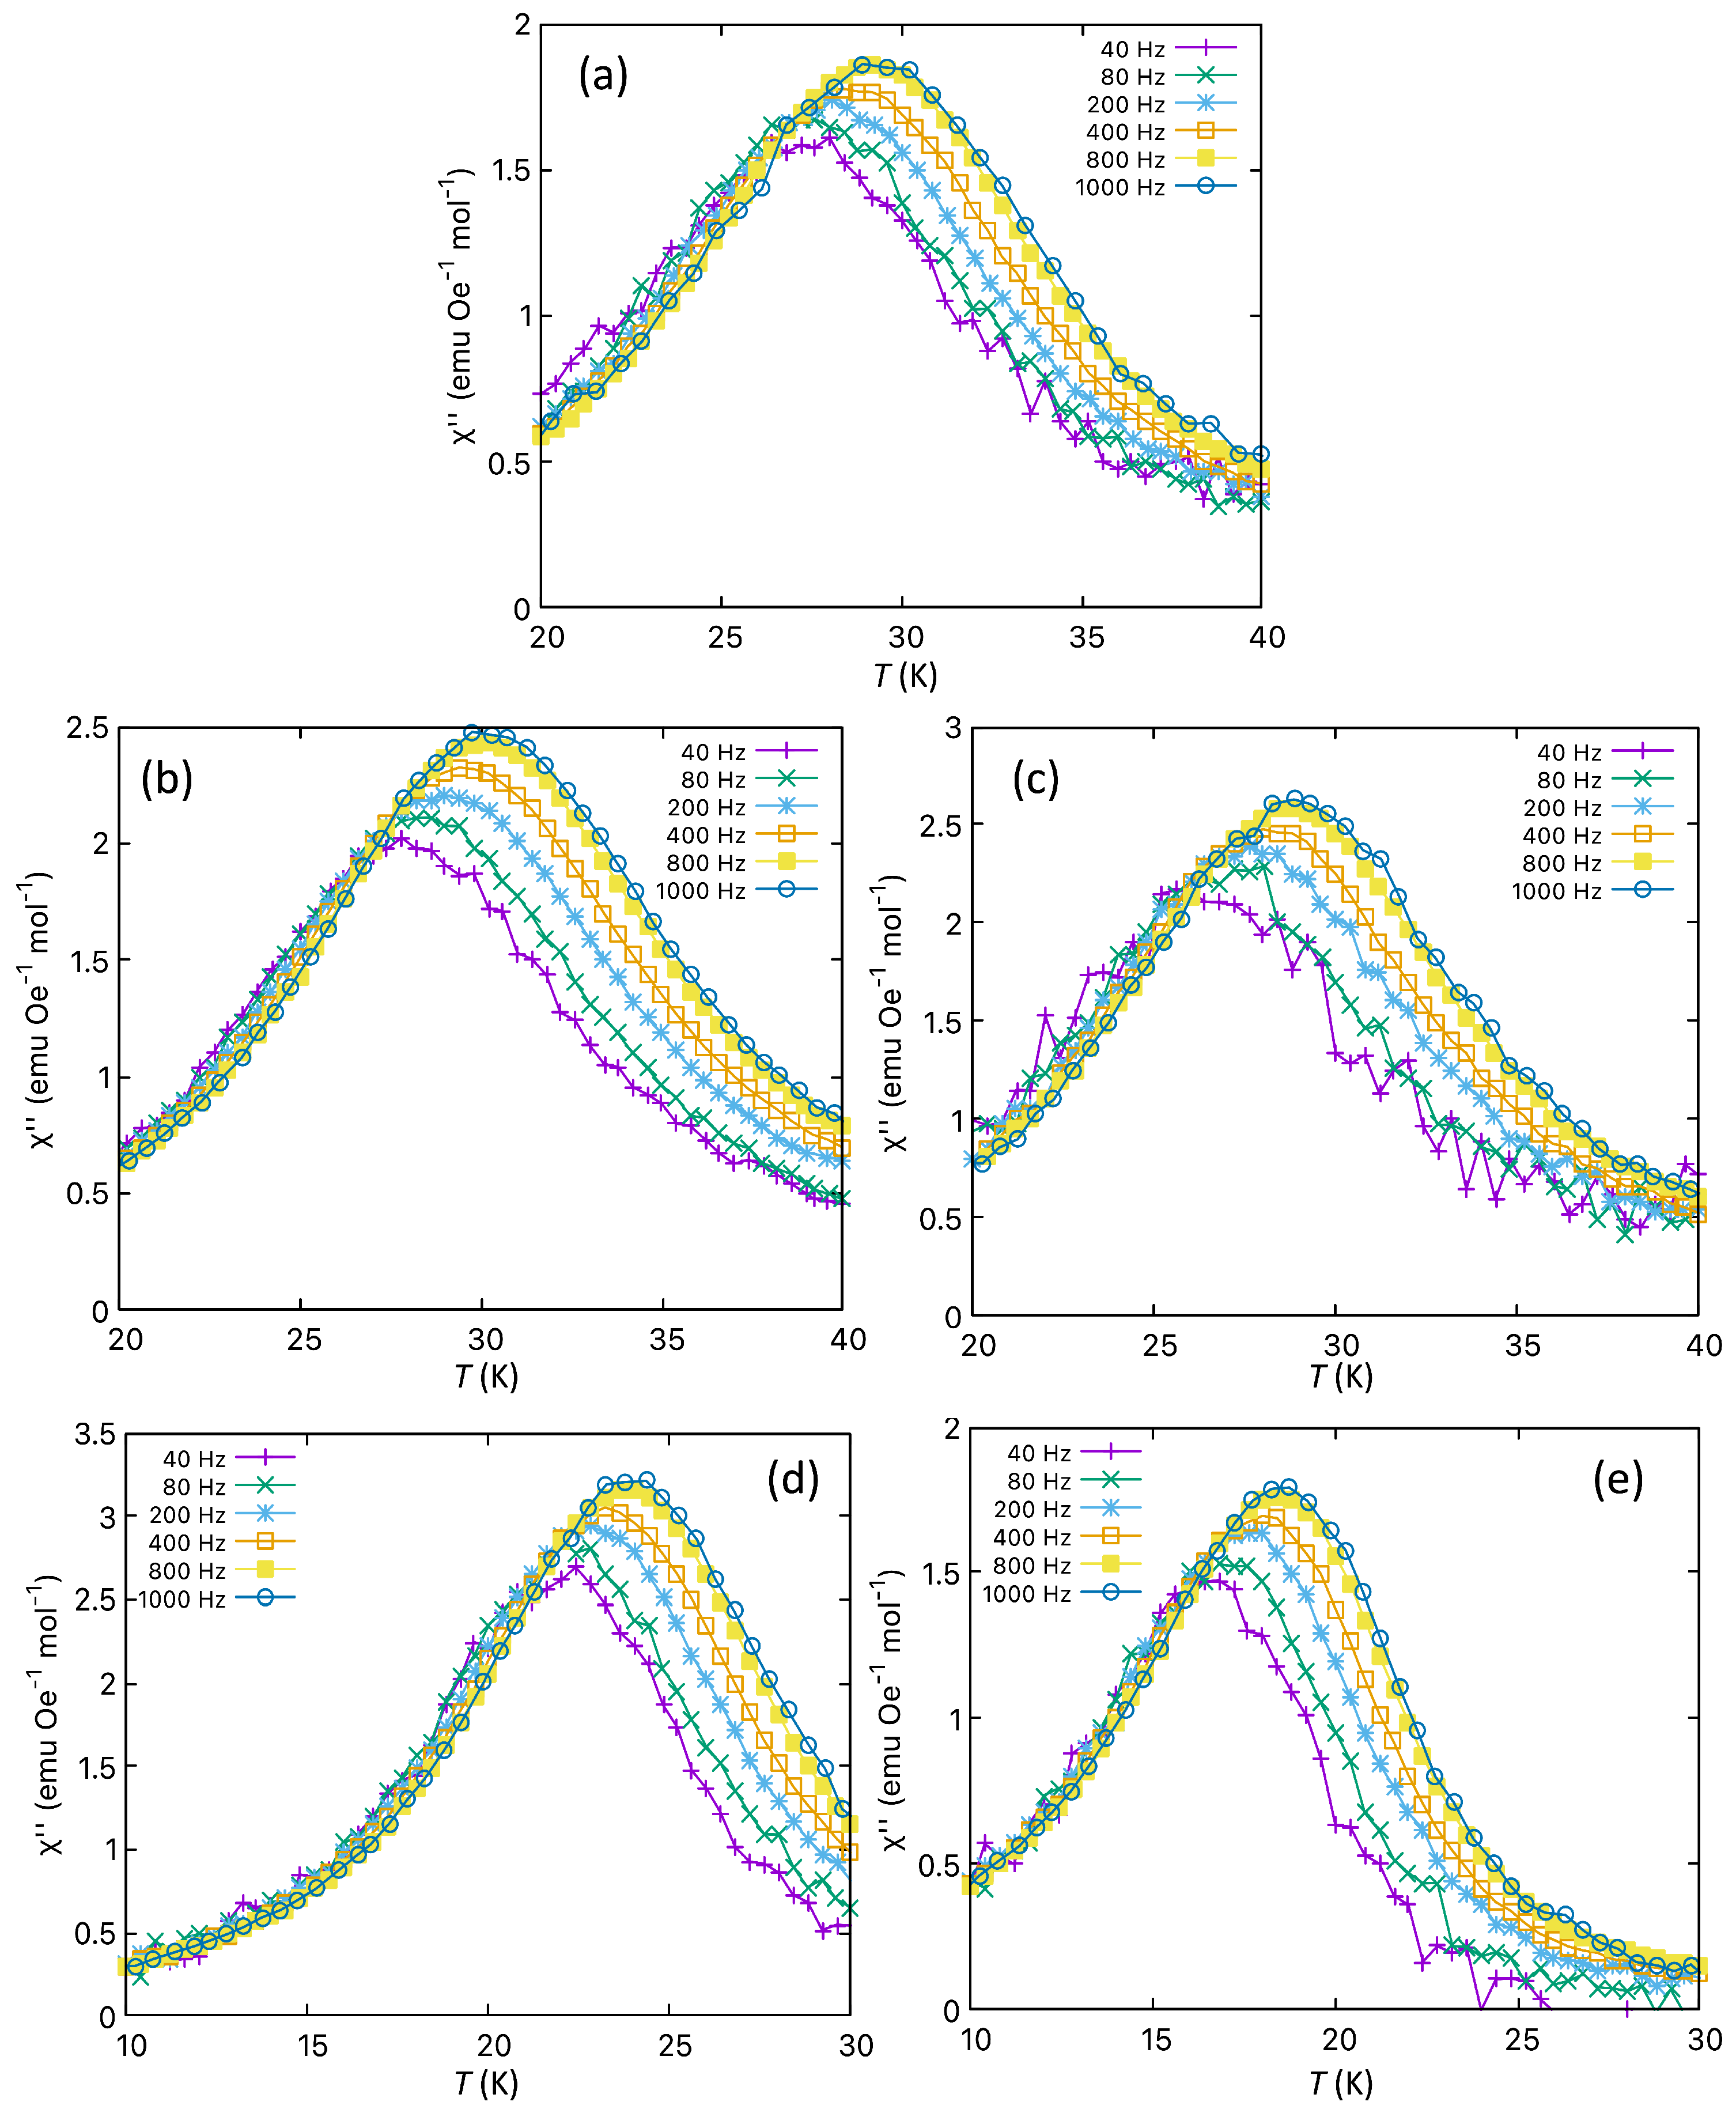
Detailed AC susceptibility measurements were performed at a range of frequencies in the small temperature interval where the reentrant spin glass transition might occur. The imaginary ( χ ) component of AC susceptibility at low temperature measured with frequencies between 40 Hz and 1000 Hz is shown in Figure 10. In the low temperature region, a broad peak was always found, corresponding to the dissipative processes occurring in the glassy phase that is maximum at the freezing temperature T f .
For all five samples, the χ peak deviates to higher temperatures as the frequency of the driving AC field increases. This is the expected behaviour [29,30] for a peak originating at the freezing temperature, so it can be assumed that the substitution of Mn by Fe preserves the glassy phase.
The shift of freezing temperature T f as a function of frequency f is typical of spin glasses and can be expressed by the Mydosh parameter ϕ [17]. This parameter quantifies the relative shift of T f , and it is defined by the following expression:
ϕ = Δ T f T f Δ log 10 ( f ) .
The value of the Mydosh parameter should lie below 0.01 for classical (canonical) spin glasses. In the case of cluster and reentrant spin glasses, the Mydosh parameter typically lies between 0.01 and 0.1. Values above 0.1 are found in other magnetic systems such as superparamagnets [29].
In contrast to ordinary (canonical) spin glasses, reentrant spin glasses are ferromagnetic below their T C , but they transform at a lower temperature into a frozen state (at T f ) [17,18]. In contrast, cluster spin glasses are systems where the spins are locally ordered, creating small domains which interact with each other, having a role similar to that of single spins in canonical spin glasses [31].
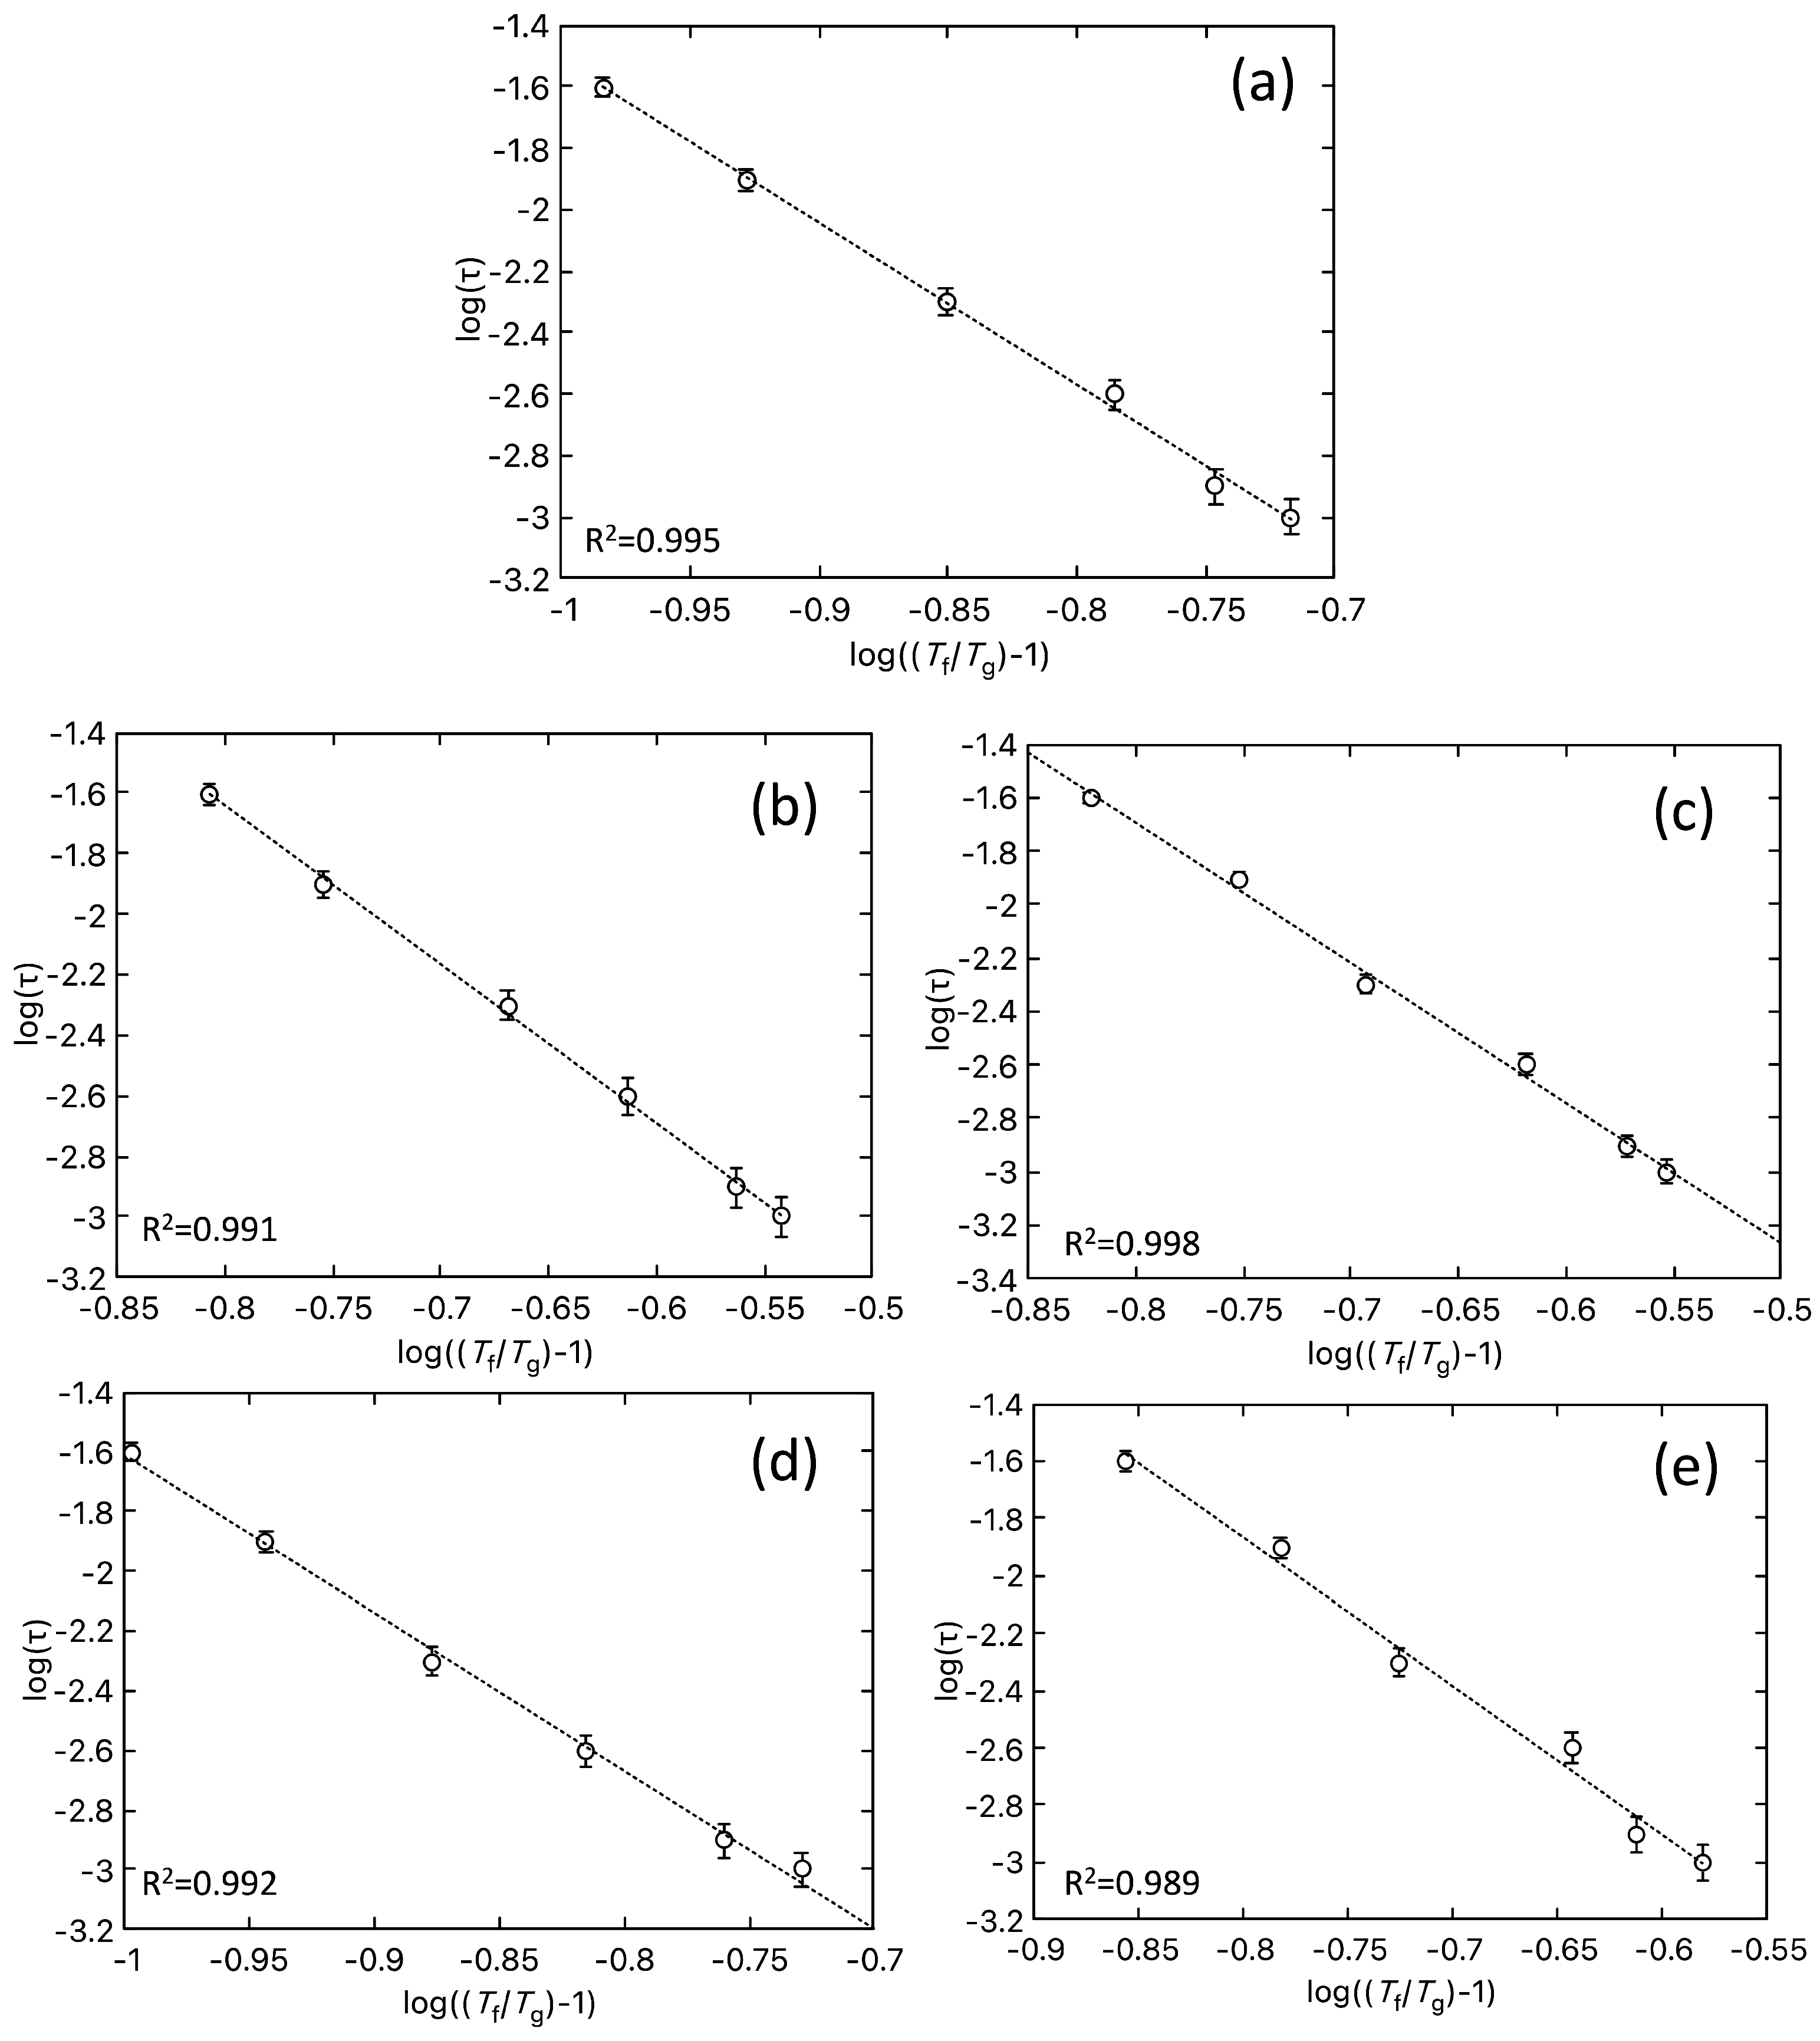
In canonical spin glass systems, the standard critical model can be used to describe the frequency dependence of T f , where the characteristic relaxation time τ = 2 π / ω = f 1 is expected to diverge at a critical temperature. This should follow a power-law given by the equation
τ = τ T f T g T g z v ,
where τ is the relaxation time of a single spin-flip [32], T f the temperature at which χ or χ exhibits a maximum or an inflexion point on the curvature for each frequency, and T g is the spin glass temperature of the compound. The z v parameter is a critical exponent expressed through the product of the dynamical critical exponent z, and the critical exponent of the correlation length v, that should lie between 4 and 12 for spin glasses [33]. The fits of the power law (2) were performed and are shown in Figure 11. The coefficient of determination, R 2 , was included in the figures to gage the quality of the fit. The parameters of the model ( T g , τ , and z v ) extracted from such fit are presented in Table 5. The Mydosh parameter ϕ was also computed from the data and included in the last column.
As expected, T g decreases with increasing Fe content. As in pure Co7Zn7Mn6, the values of τ are close to 10 6 s for the four substituted alloys. The τ value should lie between 10 9 and 10 12 s for canonical spin glasses, and the obtained values are much larger. The characteristic slow spin dynamics of reentrant spin glasses explains such order of magnitude in τ . The critical exponent z v and the Mydosh parameter ϕ lie in the range of values expected for reentrant spin glass systems. The parameters of all Fe-substituted samples are close to those obtained for pure Co7Zn7Mn6.
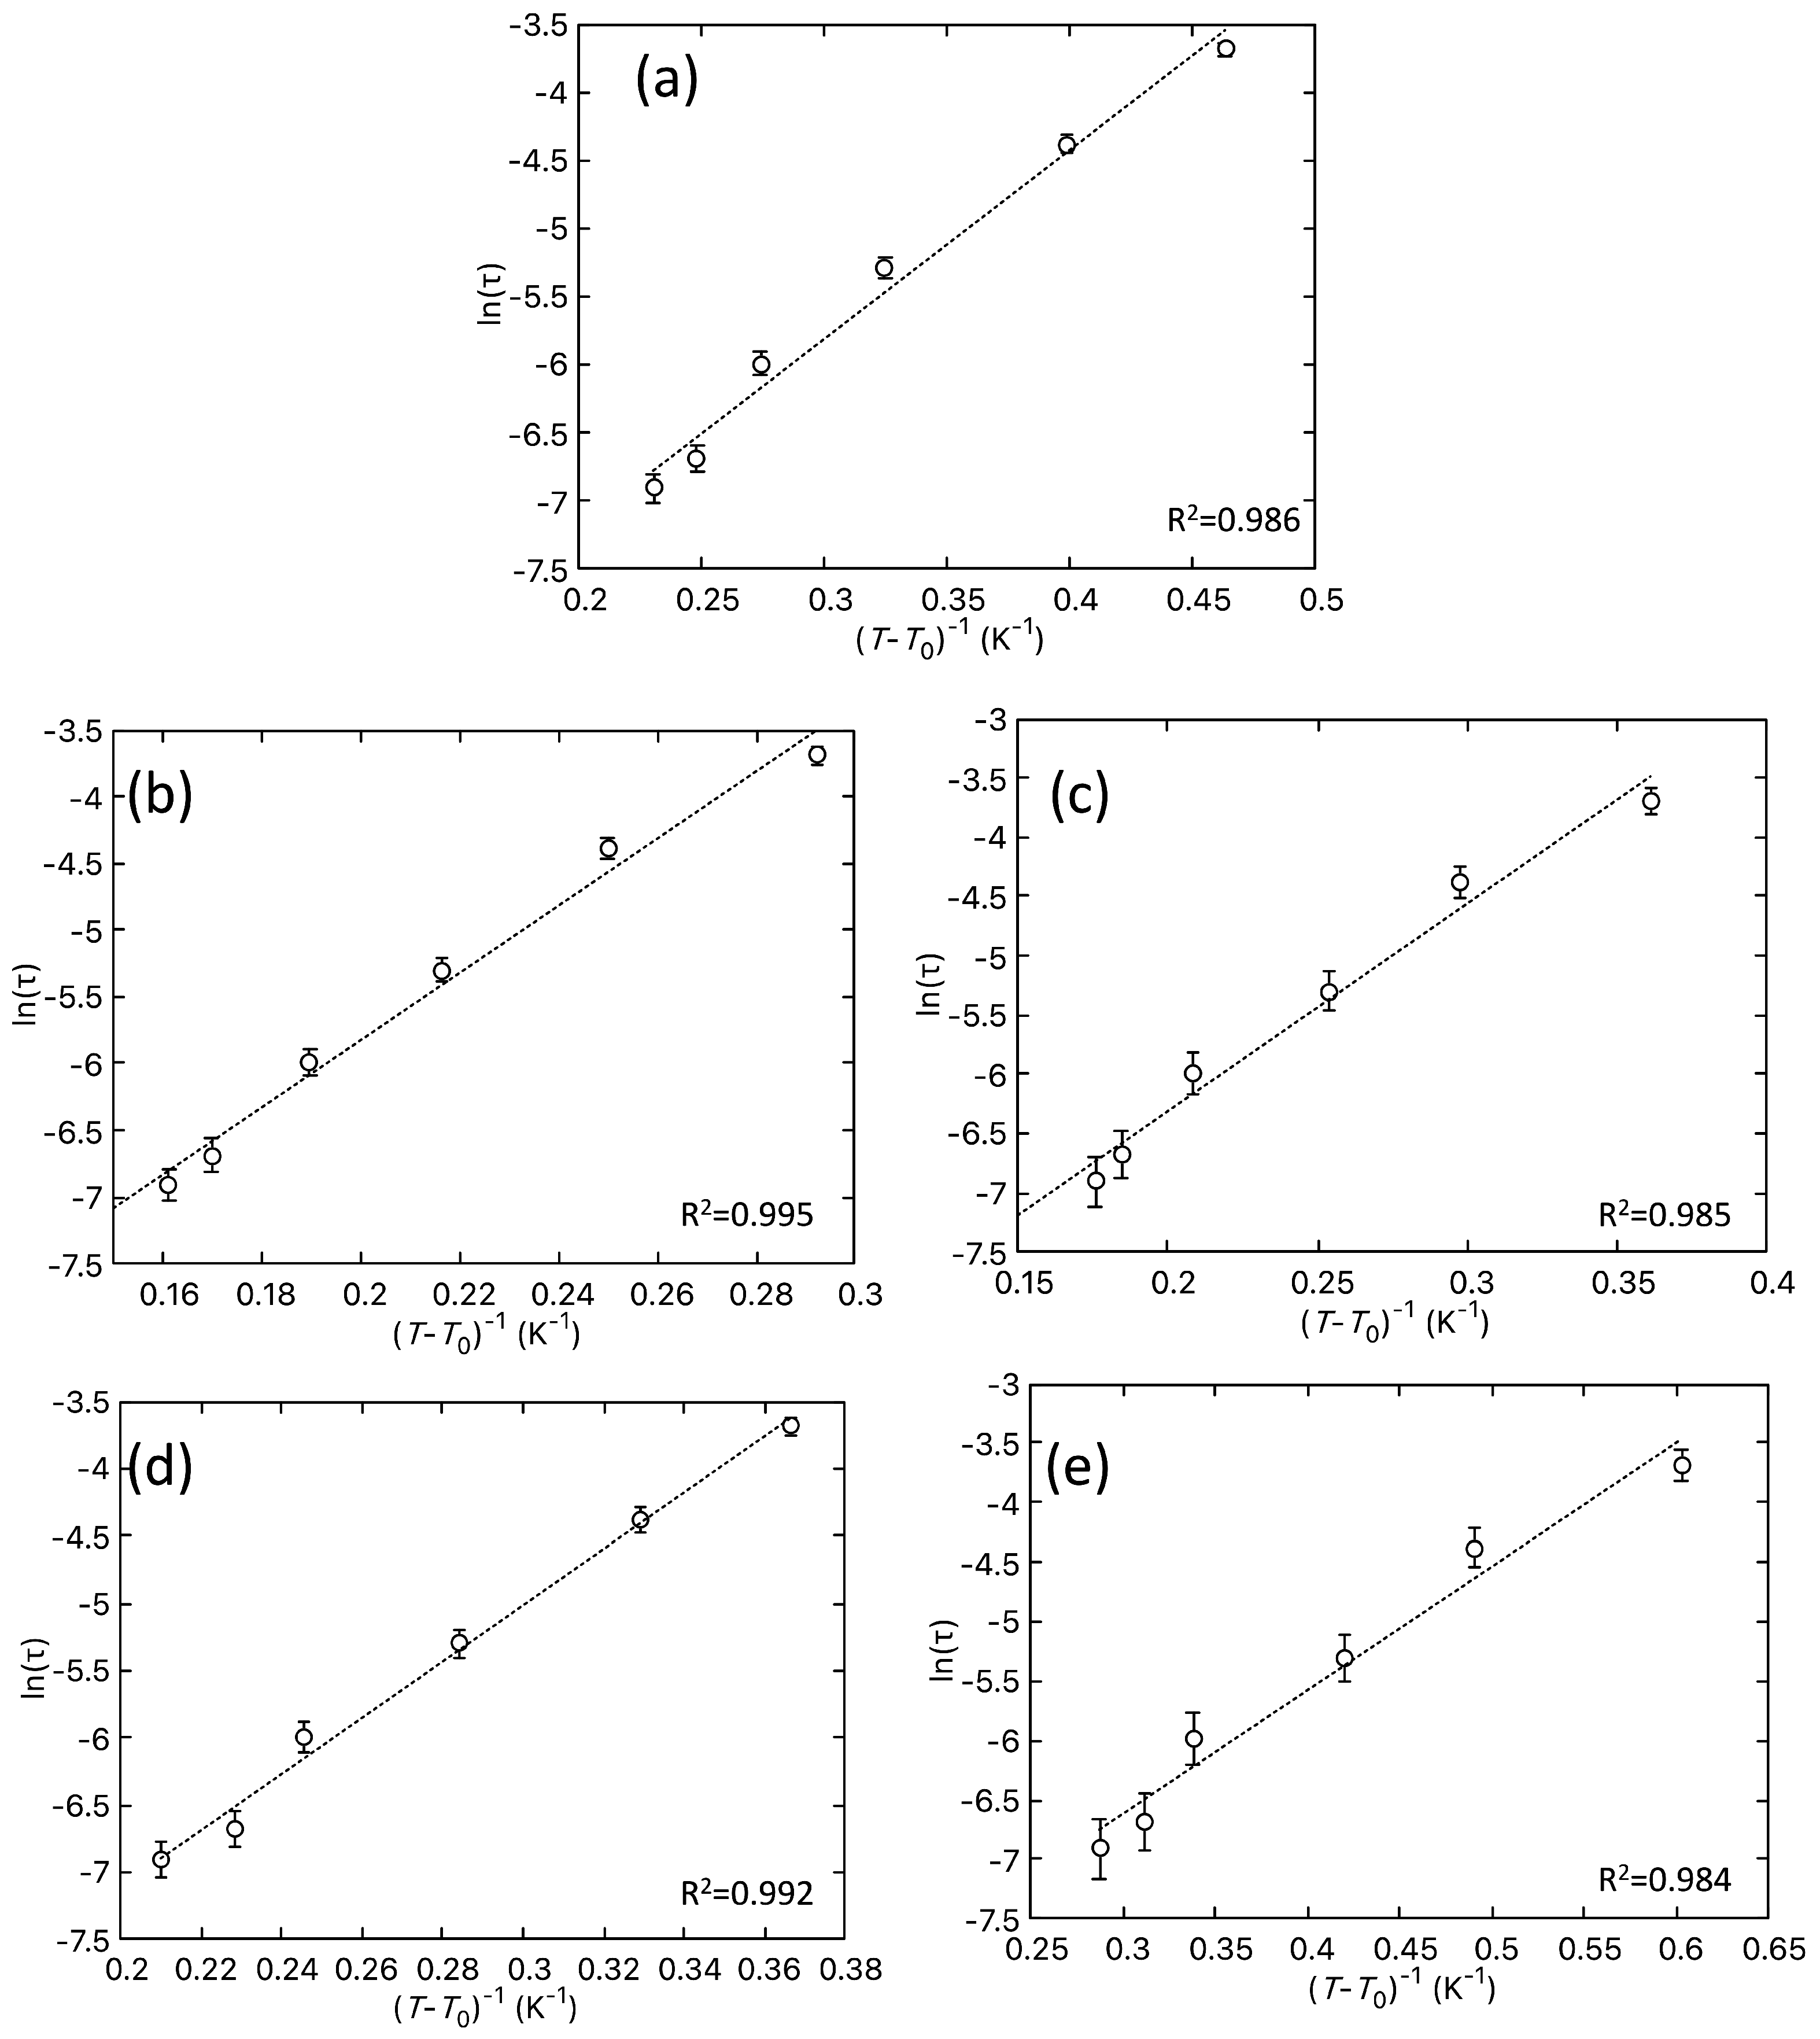
In addition, the phenomenological Vogel–Fulcher–Tammann (VFT) model for the interaction between spins in spin glass systems can also be used to estimate the activation energy, as well as the relaxation time τ 0 of this model [34,35]. The T-dependent relaxation time, τ , should follow the VFT law given by the equation
τ = τ 0 e E a k B ( T f T 0 ) ,
where T 0 is the VFT temperature, τ 0 is the characteristic relaxation time of the model, E a is the activation energy, and k B is the Boltzmann constant. For the purpose of fitting, this law can be rewritten as ln( τ ) = ln( τ 0 ) + E a / k B ( T f T 0 ) 1 .
Further evidence for a reentrant spin glass phase in the present alloys can be obtained from the Tholence parameter δ T , through the following expression [36,37]
δ T = T f T 0 T f .
Using the T 0 value obtained from the VFT law and the value of T f at the lowest frequency (40 Hz), δ T is obtained.
For a better understanding of such phenomena, the fits to the VFT law (3) were performed and are shown in Figure 12. The parameters obtained from these fits ( T 0 , τ 0 , and E a / k B ) and the Tholence parameter are given in Table 6.
For all alloys, the obtained τ 0 value is one order of magnitude higher than τ obtained from the power law. Such large difference is observed in several spin glass systems as the power law gives a better account of the spin glass behaviour [36,38].
Moreover, the obtained T 0 from VFT law is close to T g obtained from the power law, so the two fits are consistent. It is known that E a / k B T 0 indicates a weak coupling strength of the interaction among the magnetic entities of the system and E a / k B T 0 a strong coupling [35,37]. The intermediate case T 0 E a / k B is observed in all Co7Zn7Mn6−xFex alloys, which is also typical of reentrant spin glass systems [39,40]. In reentrant spin glass systems, δ T is usually close to 0.1 [41,42]. For canonical spin glasses δ T is usually smaller (∼0.01) [43].
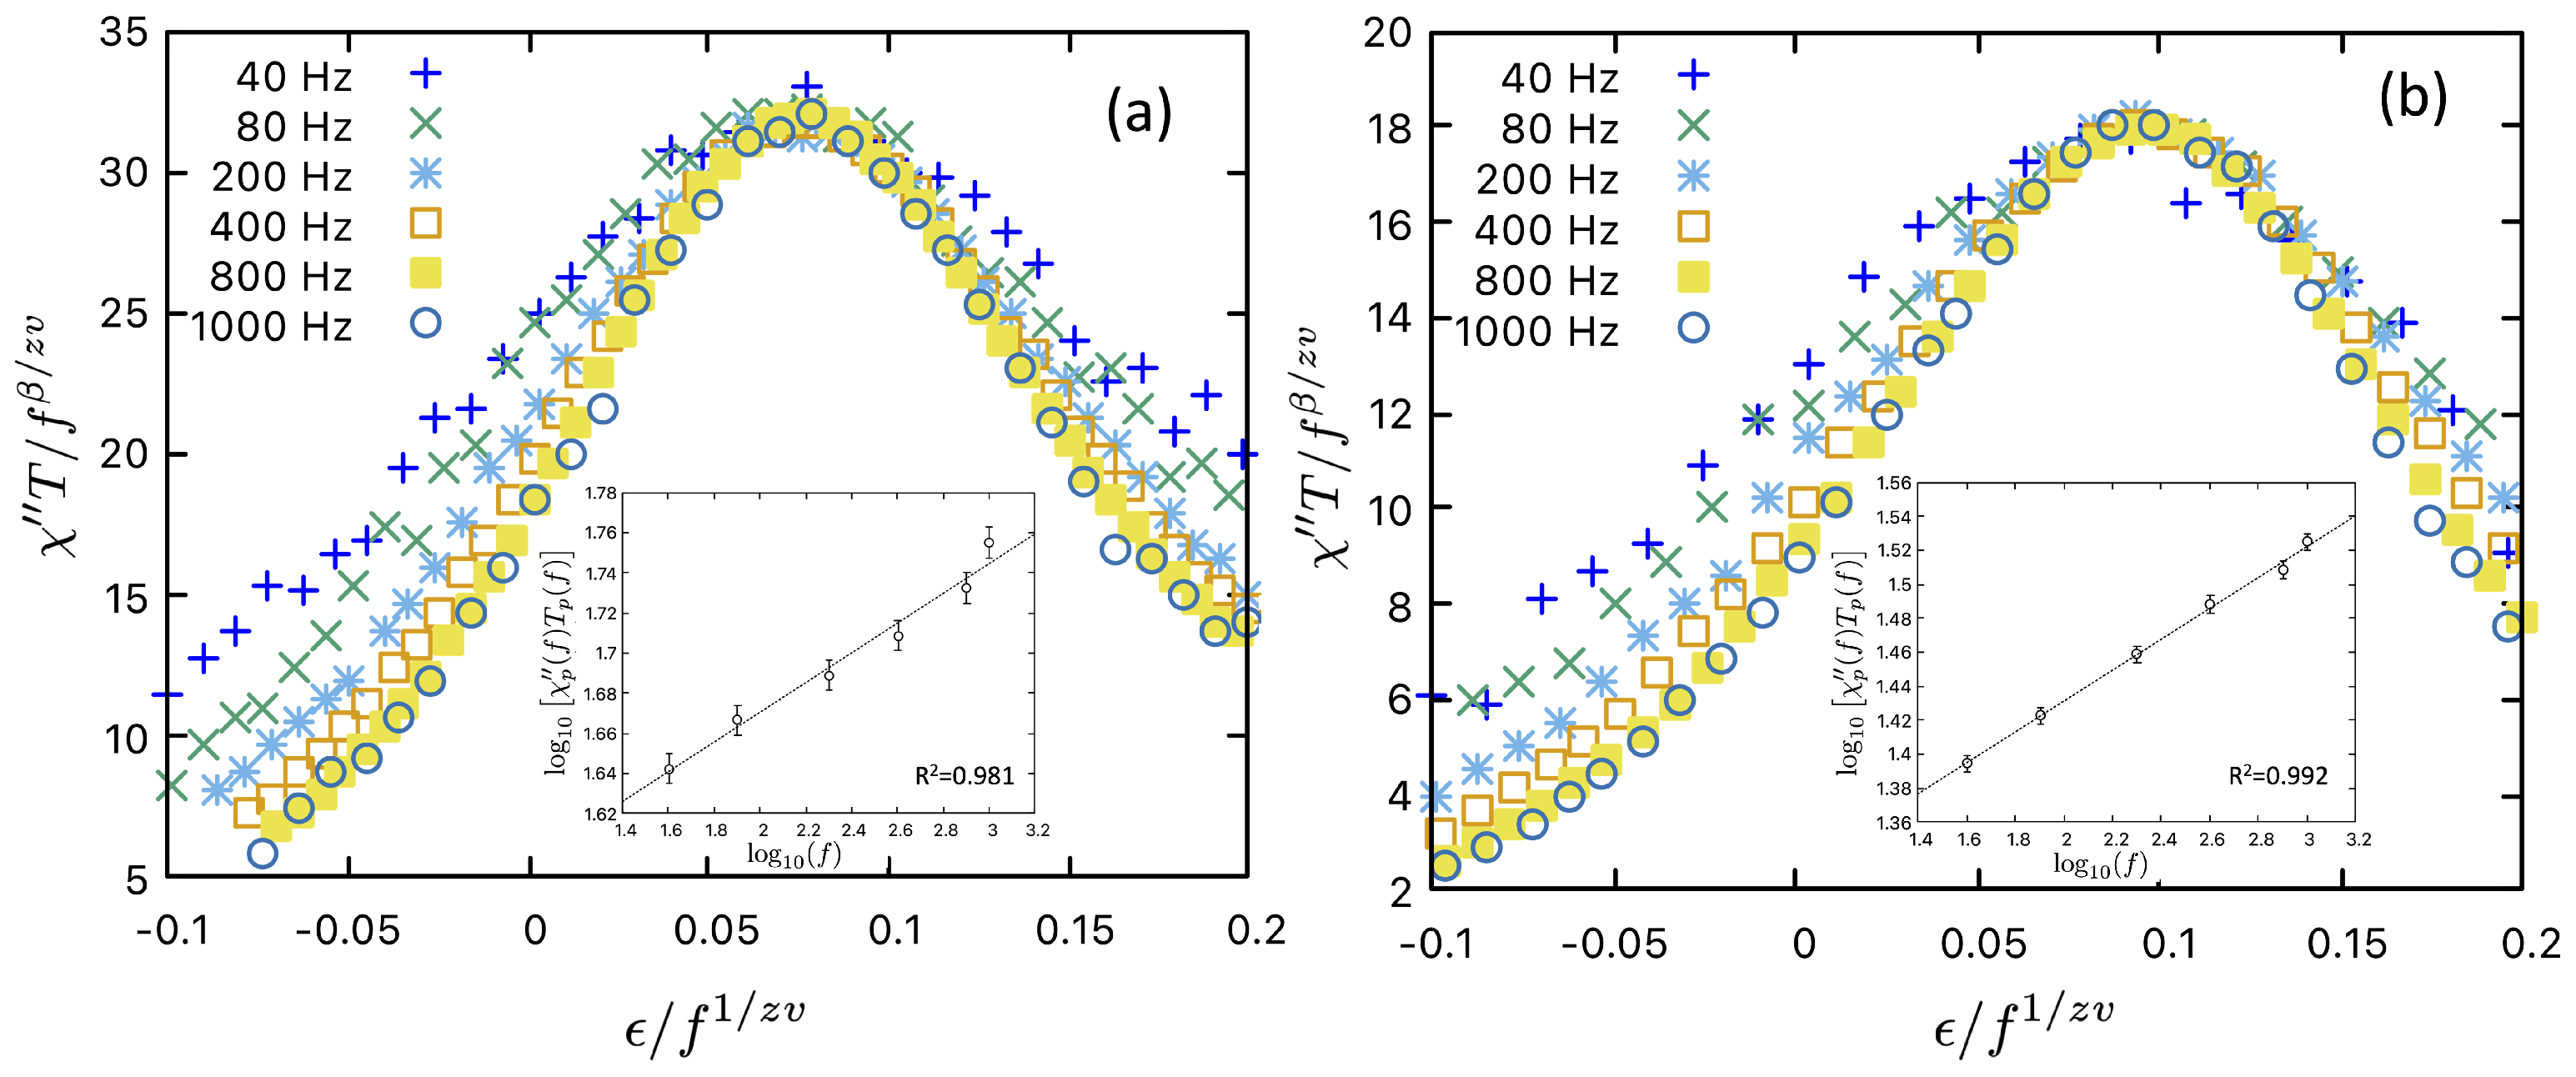
As the phenomenological VFT model is known to provide only a crude description for cluster spin glass systems, we have also analysed our data within the framework of the theoretical Critical Slowing Down model, for which the following dynamical scaling relation is expected [44],
T χ ( f ) / f β / z v = f 1 ( ϵ / f 1 / z v ) ,
where f 1 is the scaling function for the linear component of the imaginary component of the AC susceptibility and ϵ = ( T T g ) / T g . If this scaling law is obeyed, a double logarithmic plot of [ χ p ( f ) T p ( f ) ] against the frequency f for the peak (p) values of χ ( f ) should be linear, with slope equal to β / z v . Such a linear relation is observed in our data (Figure 13), with β / z v values varying between 0.07 and 0.09, corresponding to β ∼0.5. Using these values for the critical exponent and the above determined values of z v and T g the curves of T χ ( f ) / f β / z v vs. ϵ / f 1 / z v do merge in a single peak, but with too much spread away from the peak as to claim perfect scaling behaviour.
In summary, the AC susceptibility measurements support the evidence, also corroborated by other techniques such as neutron-scattering, μ SR, and RXS, for the existence of a reentrant spin glass phase in Co7Zn7Mn6 [2,19].
For the substituted samples, the obtained values of the parameters characterizing the spin glass dynamics are close to those of Co7Zn7Mn6 but the spin glass phase is found at lower temperatures as the Fe content increases. Thus, our analysis of the AC susceptibility data provides evidence for a reentrant spin glass transition in the Co7Zn7Mn6−xFex family of alloys, in the whole composition range 0 x 1 .

3.3.2. Magnetic Phase Diagram

To investigate the presence of skyrmions and the different magnetic phases below T C , AC susceptibility measurements were performed for different temperatures as a function of the DC magnetic field, to obtain a better insight into the magnetic ground state of Co7Zn7Mn6−xFex samples. It is expected that the skyrmion A-phase will stamp a signature on the AC susceptibility measurements, when crossing the magnetic phase boundaries.
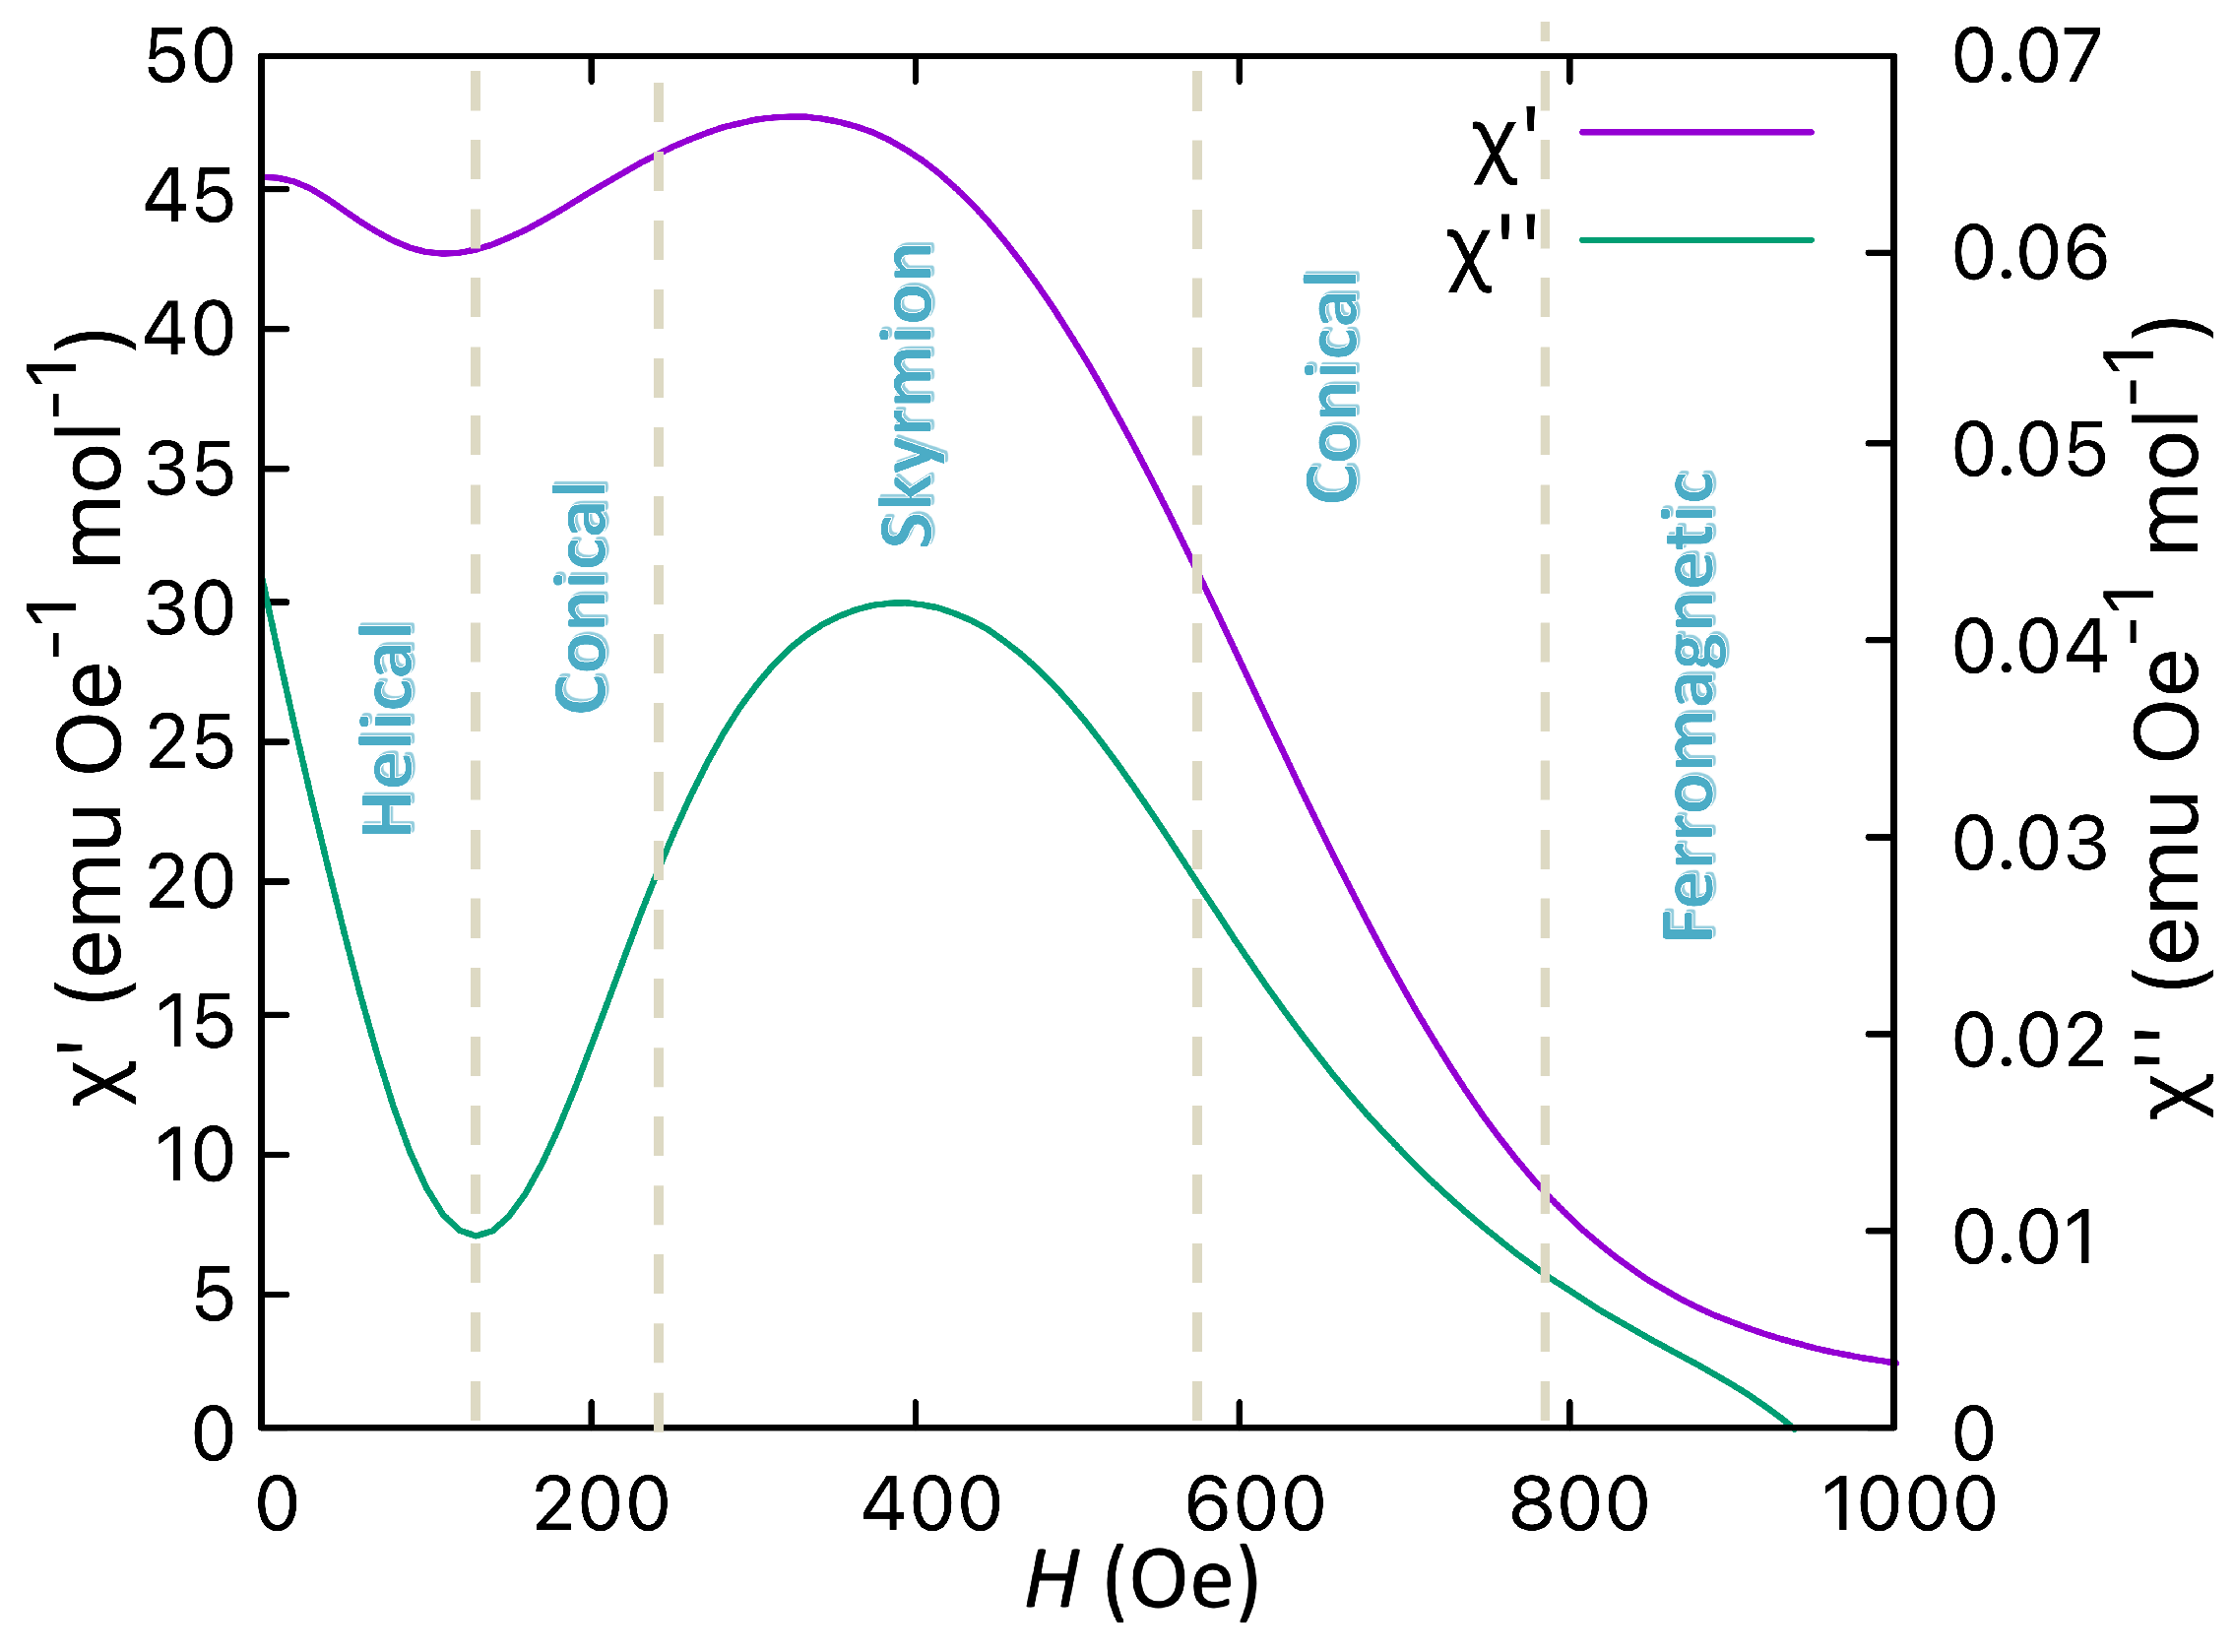
Figure 14 shows the χ and χ component curves obtained for pure Co7Zn7Mn6 at 110 K, with the different phases assigned. The random orientation of the single-crystal sample with respect to the magnetic field direction in this sample can thus explain the broadening of the two anomalies associated with the skyrmionic phase, as it is possible that the random orientation was far from the optimal orientation to stabilise that phase.
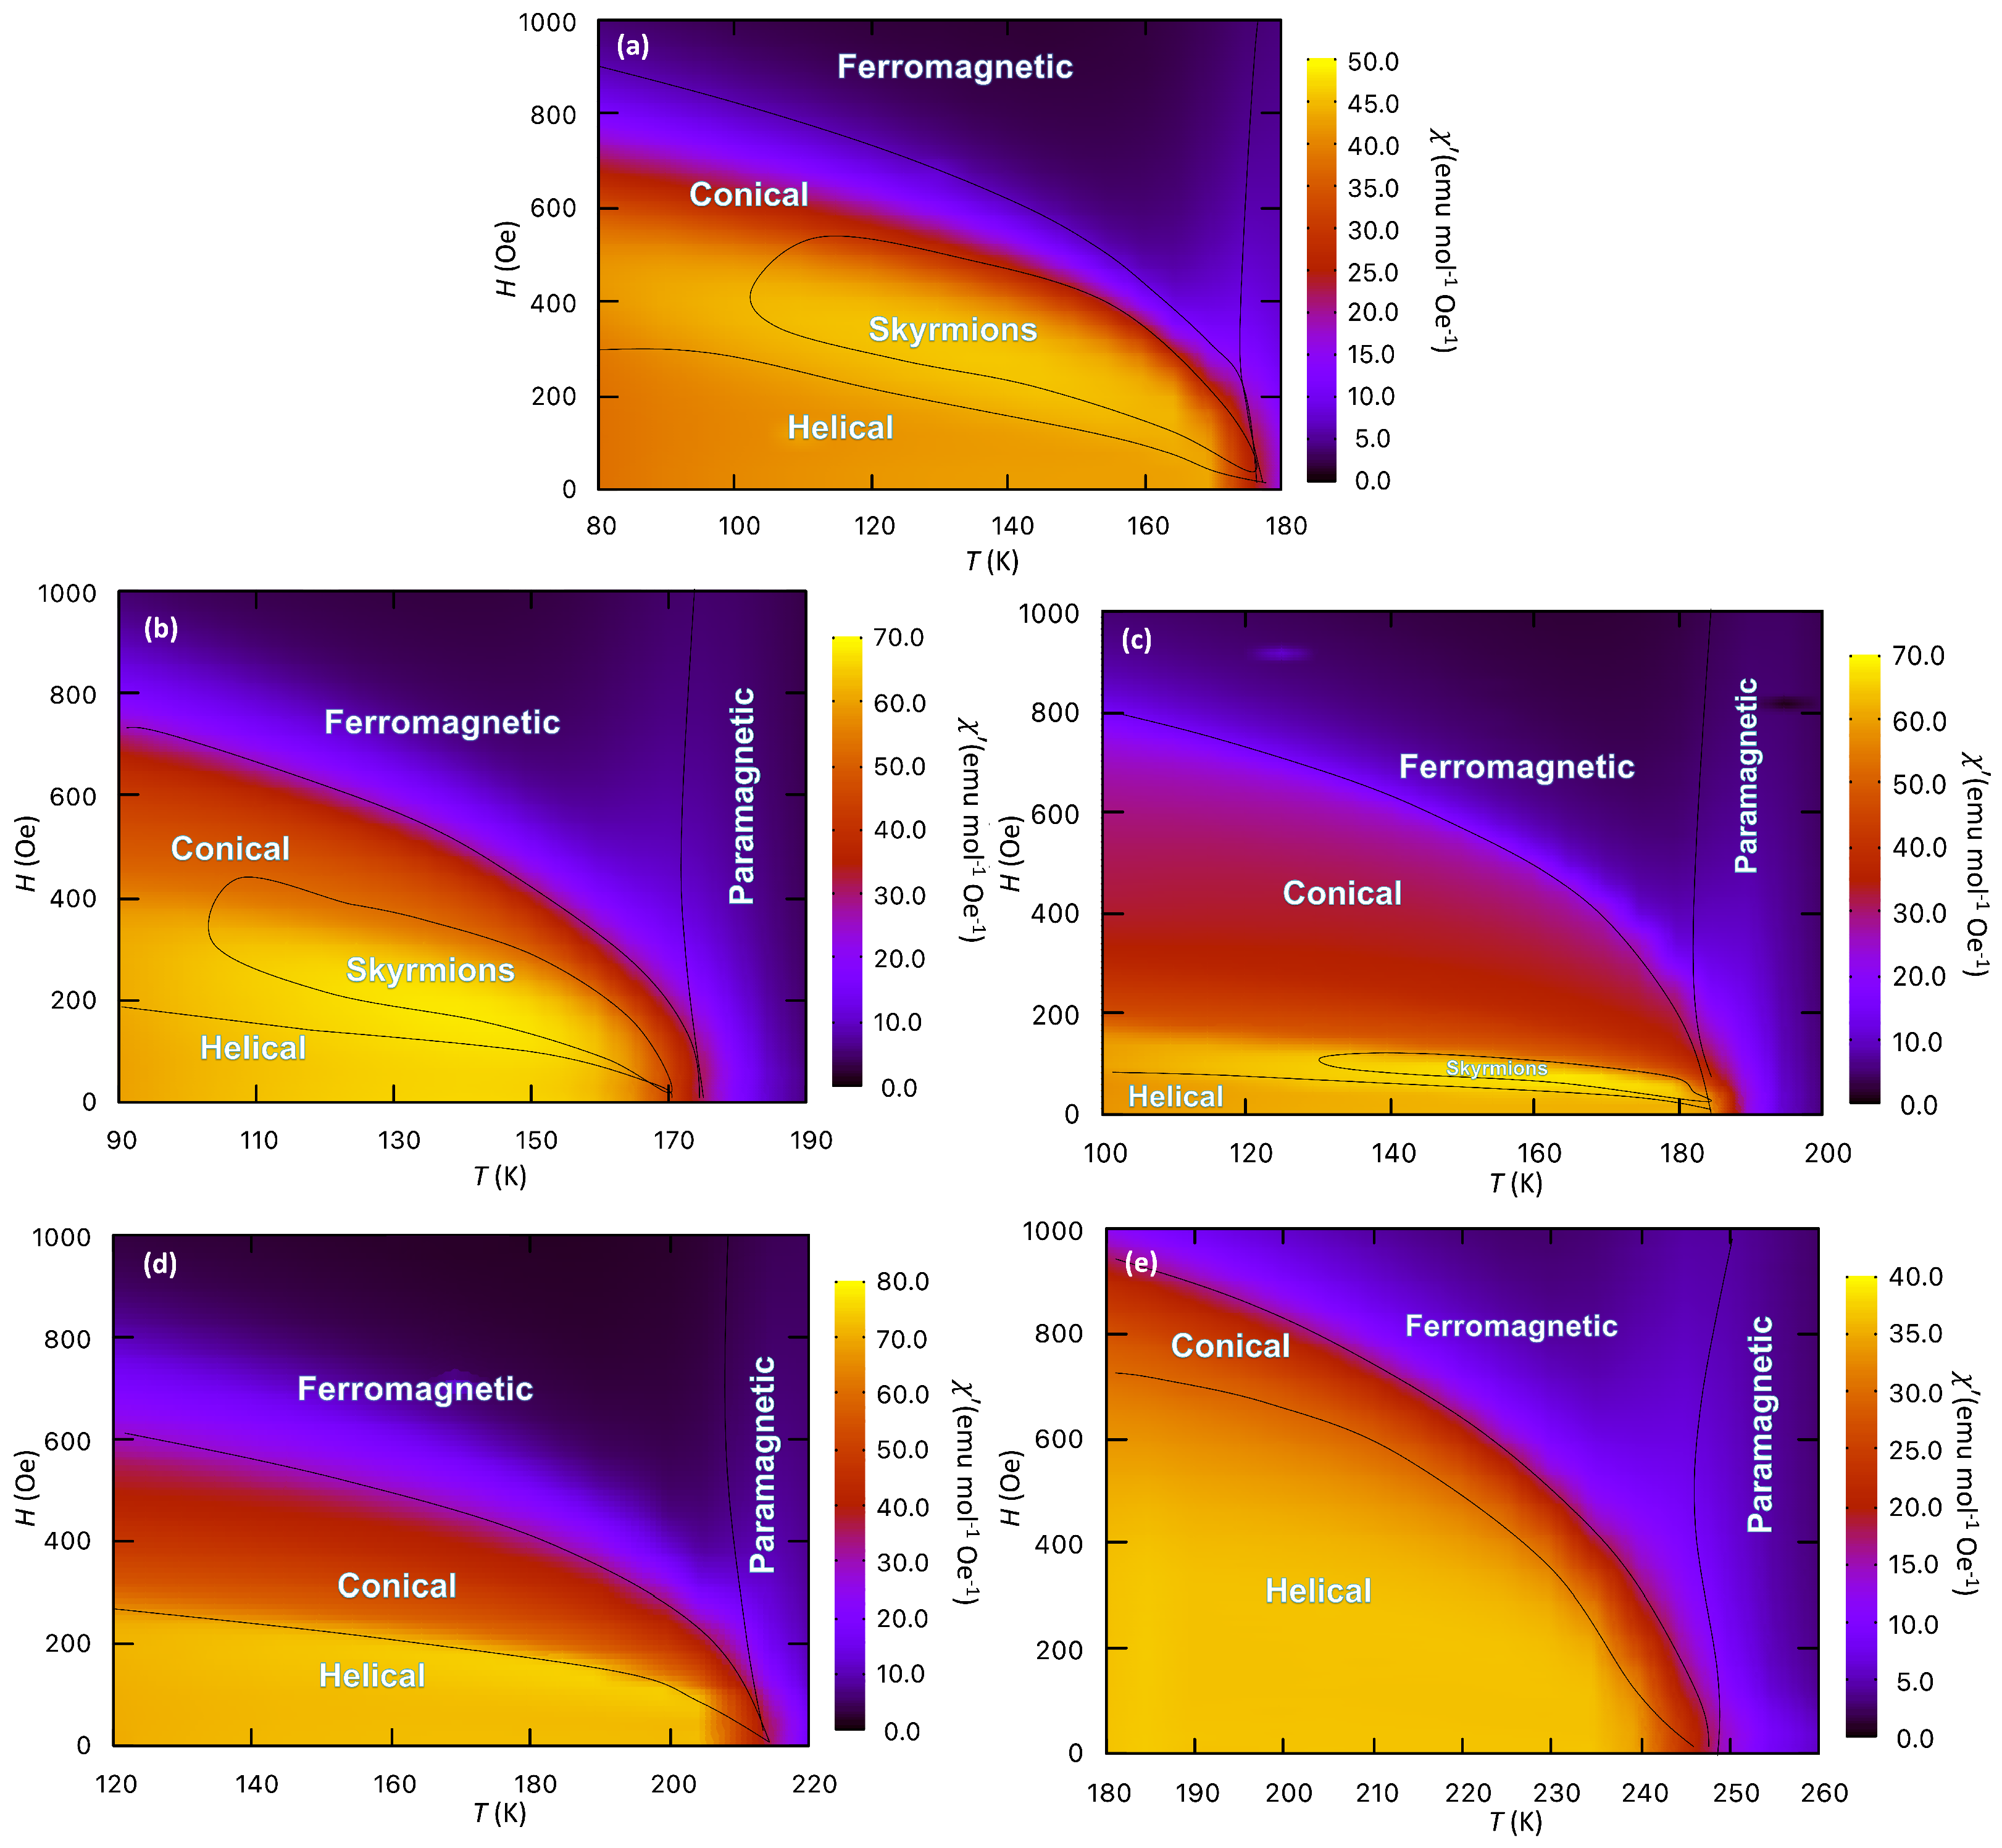
Based on the criteria presented in Figure 14, it was possible to describe the magnetic phase diagram by identifying the magnetic ordered phases of the Co7Zn7Mn6−xFex samples. Then, AC susceptibility measurements as a function of temperature were undertaken to map the phase diagram close to T C where a stabilised skyrmion phase should be observed, as well as the conical and helical ones. For high magnetic fields, the system goes into a ferromagnetic state. The analysed sample has a slightly higher T C than most of the reported studies of Co7Zn7Mn6 but the emergence of disordered and metastable skyrmions among the conical and helical phases can only be detected by neutron scattering techniques [21]. To determine the magnetic phase diagram close to T C for each Co7Zn7Mn6−xFex alloy, AC susceptibility measurements were also performed as a function of DC magnetic field. The phase diagrams were obtained using the ‘pm3d’ interpolation algorithm implemented in gnuplot version 5.2 [45], are represented in Figure 15. The phase boundaries were determined from the χ , superimposed on the colour map representing the values of χ ( H , T ) .
It can be inferred from Figure 15 that the skyrmion and helical phases are present in narrower regions of the phase diagram, compared to the unsubstituted alloy, Co7Zn7Mn6. On the other hand, the conical phase has a stability region extending to higher magnetic fields. Thus, we can state that the addition of Fe not only drives T C to higher temperatures, but it also narrows the region where skyrmions can be stabilised with the applied magnetic field. For x > 0.5 no evidence of the presence of skyrmions is found, thus the substitution of Mn by Fe leads not only to an increase in T C but it also suppresses the skyrmionic phase in the Co7Zn7Mn6−xFex system.

4. Conclusions

The present study showed that the substitution of Mn by Fe in Co7Zn7Mn6 preserves the chiral crystallographic structure of the parent alloy associated with the β -Mn-type alloys. From EDS analysis, the compositions of the synthesised samples are close to the nominal ones and no further extraneous phases were detected by PXRD analysis; thus, all the samples remained single-phase. Substitution of Mn by Fe, which has a smaller atomic radius, decreases the lattice parameter, closely following Vegard’s law and confirming that substitution was effective.
DC magnetisation studies showed the ferromagnetic-like character of these samples, with a T C that was found to systematically increase with increasing Fe content. It was also confirmed that Co7Zn7Mn6−xFex alloys, with x 1 , feature a reentrant spin glass transition in the low-temperature region. The evidence of such glassy phase was obtained from AC susceptibility at different frequencies of the oscillating magnetic field, where a shift of the freezing temperature T f to higher values as the frequency increases was observed. The parameters obtained using the Vogel–Fulcher–Tammann and power-law fitting models are consistent with those observed in reentrant spin glass systems. In contrast to what is observed for the evolution of T C as the Fe content increases, the spin glass temperature T g slightly decreases to lower temperatures as the Fe content increases.
The addition of Fe also tends to expand the region of stability of the conical phase at the expense of the stability region assigned to skyrmions, up to x = 0.5 . Indirect evidence, from AC magnetic susceptibility measurements, was gathered for the presence of a skyrmionic region the magnetic phase diagram of both Co7Zn7Mn5.75Fe0.25 and Co7Zn7Mn5.5Fe0.5. However, for x > 0.5 , no clear evidence for the presence of such a skyrmionic phase was observed in our samples. Of course, this does not mean that such a phase could not be stabilised in a small region of the ( H , T ) phase diagram for the Fe-rich alloys, but if it does it is certainly much more elusive to bulk measurements.
Certainly, more advanced imaging and scattering techniques should be used to investigate in detail the magnetic phase diagram, establish the nature of skyrmions in this system, and also to firmly disclose the possible existence of a disordered skyrmion phase close to T g in the Co7Zn7Mn6−xFex system. Also, our results suggest the importance of further substitution studies in β -Mn-type alloys, based on CoxZnyMnz stoichiometry to be pursued, aiming at stabilising skyrmions closer to room temperature and at lower magnetic fields than those reported for the parent compounds, making them promising materials for data storage systems, if that goal is reached.

Author Contributions

J.F.M.: synthesis, characterisation, physical properties measurements, analysis of the results, investigation, and writing. M.S.C.H.: physical properties measurements, investigation, and writing. J.A.P.: physical properties measurements, analysis of the results, investigation, writing, and funding. A.P.G.: investigation and writing. All authors have read and agreed to the published version of the manuscript.

Funding

José F. Malta PhD grant was supported by FCT-Fundação para a Ciência e aTecnologiat hrough ChemMat PhD programme. Access to TAIL-UC facility supported by the QREN-Mais Centro programme ICT_2009_02_012_1890 is gratefully acknowledged. This work was partially supported by funds from FEDER (Programa Operacional Factores de Competitividade COMPETE) and from FCT under the projects UIDB/FIS/04564/2020 (https://doi.org/10.54499/UIDB/04564/2020), UIDP/FIS/04564/2020 (https://doi.org/10.54499/UIDP/04564/2020) and UIDB/04349/2020 (https://doi.org/10.54499/UIDB/04349/2020).

Institutional Review Board Statement

Not applicable.

Informed Consent Statement

Not applicable.

Data Availability Statement

The original contributions presented in the study are included in the article. Further inquiries can be directed to the corresponding author.

Conflicts of Interest

The authors declare no conflicts of interest.

References

  1. Bocarsly, J.D.; Heikes, C.; Brown, C.M.; Wilson, S.D.; Seshadri, R. Deciphering structural and magnetic disorder in the chiral skyrmion host materials CoxZnyMnz (x + y + z = 20). Phys. Rev. Mater. 2019, 3, 014402. [Google Scholar] [CrossRef]
  2. Ukleev, V.; Karube, K.; Derlet, P.M.; Wang, C.N.; Luetkens, H.; Morikawa, D.; Kikkawa, A.; Mangin-Thro, L.; Wildes, A.R.; Yamasaki, Y.; et al. Frustration-driven magnetic fluctuations as the origin of the low-temperature skyrmion phase in Co7Zn7Mn6. npj Quant. Mater. 2021, 6, 40. [Google Scholar] [CrossRef]
  3. Tokunaga, Y.; Yu, X.Z.; White, J.S.; Ronnow, H.M.; Morikawa, D.; Taguchi, Y.; Tokura, Y. A new class of chiral materials hosting magnetic skyrmions beyond room temperature. Nat. Commun. 2015, 6, 7638. [Google Scholar] [CrossRef] [PubMed]
  4. Hori, T.; Shiraish, H.; Ishii, Y. Magnetic properties of -MnCoZn alloys. J. Magn. Magn. Mater. 2007, 310, 1820–1822. [Google Scholar] [CrossRef]
  5. Morikawa, D.; Yu, X.; Karube, K.; Tokunaga, Y.; Taguchi, Y.; Arima, T.; Tokura, Y. Deformation of Topologically-Protected Supercooled Skyrmions in a Thin Plate of Chiral Magnet Co8Zn8Mn4. Nano Lett. 2017, 17, 1637–1641. [Google Scholar] [CrossRef] [PubMed]
  6. Xie, W.; Thimmaiah, S.; Lamsal, J.; Liu, J.; Heitmann, T.W.; Quirinale, D.; Goldman, A.I.; Pecharsky, V.; Miller, G.J. β-Mn-Type Co8+xZn12−x as a Defect Cubic Laves Phase: Site Preferences, Magnetism, and Electronic Structure. Inorg. Chem. 2013, 52, 9399–9408. [Google Scholar] [CrossRef] [PubMed]
  7. Cheong, S.W.; Mostovoy, M. Multiferroics: A magnetic twist for ferroelectricity. Nat. Mater. 2007, 6, 13–20. [Google Scholar] [CrossRef]
  8. Versteeg, R.B.; Vergara, I.; Schäfer, S.D.; Bischoff, D.; Aqeel, A.; Palstra, T.T.M.; Grüninger, M.; Van Loosdrecht, P.H.M. Optically probed symmetry breaking in the chiral magnet Cu2OSeO3. Phys. Rev. B 2016, 94, 094409. [Google Scholar] [CrossRef]
  9. Freimuth, F.; Bamler, R.; Mokrousov, Y.; Rosch, A. Phase-space Berry phases in chiral magnets: Dzyaloshinskii-Moriya interaction and the charge of skyrmions. Phys. Rev. B 2013, 88, 214409. [Google Scholar] [CrossRef]
  10. Khanh, N.D.; Nakajima, T.; Yu, X.; Gao, S.; Shibata, K.; Hirschberger, M.; Yamasaki, Y.; Sagayama, H.; Nakao, H.; Peng, L.; et al. Nanometric square skyrmion lattice in a centrosymmetric tetragonal magnet. Nat. Nanotechnol. 2020, 15, 444–449. [Google Scholar] [CrossRef]
  11. Milde, P.; Kohler, D.; Seidel, J.; Eng, L.M.; Bauer, A.; Chacon, A.; Kindervater, J.; Muhlbauer, S.; Pfleiderer, C.; Buhrandt, S.; et al. Unwinding of a Skyrmion Lattice by Magnetic Monopoles. Science 2013, 340, 1076–1080. [Google Scholar] [CrossRef] [PubMed]
  12. Vir, P.; Kumar, N.; Borrmann, H.; Jamijansuren, B.; Kreiner, G.; Shekhar, C.; Felser, C. Tetragonal Superstructure of the Antiskyrmion Hosting Heusler Compound Mn1.4PtSn. Chem. Mater. 2019, 31, 5876–5880. [Google Scholar] [CrossRef] [PubMed]
  13. Kanazawa, N.; Seki, S.; Tokura, Y. Noncentrosymmetric Magnets Hosting Magnetic Skyrmions. Adv. Mater. 2017, 29, 1603227. [Google Scholar] [CrossRef]
  14. Yu, X.Z.; Koshibae, W.; Tokunaga, Y.; Shibata, K.; Taguchi, Y.; Nagaosa, N.; Tokura, Y. Transformation between meron and skyrmion topological spin textures in a chiral magnet. Nature 2018, 564, 95–98. [Google Scholar] [CrossRef]
  15. Nakajima, T.; Karube, K.; Ishikawa, Y.; Yonemura, M.; Reynolds, N.; White, J.S.; Rønnow, H.M.; Kikkawa, A.; Tokunaga, Y.; Taguchi, Y.; et al. Correlation between site occupancies and spin-glass transition in skyrmion host Co 10 x 2 Zn 10 x 2 Mn x . Phys. Rev. B 2019, 100, 064407. [Google Scholar] [CrossRef]
  16. Trachenko, K. Understanding spin glass transition as a dynamic phenomenon. J. Phys. Condens. Matter 2011, 23, 366003. [Google Scholar] [CrossRef]
  17. Mydosh, J.A. Spin glasses: Redux: An updated experimental/materials survey. Rep. Prog. Phys. 2015, 78, 052501. [Google Scholar] [CrossRef]
  18. Kustov, S.; Torrens-Serra, J.; Salje, E.K.H.; Beshers, D.N. Re-entrant spin glass transitions: New insights from acoustic absorption by domain walls. Sci. Rep. 2017, 7, 16846. [Google Scholar] [CrossRef]
  19. Karube, K.; White, J.S.; Morikawa, D.; Dewhurst, C.D.; Cubitt, R.; Kikkawa, A.; Yu, X.; Tokunaga, Y.; Arima, T.; Rønnow, H.M.; et al. Disordered skyrmion phase stabilized by magnetic frustration in a chiral magnet. Sci. Adv. 2018, 4, eaar7043. [Google Scholar] [CrossRef]
  20. Menzel, D.; Baabe, D.; Litterst, F.; Steinki, N.; Dietze, K.; Sach, M.; Rubrecht, B.; Sullow, S.; Hoser, A. Local structure determination in helimagnetic Co8Zn8Mn4−xFex. J. Phys. Comun. 2019, 3, 025001. [Google Scholar] [CrossRef]
  21. Karube, K.; White, J.S.; Ukleev, V.; Dewhurst, C.D.; Cubitt, R.; Kikkawa, A.; Tokunaga, Y.; Rønnow, H.M.; Tokura, Y.; Taguchi, Y. Metastable skyrmion lattices governed by magnetic disorder and anisotropy in beta-Mn-type chiral magnets. Phys. Rev. B 2020, 102, 064408. [Google Scholar] [CrossRef]
  22. Doebelin, N.; Kleeberg, R. Profex: A graphical user interface for the Rietveld refinement program BGMN. J. Appl. Crystallogr. 2015, 48, 1573–1580. [Google Scholar] [CrossRef]
  23. Arrott, A.; Noakes, J.E. Approximate Equation of State For Nickel Near its Critical Temperature. Phys. Rev. Lett. 1967, 19, 786–789. [Google Scholar] [CrossRef]
  24. Arrott, A. Criterion for Ferromagnetism from Observations of Magnetic Isotherms. Phys. Rev. 1957, 108, 1394. [Google Scholar] [CrossRef]
  25. Yeung, I.; Roshko, R.M.; Williams, G. Arrott-plot criterion for ferromagnetism in disordered systems. Phys. Rev. B 1986, 34, 3456. [Google Scholar] [CrossRef]
  26. Kaul, S. Static critical phenomena in ferromagnets with quenched disorder. J. Magn. Magn. Mater. 1985, 53, 5–53. [Google Scholar] [CrossRef]
  27. Le Guillou, J.C.; Zinn-Justin, J. Critical exponents from field theory. Phys. Rev. B 1980, 21, 3976–3998. [Google Scholar] [CrossRef]
  28. Kouvel, J.S.; Fisher, M.E. Detailed Magnetic Behavior of Nickel Near its Curie Point. Phys. Rev. 1964, 136, A1626–A1632. [Google Scholar] [CrossRef]
  29. Benka, G.; Bauer, A.; Schmakat, P.; Säubert, S.; Seifert, M.; Jorba, P.; Pfleiderer, C. Interplay of itinerant magnetism and spin-glass behavior in FexCr1−x. Phys. Rev. Mater. 2022, 6, 044407. [Google Scholar] [CrossRef]
  30. Szlawska, M. Spin-glass freezing in single-crystalline Pr2NiSi3. Intermetallics 2019, 115, 106616. [Google Scholar] [CrossRef]
  31. Sherrington, D. A spin glass perspective on ferroic glasses. Phys. Status Solidi B 2014, 251, 1967–1981. [Google Scholar] [CrossRef]
  32. Bag, P.; Somesh, K.; Nath, R. A study of cluster spin-glass behaviour at the critical composition Mn0.73Fe0.27NiGe. J. Magn. Magn. Mater. 2020, 497, 165977. [Google Scholar] [CrossRef]
  33. Yadav, K.; Sharma, M.K.; Singh, S.; Mukherjee, K. Exotic magnetic behaviour and evidence of cluster glass and Griffiths like phase in Heusler alloys Fe2−xMnxCrAl. Sci. Rep. 2019, 9, 15888. [Google Scholar] [CrossRef] [PubMed]
  34. Rault, J. Origin of the Vogel-Fulcher-Tammann law in glass-forming materials: The alpha-beta bifurcation. J. Non-Cryst. Solids 2000, 271, 177–217. [Google Scholar] [CrossRef]
  35. Shtrikman, S.; Wohlfarth, E. The theory of the Vogel-Fulcher law of spin glasses. Phys. Lett. A 1981, 85, 467–470. [Google Scholar] [CrossRef]
  36. Tholence, J. On the frequency dependence of the transition temperature in spin glasses. Solid State Commun. 1980, 35, 113–117. [Google Scholar] [CrossRef]
  37. Souletie, J.; Tholence, J.L. Critical slowing down in spin glasses and other glasses: Fulcher versus power law. Phys. Rev. B 1985, 32, 516–519. [Google Scholar] [CrossRef]
  38. Kundu, S.; Dey, T.; Mahajan, A.V.; Bttgen, N. LiZn2V3O8: A new geometrically frustrated cluster spin-glass. J. Phys. Condens. Matter 2020, 32, 115601. [Google Scholar] [CrossRef] [PubMed]
  39. Ribeiro, P.R.T.; Ramírez, J.M.M.; Vidyasagar, R.; Machado, F.L.A.; Rezende, S.M.; Dahlberg, E.D. GMI in the reentrant spin-glass Fe90Zr10 alloy: Investigation of the spin dynamics in the MHz frequency regime. Appl. Phys. Lett. 2016, 109, 102404. [Google Scholar] [CrossRef]
  40. Anand, K.; Pal, A.; Singh, P.; Alam, M.M.; Joshi, A.G.; Mohan, A.; Chatterjee, S. Emergence of Griffiths phase, re-entrant cluster glass, metamagnetic transition and field induced unusual spin dynamics in Tb2CoMnO6. arXiv 2019, arXiv:1910.13734. [Google Scholar]
  41. Kumar, V.; Kumar, R.; Singh, K.; Arora, S.K.; Shvets, I.V.; Kumar, R. Evidence for spin glass state of NdCo1−xNixO3 (x = 0.3–0.5). J. Appl. Phys. 2014, 116, 073903. [Google Scholar] [CrossRef]
  42. Dubiel, S. Evidence for a re-entrant character of magnetism of alfa-phase Fe–Mo alloys: Non-linear susceptibilities. J. Magn. Magn. Mater. 2016, 408, 77–80. [Google Scholar] [CrossRef]
  43. Bałanda, M.; Dubiel, S. An AC magnetic susceptibility study of a sigma-phase Fe65.9V34.1 alloy. J. Alloys Compd. 2016, 663, 77–81. [Google Scholar] [CrossRef]
  44. Bitla, Y.; Kaul, S.N.; Fernández Barquín, L. Nonlinear susceptibilities as a probe to unambiguously distinguish between canonical and cluster spin glasses. Phys. Rev. B 2012, 86, 094405. [Google Scholar] [CrossRef]
  45. Williams, T.; Kelley, C. Gnuplot 5.2: An Interactive Plotting Program. 2019. Available online: http://gnuplot.sourceforge.net/ (accessed on 10 June 2024).
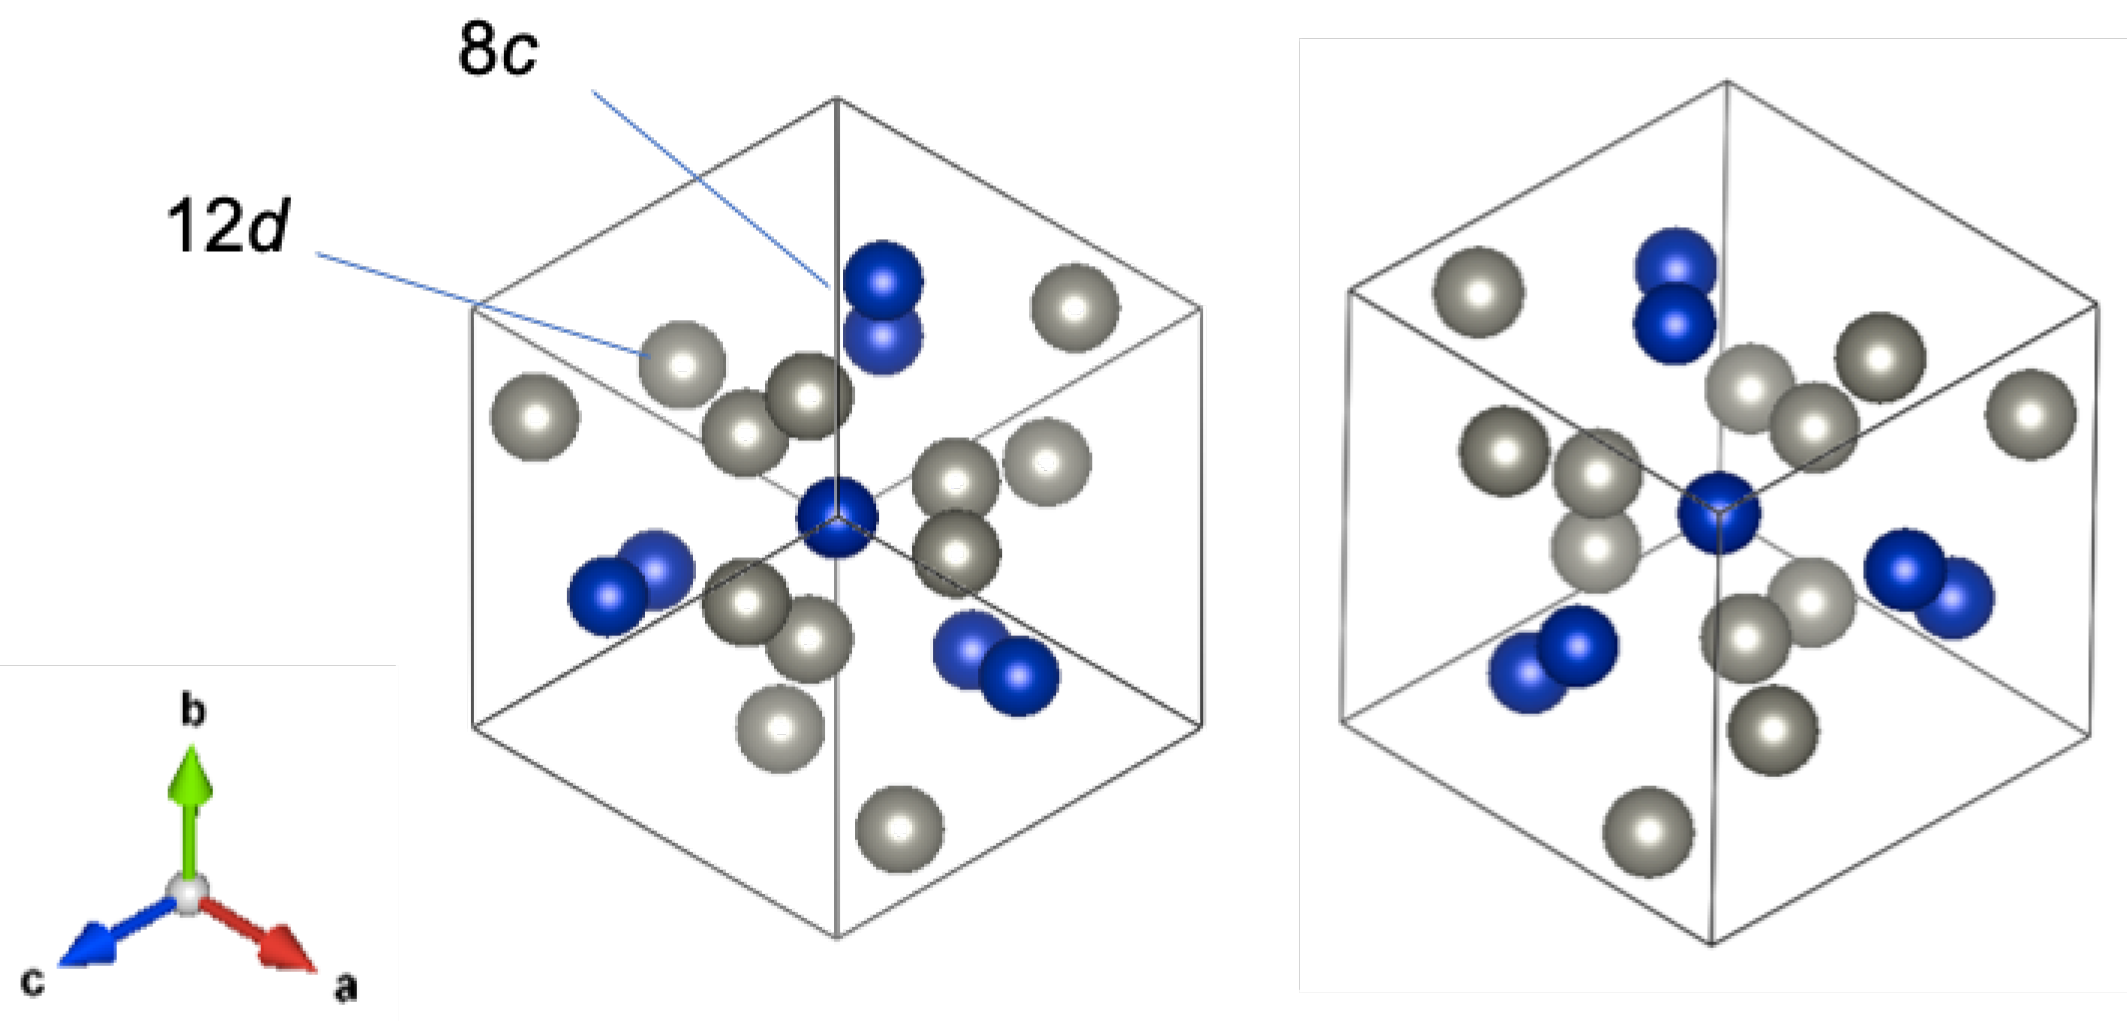
Figure 1. Crystal structure of a β -Mn-type alloy with the two chiral cubic space groups P 4 3 32 (left) and P 4 1 32 (right) represented.
Magnetochemistry 10 00061 g001
Figure 2. Bridgman–Stockbarger system used in this work.
Magnetochemistry 10 00061 g002
Figure 3. XRD pattern for the Co7Zn7Mn6−xFex samples: (a) x = 0 ; (b) x = 0.25 ; (c) x = 0.5 ; (d) x = 0.75 ; (e) x = 1 . (f) Lattice parameter of Co7Zn7Mn6−xFex as a function of the Fe content.
Magnetochemistry 10 00061 g003
Figure 4. EDS mapping of elements for the Co7Zn7Mn6−xFex samples: (a) x = 0 ; (b) x = 0.25 ; (c) x = 0.5 ; (d) x = 0.75 ; (e) x = 1 .
Magnetochemistry 10 00061 g004
Figure 5. M(H) curves measured at 2 K for the Co7Zn7Mn6−xFex samples. The inset shows the magnetisation measured at 90 kOe as a function of Fe content x.
Magnetochemistry 10 00061 g005
Figure 6. M(T) magnetisation curves for Co7Zn7Mn6−xFex polycrystalline samples measured with H = 100 Oe: (a) x = 0 and (b) dM/dT curves, where the anomalies assigned to T C and T g (in ZFC curve) are observed; (c) x = 0.25 ; (d) x = 0.5 ; (e) x = 0.75 ; (f) x = 1 .
Magnetochemistry 10 00061 g006
Figure 7. (a) Arrott–Noakes plot of Co7Zn7Mn6 in the vicinity of T C , using the 3D Heisenberg critical exponents and (b) T C extrapolation from the data obtained from the Arrott–Noakes plot.
Magnetochemistry 10 00061 g007
Figure 8. T C variation with the Fe content x in Co7Zn7Mn6−xFex samples.
Magnetochemistry 10 00061 g008
Figure 9. Real χ and imaginary χ components of the AC susceptibility as a function of temperature for Co7Zn7Mn6−xFex samples, f = 1000 Hz, H DC = 0, H AC = 5 Oe: (a) x = 0 ; (b) x = 0.25 ; (c) x = 0.5 ; (d) x = 0.75 ; (e) x = 1 .
Magnetochemistry 10 00061 g009
Figure 10. Imaginary χ component of the AC susceptibility for Co7Zn7Mn6−xFex, H DC = 0, H AC = 5 Oe: (a) x = 0 ; (b) x = 0.25 ; (c) x = 0.5 ; (d) x = 0.75 ; (e) x = 1 .
Magnetochemistry 10 00061 g010
Figure 11. Results of the power law fit to the χ component of AC susceptibility, in the frequencies range 40–1000 Hz for the Co7Zn7Mn6−xFex samples: (a) x = 0 ; (b) x = 0.25 ; (c) x = 0.5 ; (d) x = 0.75 ; (e) x = 1 .
Magnetochemistry 10 00061 g011
Figure 12. Results of the VFT law fit, for frequencies between 40 Hz and 1000 Hz, for the Co7Zn7Mn6−xFex samples: (a) x = 0 ; (b) x = 0.25 ; (c) x = 0.5 ; (d) x = 0.75 ; (e) x = 1 .
Magnetochemistry 10 00061 g012
Figure 13. Test for validity of dynamic scaling of the imaginary component of the magnetic susceptibility χ , shown in this figure for the end compositions x = 0 (a) and x = 1 (b). The plots in the insets of log 10 [ χ p ( f ) T p ( f ) ] against log 10 f are linear, with slopes β / z v = 0.074 ( 5 ) ( x = 0 ) and β / z v = 0.091 ( 5 ) ( x = 1 ) , demonstrating the validity of the relation χ p ( f ) T p ( f ) f β / z v .
Magnetochemistry 10 00061 g013
Figure 14. Real χ and imaginary χ components of AC susceptibility of Co7Zn7Mn6 at 110 K, up to 1000 Oe: f = 1000 Hz, H AC = 5 Oe.
Magnetochemistry 10 00061 g014
Figure 15. Magnetic phase diagram obtained from the χ component of AC susceptibility for Co7Zn7Mn6−xZnx: (a) x = 0 ; (b) x = 0.25 ; (c) x = 0.5 ; (d) x = 0.75 ; (e) x = 1 .
Magnetochemistry 10 00061 g015
Table 1. Lattice parameters and quality factors of the Rietveld refinement for the PXRD data of the Co7Zn7Mn6−xFex samples.
Alloya (Å) R wp R exp χ 2 GOF
Co7 Zn7Mn66.3801 (4)8.19%6.00%1.881.37
Co7Zn7Mn5.75Fe0.256.3781 (4)8.29%7.36%1.271.13
Co7Zn7Mn5.5Fe0.56.3741 (6)9.54%7.43%1.651.28
Co7Zn7Mn5.25Fe0.756.3725 (5)7.62%6.34%1.441.20
Co7Zn7Mn5Fe6.3705 (7)7.76%5.58%1.931.39
Table 2. Average composition of Co7Zn7Mn6−xFex samples determined by EDS.
AlloyCoZnMnFe
Co7Zn7Mn67.07 ± 0.267.10 ± 0.275.83 ± 0.18-
Co7Zn7Mn5.75Fe0.257.12 ± 0.266.99 ± 0.245.57 ± 0.190.32 ± 0.02
Co7Zn7Mn5.5Fe0.56.97 ± 0.257.15 ± 0.255.36 ± 0.180.52 ± 0.03
Co7Zn7Mn5.25Fe0.757.08 ± 0.267.06 ± 0.275.18 ± 0.170.68 ± 0.03
Co7Zn7Mn5Fe7.18 ± 0.257.06 ± 0.314.83 ± 0.150.93 ± 0.04
Table 3. Values obtained from the M(H) Co7Zn7Mn6−xFex full magnetisation curves at 2 K.
Alloy H C (Oe) M r ( μ B /f.u.)M (90 kOe) ( μ B /f.u.)
Co7Zn7Mn61312 (3)3.410 (1)7.786 (3)
Co7Zn7Mn5.75Fe0.251130 (2)3.435 (1)8.515 (4)
Co7Zn7Mn5.5Fe0.5895 (1)3.456 (1)9.163 (4)
Co7 Zn7 Mn5.25Fe0.75682 (1)3.855 (2)9.866 (5)
Co7Zn7Mn5Fe645 (1)3.890 (2)11.610 (6)
Table 4. Magnetic ordering temperature, T C , for the Fe substituted alloys, obtained from the Arrott–Noakes plots.
Alloy T C (K)
Co7Zn7Mn6173.8 (2)
Co7Zn7Mn5.75Fe0.25179.6 (1)
Co7Zn7Mn5.5Fe0.5188.1 (2)
Co7Zn7Mn5.25Fe0.75218.1 (2)
Co7Zn7Mn5Fe243.6 (3)
Table 5. Values of the parameters of a power law fit to the χ component data of Co7Zn7Mn5−xFex with the Mydosh parameter included in the last column.
Alloy T g (K) τ (s) zv ϕ
Co7Zn7Mn624.7 (2) 1.7 × 10 6 6.67 (1)0.056
Co7Zn7Mn5.75Fe0.2523.1 (2) 5.5 × 10 6 5.25 (1)0.081
Co7 Zn7Mn5.5Fe0.522.6 (2) 5.7 × 10 6 5.88 (1)0.079
Co7Zn7Mn5.25Fe0.7520.2 (3) 5.1 × 10 6 5.29 (2)0.054
Co7Zn7Mn5Fe14.7 (3) 6.4 × 10 6 6.02 (8)0.067
Table 6. Values obtained from the VFT fitting for Co7Zn7Mn6−xFex. The Tholence parameter δ T is given in the last column.
Alloy T 0 (K) τ 0 (s) E a / k B (K) δ T
Co7Zn7Mn624.4 (1) 1.1 × 10 5 22.1 (5)0.106
Co7Zn7Mn5.75Fe0.2522.6 (1) 5.2 × 10 5 24.9 (6)0.150
Co7Zn7Mn5.5Fe0.521.2 (1) 2.3 × 10 5 21.4 (5)0.187
Co7Zn7Mn5.25Fe0.7519.6 (2) 4.5 × 10 5 20.9 (3)0.139
Co7Zn7Mn5Fe13.7 (1) 1.2 × 10 5 18.1 (3)0.189
Disclaimer/Publisher’s Note: The statements, opinions and data contained in all publications are solely those of the individual author(s) and contributor(s) and not of MDPI and/or the editor(s). MDPI and/or the editor(s) disclaim responsibility for any injury to people or property resulting from any ideas, methods, instructions or products referred to in the content.