1. Introduction
The fully automated CLIA analyzer represents a typical in vitro diagnostic instrument [
1], which can accurately measure human biomarkers and is widely used in health examinations and disease screening [
2,
3,
4]. The CLIA analyzer integrates CLIA technology, which combines highly sensitive chemiluminescence technology with highly specific immunoassay technology [
4], and immunomagnetic bead separation technology, which utilizes the response of immunomagnetic beads to magnetic fields to separate them from the mixed solution, achieving rapid separation and easy automation [
5]. Chemiluminescence is the phenomenon of light emission that occurs during a chemical reaction. In a chemiluminescence immunoassay, immunomagnetic beads capture analytes in the sample through specific antigen–antibody binding, and chemiluminescent markers are then attached to form magnetic immune complexes. Unbound free chemiluminescent markers and other impurities in the sample are then removed by magnetic separation and cleaning. Finally, the chemiluminescent substrate is added to excite the chemiluminescence signal of the markers [
6]. Only after the interference substances are removed through magnetic separation and cleaning can the final luminescence value be directly proportional to the analyte content in the sample.
The magnetic separation and cleaning module serves as the core component of the fully automated CLIA analyzer, directly affecting the results of CLIA. Its performance is mainly embodied in the following aspects:
Magnetic bead loss rate. Loss of magnetic immune complexes during the cleaning process will lead to lower luminescence values, making the detection results lower than the true values, thus affecting the accuracy and sensitivity of analysis results;
Coefficient of variation of magnetic bead loss rate. The consistency of the magnetic bead loss rate during the cleaning process affects the precision of final detection results;
Cleaning effect of free markers. When unwashed free markers are excited, the luminescence values will be higher than the true values, resulting in detection results that are higher than the true results and even false-positive results;
Cleaning time. The processing time of the magnetic separation and cleaning module affects the detection time of the target analyte.
The magnetic separation and cleaning module of traditional CLIA analyzers still faces challenges in terms of performance indicators. For example, increasing the number of magnetic separation rounds to ensure the cleaning effect of free markers will increase the loss rate of magnetic beads; extending the collection time for magnetic beads to reduce the magnetic bead loss rate may prolong the module’s cleaning time; setting more cleaning positions to enhance cleaning throughout may result in larger module size. Therefore, the improvement of the overall performance of the CLIA analyzer requires research on the immunomagnetic bead separation technology of the magnetic separation and cleaning module.
In the process of an immunoassay, after capturing analytes through specific immune reactions, the immune complexes need to be separated from the mixed solution to achieve cleaning and purification of analytes. Immunomagnetic bead separation utilizes magnetic beads as solid-phase carriers for antibodies or antigens to specifically capture the analyte. Compared with general solid-phase separation methods, magnetic beads offer a larger specific surface area [
7], ensuring greater exposure to the analyte solution [
8]. Moreover, they can uniformly suspend in the environment without a magnetic field, allowing for capturing analytes more quickly and fully. Following the capture, the magnetic beads can rapidly aggregate under an external magnetic field due to their unique magnetic response [
9]. Therefore, immunomagnetic bead separation technology stands out as one of the most effective separation technologies, with the advantages of high purity, fast separation speed, and simple operation [
10].
Due to its numerous advantages, the immunomagnetic bead separation technology is widely used in various fields, including clinical diagnostics [
11], cell sorting [
12,
13], virus isolation [
14,
15], and food sample pretreatment [
16,
17]. Guo et al. [
11] developed an immunomagnetic separation system based on Strep-tag II. Utilizing specially modified immunomagnetic beads, exosomes could be separated within 38 min with a separation efficiency of 82.5% under optimal conditions. He et al. [
14] prepared HIV immunomagnetic beads for capturing HIV antibodies in urine, achieving capture efficiency ranging from 80.42% to 93.99% with a capture time of from 15 to 30 min at room temperature. Shan et al. [
16] utilized immunomagnetic bead separation technology to capture Salmonella in food samples and investigated the capture efficiency at different immunomagnetic separation times. The optimal separation time for this magnetic separation system was 3 min, achieving a capture efficiency of 83.2%.
With the further study of the characteristics [
18] and transport analysis [
19] of magnetic particles, magnetic separation technology has progressively advanced into techniques, such as high gradient magnetic separation [
20], magnetophoretic separation [
13,
19], magnetic continuous-flow separation [
21], and other methods with specialized structures [
22,
23], and have been integrated onto a single microfluidic chip [
24,
25,
26,
27]. Wang et al. [
15] constructed a magnetophoretic system for capturing and separating avian influenza viruses. The average separation efficiencies at sample flow rates of 120, 180, 240, and 320 μL/min were, respectively, 88%, 81%, 42%, and 8%, indicating a decrease in separation efficiency with increasing flow rate. Li et al. [
28] proposed a self-assembled immunomagnetic bead chain separation method and set up a separation platform, achieving a separation efficiency of 80.9% for prostate cancer (PC3) cells. Yu et al. [
25] applied magnetic separation technology to microfluidic chips and developed a fishbone-shaped magnetic separation chip with a cancer cell recovery rate of 68.4%. Vu-Dinh et al. [
26] used a microfluidic chip with a serpentine microchannel and cavities, achieving a capture rate of approximately 74% for human lung carcinoma A549 cells within 15 min. Fang et al. [
27] designed a microfluidic chip containing staggered nickel-doped cylindrical micropillars. High exosome recovery (76.54%) was reached at a high separation throughput. Lim et al. [
17] developed an automated immunomagnetic separation system to collect magnetic beads in the form of magnetic recovery bars. After 30 min in 250 mL of sample solution, including two collection cycles, the recovery rate reached over 95%. While this system exhibited a high recovery rate, this design was only suitable for processing large-volume samples, and the total operation time was relatively long. Oh et al. [
29] proposed a magnetizable micropipette tip, incorporating a ferromagnetic matrix of nickel meshes placed inside the tip and a permanent magnet placed outside the tip to magnetize the nickel mesh to achieve high-throughput immunomagnetic bead separation. It could process 1 mL of sample within 7 min, with a recovery rate of 90.5%, while manual operation was a limitation. Liang et al. [
30] built a sidewall magnetic separation device capable of achieving fully automated magnetic separation. However, only two samples could be processed simultaneously, leaving room for improvement in sample processing flux.
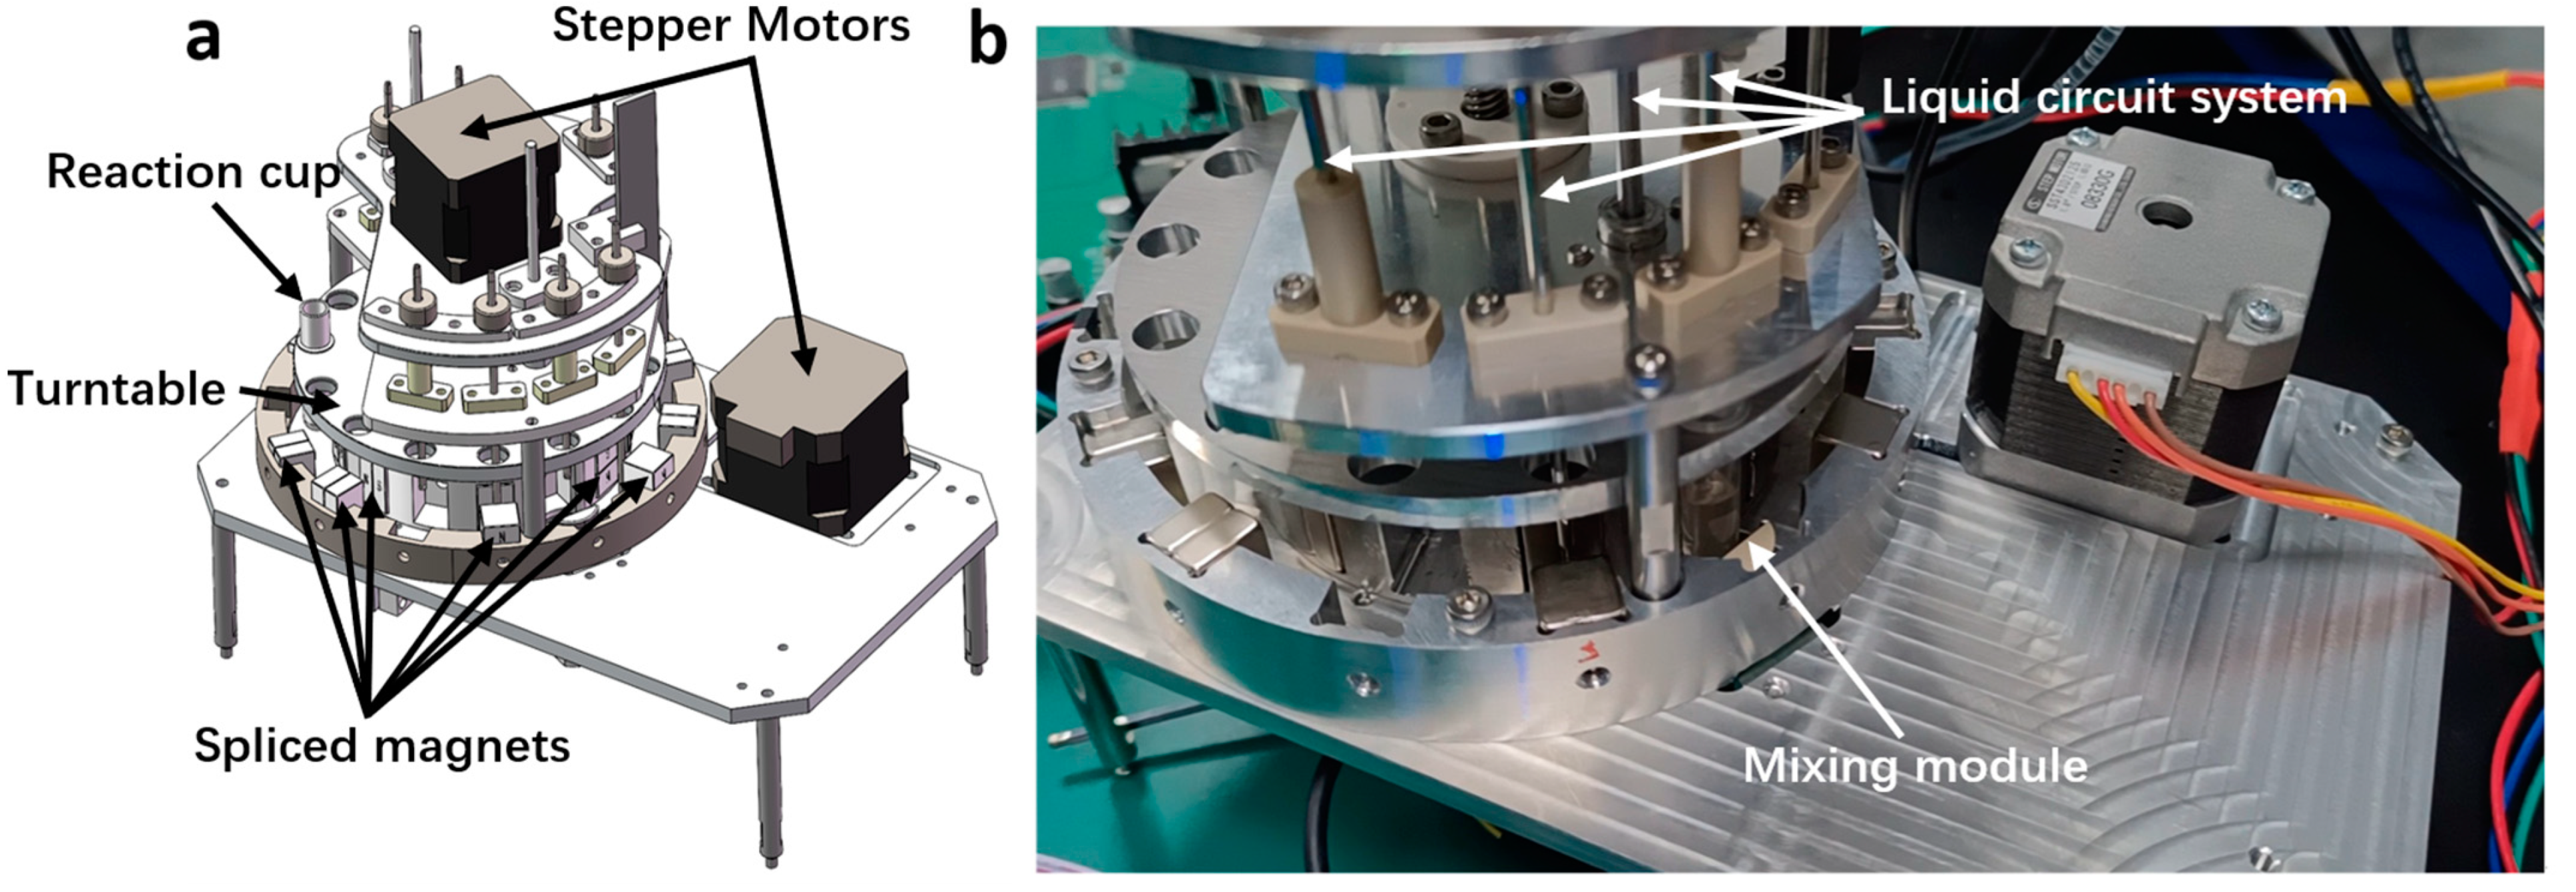
The magnetic beads used in immunomagnetic bead separation technology are easily manipulated by the external magnetic field, greatly facilitating the automation of magnetic separation and cleaning. Therefore, most CLIA analyzers use immunomagnetic bead separation technology. Jiang et al. [
31] disclosed a magnetic separation cleaning device for in vitro diagnostic instruments in which they designed the reaction cup holder and the magnetic holder as a circular ring shape and adopted three types of working magnets (Types A, B, and C) to collect magnetic beads. Types A, B, and C were cuboidal, spliced cubic, and spliced cylindrical magnets, respectively. The average magnetic bead loss rate of a single Type A magnet in operation was 41%, while the average loss rate when all three types (A, B, and C) worked consecutively was 14.6%. It was proven that the designed structure could reduce the loss rate of magnetic beads, but the collection time of magnetic beads was relatively long at 3 min. Ma et al. [
32] developed a fully automated CLIA analyzer, where the magnetic separation and cleaning module was divided into liquid absorption and liquid discharge areas. The magnet module for collecting magnetic beads was composed of six magnets at equal intervals to achieve the basic cleaning of free markers. However, the coefficient of variation of the luminescence values was relatively high at 11.54%. Zhang et al. [
33] disclosed a fully automated immunoassay analyzer and its cleaning device, where the reaction cup holder of the magnetic separation and cleaning module was designed as an inline type, accommodating up to four reaction cups simultaneously. This device achieved miniaturization, but only four samples could be cleaned at the same time, resulting in a lower cleaning flux for the module.
In summary, the existing immunomagnetic bead separation devices used for experiments generally have the problem of long magnetic separation time, and there is still considerable room for improvement in performance indicators such as magnetic bead loss rate, coefficient of variation, cleaning effect of free markers, and cleaning flux.
Based on this, this work systematically investigates the key technology of magnetic separation and cleaning modules for fully automated CLIA analyzers. Through a combination of theoretical, simulative, and experimental analysis, we optimize the method of arranging spliced rectangular magnets on opposite sides, where the same polarity faces each other, as well as a three-stage magnetic bead collection method. The effectiveness of this method is verified through the tests of loss rate and cleaning effect.
3. Results and Discussion
We established a simulation model of the permanent magnet magnetic field using the commercial simulation software COMSOL 5.6 and compared various configurations to determine the most effective magnet arrangement. Then, we validated the simulation results through experiments on the magnetic bead loss rate and the cleaning effect of free markers. We confirmed key performance indicators of the proposed magnetic separation and cleaning module, such as cleaning time, magnetic bead loss rate, coefficient of variation of loss rate, and cleaning effect of free markers, to evaluate the overall performance of the module. Improving the performances of the magnetic separation and cleaning module would help to enhance the accuracy and repeatability of the CLIA results and reduce the detection time, resulting in a positive impact on the overall performance of the fully automated CLIA analyzer.
3.1. Simulation Analysis
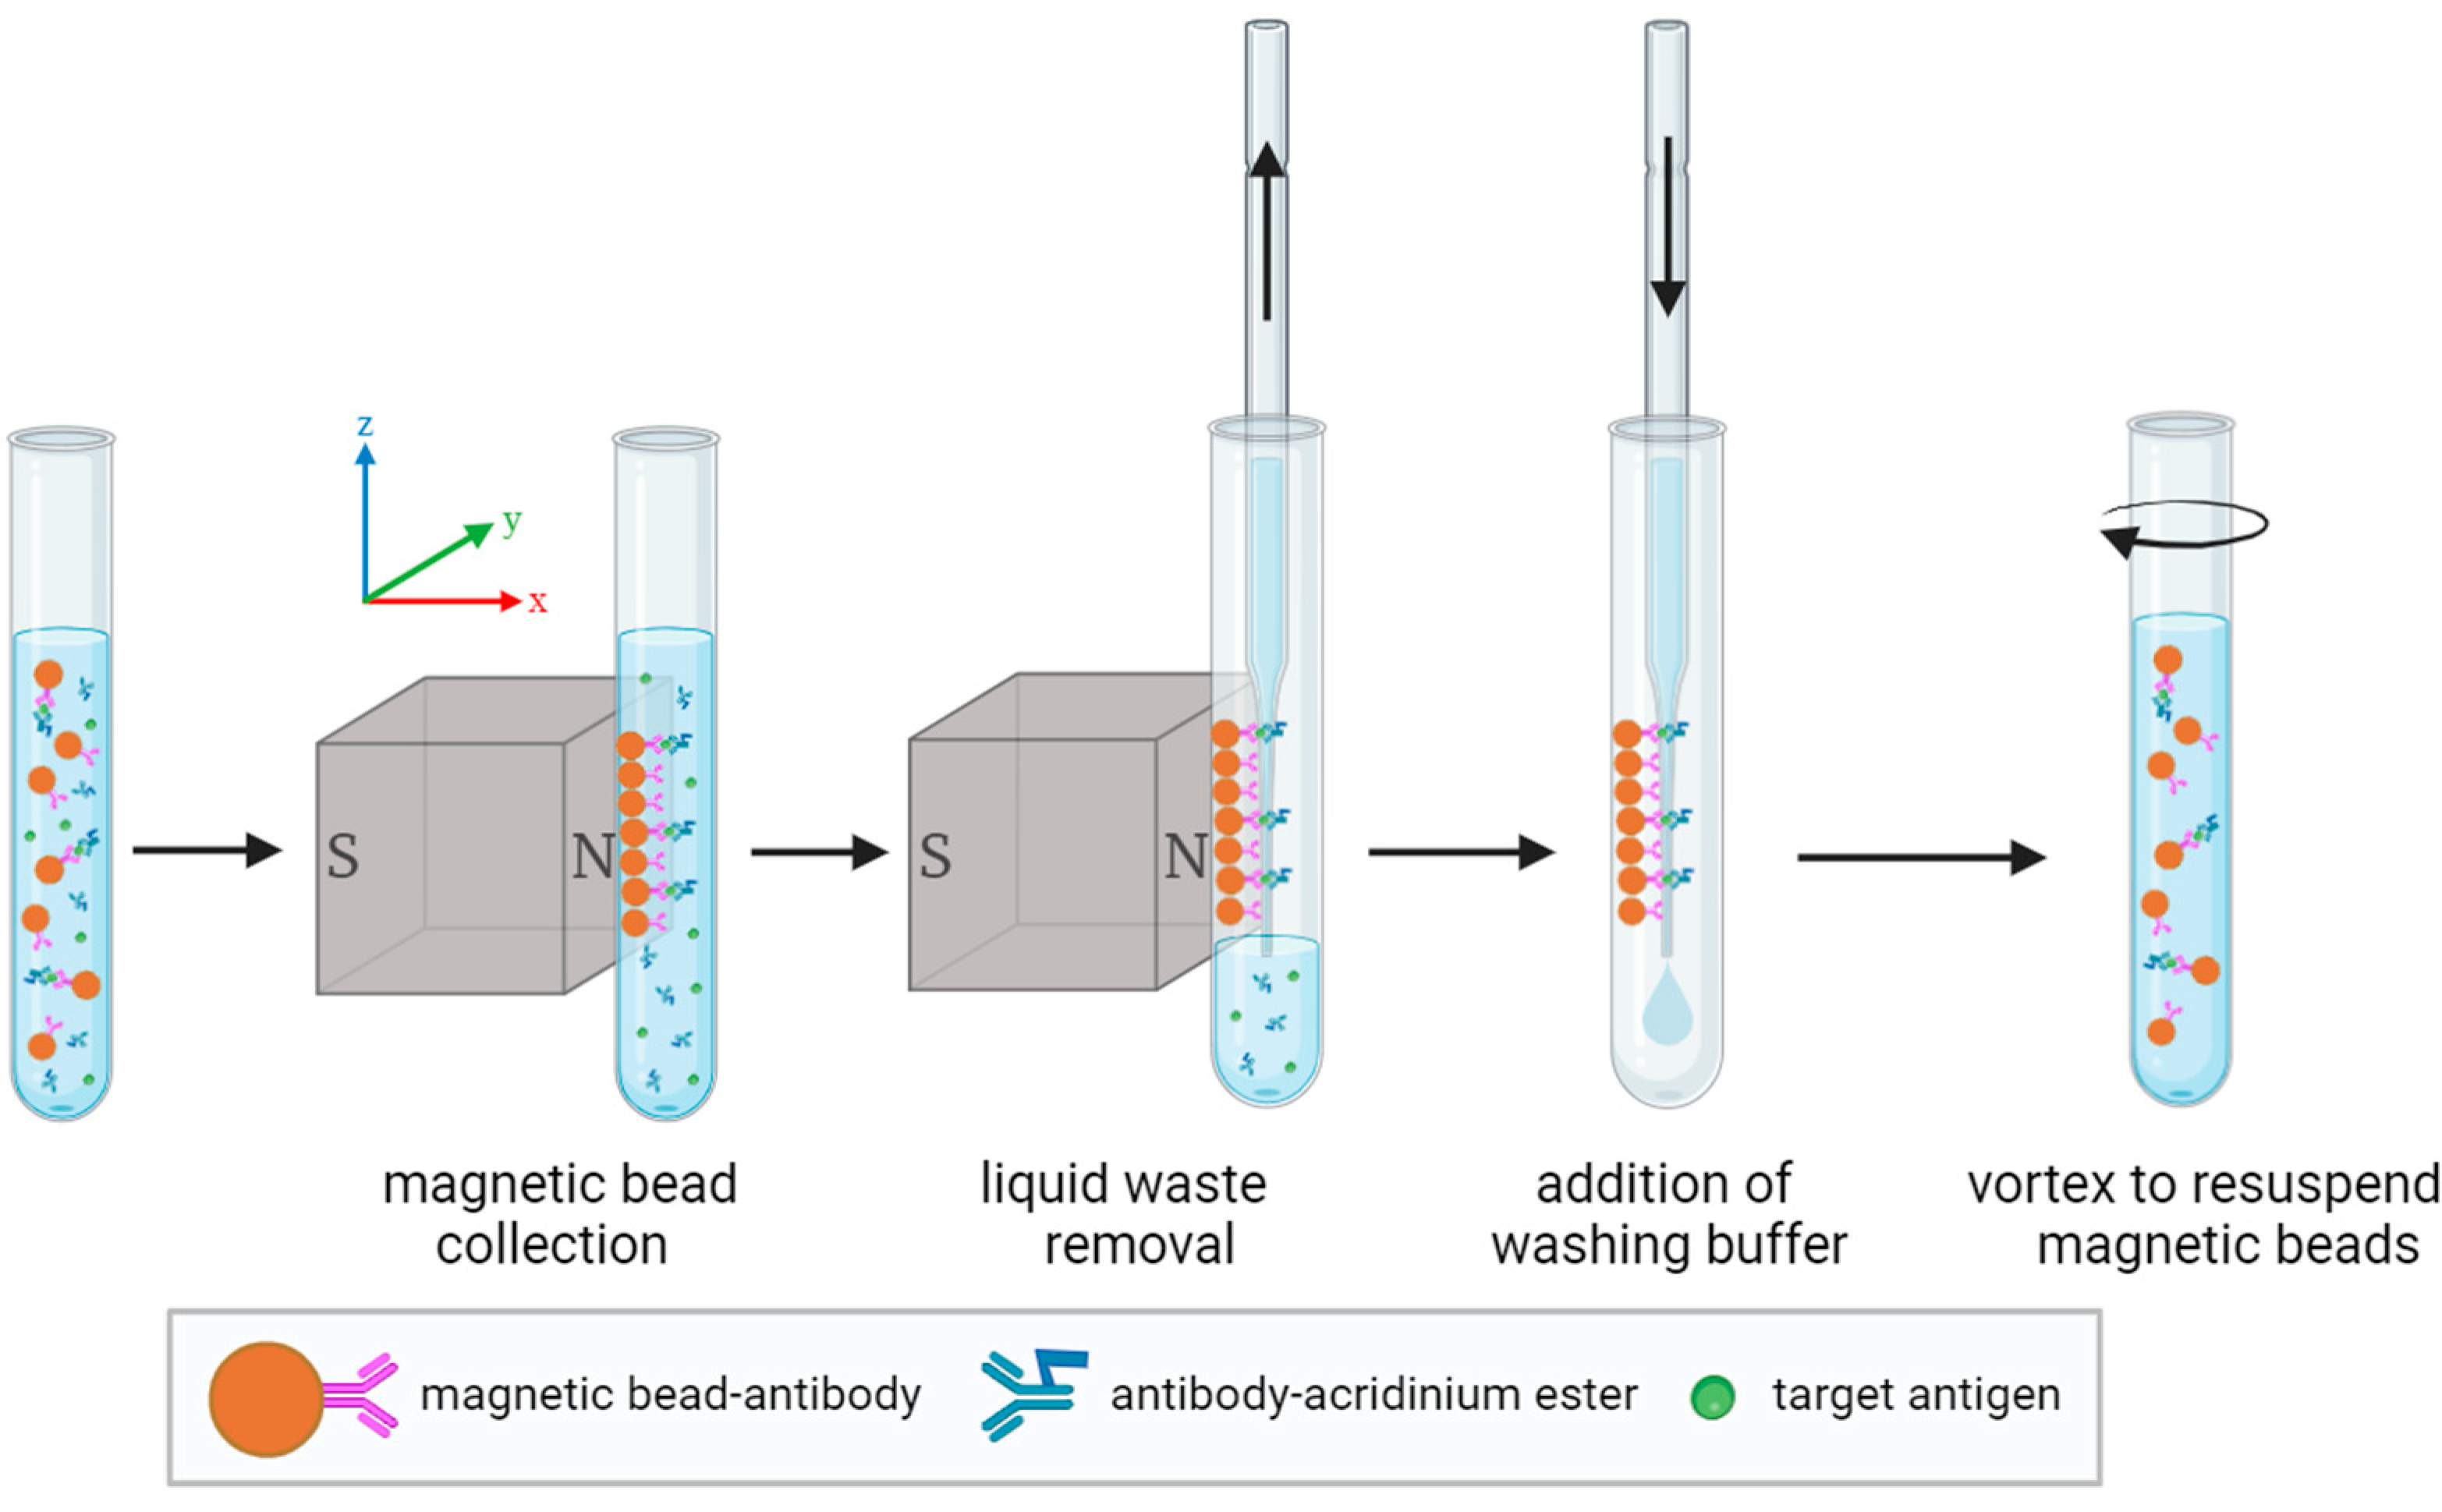
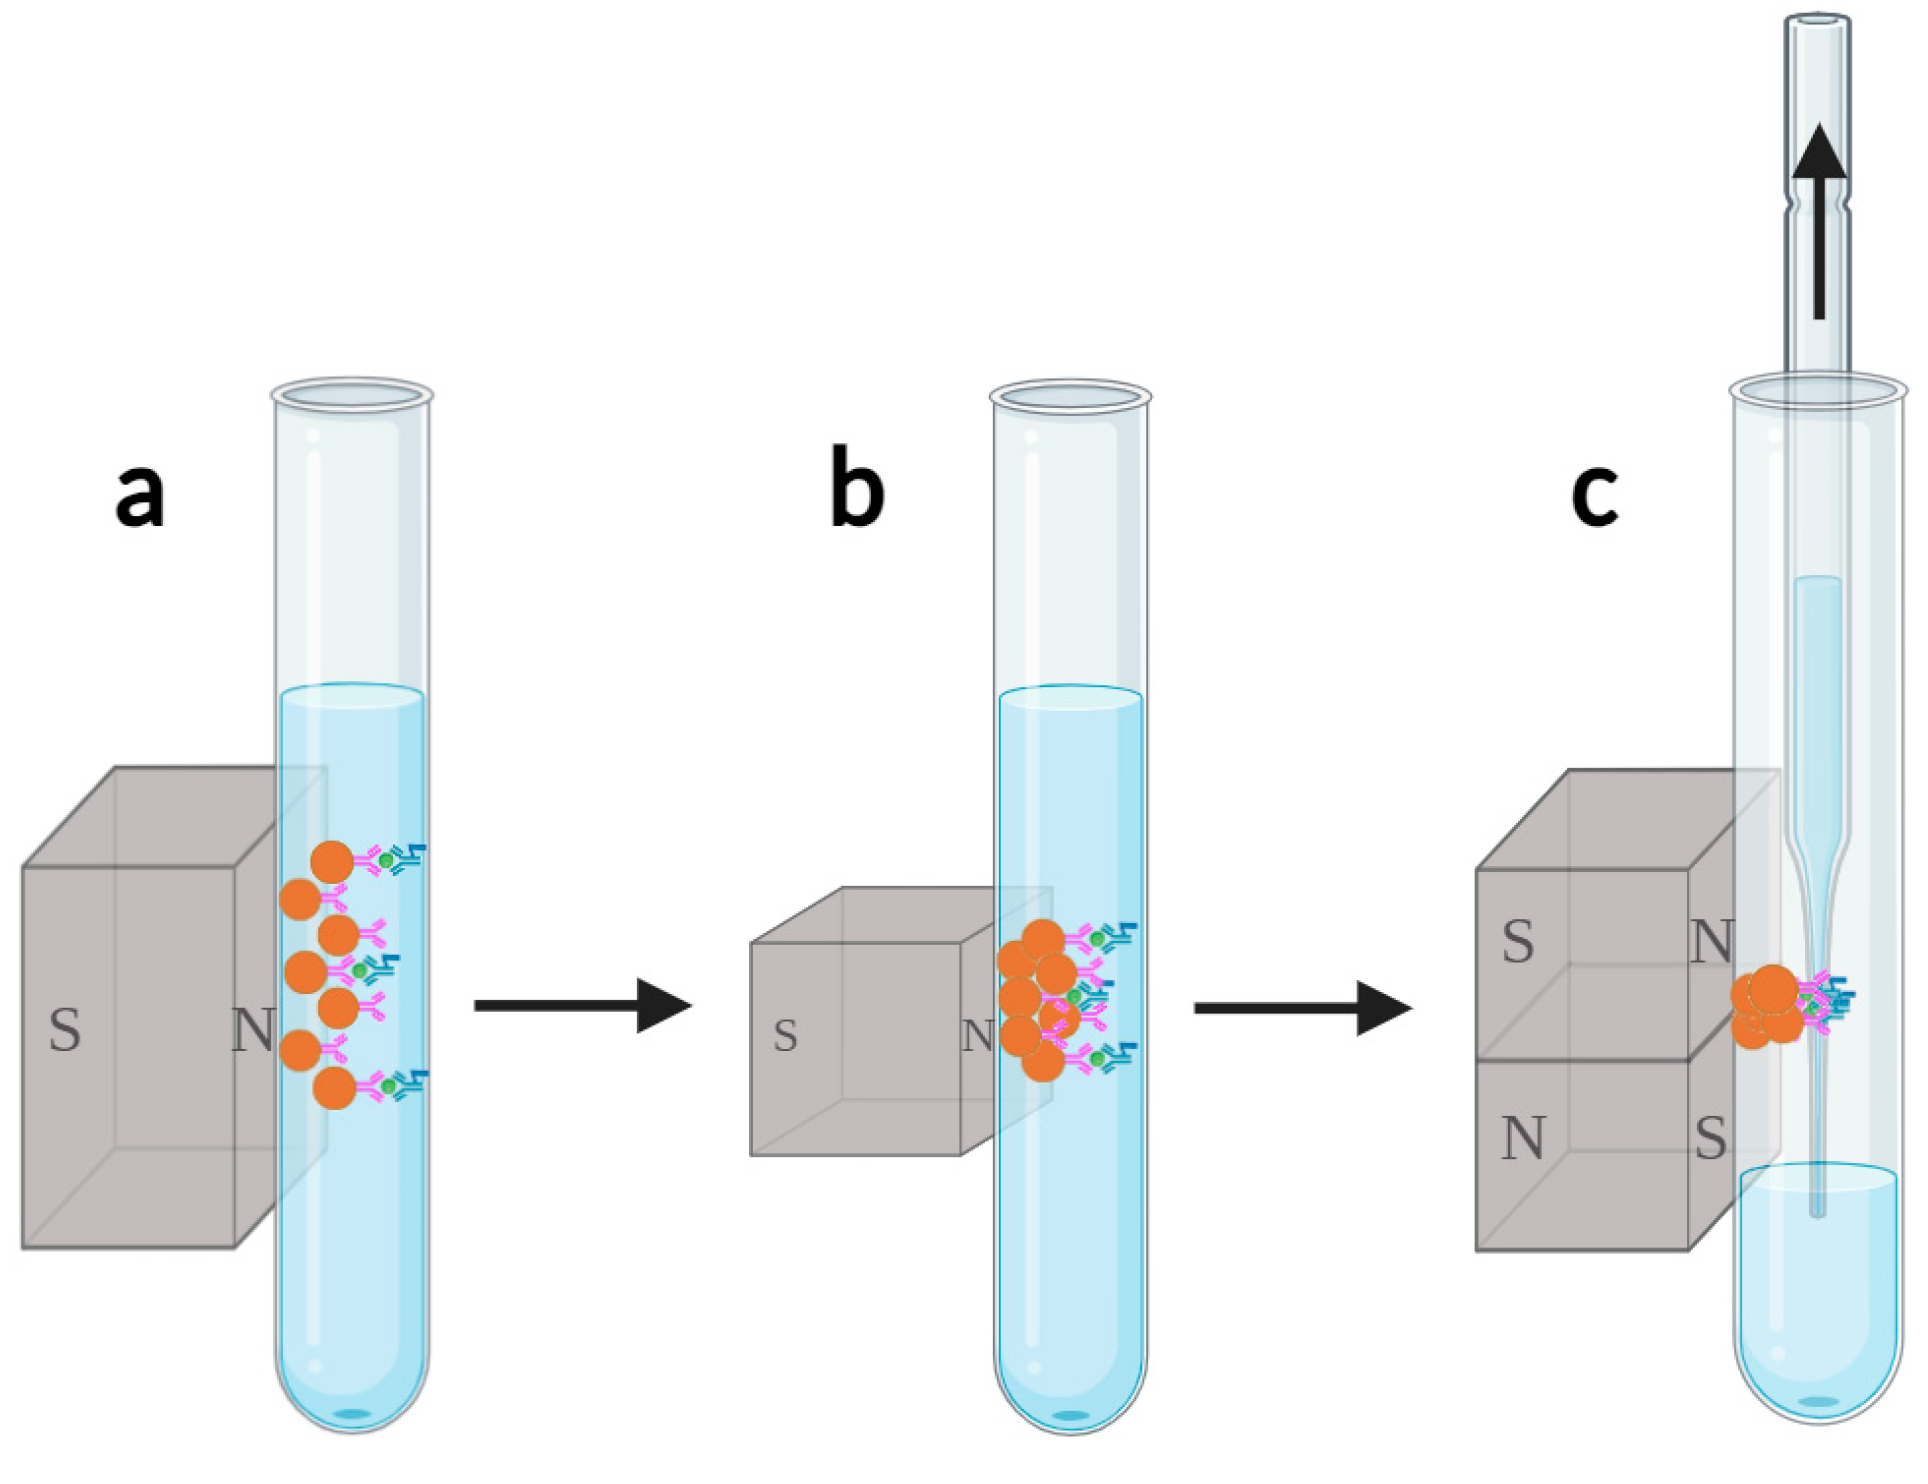
Magnetic separation and cleaning, as an important part of CLIA, specifically includes four steps: magnetic bead collection, liquid waste removal, the addition of washing buffer, and vortexing to resuspend the magnetic beads [
34], as shown in
Figure 2. The process of magnetic bead collection involves using a permanent magnet to magnetically attract dispersed magnetic beads, causing them to aggregate on the sidewall of the reaction cup. However, unbound acridinium ester-labeled antibodies and other impurities in the sample are not magnetized or attracted, remaining dispersed in the solution. The liquid waste removal process is achieved by inserting a liquid suction needle into the reaction cup to remove the solution containing free markers and impurities, while the magnetic beads adsorbed on the sidewall of the reaction cup will not be suctioned out and will remain in the reaction cup. The addition of washing buffer and vortex to resuspend magnetic beads serves to evenly disperse the magnetic beads in the solution again, thereby releasing some free markers and impurities carried by the magnetic beads back into the solution. Typically, the above steps need to be repeated several times to ensure complete removal of free markers and impurities, thereby avoiding interference with the detection results.
The magnetic separation and cleaning module is divided into three areas: the magnetic bead collection area, the liquid suction area, and the liquid addition and resuspension area. Both the magnetic bead collection area and the liquid suction area use the appropriately designed magnetic field to effectively control the magnetic beads. Particularly, the process of the magnetic beads transitioning from a dispersed to an aggregated state in the magnetic bead collection area is greatly affected by the magnetic field. The rational design of the magnetic field directly affects the performance indicators of the magnetic separation and cleaning module. We established a simulation model of the permanent magnet magnetic field using COMSOL and analyzed the detailed force and motion of uniformly dispersed magnetic beads in the magnetic bead collection area. Based on the distribution of the magnetic field and the forces acting on magnetic beads, we optimized the method of arranging spliced rectangular magnets on opposite sides, where the same polarity faced each other, as well as a three-stage magnetic bead collection method. All figures in this section were obtained through COMSOL simulations.
3.1.1. Magnetic Bead Collection Area
The efficiency of magnetic separation and cleaning is related to the trajectory and velocity of the magnetic beads under the influence of the magnetic field, so it is necessary to analyze the forces on them. During the magnetic separation and cleaning process, the forces acting on the magnetic beads mainly include magnetic field force, viscous drag, buoyancy, and gravity [
35,
36].
The magnetic force acting on magnetic beads in a magnetic field (
) is expressed by Equation (1) [
37]:
where
is the permeability of free space,
is the susceptibility of magnetic beads,
is the susceptibility of the solution,
is the volume of magnetic beads, and
is the applied magnetic field intensity at the center of magnetic beads. The magnetic field force acting on a single magnetic bead depends on the magnetic field intensity and its gradient [
38,
39]. By using permanent magnets with a high magnetic energy product, the gradient of the magnetic field intensity can be increased through structural design, thereby increasing the magnetic force acting on the magnetic beads. This will help to speed up the magnetic bead aggregation and improve the efficiency of magnetic separation and cleaning.
Magnetic beads move through incompressible viscous fluid and experience viscous drag opposite to their direction of motion. The spherical magnetic beads moving at a lower speed in the stationary solution can be considered to experience laminar flow in the reaction cup, in accordance with Stokes’s law [
40]. Therefore, the viscous drag acting on magnetic beads (
) is expressed by Equation (2):
where
is the viscosity of the solution,
is the radius of magnetic beads, and
is the velocity of magnetic beads.
The gravity of magnetic beads (
) is expressed by Equation (3):
where
is the density of magnetic beads and
is the acceleration of gravity.
The buoyancy of magnetic beads (
) is expressed by Equation (4):
where
is the density of the solution.
When collecting magnetic beads, the permanent magnet is placed on the side of the reaction cup. Subject to the combined effects of magnetic force, viscous drag, gravity, and buoyancy, the magnetic beads move toward the sidewall of the reaction cup near the magnet until they adhere to the inner wall of the reaction cup. The gravity and buoyancy acting on magnetic beads along the
z-axis (axial direction according to the coordinate system in
Figure 2, same below) are much smaller compared to the magnetic force and can be neglected in the analysis of magnetic bead motion. Therefore, only the magnetic force and viscous drag need to be analyzed [
41]. By combining Equations (1) and (2), the motion of magnetic beads is expressed by Equation (5):
According to the arrangement of permanent magnets, the distribution of the magnetic field intensity and its gradient in the spatial coordinate system is obtained through magnetic field simulation, then substituted into the differential Equation (5) for solution to estimate the time of magnetic bead aggregation.
Based on the magnetic force formula, the magnetic force acting on magnetic beads is proportional to
, so the distribution of the magnetic force at that point is characterized by the simulation of
on the key cross-sections of the reaction cup (circular and rectangular cross-sections in
Figure S2). Using COMSOL, we simulated the magnetic force exerted by both conventional rectangular magnets (conventional magnets) measuring 10 mm
10 mm
10 mm and spliced rectangular magnets with alternating N and S poles (designed magnets) of the same size. Additionally, we considered various arrangements, including the placement of magnets on one side or opposite sides of the reaction cup, the number of pieces of designed magnets, and the polarities facing each other being the same or opposite when magnets are set on both sides (see
Supplementary Sections S2.1.1 and S2.2.1). Notably, in
Figure 3b,c, the arrangement of two-piece designed magnets on opposite sides of the reaction cup with the same polarity facing each other (see
Figure 3a) demonstrates a clear trend of magnetic force to concentrate towards both sides of the cup wall, which is more conducive to the aggregation and adhesion of magnetic beads. The arrangement of the designed magnets on opposite sides fully utilizes its advantage of generating a larger magnetic force on the magnetic beads in the region close to the permanent magnet. Also, it effectively avoids its disadvantage of exerting a very small magnetic force on the magnetic beads in the region far from the permanent magnet. Consequently, the magnetic beads in all regions can quickly aggregate on the cup wall, thereby improving the aggregation efficiency of the magnetic beads. In combination with force analysis and trajectory simulation (see
Supplementary Sections S2.1.2 and S2.2.2), this arrangement completes magnetic bead collection within 5 s, which is much faster than others. Therefore, we propose placing the designed magnets on opposite sides of the reaction cup with the same polarity facing each other, as the magnetic force distribution of this arrangement best suits the requirements for magnetic bead collection.
3.1.2. Liquid Suction Area
The permanent magnets in the liquid suction area need to exert a sufficiently large magnetic force on the magnetic beads to resist the drag force generated by the solution flow when the liquid suction needle extracts the waste liquid, thus preventing the redispersion of the magnetic beads and their removal with the waste liquid. The drag force (
) is expressed by Equation (6):
where
is the drag coefficient,
is the velocity of the solution flow, and
is the projected area of magnetic beads in the direction of the solution flow.
During the magnetic bead collection stage, the magnetic beads, influenced by the magnetic force, will aggregate into elongated shapes on both sides of the cup wall near the permanent magnets, with a length slightly shorter than the height of the permanent magnet. In this state, the mutual attractive force between the magnetic beads is relatively weak, while the contact area with the solution is relatively large. According to Equation (6), when there is relative motion between fluid and solid, the larger the contact area between them, the greater the drag force exerted on the solid. Therefore, when removing the waste liquid, the magnetic beads are easily removed along with the waste liquid since they experience a significant drag force. It is necessary to further aggregate the magnetic beads to reduce their contact area with the solution.
According to
Figure 3d, changing the joints of the designed magnets to be parallel to the circular cross-section of the reaction cup (along the
y-axis) results in a magnetic force component directed towards the middle of the cup wall’s two sides, as shown in
Figure 3e,f. The elongated magnetic beads are further aggregated towards the middle position.
According to Equation (1), we can calculate the z-component of
at the reaction cup wall during the magnetic bead collection and liquid suction areas (represented by the blue and red lines in
Figure S12a,b). As shown in
Figure S12c, the blue curve representing the z-component of the magnetic force in the magnetic bead collection area exhibits peaks at both ends of the reaction cup wall, but is relatively small in the middle region, making it difficult for the magnetic beads to further aggregate. In contrast, the peaks of the red curve representing the liquid suction area emerge in the middle region of the reaction cup wall, which has a larger z-component of the magnetic force. This facilitates the further aggregation of elongated magnetic beads into dot-like shapes towards the middle of the cup wall. The magnetic beads gathered in dot-like shapes exhibit greater mutual attraction, resulting in a reduction in their contact area with the solution and, subsequently, a decrease in the drag force on the magnetic beads.
3.1.3. Three-Stage Magnetic Bead Collection Method
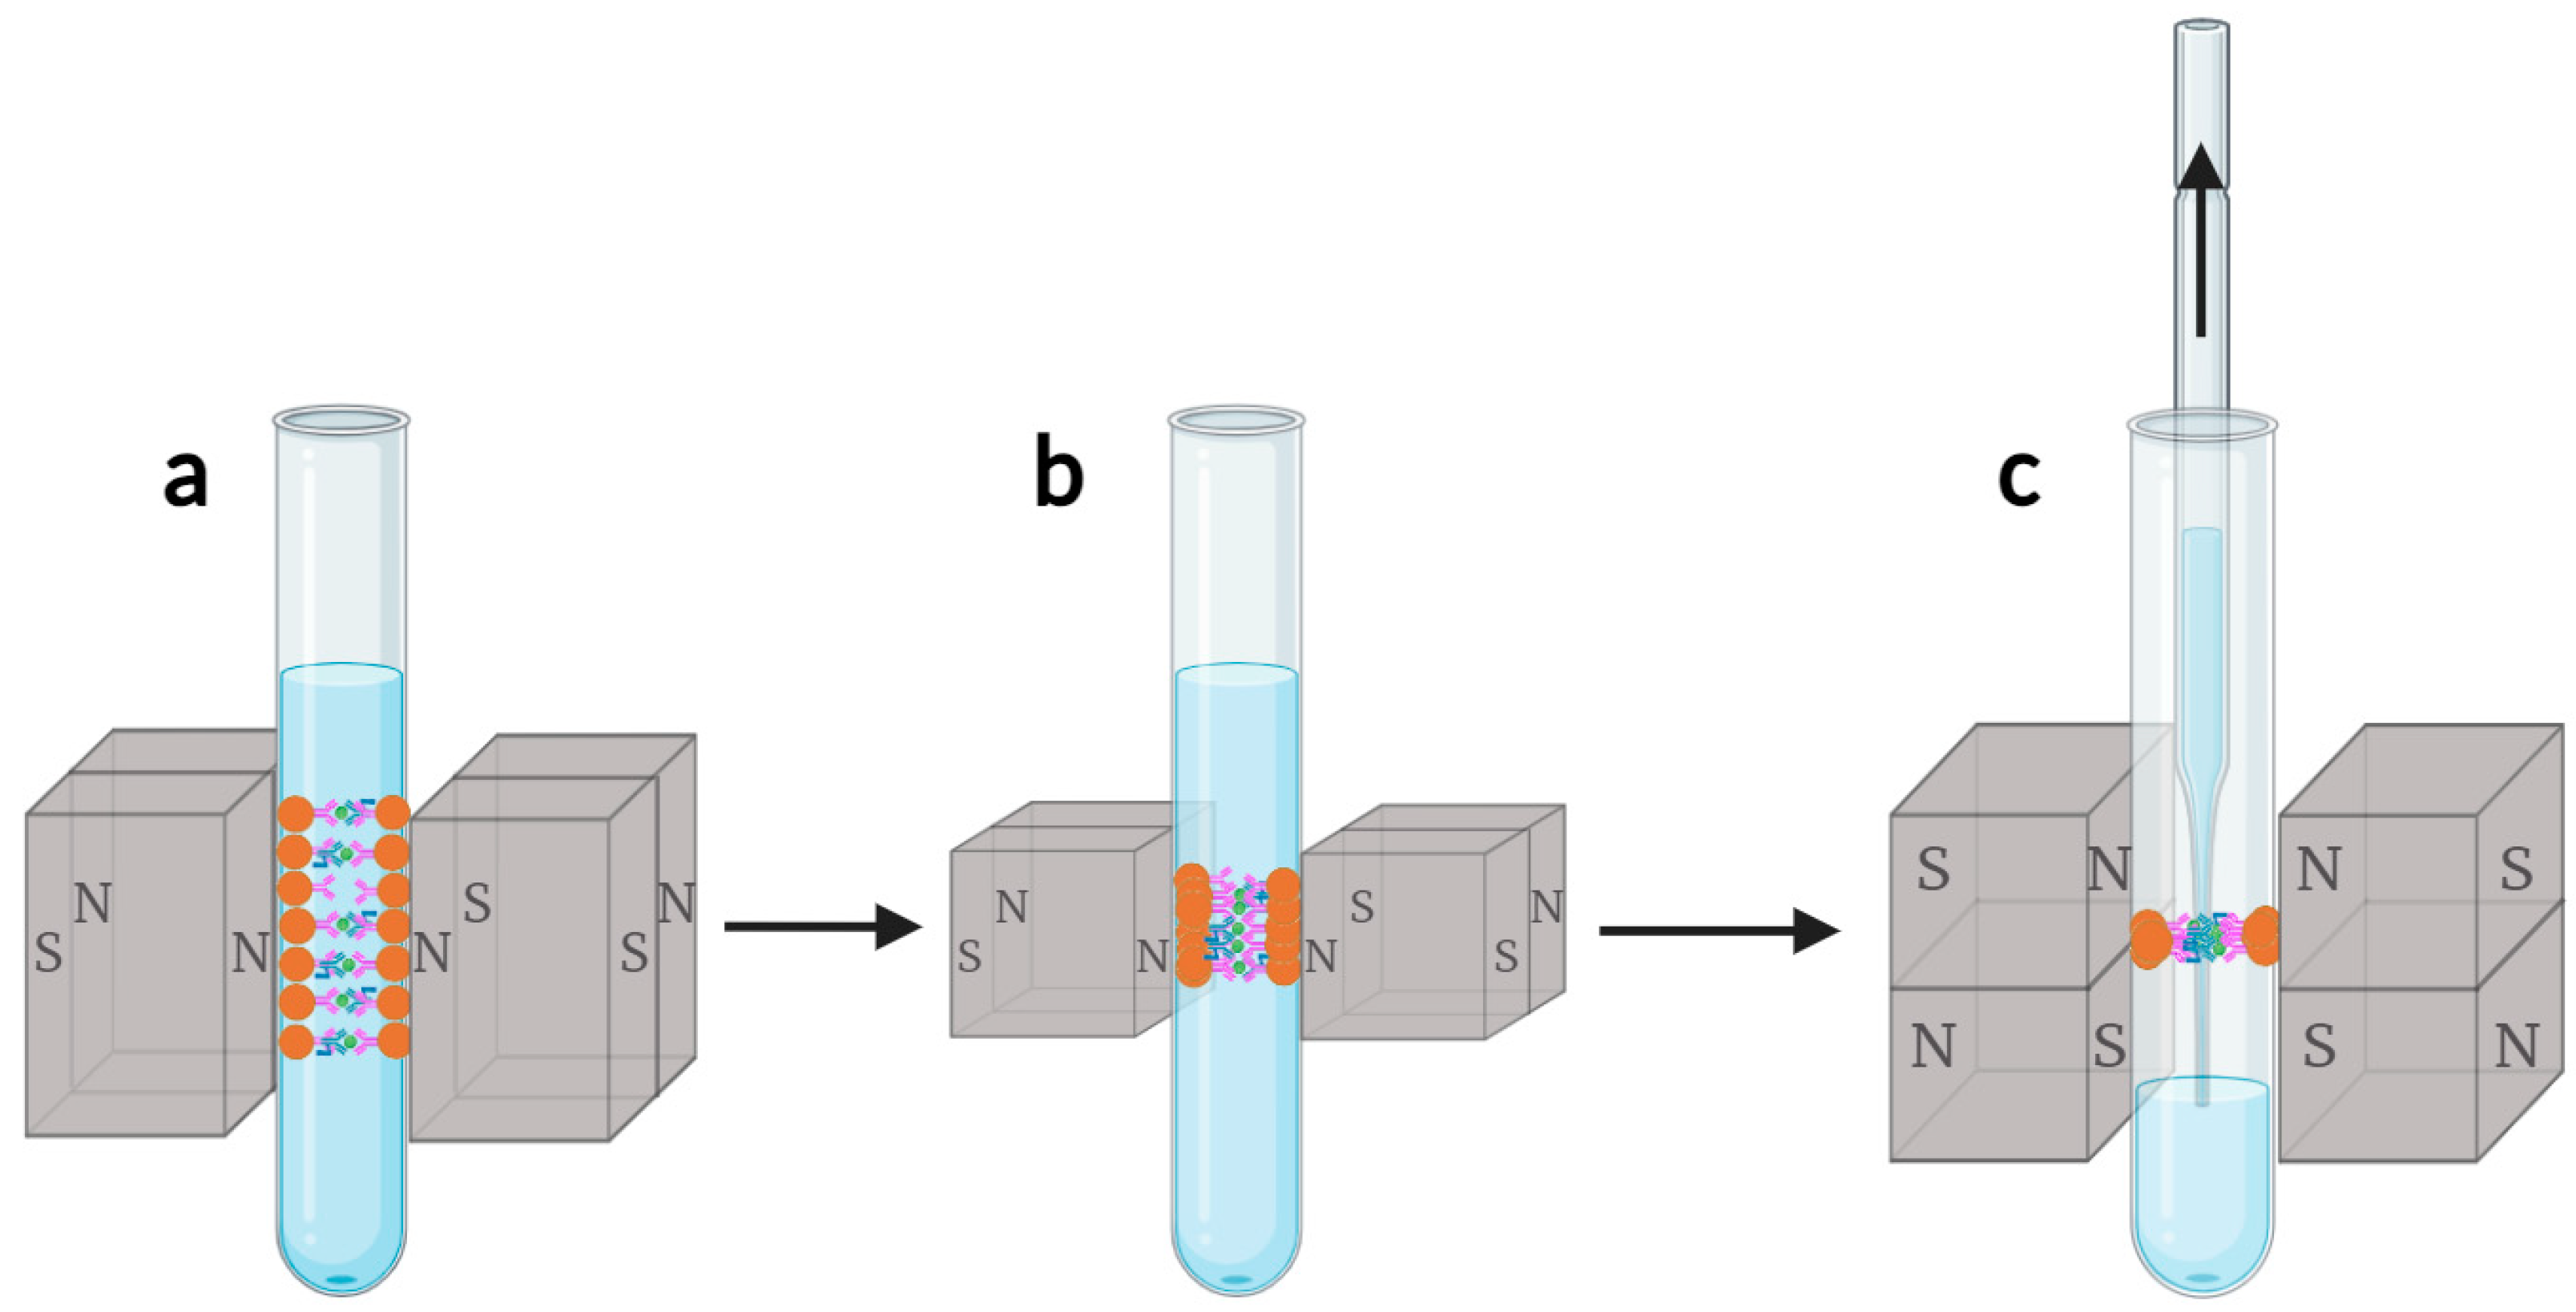
To ensure complete magnetic bead collection and aggregation into dot-like shapes, we propose a three-stage magnetic bead collection method, as shown in
Figure 4. The magnetic bead collection area is divided into two stages for attracting magnetic beads, while the liquid suction area constitutes the third stage of magnetic bead collection. In the first stage, as shown in
Figure 4a, larger-sized permanent magnets are used to form a larger magnetic field, gathering uniformly dispersed magnetic beads towards the cup wall. In the second stage, as shown in
Figure 4b, permanent magnets with the same structure but smaller in size are utilized to further collect and aggregate elongated magnetic beads towards the middle, where the magnetic beads fall into the peak zone of the z-component of the magnetic force exerted by the permanent magnets in the third-stage liquid suction area. In the third stage, as shown in
Figure 4c, the orientation of the joints of the permanent magnets is changed, causing the elongated magnetic beads to gather into dot-like shapes. The three-stage magnetic bead collection method collects the magnetic beads progressively by adding smaller-sized permanent magnets, deeply analyzing the distribution characteristics of magnetic beads at each stage. Based on the results of the magnetic field simulation, suitable arrangements of magnets are selected to aggregate the magnetic beads into the most stable dot-like shapes gradually, effectively improving the collection efficiency of magnetic beads while minimizing the loss of magnetic beads during the cleaning process.
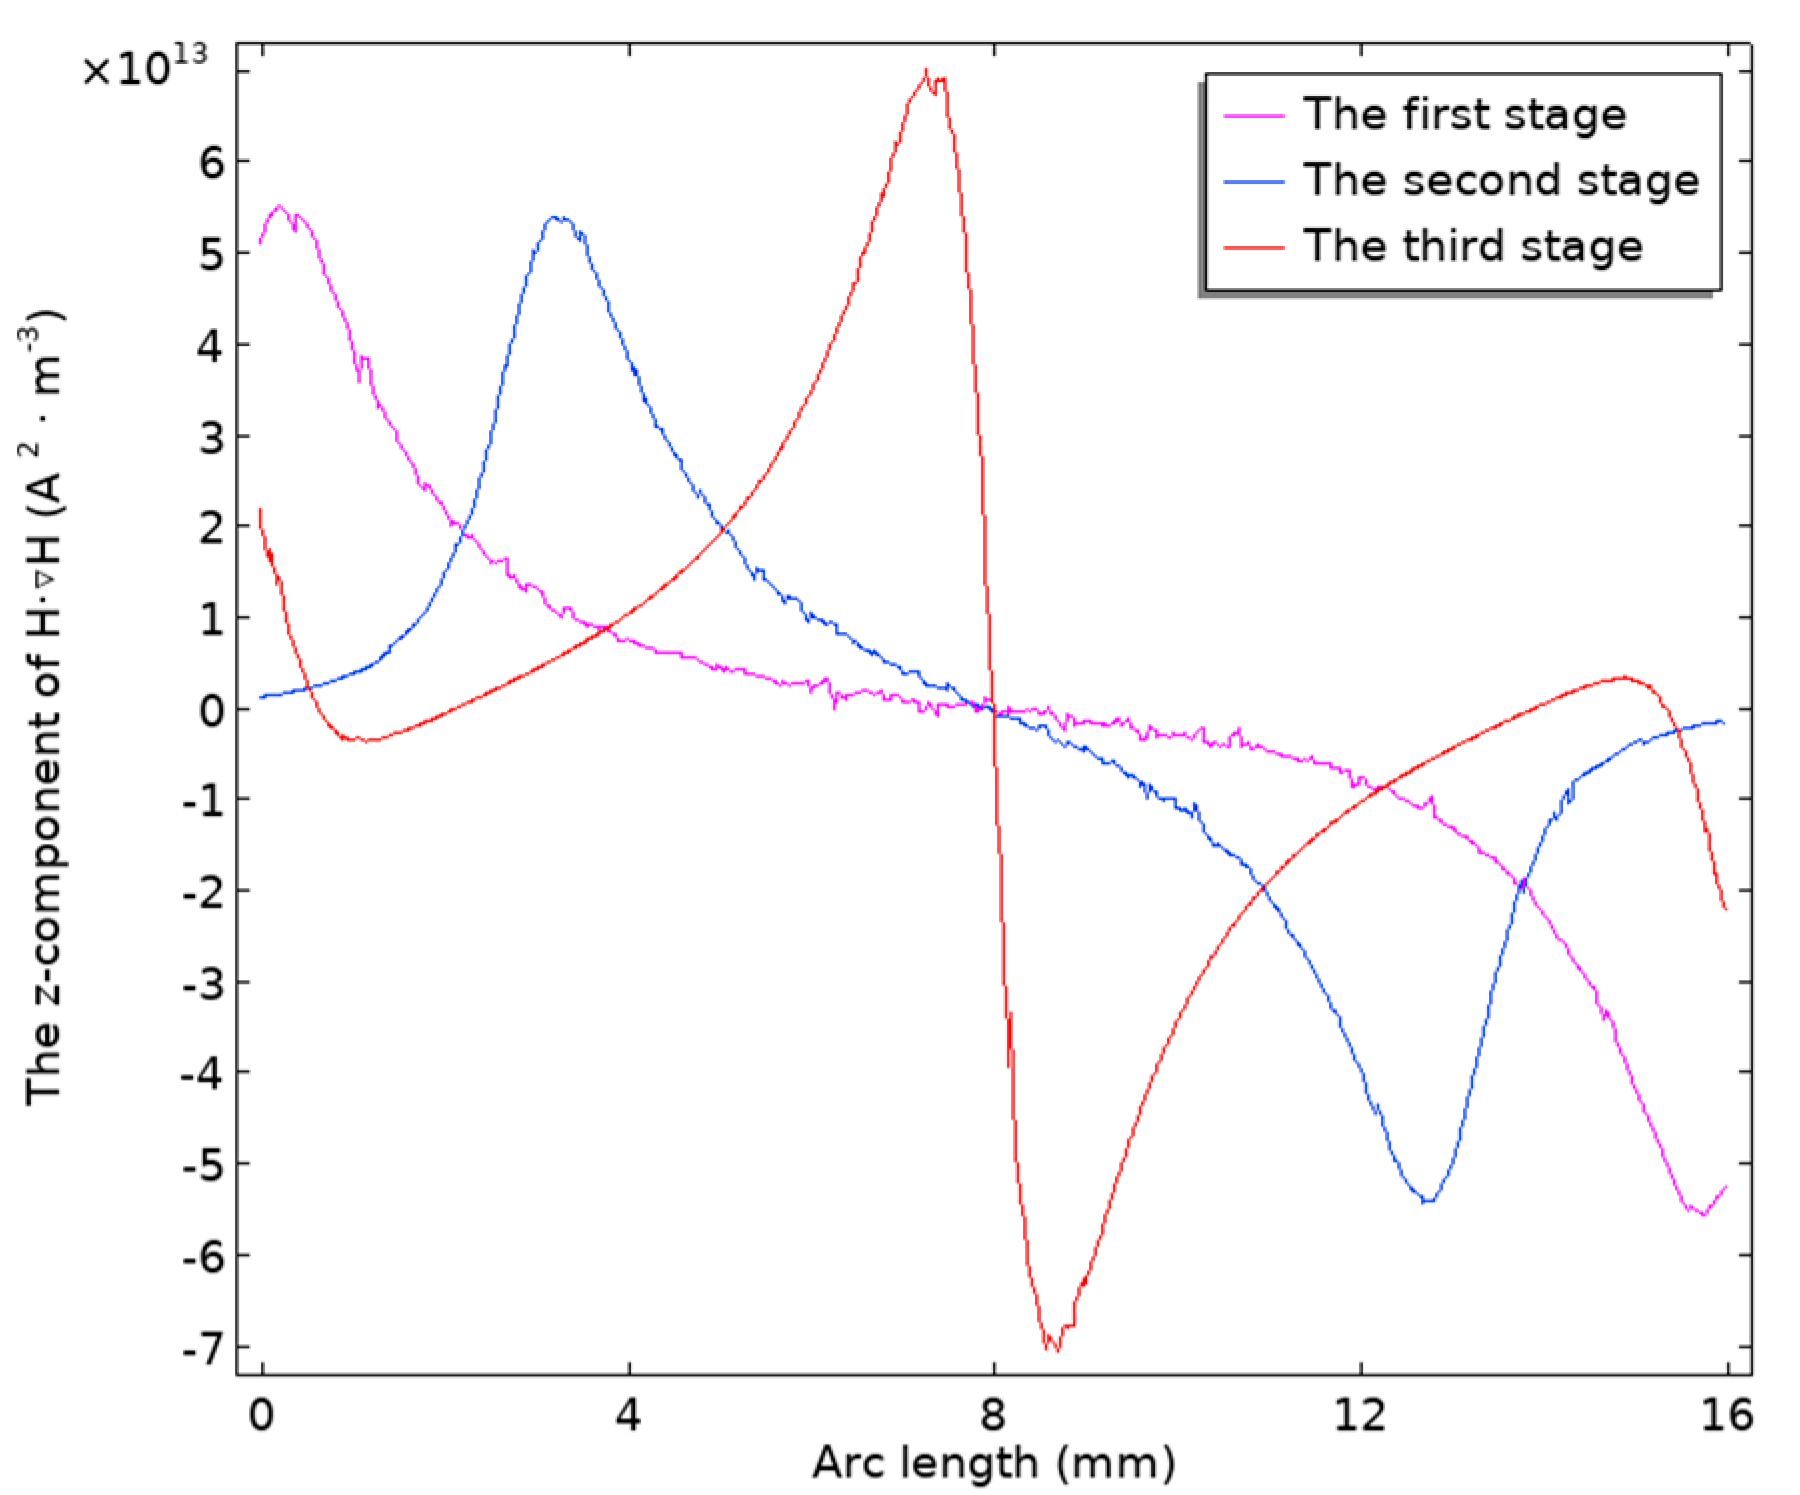
By conducting magnetic field simulations of the permanent magnets in the three stages mentioned above, the distribution of
on the rectangular cross-section inside the reaction cup is plotted, as shown in
Figure S13. Then, based on Equation (1), the z-component values of
at the cup wall in
Figure S13 are calculated and plotted as a one-dimensional curve, as shown in
Figure 5. According to the sequence of the three-stage magnetic bead collection method, the peaks of the z-component of the magnetic force on the magnetic beads gradually move towards the center as the stage changes, proving that the design of the three-stage magnetic bead collection method can gradually transition the aggregation state of the magnetic beads from elongated shapes towards the middle position, eventually forming dot-like shapes.
3.2. Experiments of Magnetic Bead Loss Rate
3.2.1. Influence of Magnetizing Time
In the magnetic separation and cleaning module, the magnetizing time (the duration of time the reaction cup remains next to the permanent magnet for the aggregation of magnetic beads) of the permanent magnet has a significant impact on the effectiveness and loss rate of magnetic bead collection. Therefore, we used the arrangement of setting a conventional magnet on one side of the reaction cup, commonly used in the magnetic separation and cleaning module, as the control group. For the experimental group, we adopted our proposed arrangement of setting designed magnets on opposite sides of the reaction cup. A comparative experiment on the magnetic bead loss rate in the magnetic bead collection area (the first two stages of the three-stage magnetic bead collection method) concerning the magnetizing time was conducted.
Both the experimental group and the control group employed the three-stage magnetic bead collection method for magnetic separation and cleaning, as shown in
Figure 4 and
Figure 6, respectively. The magnetic bead collection area in the control group, as shown in
Figure 6a,b, used conventional magnets. In contrast, the experimental group, as shown in
Figure 4a,b, used designed magnets.
The carboxylated magnetic bead (unmodified antibodies on the surface) solution with a bead size of 1 μm was diluted to a concentration of 0.0625 mg/mL as the test sample. Then, 400 μL of the well-mixed test sample was transferred to the reaction cup for testing. One round of magnetic separation and cleaning was conducted using the magnet arrangement methods of the experimental group and the control group, respectively. After magnetic separation and cleaning, as well as washing buffer removal, 400 μL of diluent was added to ensure the same liquid volume as before for absorbance measuring. The magnetizing time for the third stage of the three-stage magnetic bead collection method was fixed at 5 s, while the magnetizing times for the first two stages were set at 5, 10, 15, and 20 s, respectively. The magnetic bead loss rates of both the experimental group and the control group were measured under these conditions. The absorbances of the magnetic bead solution before and after cleaning were measured using the spectrophotometer (UV-1900i, Shimadzu, Japan), and the loss rate of the magnetic beads was calculated according to Equation (7):
where
is the magnetic bead loss rate,
is the absorbance of the magnetic bead solution before magnetic separation and cleaning,
is the absorbance of the magnetic bead solution after magnetic separation and cleaning, and
is the absorbance of the magnetic bead diluent.
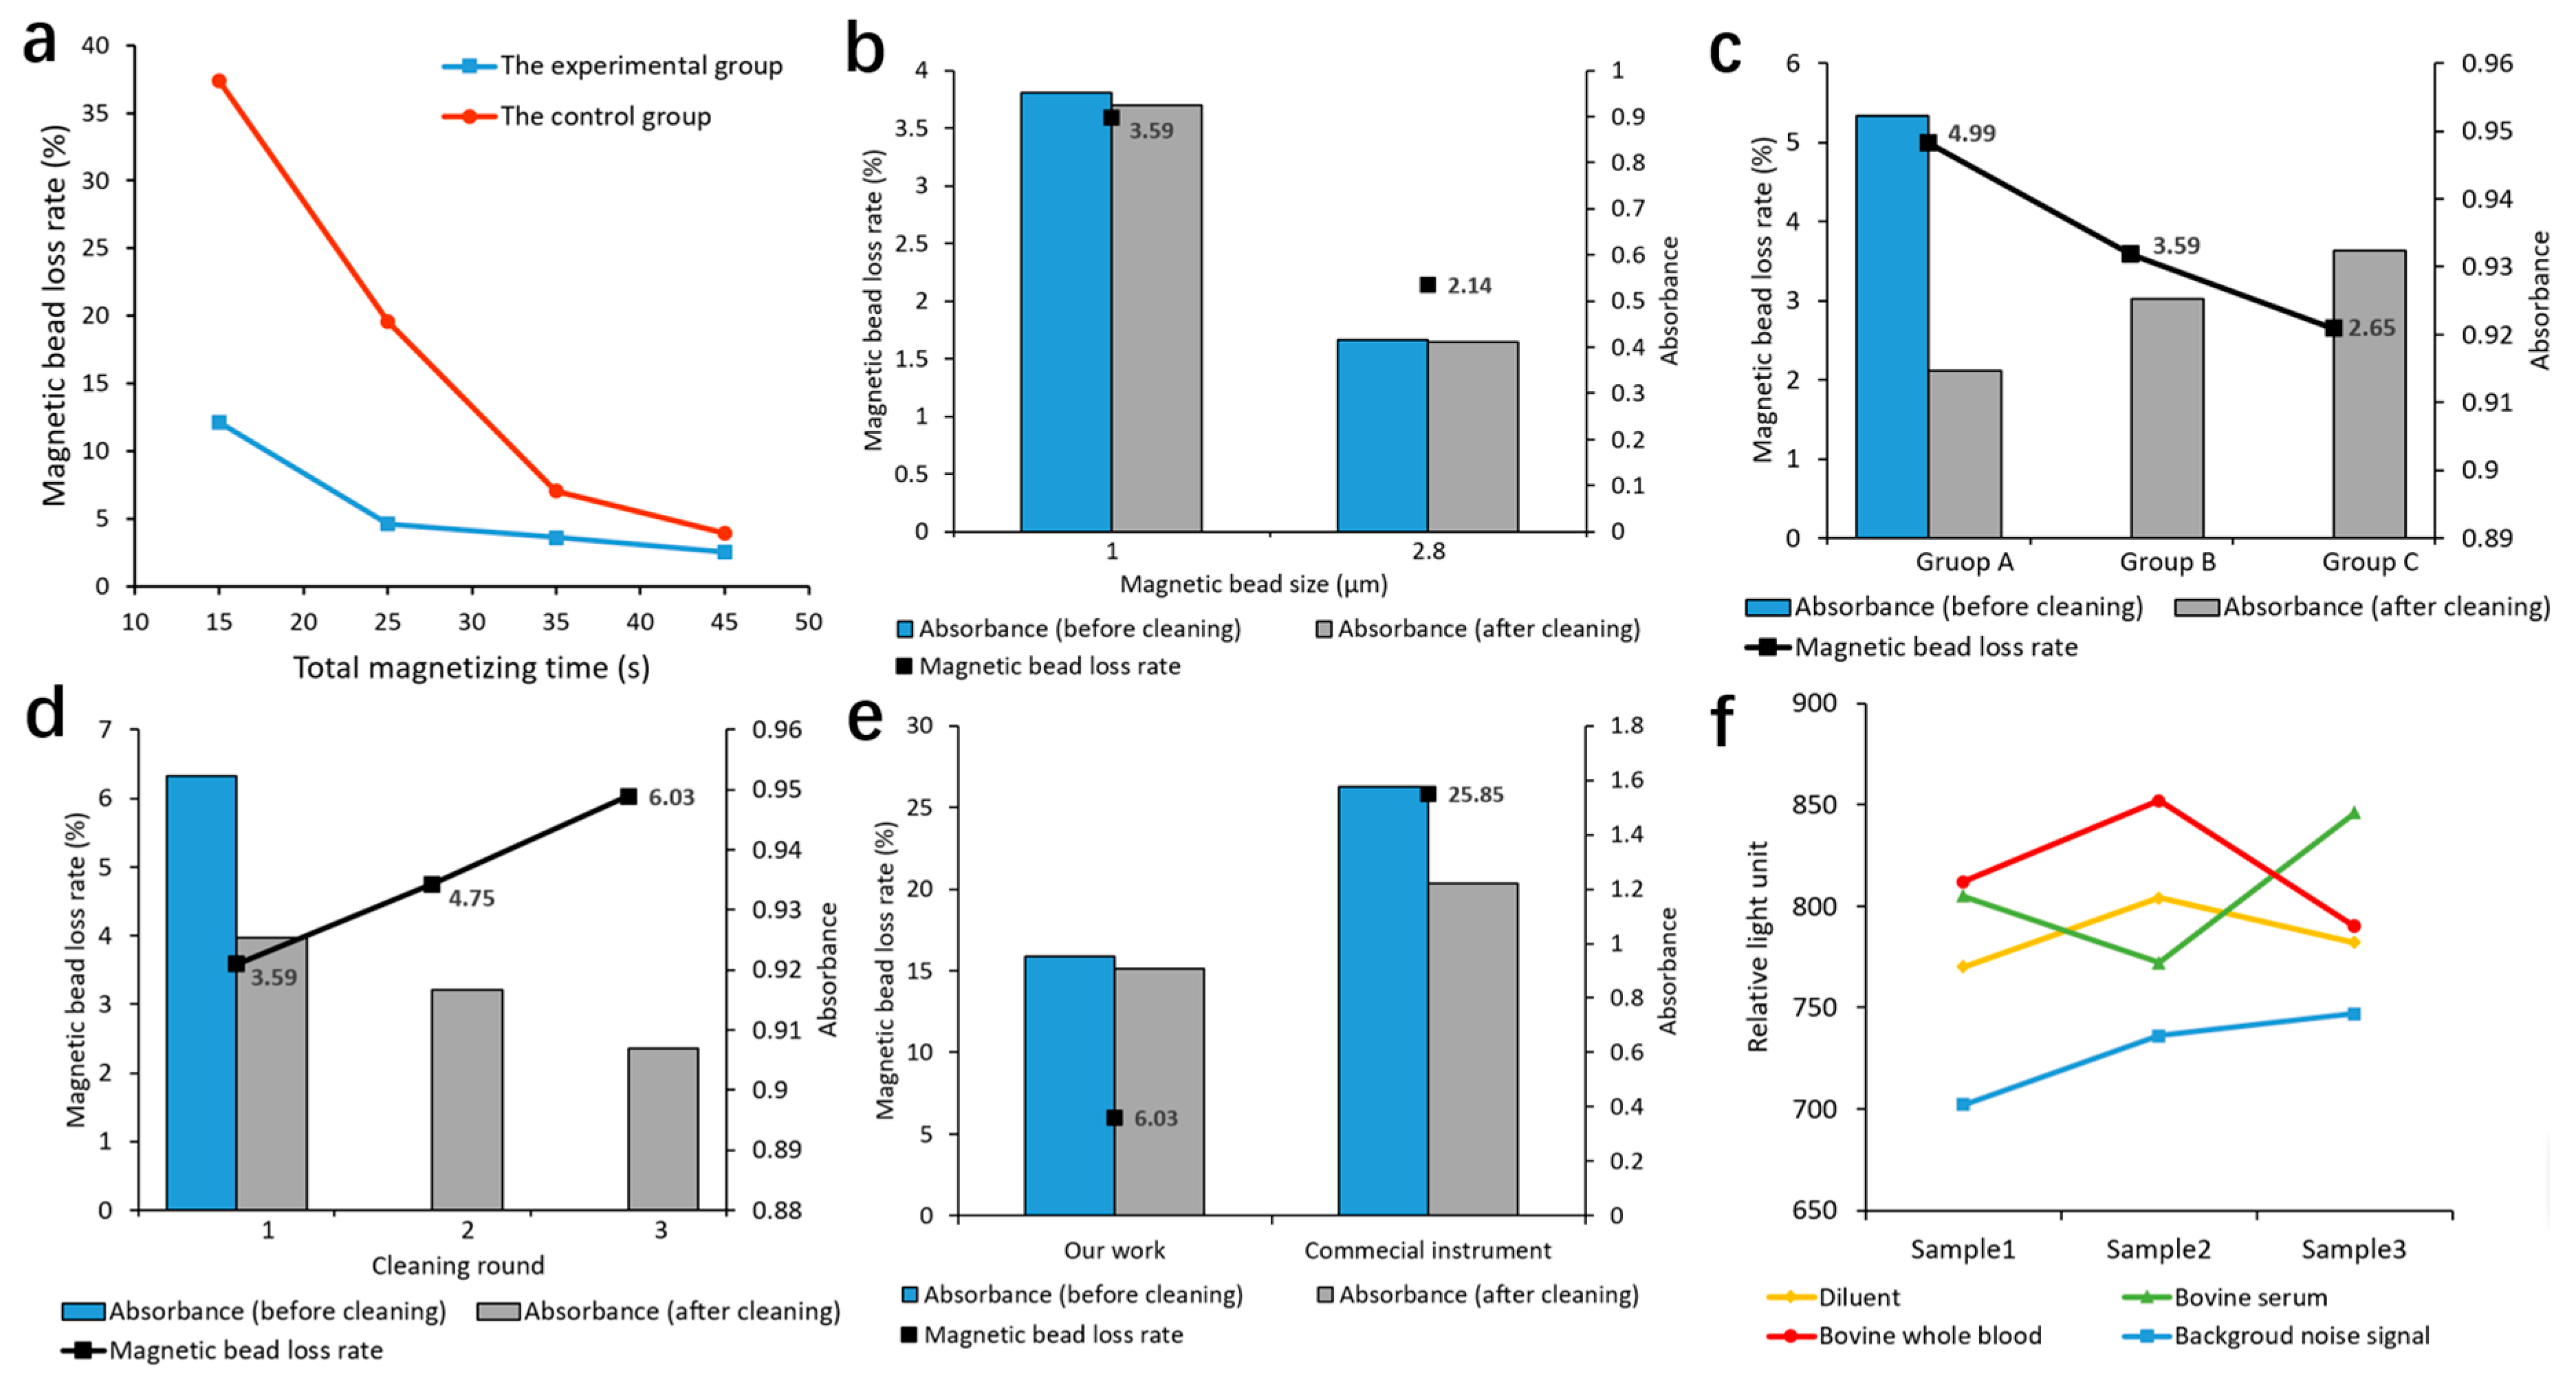
As shown in
Tables S1 and S2, the results of the magnetic bead loss rate of the experimental and control groups were obtained from five repeated experiments. As shown in
Figure 7a, the magnetic bead loss rate decreased with the increase in the total magnetizing time. However, when the total magnetizing time exceeded 35 s, the magnetic bead loss rates in both the experimental group and the control group were basically stable. In order to shorten the cleaning time and achieve a lower magnetic bead loss rate, we set the total magnetizing time to 35 s, implying that the magnetizing time of the first two stages of the three-stage magnetic bead collection method was set to 15 s each. With the same total magnetizing time, the magnetic bead loss rate in the experimental group was always lower than that in the control group. As the total magnetizing time decreased, the difference between the two groups increased. This demonstrated that the permanent magnet design in the experimental group could collect most of the magnetic beads onto the cup wall in a shorter time compared to the control group, thereby shortening the magnetic separation and cleaning time and lowering the magnetic bead loss rate.
3.2.2. Influence of Magnetic Bead Size and Total Amount
The size and total amount of magnetic beads in the reagents may vary depending on different projects in the CLIA analyzer. Therefore, it is necessary to test the stability of the magnetic bead loss rate in the magnetic separation and cleaning module under different conditions of magnetic bead size and total amount. Currently, the magnetic bead sizes of detection reagents commonly used in the CLIA analyzer are generally within the range of from 1 μm [
42] to 2.8 μm [
43,
44]. Thus, we tested the magnetic bead loss rate after cleaning within the size of 1 μm and 2.8 μm. A total of 400 μL of magnetic bead solution with a concentration of 0.0625 mg/mL for both sizes was taken for one round of magnetic separation and cleaning. The absorbances of the magnetic bead solution before and after cleaning were measured by the spectrophotometer, and the magnetic bead loss rate could be calculated according to Equation (7).
As shown in
Figure 7b (detailed data can be found in
Table S3), under the same concentration of magnetic beads, the magnetic bead solution with a bead size of 2.8 µm had a lower absorbance and a lower magnetic bead loss rate.
In terms of the dosage of magnetic bead reagents, the common concentrations of magnetic bead reagents used in the test projects of current CLIA analyzers are 0.5 mg/mL and 1 mg/mL, with the dosages typically ranging from 25 μL to 50 μL. We selected magnetic beads with a uniform size of 1 μm. Specifically, we used 25 μL of 0.5 mg/mL magnetic bead solution for test group A, 50 μL of 0.5 mg/mL for test group B, and 50 μL of 1 mg/mL for test group C. The magnetic bead loss rate after one round of cleaning in this module under different total amounts of magnetic beads was tested. Considering the absorbance was linear with the amount of magnetic beads in the solution within the concentration range of from 0 to 0.125 mg/mL, all test group samples were diluted to 0.0625 mg/mL before testing to ensure consistency in the volume of diluent added to the same test group sample before and after magnetic separation and cleaning.
As shown in
Figure 7c (detailed data can be found in
Table S4), under the same conditions, the magnetic bead loss rate increased with the decrease in the total amount of magnetic beads. When cleaning samples with different bead sizes and total amounts of magnetic beads, the magnetic bead loss rate remained below 5%, maintaining a relatively low level.
3.2.3. Influence of Cleaning Rounds
To enhance the cleaning effect, multiple cleaning rounds are typically necessary. Taking 400 μL of carboxylated magnetic bead solution with a concentration of 0.0625 mg/mL and a bead size of 1 μm for one, two, and three rounds of cleaning, respectively, the test results were as shown in
Figure 7d (detailed data can be found in
Table S5). The magnetic bead loss rate gradually increased with the number of cleaning rounds. More magnetic beads were lost in the first round of magnetic separation and cleaning, while fewer were lost in the second and third rounds.
3.2.4. Magnetic Bead Loss Rate for Other Instruments
We conducted experiments using a commercial fully automated CLIA analyzer and compared the magnetic bead loss rate of its magnetic separation and cleaning module. We replaced the antibody–acridinium ester reagent and the sample of the commercial instrument with washing buffer, substituted substrates A and B with magnetic bead diluent, and took 50 μL of carboxylated magnetic bead solution with a concentration of 0.5 mg/mL and a bead size of 1 μm for testing. After three rounds of magnetic separation and cleaning, 200 μL of magnetic bead diluent was automatically added and mixed, and the absorbance of the magnetic bead solution was measured. Before cleaning, we measured the absorbance of a magnetic bead solution with the same concentration and volume, serving as a reference. By substituting these values into Equation (7), we calculated the magnetic bead loss rate of the instrument. The test results are shown in
Table 1.
According to
Figure 7e, our designed magnetic separation and cleaning module achieved a magnetic bead loss rate of 6.03% and a coefficient of variation of 0.28%. In contrast, the commercial instrument exhibited a magnetic bead loss rate of 25.85% and a coefficient of variation of 0.49%, respectively. These results demonstrated that our designed magnetic separation and cleaning module significantly improved the performance of the magnetic bead loss rate and coefficient of variation. The improvement would contribute to minimizing the loss of luminescence values of CLIA, thereby enhancing the accuracy and repeatability of the results from the fully automated CLIA analyzer.
3.3. Experiments of Cleaning Effect
In the direct chemiluminescence reaction system of the acridinium ester, the amount of added antibody–acridinium ester reagent is excessive relative to the amount of the antigen to be tested. After the completion of antigen–antibody binding, there remains a portion of unbound antibody–acridinium ester remaining in the solution, which needs to be thoroughly removed. Otherwise, the detection results will be higher than the actual values, directly affecting the accuracy of the final detection results of CLIA.
We tested the cleaning effect of the magnetic separation and cleaning module on free markers. Magnetic bead–antibody, negative samples (diluent without antigen), and antibody–acridinium ester were placed in a reaction cup for incubation. After magnetic separation and cleaning, the substrate was added for a chemiluminescence reaction. The cleaning effect was determined by measuring the chemiluminescence signal. Since the negative sample added to the reaction cup did not contain antigen, there would be no specific binding between antigen and antibody, and the antibody–acridinium ester reagent remained in a free state. By comparing the luminescence value of the negative sample with that of the background noise signal, we could determine whether the antibody–acridinium ester reagent had been completely removed, thus evaluating the cleaning effect of the magnetic separation and cleaning module on free markers.
In addition, samples tested by fully automated CLIA analyzers are typically serum or whole blood, containing various impurities, such as proteins and cells, that may also affect the detection results. We added diluent, bovine serum, and bovine whole blood to negative samples to simulate three different sample environments, comprehensively evaluating the cleaning effect of the magnetic separation and cleaning module on free markers and impurities in the samples.
As shown in
Figure 7f (detailed data can be found in
Table S6), under three different sample environments of diluent, bovine serum, and bovine whole blood, the luminescence values after three rounds of cleaning showed minimal differences, all close to the background noise signal. All of the differences between the mean luminescence values and the background noise signal were about 12% of the background noise signal. Since the luminescence value produced by the positive samples (containing antigens) was much higher than the background noise signal, this indicated that the free markers and impurities caused by sample environmental interference had been effectively removed by magnetic separation and cleaning and would not affect the results of CLIA. Therefore, our magnetic separation and cleaning module could achieve a satisfactory cleaning effect of free markers under different sample conditions.
Based on the experimental results and
Table 2, within a shorter cleaning time, this module demonstrated satisfactory performances in terms of magnetic bead loss rate and its coefficient of variation, as well as the cleaning effect of free markers. As an essential part of the fully automated CLIA analyzer, this module contributes to improving the detection accuracy of the analyzer within a reduced detection time.


 ,
, 


