Article

The Effect of the Calcination Time on the Microstructure and Properties of MnZn Ferrite Powders

1
School of Traffic & Transportation Engineering, Central South University, Changsha 410075, China
2
Farsoon Technologies Company Limited, Changsha 410006, China
3
State Key Laboratory of Powder Metallurgy, Central South University, Changsha 410083, China
*
Authors to whom correspondence should be addressed.
Magnetochemistry 2024, 10(10), 68; https://doi.org/10.3390/magnetochemistry10100068
Submission received: 14 August 2024 / Revised: 18 September 2024 / Accepted: 19 September 2024 / Published: 24 September 2024

Abstract

:
MnZn ferrite powders were prepared based on the novel nano in situ composite method and through chemical sol-spray drying–calcination technology. The precursor powders were calcined at 1060 °C at different calcination times (1–9 h) to research the influences of the calcination time on MnZn ferrite powders. The research results revealed that all samples had similar morphologies composed of fine particles. The pure MnZn ferrite spinel phase can only be obtained when the calcination time does not exceed 3 h. Otherwise, some α-Fe2O3 or γ-Fe2O3 impurities will appear. The particle size descended with an increasing calcination time and then ascended. After 3 h of preservation, the smallest particle size was obtained, and it exhibited a unimodal distribution. The saturation magnetization (Ms) increased at first and decreased later with an increasing calcination time, and the optimal value (53.4 emu/g) was reached after holding for 3 h. In view of this work, the optimal calcination time is 3 h.

1. Introduction

MnZn ferrite (MZF) has superior characteristics such as high magnetic permeability, high saturation magnetization, high resistivity, low coercivity, low core losses, etc. [1,2,3]. Thus, it can be applied in consumer electronics, automatic control, biomedicine, and various aspects ranging from general electrical appliances to advanced scientific equipment [4,5,6,7]. In order to match different application scenarios, it is necessary to select the appropriate preparation method and the best process parameters. In general, the conventional ceramic process is the most popular method for the industrial preparation of MZF. However, there are some limitations to practice due to the drawbacks of a large grain size, non-uniform particle size, and inducing impurities [8]. Other superior preparation methods were also employed to produce high-quality MZF by many researchers. For example, Sertkol [9] prepared Mn0.5Zn0.5CdxFe2−xO4 (0.0 ≤ x ≤ 0.5) nanoparticles with an average particle size of around 14 nm using the sol–gel combustion approach. Shang et al. [10] synthesized MnZn ferrite fibers via a water-assisted solvothermal method and simultaneously optimized some parameters such as the ratio of ethyleneglycol and water, the reaction time and temperature, and the annealing temperature. Ren et al. [11] synthesized nanocrystalline Mn0.6Zn0.4Fe2O4 particles by a phase transformation method under different magnetic fields and verified that the technique has promise as an important approach to enhance the Ms of ferrite nanoparticles. Hwang et al. [12] synthesized MnxZn1-xFe2O4 (x = 0.5, 0.6, and 0.7) ferrite nanoparticles by a thermal decomposition method. Khan et al. [13] prepared ZnxMn1−xFe2O4 (x = 0.5–0.9) magnetic nanoparticles (MNPs) using a microwave-assisted coprecipitaion method and also investigated the effect of Zn substitution on the AC induction heating properties of MNPs. These results all show that the experimental technique and parameters had unavoidable influences on the structural and magnetic properties of these ferrite materials. As we know, the preparation of perfect powders is the basic process for preparing MZF products. However, the improved methods mentioned above have more or less deficiencies to prepare high-quality powders. Considering the economy and operability of industrial production, these methods still need further optimization. Surprisingly, a novel nano in situ composite method has come into view, and it has shown great advantages in preparing tungsten matrix composites and realizing industrialization [14,15]. Based on this novel method, through chemical sol-spray drying–calcination technology, the authors have made some efforts to research MnZn ferrite [16,17,18,19]. According to the previous report [18], the calcination/heat treatment is an important process, and the structures and properties of the obtained MnZn ferrite powders are sensitive to the synthesized conditions. Also, the calcination time is another key parameter to optimize performance. Therefore, it will be meaningful to prepare MnZn ferrite powders and to conduct related research focusing on this key parameter. Predictably, the calcination time may affect the features of products, and some new phenomena will be discovered based on this novel method and through chemical sol-spray drying–calcination technology. So, the present work will intensely focus on the influence of the calcination time and carry out some related research on prepared MnZn ferrite powders.

2. Experimental Procedure

The reagents used in the experiments were Fe(NO3)3·9H2O, Zn(NO3)2·6H2O, 50 wt.% Mn(NO3)2 solution, and cetyltrimethyl ammonium bromide (CTAB). Based on the nano in situ composite method, through chemical sol-spray drying–calcination technology, MnZn ferrite powders (Mn0.5Zn0.5Fe2O4) were prepared. Because the described work is a supplement and expansion of a previous study, the detailed processes used to prepare MnZn ferrite powders are almost identical to those in [18]. The differences are that the precursor powders were calcined at 1060 °C in air and the holding time varied from 1 h to 9 h. The obtained samples were analyzed by different characterization methods. The set measurement parameters were the same as those in the literature [18]. Additionally, FTIR spectrums of samples were recorded in a range (4000–400 cm−1) using a Nicolet-6700 infrared Fourier spectrometer. The KBr disk method was adopted for this purpose.

3. Results and Discussion

3.1. X-ray Analysis

The XRD patterns of the samples obtained at 1060 °C at different calcination times are shown in Figure 1. All samples are in a good crystalline state, and the background of the XRD is almost nonexistent. We can observe that all samples contain a MnZn ferrite spinel phase (PDF #74-2401). It can be seen that a well-crystallized pure phase of MnZn ferrite was formed as the calcination time did not exceed 3 h. The (110) plane diffraction peak of α-Fe2O3 (PDF #89-0599) appeared after 5–7 h of heat preservation, and the diffraction intensity also increased when prolonging the calcination time. It also revealed an increase in the impurity phase. This phenomenon indicated that the excessive calcination time caused a change in the equilibrium air pressure in the system, and this change led to the appearance of α-Fe2O3 [20]. Unexpectedly, the γ-Fe2O3 (PDF #39-1346, P4132) with a partially unordered ferric vacancy appeared after 9 h of heat preservation [21,22,23,24]. The authors of [17] reported that α-Fe2O3 tended to convert to γ-Fe2O3 (Fd3m) at about 600 °C during the preparation process of spinel ferrite. Reference [21] showed that the ferric vacancy was randomly distributed in the octahedral gap of γ-Fe2O3 with space group Fd3m. When the ferric vacancy was limited to the Wyckoff 4b site in the octahedral gap, γ-Fe2O3 with space group P4132 or P4332 appeared [21,24]. In the present work, γ-Fe2O3 with space group P4132 appeared due to the disorder in ferric vacancy caused by the long calcination time.
The crystallite sizes were determined from the XRD patterns according to the full width at half maximum (FWHM) of the (311) plane diffraction peaks using Debye-Scherer’s formula [25]:
D = (0.9λ)/(β cosθ)
where D is the mean crystallite size, λ is the wavelength of the radiated X-ray, β is the full width at half maximum, and θ is the corresponding Bragg diffraction angle. As shown in Table 1, the crystallite sizes of all other samples are less than 100 nm except the sample kept for 3 h. The crystallite size was 63.4 nm after holding for 1 h, which was smaller than that of the sample calcined at 900 °C for 3 h [18]. This phenomenon also shows that under the condition of a short calcination time, the crystallite size can be effectively controlled even if the calcination temperature is high. It is obvious that the crystallite size decreased when the calcination time was over 3 h. This was a result of the appearance of an impurity phase and the recrystallization of the MnZn ferrite spinel phase [26].

3.2. BET and Particle Size Analysis

The specific surface areas (SBET) and particle sizes of all samples are shown in Table 1. The particle sizes are in the range of 14.0–32.2 μm, and the specific surface areas are in the range of 0.14–0.33 m2/g. The particle size decreased with the increasing holding time and then increased. The largest particle size was 32.2 μm, which was obtained after 9 h of heat preservation. The minimum value was obtained by insulation at 1060 °C for 3 h [18]. Essentially, the powders are composed of agglomerated secondary particles [27]. The extension of the calcination time will promote the aggregation of secondary particles and then induce the increase in the powders’ particle size. In addition, there were no sintering necks between these secondary particles, merely soft agglomeration (shown in Figure 5). Therefore, different powders can also be prepared easily with a suitable crushing process according to different purposes.
Figure 2 shows the particle size distribution curves. It is obvious that the particle size of the sample after 3 h of heat preservation was in a single-peak distribution state. This result indicates that the particle size distribution is uniform with 3 h of heat treatment. In contrast, the particle size distribution of the other samples was non-unimodal, and the number of larger particles (100–1000 μm) increased with the prolongation of the calcination time. As shown in these curves, the particle size is mainly below 100 μm, and the sample after 3 h of heat preservation shows a smaller size and better particle size distribution. Generally, the smaller the particle size, the larger the specific surface area of the particles. So, the results also verify that the maximum SBET of the sample after 3 h of heat preservation is reasonable. The SBET value first increased and then decreased after 5–7 h of heat preservation, and this trend was matched with the trend in particle sizes. Unfortunately, the value of SBET increased slightly after holding for 9 h, which may have been caused by the detection process. These phenomena also prove that the particles’ sizes and their distribution can be effectively controlled with an appropriate calcination time.

3.3. Spectral Analysis

The Raman spectrums of the samples are displayed in Figure 3. As shown in Section 3.1, the samples mainly contain a MnZn ferrite spinel phase. Therefore, characteristic diffraction peaks of the MnZn ferrite spinel phase were observed at 603–629 (A1g), 458–479 (T2g (2)), and 342–355 cm−1 (Eg). In this work, there were some impurity phases with an increasing calcination time. The weak diffraction peak located at 307 cm−1 corresponds to the Eg mode of α-Fe2O3 [28], and it demonstrates the existence of α-Fe2O3 after 7 h of heat preservation. Another weak diffraction peak at 494 cm−1 is matched with the E mode of γ-Fe2O3 [29], and it was also caused by the vibration of the Fe-O bond. This result confirms that there is a small amount of γ-Fe2O3 after 9 h of heat treatment. There were some diffraction peaks of α-Fe2O3 after 5 h of heat preservation according to the XRD results. However, there was no corresponding diffraction peak in the Raman pattern due to the low abundance of α-Fe2O3. But overall, the Raman results match with the aforementioned XRD result, which proves that the samples undergo phase transformations under different holding times.
In general, FTIR spectroscopy and Raman spectroscopy complement each other, and the vibration of different chemical bonds can be fully understood through a corresponding detection and analysis. So, the FTIR spectra of the samples were also recorded. The FTIR spectra of the different samples are shown in Figure 4. The samples may have absorbed some water vapor due to their surfaces being exposed during the experiment. Therefore, the stretching vibration peak of O-H appeared at 3430–3435 cm−1, and the bending vibration peak of O–H appeared at 1624–1630 cm−1 [30]. The absorption peaks at 418–430 and 550–552 cm−1 correspond to the vibration of metal–oxygen bonds in the A-site (ν1) and B-site (ν2) of MnZn spinel ferrite phase. α-Fe2O3 existed in the sample with a holding time of 5–7 h, and γ-Fe2O3 appeared after holding for 9 h. Tang et al. reported that the typical peaks of α-Fe2O3 were located at 560 cm−1 and 471 cm−1, respectively [31]. Chamritski et al. summarized that the two high-energy T2 vibration modes of γ-Fe2O3 were located at 553 and 440 cm−1 [29]. The absorption peaks of α-Fe2O3 and γ-Fe2O3 were not obvious in the experimental results due to their low content and the near coincident absorption peak’s location with the MnZn ferrite spinel phase.

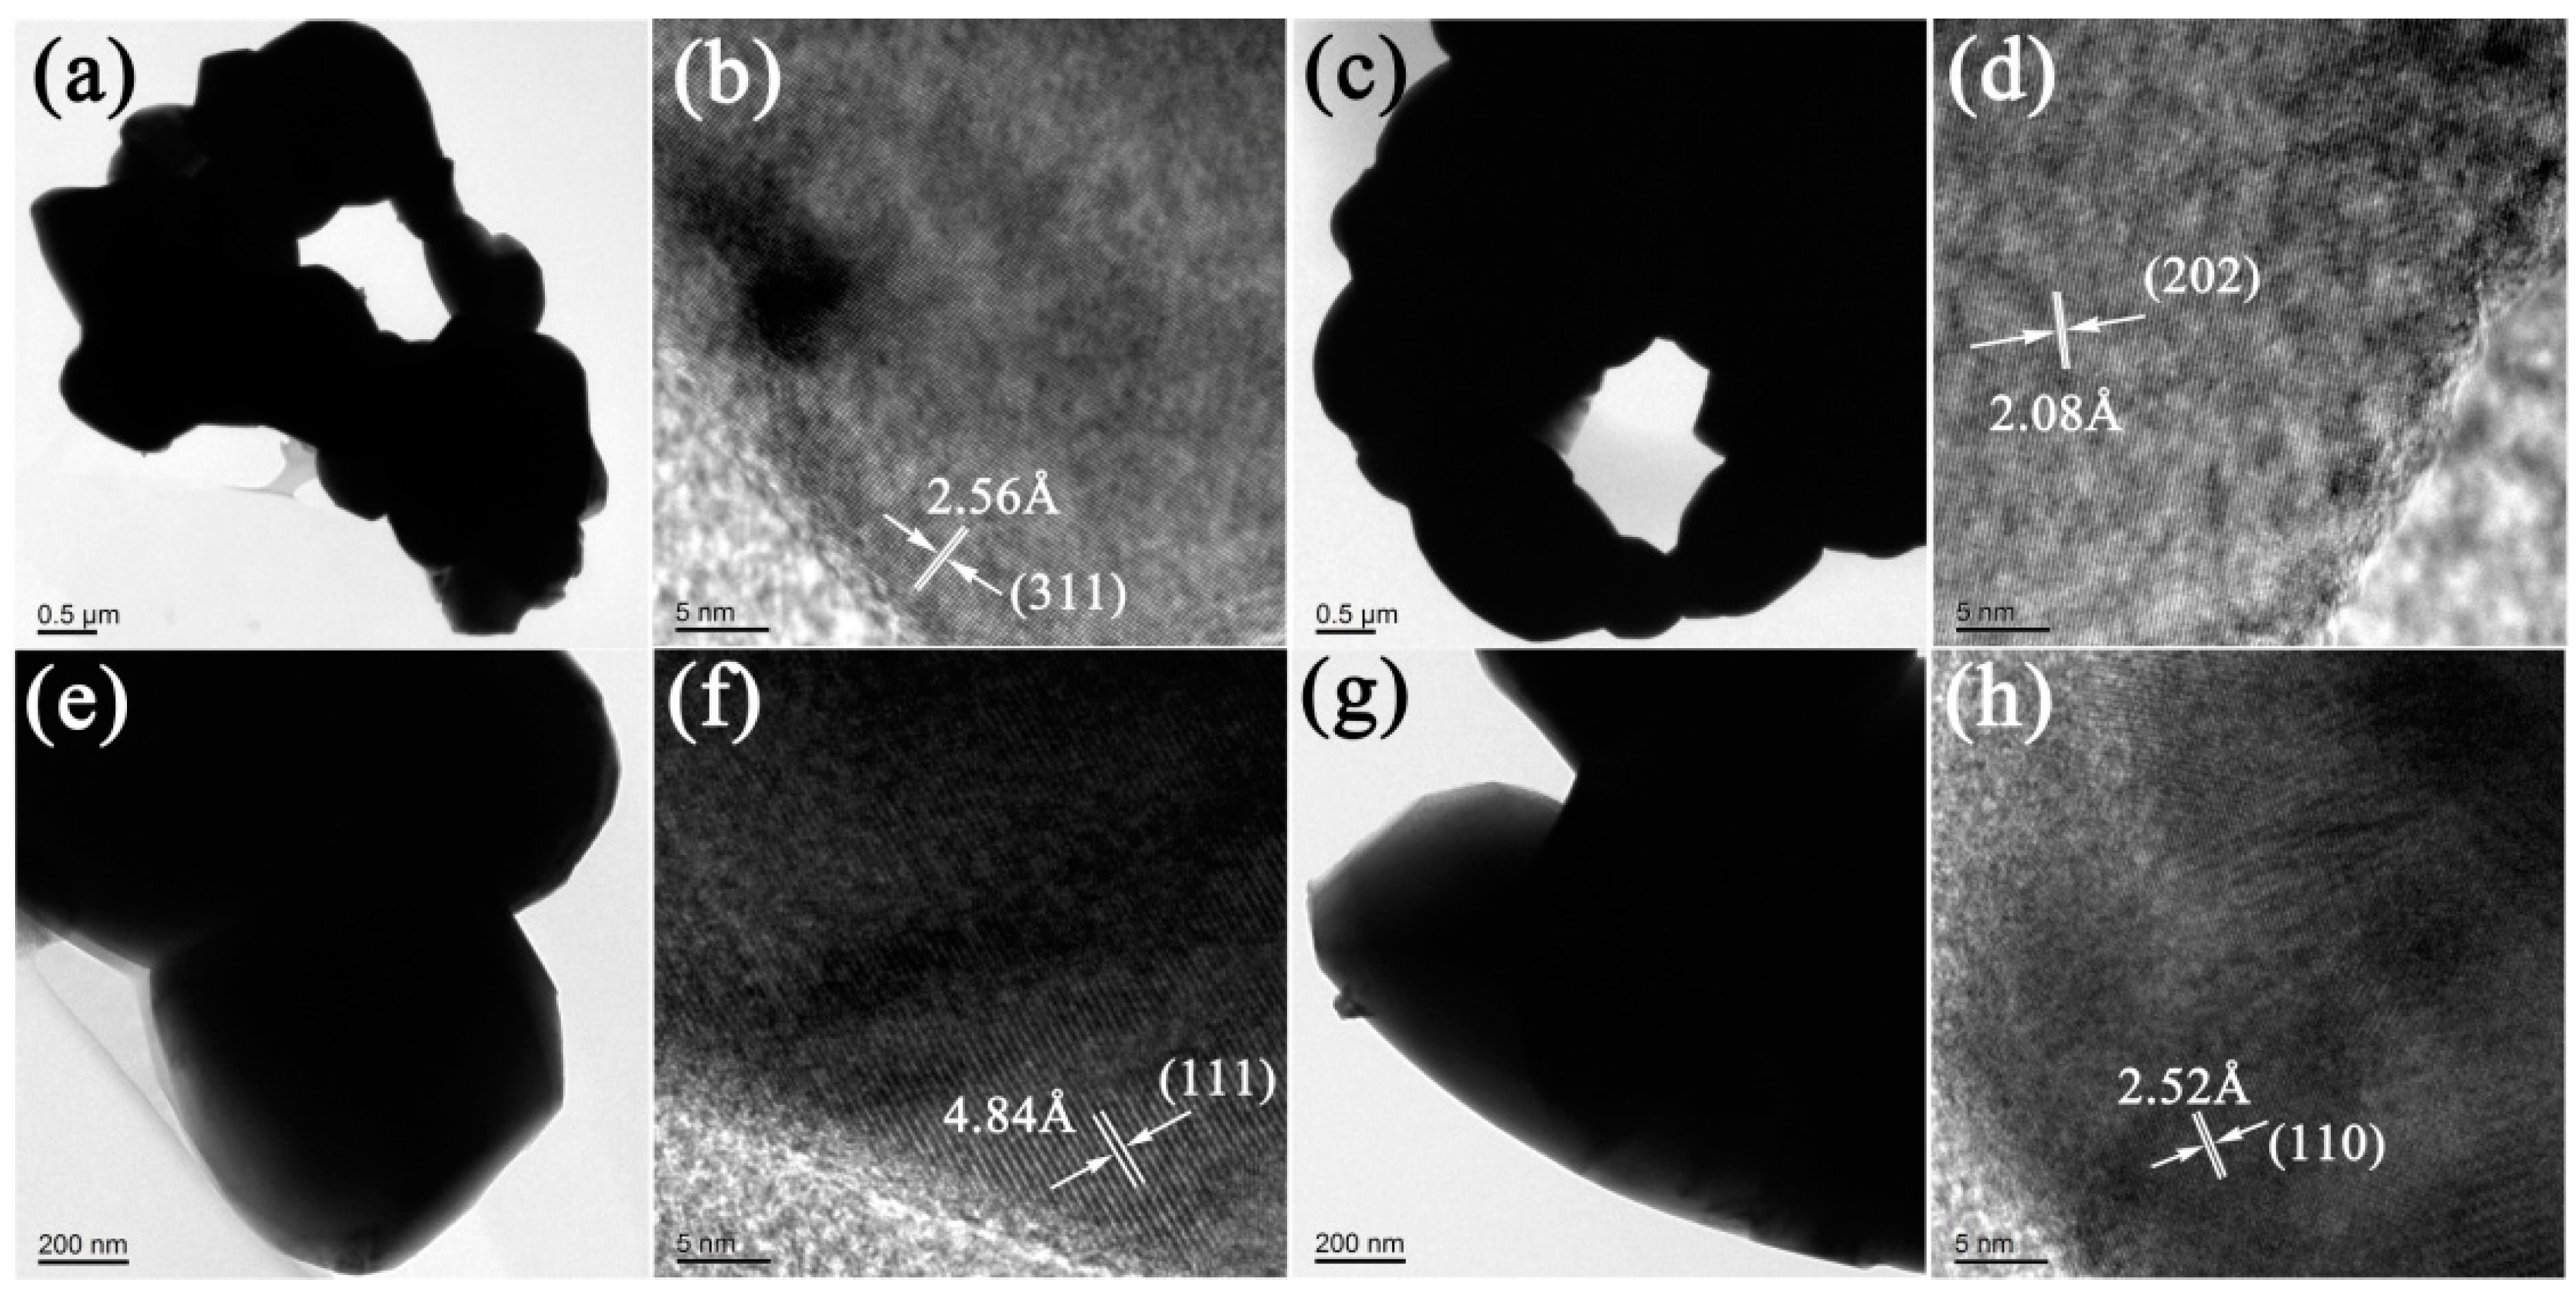
3.4. Electron Microscopic Analysis

In order to further visually investigate the effect of the calcination time on MnZn ferrite, an electron microscopic analysis was employed. Figure 5 shows the SEM images of the MnZn ferrite powders prepared by calcining at 1060 °C for different amounts of time. As described in [32], when the solute diffusion characteristic time was greater than the solvent evaporation characteristic time, the hollow particles or crushed particles can be prepared using the spraying process. Also, hollow porous particles will be obtained due to the similar solvent evaporation characteristic time and solute diffusion characteristic time. The macro forms of all samples are similar in the present work, showing various characteristics such as hollow spherical shells, fragment and porous hollow spherical shells, etc. These typical morphological features are attributed to the relationship between the solvent evaporation characteristic time and the solute diffusion characteristic time. It was carefully observed that although the morphologies are versatile, the powders are composed of fine particles. The fine particles mainly exhibit a typical cubic feature, and they only softly agglomerate rather than sinter together. Unfortunately, individual small particles grew rapidly when the calcination time reached 5 h or above. This appearance also greatly affected the uniformity of particle sizes. Therefore, on the premise of obtaining a pure MnZn ferrite spinel phase, the calcination time of no more than 3 h is preferred to maintain the uniformity of the particle size.
Figure 6 shows the TEM and HRTEM images of typical samples after calcinating at 1060 °C for different amounts of time. Some particles in Figure 6a,c overlapped, which may have been due to their magnetic nature. Fortunately, they were not sintered together firmly, and the aforementioned SEM results confirm this. An HRTEM analysis was also carried out on these samples, respectively. As shown in Figure 6b, the interplanar distance is 2.56 Å, which corresponds to the (311) plane of the MnZn ferrite spinel phase. However, the interplanar spacing of particles in Figure 6d is 2.08 Å, which is indexed to the (202) plane of α-Fe2O3. The particles displayed in Figure 6e show approximate cubic morphologies, the crystal plane spacing of (111) is 4.84 Å (Figure 6f), and the result indicates that the MnZn ferrite spinel phase existed in the sample. There are particles with a nearly long strip shape in Figure 6g. The corresponding HRTEM pattern is shown in Figure 6h. In addition, the crystal plane spacing is 2.52 Å, which belongs to the (110) plane of γ-Fe2O3.
The above-mentioned results indicate that the powders prepared at 1060 °C for 7 h contain MnZn ferrite and α-Fe2O3, while the sample calcined at 1060 °C for 9 h is composed of a MnZn ferrite spinel phase and γ-Fe2O3 phase. The TEM analysis results of the powders prepared at 1060 °C for 3 h are shown in [18], which are clearly characteristic of the mono phase. All of these results are consistent with the above XRD analysis and spectral analysis. These analyses also indicate that pure MnZn ferrite can be obtained after a short calcination time at 1060 °C. Moreover, the particle sizes shown in Figure 6 all are approximately several hundred nm. The values of the particle sizes here are larger than those determined from the XRD patterns (as shown in Table 1), which may be due to the faint particle boundary caused by the aggregation of particles and low magnification [9].

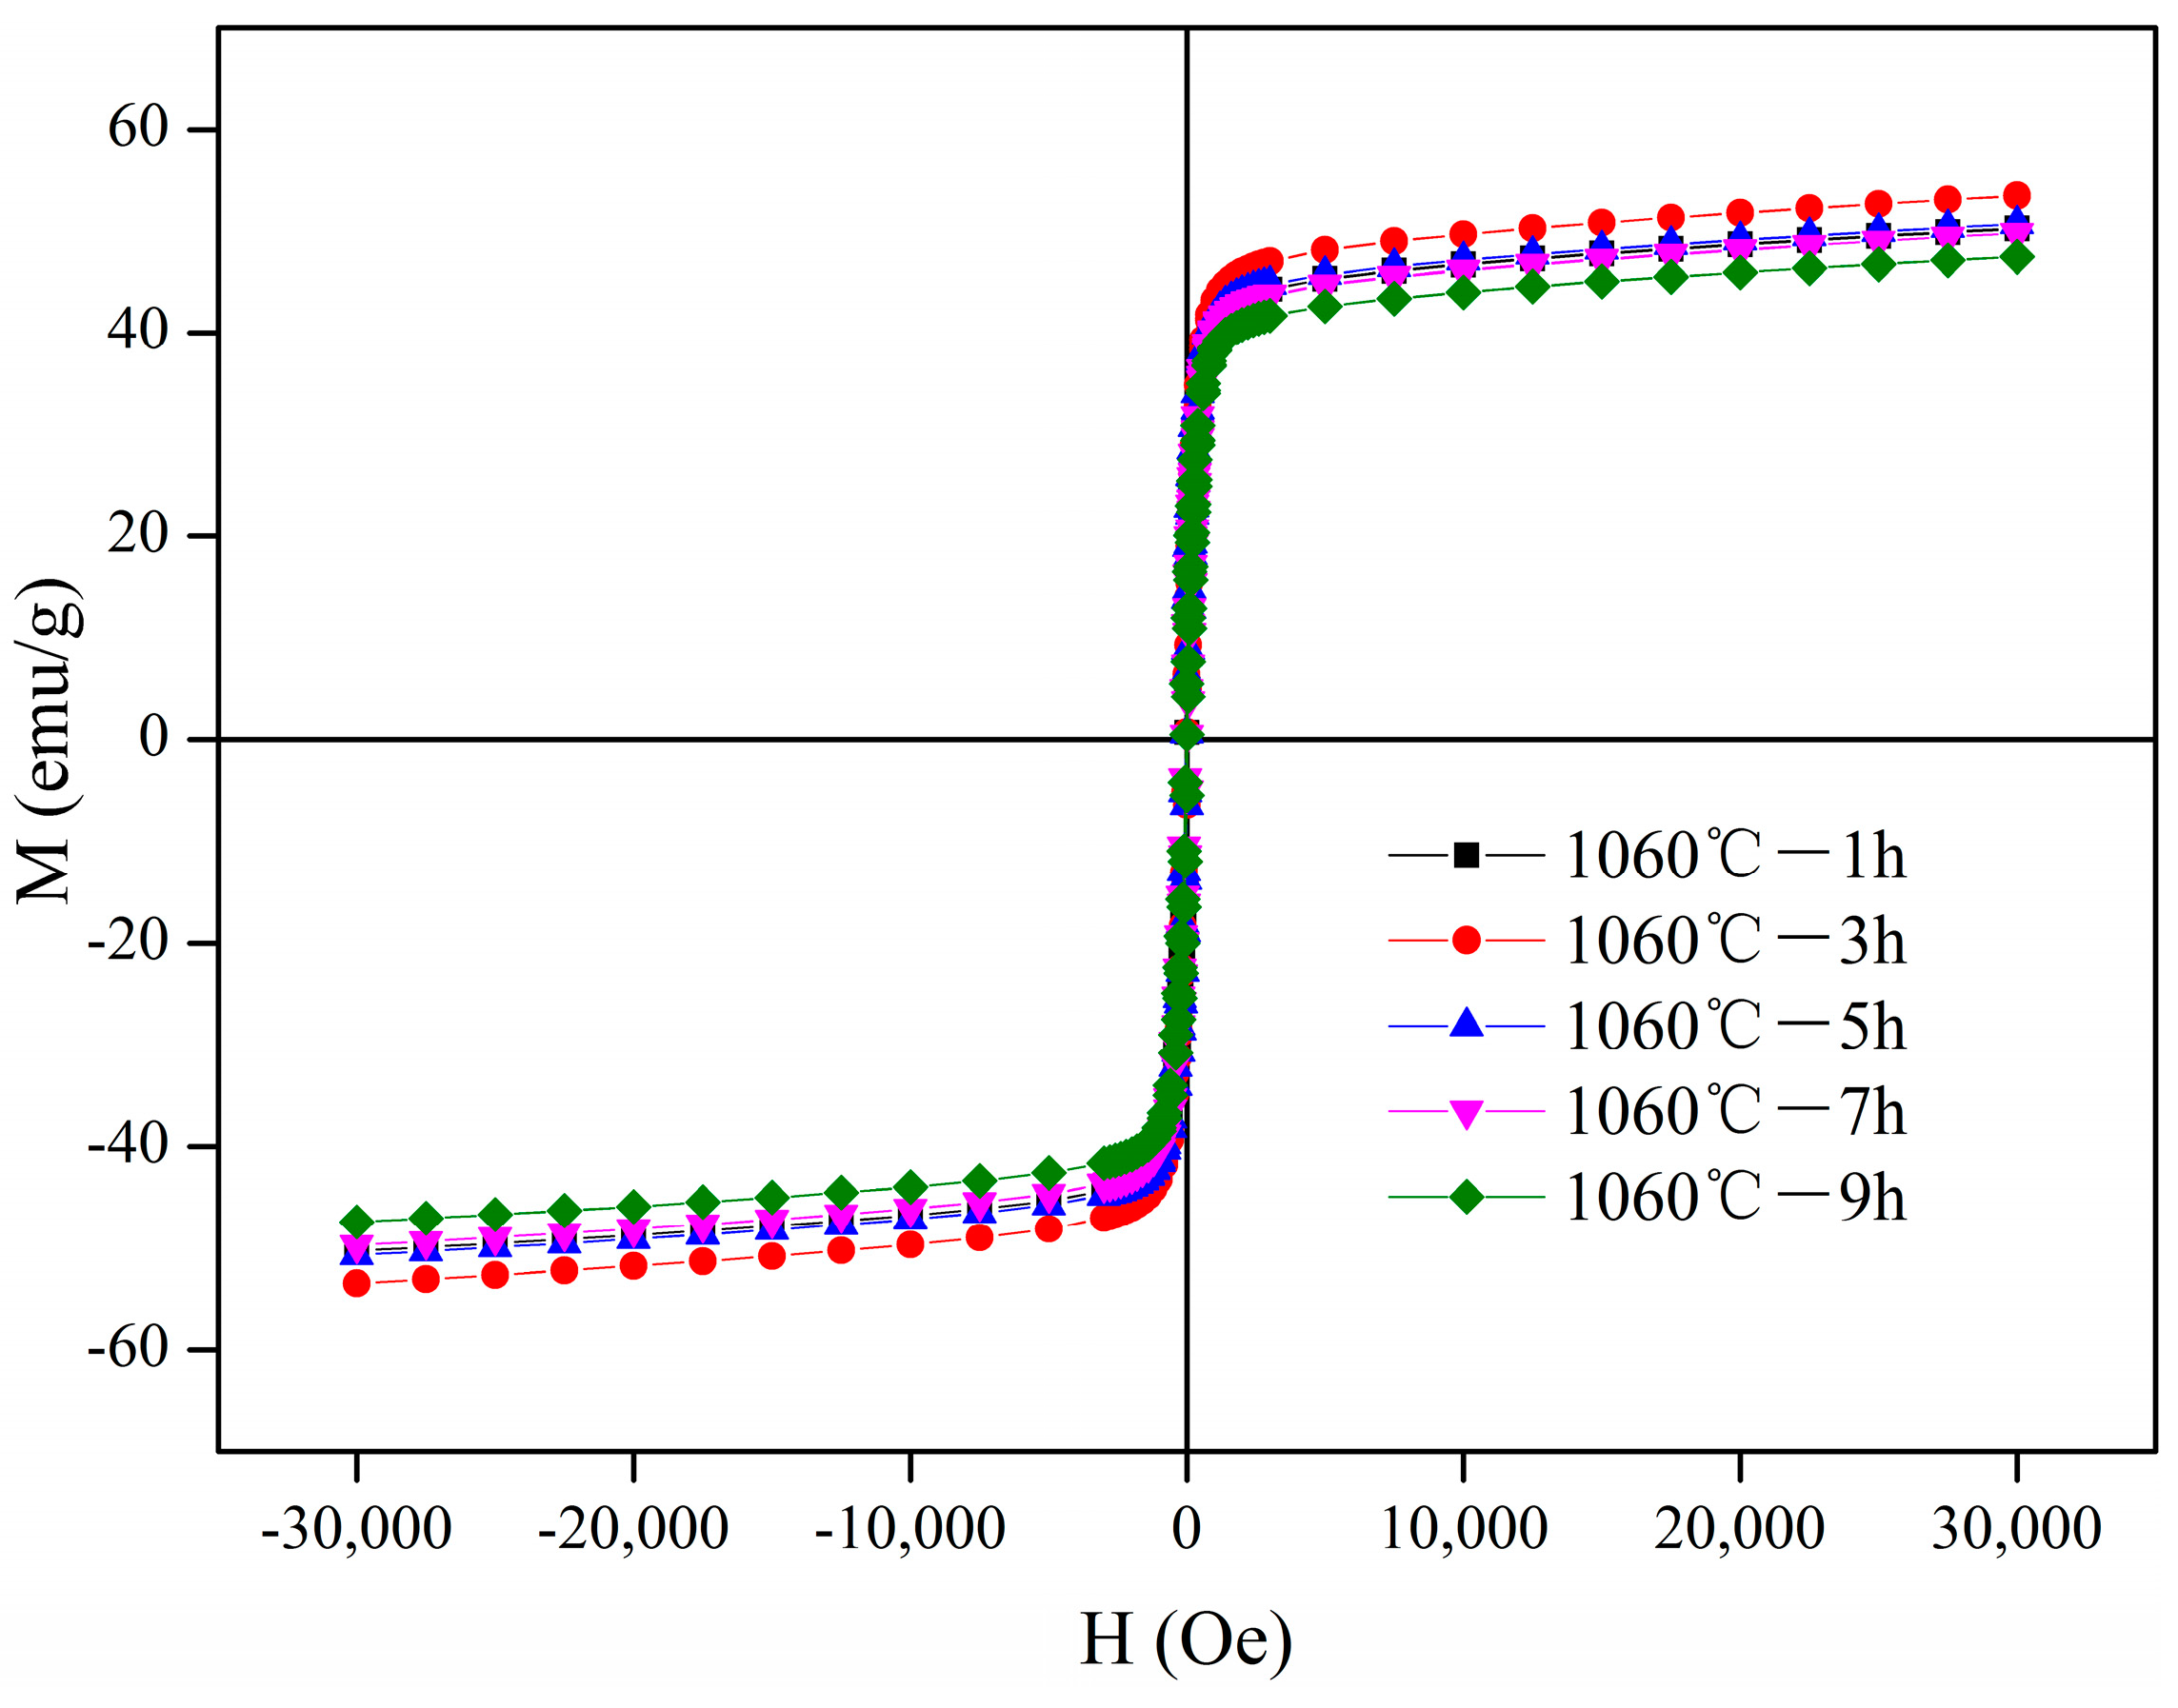
3.5. Magnetic Properties

The magnetic hysteresis loop and magnetic parameters of the different samples are shown in Figure 7 and Table 2. The saturation magnetization (Ms) is in the range of 47.49–53.49 emu/g. It is shown that the Ms ascended at first and descended later with the increase in calcination time, and it reached the maximum value of 53.4 emu/g after holding for 3 h [18]. The variation trend in the Ms was mainly caused by the different phase types and amounts. The sample contains a MnZn ferrite spinel phase when the calcination time is no more than 3 h, and the crystallinity increases with an increase in time. So, the Ms value increased in this heat preservation range. However, α-Fe2O3 or γ-Fe2O3 appeared when the calcination time exceeded 3 h. Therefore, the reduction in Ms in this case is attributed to the existences of these impurity phases. Overall, the presence of an impurity phase could explain the reduction in the magnetization magnitude. According to [33], the sample had a multi-domain structure when the squareness ratio (Mr/Ms) was less than 0.5, while when it was greater than 0.5, it had a single domain structure. In this work, the samples all have multi domains due to their low value of Mr/Ms (0.10–0.12). As shown in Table 2, the Hc value is in the range of 27.54–28.68 Oe. None of the samples displayed a significant amount of coercivity, indicating their typical soft magnetic behavior. The Hc values of the different samples are almost similar, and this implies that the calcination time hardly affects the internal structure of the grain [34]. The Mr value is in the range of 5.04–6.51 emu/g, and it varies irregularly. These results indicate that the magnetic properties of the samples are not affected by the magnetic domain structure but by the variations in morphology and phase constitution composition [33]. Moreover, the macro and micro forms of all samples are similar in the present work, indirectly revealing that the phase constitution composition is the main factor.

4. Conclusions

MnZn ferrite powders with different characteristics were prepared after calcining at 1060 °C for different amounts of time based on the novel nano in situ composite method and through chemical sol-spray drying–calcination technology. The sample showed a pure MnZn ferrite spinel phase when the calcination time was not more than 3 h. In contrast, there was some α-Fe2O3 or γ-Fe2O3 when heat preservation exceeded 3 h. Regarding the crystallite sizes, those of SBET had irregular variations with an increase in the calcination time, while the particle sizes decreased with an increasing holding time and then increased. Moreover, the particle size distribution of the sample after 3 h of preservation had a single-peak distribution state. Consequently, the saturation magnetization (Ms) ascended at first and descended later with the increase in the calcination time, and it reached the optimal value (53.4 emu/g) after holding for 3 h. The Mr and Mr/Ms values had irregular variations with an increasing calcination time. According to these findings, MnZn ferrite with the optimal comprehensive performance will be prepared after calcining at 1060 °C for 3 h.

Author Contributions

Conceptualization, J.F.; methodology, Z.X. and J.F.; software, W.Z.; validation, Z.X.; formal analysis, W.Z.; investigation, Z.X.; resources, J.F.; data curation, Z.X.; writing—original draft preparation, Z.X.; writing—review and editing, Z.X., W.Z. and L.B.; visualization, Z.X. and W.Z.; supervision, L.B. and J.F.; project administration, Z.X. and J.F. All authors have read and agreed to the published version of the manuscript.

Funding

This research received no external funding.

Data Availability Statement

Derived data supporting the findings of this study are available from the corresponding author upon reasonable request.

Acknowledgments

The authors thank the supports of the State Key Laboratory of Powder Metallurgy and the Key Laboratory of Traffic Safety on Track (Central South University), Ministry of Education.

Conflicts of Interest

The author Wei Zhao was employed by Farsoon Technologies Company Limited. The remaining authors declare that the research was conducted in the absence of any commercial or financial relationships that could be construed as potential conflicts of interest.

References

  1. Yi, S.; Bai, G.; Wang, X.; Zhang, X.; Hussain, A.; Jin, J.; Yan, M. Development of high-temperature high-permeability MnZn power ferrites for MHz application by Nb2O5 and TiO2 co-doping. Ceram. Int. 2019, 46, 8935–8941. [Google Scholar] [CrossRef]
  2. Fang, X.; Ma, D.; Sun, B.; Xu, X.; Quan, W.; Xiao, Z.; Zhai, Y. A high-performance magnetic shield with MnZn ferrite and Mu-metal film combination for atomic sensors. Materials 2022, 15, 6680. [Google Scholar] [CrossRef] [PubMed]
  3. Tsakaloudi, V.; Zaspalis, V. Synthesis of a low loss Mn–Zn ferrite for power applications. J. Magn. Magn. Mater. 2016, 400, 307–310. [Google Scholar] [CrossRef]
  4. Wu, G.; Yu, Z.; Sun, K.; Guo, R.; Zhang, H.; Jiang, X.; Wu, C.; Lan, Z. Ultra-low core losses at high frequencies and temperatures in MnZn ferrites with nano-BaTiO3 additives. J. Alloys Compd. 2020, 821, 153573. [Google Scholar] [CrossRef]
  5. Wang, X.; Yi, S.; Wu, C.; Bai, G.; Yan, M. Correlating the microstructure and magnetic properties of MnZn power ferrites via Co2O3 and MoO3 co-doping for MHz applications. J. Magn. Magn. Mater. 2021, 538, 168324. [Google Scholar] [CrossRef]
  6. Hassan, S.; Prakash, G.; Ozturk, A.B.; Saghazadeh, S.; Sohail, M.F.; Seo, J.; Dokmeci, M.R.; Zhang, Y.S.; Khademhosseini, A. Evolution and clinical translation of drug delivery nanomaterials. Nano Today 2017, 15, 91–106. [Google Scholar] [CrossRef]
  7. Zhong, X.C.; Guo, X.J.; Zou, S.Y.; Yu, H.Y.; Liu, Z.W.; Zhang, Y.F.; Wang, K.X. Improving soft magnetic properties of Mn-Zn ferrite by rare earth ions doping. AIP Adv. 2017, 8, 047807. [Google Scholar] [CrossRef]
  8. Kadu, A.V.; Jagtap, S.V.; Chaudhari, G.N. Chaudhari, Studies on the preparation and ethanol gas sensing properties of spinel Zn0.6Mn0.4Fe2O4 nanomaterials. Curr. Appl. Phys. 2009, 9, 1246–1251. [Google Scholar] [CrossRef]
  9. Sertkol, M. Impact of Cd2+ substitution on the structural and magnetic peculiarities of MnZn nanospinel ferrites. J. Sol-Gel Sci. Technol. 2022, 101, 539–545. [Google Scholar] [CrossRef]
  10. Shang, Y.; Duan, Z.; Luo, F. Preparation and characterization of fibrous MnZn ferrite via a water-assisted solvothermal method. J. Magn. Magn. Mater. 2023, 571, 170563. [Google Scholar] [CrossRef]
  11. Ren, J.; Zhang, Z.; Ma, X.; Zhong, Y.; Zhang, J.; Ren, Z.; Liu, Y. Tuning the structural and magnetic properties of MnZn nano-ferrites synthesized under a high magnetic field. J. Magn. Magn. Mater. 2020, 495, 165832. [Google Scholar] [CrossRef]
  12. Hwang, J.; Ju, B.K.; Chun, M.P. Characterization and synthesis of MnZn ferrite nanoparticles synthesized by thermal decomposition. J. Ceram. Process. Res. 2020, 21, S28–S32. [Google Scholar]
  13. Khan, F.; Lahiri, B.; Ranoo, S.; Philip, J. Effect of Zn substitution on the AC induction heating properties of ZnxMn1-xFe2O4 (x=0.1–0.9) nanoparticles prepared using microwave assisted synthesis. Ceram. Int. 2022, 48, 33462–33473. [Google Scholar] [CrossRef]
  14. Lv, Y.; Fan, J.; Han, Y.; Liu, T.; Li, P.; Yan, H. The influence of modification route on the properties of W-0.3 wt% Y2O3 powder and alloy prepared by nano-in-situ composite method. J. Alloys Compd. 2019, 774, 1140–1150. [Google Scholar] [CrossRef]
  15. Fan, J. Research progress of nano-in-situ composite high-performance fine-grained tungsten matrix composites. In Proceedings of the National Conference on Powder Metallurgy and Cross-Strait Seminar on Powder Metallurgy Technology, Wuhan, China, 9–12 September 2015; p. 328. [Google Scholar]
  16. Xu, Z.; Fan, J.; Han, Y.; Liu, T.; Zhang, H.; Song, K.; Zhang, C. Preparation and characterization of Mn–Zn ferrites via nano-in-situ composite method. Solid State Sci. 2019, 98, 106006. [Google Scholar] [CrossRef]
  17. Xu, Z.; Fan, J.; Liu, T.; Han, Y.; Zhang, H. Calcination induced phase transformation in MnZn ferrite powders. J. Alloys Compd. 2020, 814, 152307. [Google Scholar] [CrossRef]
  18. Xu, Z.; Fan, J.; Zhao, S.; Zhang, H.; Yin, F.; Han, Y.; Liu, T. Microstructure and magnetic properties of MnZn ferrite powders prepared by nano-in-situ composite method. J. Alloys Compd. 2020, 835, 155285. [Google Scholar] [CrossRef]
  19. Xu, Z.; Zhao, W.; Liu, J.; Fan, J. Research on the surfactant-assisted synthesis of MnZn ferrite precursor powders. Magnetochemistry 2023, 9, 146. [Google Scholar] [CrossRef]
  20. Zhou, D. The Researech of SHS Method for the Preparation of Ferrites; Sichuan University: Chendu, China, 2005. [Google Scholar]
  21. Grau-Crespo, R.; Al-Baitai, A.Y.; Saadoune, I.; Leeuw, N.H.D. Vacancy ordering and electronic structure of γ-Fe2O3 (maghemite): A theoretical investigation. J. Phys. Condens. Matter 2010, 22, 255401. [Google Scholar] [CrossRef]
  22. Babay, S.; Mhiri, T.; Toumi, M. Synthesis, structural and spectroscopic characterizations of maghemite γ-Fe2O3 prepared by one-step coprecipitation route. J. Mol. Struct. 2015, 1085, 286–293. [Google Scholar] [CrossRef]
  23. Schulz, D.L.; McCarthy, G.J. X-ray Powder Data for an Industrial Maghemite (γ-Fe2O3). Powder Diffr. 1988, 3, 104–105. [Google Scholar] [CrossRef]
  24. Kelm, K.; Mader, W. The Symmetry of Ordered Cubic γ-Fe2O3 Investigated by TEM. Z. Naturforschung B 2006, 61, 665–671. [Google Scholar] [CrossRef]
  25. Ebrahimi, S.S.; Masoudpanah, S.; Amiri, H.; Yousefzadeh, M. Magnetic properties of MnZn ferrite nanoparticles obtained by SHS and sol-gel autocombustion techniques. Ceram. Int. 2014, 40, 6713–6718. [Google Scholar] [CrossRef]
  26. Hu, P.; Yang, H.-B.; Pan, D.-A.; Wang, H.; Tian, J.-J.; Zhang, S.-G.; Wang, X.-F.; Volinsky, A.A. Heat treatment effects on microstructure and magnetic properties of Mn–Zn ferrite powders. J. Magn. Magn. Mater. 2010, 322, 173–177. [Google Scholar] [CrossRef]
  27. Maleknejad, Z.; Gheisari, K.; Raouf, A.H. Structure, microstructure, magnetic, electromagnetic, and dielectric properties of nanostructured Mn–Zn ferrite synthesized by microwave-induced urea–nitrate process. J. Supercond. Nov. Magn. 2016, 29, 2523–2534. [Google Scholar] [CrossRef]
  28. Chernyshova, I.; Hochella, M., Jr.; Madden, A. Size-dependent structural transformations of hematite nanoparticles. 1. Phase transition. Phys. Chem. Chem. Phys. 2007, 9, 1736–1750. [Google Scholar] [CrossRef] [PubMed]
  29. Chamritski, I.; Burns, G. Infrared- and Raman-Active Phonons of Magnetite, Maghemite, and Hematite: A Computer Simulation and Spectroscopic Study. J. Phys. Chem. B 2005, 109, 4965–4968. [Google Scholar] [CrossRef] [PubMed]
  30. Wang, F.; Qin, X.F.; Meng, Y.F.; Guo, Z.L.; Yang, L.X.; Ming, Y.F. Hydrothermal synthesis and characterization of α-Fe2O3 nanoparticles. Mater. Sci. Semicond. Process. 2013, 16, 802–806. [Google Scholar] [CrossRef]
  31. Tang, W.; Qi, L.; Gao, S.; Jian, K.S. Arsenic (III,V) removal from aqueous solution by ultrafine α-Fe2O3 nanoparticles synthesized from solvent thermal method. J. Hazard. Mater. 2011, 192, 131–138. [Google Scholar] [CrossRef]
  32. Okuyama, K.; Lenggoro, I.W. Preparation of nanoparticles via spray route. Chem. Eng. Sci. 2003, 58, 537–547. [Google Scholar] [CrossRef]
  33. Kagdi, A.R.; Solanki, N.P.; Carvalho, F.E.; Meena, S.S.; Bhatt, P.; Pullar, R.C.; Jotania, R.B. Influence of Mg substitution on structural, magnetic and dielectric properties of X-type bariumzinc hexaferrites Ba2Zn2-xMgxFe28O46. J. Alloys Compd. 2018, 741, 377–391. [Google Scholar]
  34. Yao, Y.; Xxa, B.; Nwa, B.; Jza, B.; Jing, Y.; Wla, B.; Liang, Q.; Wei, C.; Jla, B.; Hui, H.A. Low temperature sintered MnZn ferrites for power applications at the frequency of 1 MHz. J. Eur. Ceram. Soc. 2021, 41, 5924–5930. [Google Scholar]
Figure 1. XRD patterns of samples prepared at 1060 °C for different amounts of time.
Magnetochemistry 10 00068 g001
Figure 2. Particle size distributions of samples prepared at 1060 °C for different amounts of time.
Magnetochemistry 10 00068 g002
Figure 3. Raman spectra of samples prepared at 1060 °C for different amounts of time.
Magnetochemistry 10 00068 g003
Figure 4. FTIR spectra of samples prepared at 1060 °C for different amounts of time.
Magnetochemistry 10 00068 g004
Figure 5. SEM images of samples prepared at 1060 °C for different amounts of time: (a) 1 h, (b) 3 h, (c) 5 h, (d) 7 h, and (e) 9 h.
Magnetochemistry 10 00068 g005
Figure 6. TEM and HRTEM images of samples prepared at 1060 °C for different amounts of time: (ad) 7 h and (eh) 9 h.
Magnetochemistry 10 00068 g006
Figure 7. Hysteresis loops of samples prepared at 1060 °C for different amounts of time.
Magnetochemistry 10 00068 g007
Table 1. Crystallite size, particle size, and specific surface area of samples prepared at 1060 °C for different amounts of time.
SamplesCrystallite Size (nm)Particle Size (μm)SBET (m2/g)
1 h63.416.10.23
3 h>10014.00.33
5 h92.021.60.19
7 h93.928.40.14
9 h88.032.20.16
Table 2. Magnetic parameters of samples prepared at 1060 °C for different amounts of time.
SamplesMs (emu/g)Mr (emu/g)Hc (Oe)Mr/Ms
1 h50.315.9727.540.12
3 h53.496.5028.030.12
5 h50.726.5128.230.13
7 h49.815.0428.680.10
9 h47.495.5628.680.12
Disclaimer/Publisher’s Note: The statements, opinions and data contained in all publications are solely those of the individual author(s) and contributor(s) and not of MDPI and/or the editor(s). MDPI and/or the editor(s) disclaim responsibility for any injury to people or property resulting from any ideas, methods, instructions or products referred to in the content.

