Article

Identification of Loci for Four Important Agronomic Traits in Loose-Curd Cauliflower Based on Genome-Wide Association Studies

State Key Laboratory of Vegetable Biobreeding, Tianjin Academy of Agriculture Sciences, Tianjin 300192, China
*
Authors to whom correspondence should be addressed.
These authors contributed equally to this work.
Horticulturae 2023, 9(9), 970; https://doi.org/10.3390/horticulturae9090970
Submission received: 14 June 2023 / Revised: 20 August 2023 / Accepted: 23 August 2023 / Published: 26 August 2023
(This article belongs to the Special Issue Cruciferous Vegetables: The New Era of Vegetable Improvement)

Abstract

:
Cauliflower is a nutritious vegetable with inflorescences that are specialized to form the edible organs called curds. Uncovering key genes underlying important traits is crucial for the genetic improvement of this important crop. However, the genetic basis of many important agronomic traits, including curd performance and plant architecture in cauliflower, remains unclear. GWASs have proved to be powerful tools to study agronomic traits in many crops. To reveal the genetic basis of four important agronomic traits, namely, the main stem height (MSH), purplish curd (PC), external leaf wing (ELW) and weight of a single curd (WSC), we selected 220 core accessions of loose-curd cauliflower for resequencing, phenotypic investigation and GWAS. The approach revealed significant novel loci. We detected several significant associations: on C02 for MSH and PC, on C06 for ELW and on C01 for WSC. More interestingly, we identified a significant single-peak signal for the weight of a single curd (WSC), an important yield trait, and within this signal interval, we identified the BOB01G136670 gene with five SNPs encoding nonsynonymous mutations in the CDS region; these mutations resulted in two haplotypes with significant differences in curd weight. The weight of a single curd was significantly increased in the varieties with the BOB01G136670 Hap1 allele compared to those with BOB01G136670 Hap2. BOB01G136670 was highly conserved with the homologous genes that encode serine carboxypeptidase and belong to the S10 family in other species, including GS5, which functions as a positive regulator of grain size in rice, wheat and maize. Additionally, BOB01G136670 was highly expressed specifically at the curd enlargement stage, with low or even no expression at all in other tissues and stages, indicating that BOB01G136670 is a plausible candidate gene for WSC. Overall, this study identified genomic loci for four important agronomic traits that are relevant for accelerating biological breeding and the improvement of cauliflower varieties.

1. Introduction

Brassica oleracea is one of the most economically significant vegetable crops cultivated and consumed worldwide. It comprises many subspecies and is characterized by its strong morphological diversity, e.g., the floral organs in cauliflower (var. botrytis) and broccoli (var. italica), leafy heads (terminal leaf buds) or lateral leaf buds in cabbage (var. capitata) and brussels sprouts (var. gemmifera), leaves and flowers in Chinese kale (var. alboglabra) and tuberous stems in kohlrabi (var. gongylodes) [1,2,3].
Cauliflower differs from most Brassica species in its formation of a specialized organ called the curd during floral development [4,5,6]. As edible organs, curds contain rich nutritional components, including a natural bioactive anticancer substance, sulforaphane [7]. The global market for cauliflower and broccoli was approximately 25.84 million tons with a total area of 1.38 million hectares of production for 2021 (The Food and Agriculture Organization, http://faostat.fao.org (accessed on 13 May 2023)). Cultivated cauliflower is generally divided into loose-curd and compact-curd classes based on the degree of curd solidity [8]. Compact-curd cauliflower is a traditional type that is cultivated all over the world, whereas loose-curd cauliflower is much more popular in China, and has been introduced to other countries in Southern and Southeast Asia in recent years. In China, due to its long green stem and better edible quality for stir frying, roasting and hot potting, loose-curd cauliflower has become the main type consumed and cultivated, and its planting area has continuously increased over the last decade, now accounting for more than 70% of the total area [9].
To facilitate the breeding of cauliflower, some studies have tried to detect genomic loci for its agronomic traits. Zhao et al. [10] performed a mapping of quantitative trait loci (QTLs) by using two double-haploid (DH) populations, and they identified 20 QTLs for curd architecture, including stalk length (qSL.C6–1, qSL.C6–2) and curd solidity (qCS.C6–1 and qCS.C6–2). Hasan et al. [11] detected QTL regions that were involved in the temperature-dependent time to curd induction, on chromosomes C06 and C09. In a later study [12], several QTLs for the leaf appearance rate and for the slope and the intercept of linear temperature–response functions were identified, and a genomic selection model was constructed for predictions of time to curd induction. However, the genetic bases of many important cauliflower traits are still poorly understood. In particular, due to the narrow genetic background and the unclear genetic basis of important agronomic characteristics in loose-curd cauliflower, genetic improvement and cultivar innovation remain severely limited.
For almost all crops, many important traits, including high yield, excellent quality, and plant architecture, are core breeding goals and are extremely complex quantitative traits that are controlled by multiple genes. Researchers detect QTLs by using approaches including QTL mapping via linkage analyses, BSA-seq and genome-wide association studies (GWASs). In addition to other methods, GWASs are a promising approach to crop improvement that have appeared in recent years. GWASs are an effective strategy for uncovering the genetic architecture of complex traits by associating genetic variations with phenotypic variations at the population level [13,14,15]. Over the last decade, many genetic loci/genes have been identified by using this approach in rice [16], maize [17,18], wheat [19], soybean [20], cotton [21], tomato [22], melon [23], watermelon [24], etc. Thus, GWASs have been widely used to study important traits that are related to plant genetics and breeding, thus effectively promoting germplasm innovation and molecular breeding. In Brassica crops, GWASs have mainly been used in Brassica napus to detect the genetic loci for seed weight [25], glucosinolate content [26], oil content [27], disease resistance [28], etc. In recent years, GWASs have shown a promising role in the genomic prediction of useful QTLs and genotypes among genetically diverse accessions for subsequent breeding goals, and they have been applied to cauliflower in quite a few cases. Thorwarth et al. [29] introduced genotyping-by-sequencing (GBS) and a GWAS for six curd-related traits, and they identified a total of 24 significant associations for these. Matschegewski et al. [30] performed a GWAS using 111 cauliflower commercial parent lines, and they identified 18 QTLs localized on chromosomes O1, O2, O3, O4, O6, O8 and O9 for temperature-dependent curding time; several of these QTLs were located within genomic regions that harbored candidate flowering genes. By combining this with gene expression analysis, BoVRN2 and BoFLC2 were identified as promising genes that regulated floral transition in cauliflower. Although loose-curd cauliflower has become a very important cultivation type, to our knowledge, GWASs have not been used in the core breeding accessions of loose-curd cauliflower.
Curd performance and plant architecture are important traits for cauliflower pro-duction. The main stem height (MSH)—the length from the ground to the curd growing position—is closely correlated with plant height (PH) and curd yield, and a proper stem height is more conducive to mechanized curd harvesting and pathogen prevention. Curd color is an important trait affecting the commercial value of cauliflower. In some cases, purplish spots easily appear on the surface of white curds, i.e., purplish curds (PCs). This trait results from an increase in anthocyanin accumulation, when the plant is grown under stressful conditions, especially low temperatures, thus greatly affecting the appearance and the marketability of the curd. The external leaf wing (ELW) is an important trait that is used to distinguish different accessions or cultivars of loose-curd cauliflower. In addition, the weight of a single curd (WSC) is a trait that is directly associated with the yield of cauliflower. To date, the genetic basis of these traits has not been elucidated in loose-curd cauliflower.
To identify the potential target genes or loci for MSH, PC, ELW and WSC, we investigated the phenotype data from 220 core accessions used in loose-curd cauliflower breeding and performed a SNP-based GWAS while using variant information. Our work provides important guidance and a reference for the cloning of genes that control important agronomic traits and for the breeding of superior cultivars of loose-curd cauliflower.

2. Materials and Methods

2.1. Plant Materials, Phenotyping and Resequencing

Seeds of 220 inbred loose-curd cauliflower breeding lines were sown in duplicates to ensure data repeatability in Yutian, Hebei Province, China, in 2020 and 2021. All of these plants were obtained from the Cauliflower Research Group, Institute of Vegetables, Tianjin Academy of Agriculture Sciences (TAAS). Four traits, including the WSC (weight of a single curd), MSH (main stem height), ELW (external leaf wing) and PC (purplish curd), were measured at the stage of curd physiological maturity. Field experiments on all accessions were conducted according to a randomized complete block design with three replicates. Each replicate was seeded with five plants, and the cauliflower plants were grown at a distance of 60 cm within each row and 60 cm between rows. For WSC and MSH, the weight of a single curd (kg) and the height from the ground to the curd’s growing position (cm) were measured, respectively, and the average values of three replicates represented the phenotypic data. ELW and PC were evaluated by eye according to their presence (assigned a value of 1) or absence (assigned a value of 0).
A total of 220 breeding lines were used for resequencing and GWASs. Young leaves from 25-day-old seedlings of these accessions were subjected to DNA isolation/extraction using a modified cetyltrimethylammonium bromide (CTAB) method [31]. Sequencing libraries were generated by using a Truseq Nano DNA HT Sample Preparation Kit (Illumina, San Diego, CA, USA) according to the manufacturer’s recommendations. The whole genomes of the 220 accessions were sequenced based on the PE150 strategy with an insert size of around 350 bp using next-generation sequencing technology on an Illumina NovaSeq 6000 platform (Illumina, San Diego, CA, USA).

2.2. Sequence Mapping and SNP Calling

To ensure that the reads were reliable and without artificial bias in the subsequent analyses, we firstly removed the raw reads using the Fastp [32] as follows: (1) with ≥10% unidentified nucleotides (N); (2) with >50% bases having a phred quality of <5; (3) with >10 nt aligned to the adapter, allowing ≤10% mismatches; (4) putative PCR duplicates. The latest high-quality cauliflower ‘C-8’ genome was used as a reference (NGDC, National Genomics Data Center, accession NO.: GWHBKKZ00000000, version 2.0). Clean reads of each sample were aligned to the cauliflower genome using the Burrows–Wheeler Aligner program (BWA, ver. 0.7.15) [33] (settings: mem -t 4 -k 32 -M -R). SAMtools (ver. 1.4) [34] was then used to convert and sort the format of the SAM files (settings: -bS -t). The HaplotypeCaller module in the GATK (Genome Analysis Toolkit, ver. 4.0) software [35] was used to generate original GVCF files. Subsequently, the CombineGVCFs, GenotypeGVCFs, SelectVariants and VariantFiltration modules were applied sequentially for population SNP calling and filtering. Finally, a raw population genotype file with the SNPs was created in the HaplotypeCaller module and filtered with the parameters described in a previously reported pipeline [36]. The identified SNPs were further characterized using the ANNOVAR tool software [37] based on the annotation information of the cauliflower ‘C-8’ genome annotation information.

2.3. Population Structure and Linkage Disequilibrium Analysis

The population structure was evaluated by using Admixture (ver. 1.3.0) [38], and different levels of K (K = 2 to 4) were calculated to determine the optimal number of subpopulations on the basis of the CV error. Finally, K = 2 was a reasonable number for the group division. Then, PCA of the population was performed by using GCTA software (ver. 1.93.2) [39] to verify the rationality of the subgroups. We first obtained the genetic relationship matrix with the ‘make-grm’ parameter. Then, the top three principal components were estimated with the ‘pca3 parameter. Finally, we also estimated an individual-based neighbor-joining tree on the basis of the p-distance by using TreeBest software (ver. 1.9.2) (http://treesoft.sourceforge.net (accessed on 18 August 2020)) with 1000 bootstrap replications.
To estimate the LD for all samples, we calculated the squared correlation coefficient (r2) between pairwise SNPs by using PopLDdecay software (ver. 3.41) [40]. The program parameters were set as ‘-MaxDist 1000-MAF 0.05-Miss 0.2’ to calculate the average R2 between two SNPs in 1000-kb windows. The LD decay was measured on the basis of the R2 value and the corresponding distance between two given SNPs.

2.4. GWAS

A total of 2,892,291 segregating SNPs (minimum allele frequency (MAF) > 0.05; missing rate < 20%) were used for the following GWASs in this study. GWASs for four traits were conducted in both years (2020 and 2021), and the above population structure information was included as a covariate. Each GWAS was conducted by using a mixed linear model (MLM) in the GEMMA software (ver. 0.98.1) to calculate the correlations between each trait and the genetic markers in this study [41]. We introduced the population genetic structure as a fixed effect and the individual kinship matrix as a random effect to correct for these factors [41]. The suggestive threshold for the p-value was calculated based on the modified Bonferroni correction. Significant markers from the GWASs were visualized by using Manhattan plots, and important p-value distributions were visualized with quantile–quantile (QQ) plots. The p-value was calculated for each SNP, and −log10 p > 5 was defined as the suggestive threshold and genome-wide control threshold.

2.5. Phylogenetic and Transcriptome Analyses

For phylogenetic analysis, the full-length amino acid sequence of BOB01G13667 was used to search for its close homologs based on the BLASTP searches in the NCBI and Ensemble Plants databases (http://plants.ensembl.org/index.html (accessed on 06 April 2022)). A total of 20 homologous protein sequences were downloaded from another 14 plant species, including Arabidopsis thaliana, B. oleracea var. alboglabra, Brassica rapa, Brassica napus, Oryza sativa Japonica Group, Triticum aestivum, Glycine max, Solanum lycopersicum, Capsicum annuum, Vitis vinifera, Gossypium raimondii, Cucumis sativus, Nicotiana attenuate and Medocago truncatula. A neighbor-joining phylogenetic tree was constructed based on the 21 homologous protein sequences with the MEGA 7.0 software (http://www.megasoftware.net/download_form (accessed on 06 April 2022)).
To study the expression of BOB01G136670, we obtained the transcriptome data for several tissues (leaf, root, silique, stem and bud) and developmental stages (vegetative, transition, curd formation, curd enlargement and curd elongation) of cauliflower from the NCBI database (PRJNA546441). The reads were mapped against the cauliflower ‘C-8’ reference genome (V2.0) with HISAT2 [42], and the value of the transcripts per kilobase per million mapped reads (TPM) value was estimated for the gene with StringTie [43].

2.6. Statistical Analysis and Availability of Data

All presented p-values correspond to two-sided p-values according to the Student’s t-test. One-way ANOVA was used in the statistical analyses. An analysis of the significance between two groups was performed by using EdgeR (ver. 3.32.1).
The raw genome sequencing reads of the 220 loose-curd cauliflower accessions were deposited into the NCBI BioProject database under the accession number PRJNA993378.

3. Results

3.1. Plant Material Collection, Phenotype Survey, and DNA Sequencing

To identify genes associated with important agronomic traits, we selected 220 core accessions that were high generation inbred lines used in the loose-curd cauliflower breeding process. To ensure the accuracy of the subsequent GWASs, we planted these accessions twice (in 2020 and 2021) and measured four agronomic traits; namely, WSC, MSH, ELW and PC.
Next, we extracted DNA from the above accessions and performed high-throughput sequencing using the Illumina NovaSeq 6000 platform, and we obtained a total of 1.63 terabases (Tb) of sequencing data, with an average sequencing depth of 11.37×. Then, we mapped the sequencing data to the high-quality cauliflower ‘C-8’ reference genome (version 2.0, National Genomics Data Center, accession NO.: GWHBKKZ00000000), with a mapping rate of 92.48–99.43% and coverage of 92.61–97.05%. The above results indicated that our library of variant information was of good quality and sufficient to support the subsequent analyses.

3.2. SNP Identification, Genetic Diversity and Population Structure

After alignment with the ‘C-8’ genome and removal of the low-quality SNP markers, we detected a final set of 2,892,291 confident SNPs on the basis of the missing data rate (<10%) and minor allele frequency (MAF) (>5%). Among these confident SNPs, 1,569,529 (54.27%) were intergenic, and 166,231 (5.75%) were nonsynonymous SNPs. These confident SNPs were subjected to principal component analysis (PCA) and linkage disequilibrium (LD) analysis. The PCA results indicated that these accessions could be roughly separated into two major groups (Figure 1A): an early-maturing group (less than 70 days from planting to maturity) and mid–late-maturing group (more than 70 days from planting to maturity). The results of the 3D PCA further supported this conclusion (Figure 1B).
To distinguish the two groups, the population structure was determined based on the filtered SNPs covering the whole genome and distributed evenly on all chromosomes. When K = 2, the difference between these two groups could be clearly observed. Notably, few accessions had only one population structure component, and most of them combine both types of genetic characteristics (Figure 1C). The neighbor-joining analysis showed similar classification into two groups. However, the two branches did not exactly display the groups of the structural analysis (Figure 1E). These results, together with those of the LD decay–distance analysis (Figure 1D), further indicated the narrow genetic background and relatively low genetic diversity of this cultivation type. In the subsequent GWASs, the above information on the population structure was included as a covariate.

3.3. Genome-Wide Association Analysis of Three Important Agronomic Traits

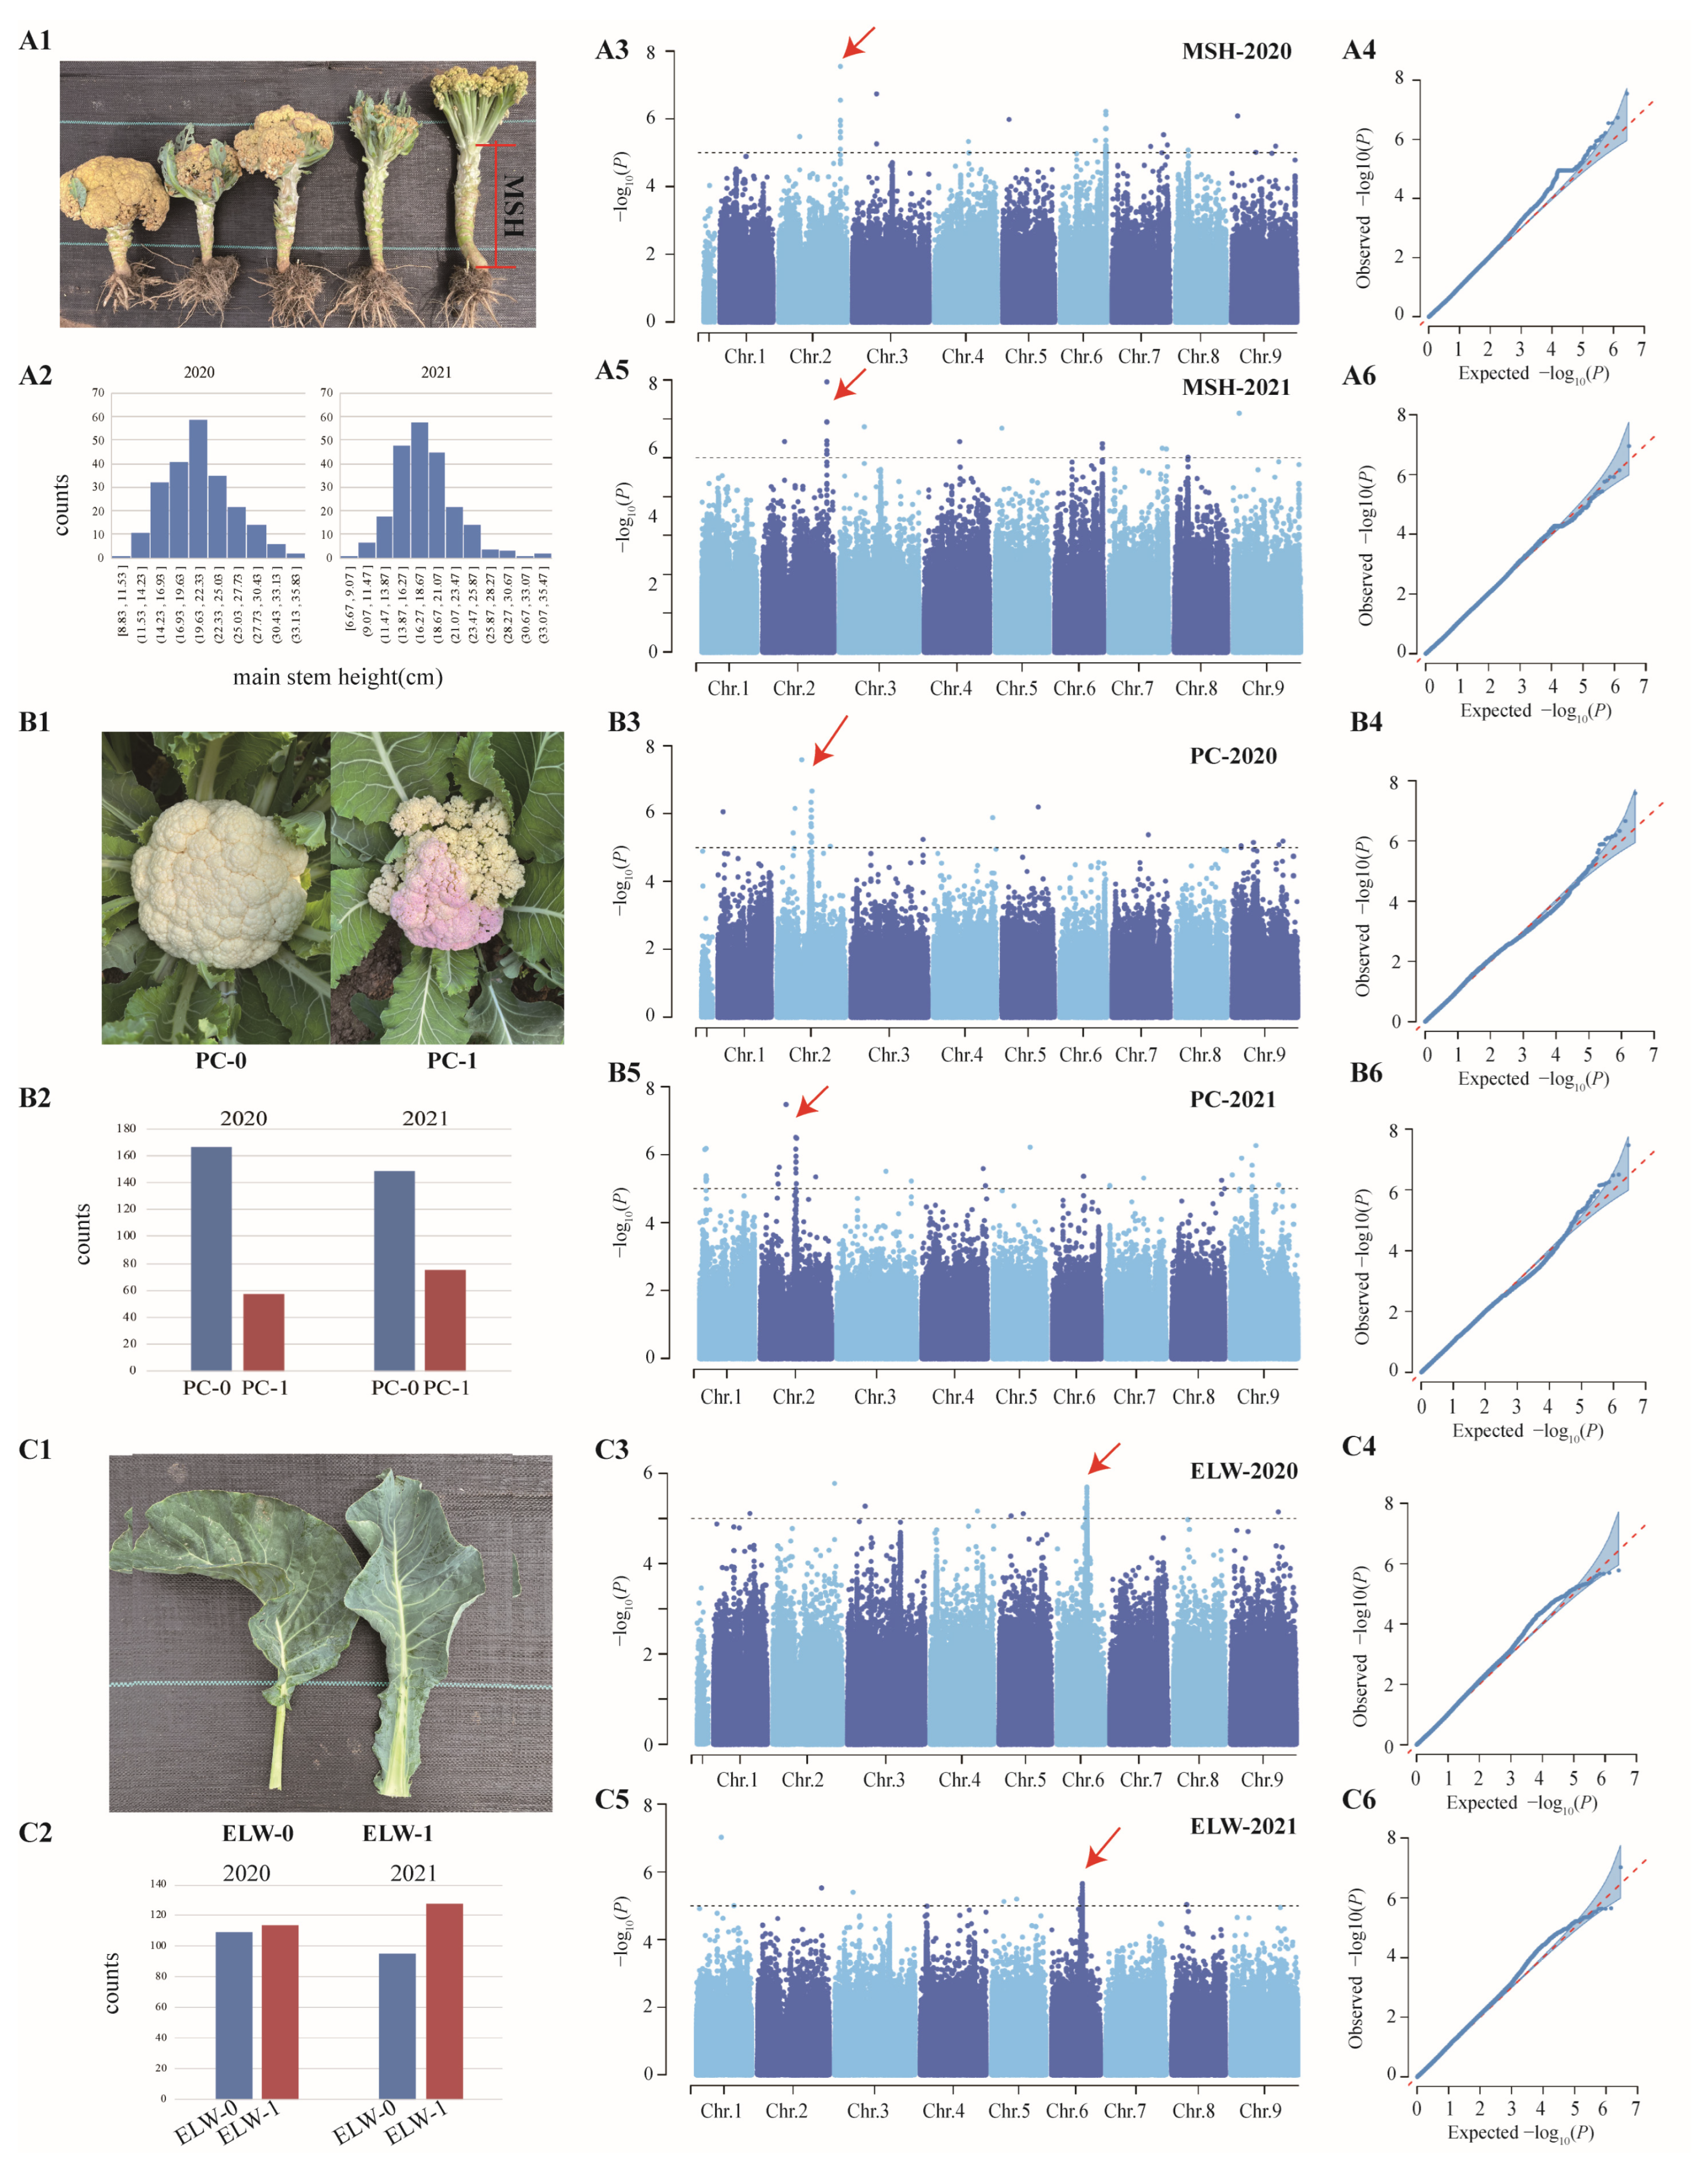
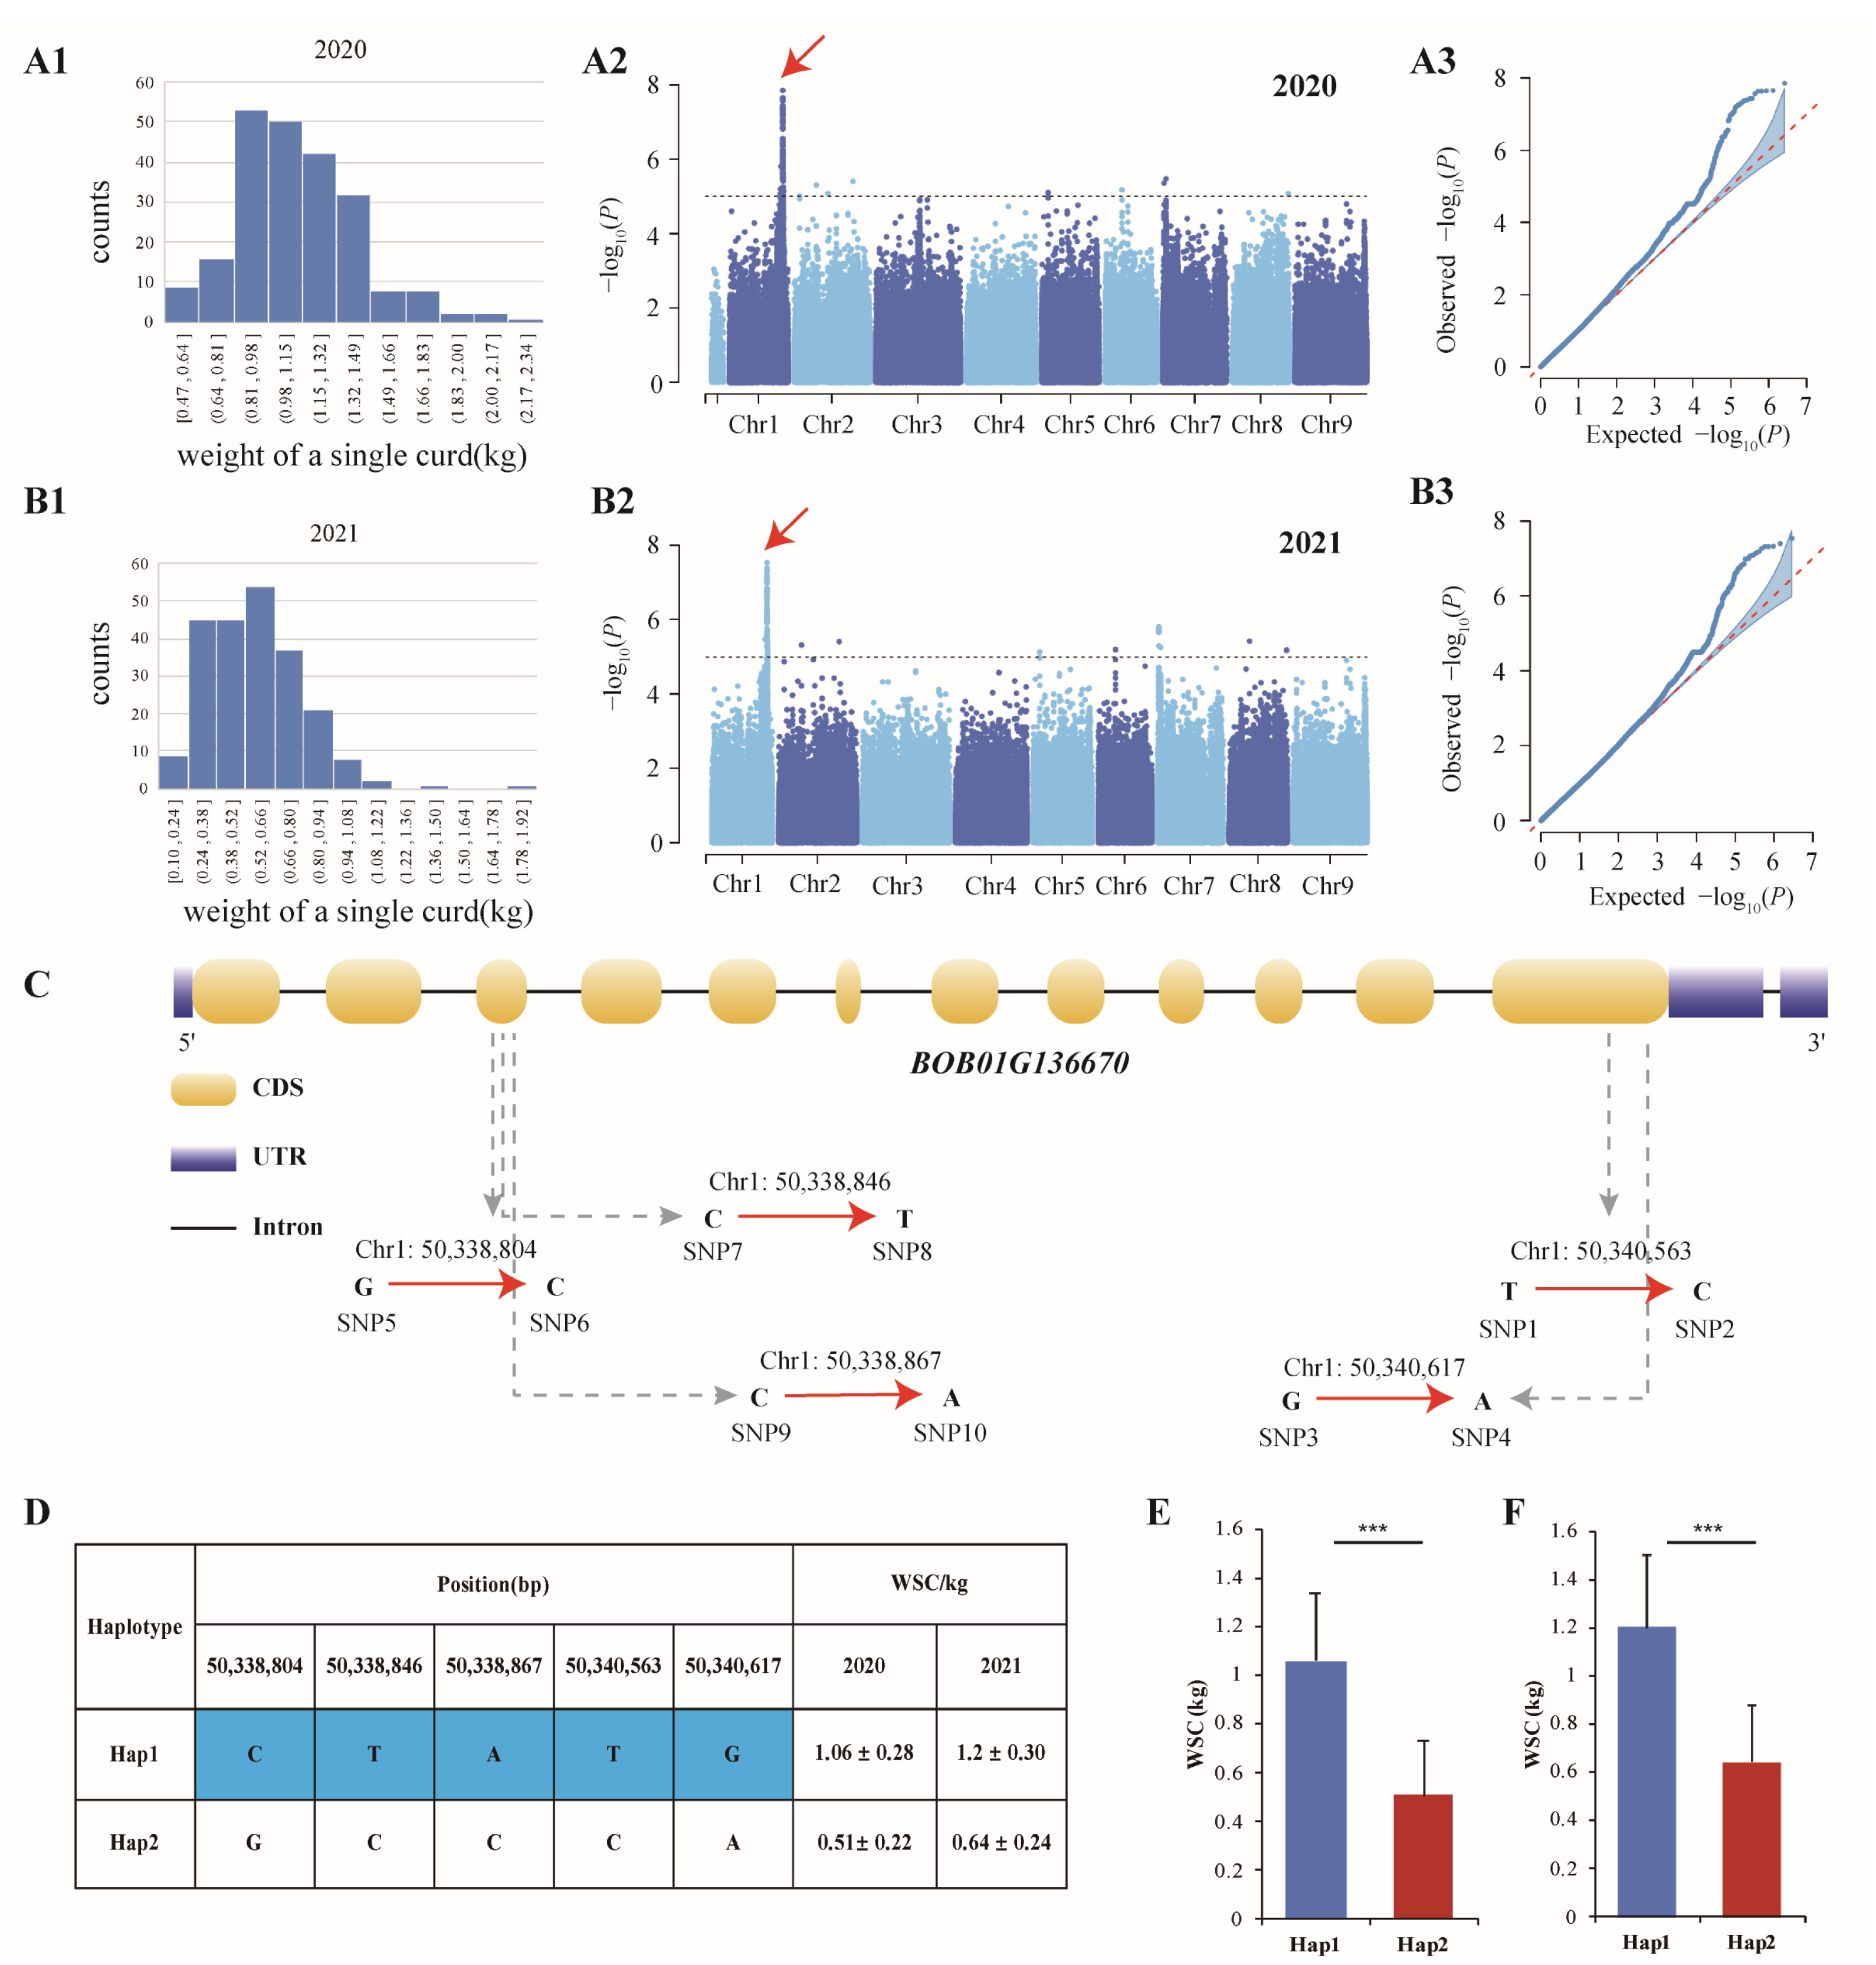
To identify the loci responsible for MSH, PC, ELW and WSC, we collected the phenotypic data from a core collection of loose-curd cauliflower breeding lines in 2020 and 2021. The phenotypic data of MSH and WSC showed similar normal distributions in 2020 and 2021 (Figure 2(A1,A2) and Figure 3(A1,B1)). For PC and ELW, the phenotypic data from both years were slightly biased by effects of the environment (Figure 2(B1,B2,C1,C2)). We next performed a GWAS on MSH, PC, ELW and WSC by using MLM to identify the loci underlying each trait.
For MSH, we detected a significant signal (−log10 p > 5) on chromosome 2 ranging from 64.932 to 64.954 Mb in the phenotypic data from both 2020 and 2021, which was more significant than that the others (Figure 2(A3,A5)). Three candidate genes were detected in the interval: BOB02G168110, encoding a serine–threonine protein kinase; BOB02G168090, encoding lysosomal beta glucosidase-like; BOB02G168100, of unknown function.
For PC, our GWAS analysis identified a significant and continuous signal (−log10 p > 5) on chromosome 2 ranging from 35.989 to 36.223 Mb in both years (Figure 2(B3,B5)). This interval harbored three protein-coding genes based on the threshold value, BOB02G088210, BOB02G088220 and BOB02G088870. Curiously, no homologous genes of the above three genes were found in Arabidopsis thaliana.
For ELW, we detected a significant signal (−log10 p > 5) on chromosome 6 ranging from 30.851 to 30.913 Mb in both years. Although SNPs with more significant p-values were found at other positions, none of the highest-point positions showed continuous SNPs, unlike the signal on chromosome 6 (Figure 2(C3,C5)). This interval harbored 11 protein-coding genes based on the threshold values.

3.4. BOB01G136670 Regulates the Weight of a Single Curd

In addition to the GWASs for the three agronomic traits mentioned above, for WSC, which is an important agronomic trait related to curd yield, we identified a very significant continuous signal (−log10 p > 5) on chromosome 1 ranging from 50.325 to 50.371 Mb without interference (Figure 3(A2,B2)). Within this interval, the BOB01G136670 gene with five significant nonsynonymous mutations in the CDS region was identified (Figure 3C). A haplotype analysis was performed to catalog the natural variation at BOB01G136670 in loose-curd accessions. We identified two haplotypes based on the five nonsynonymous SNPs: Hap1 and Hap2 (Figure 3D), and refer to them as BOB01G136670Hap1 and BOB01G136670 Hap2, respectively. We measured the curd weight of individuals with different haplotypes, and found that two haplotypes produced significantly different curd weights in 2020 and 2021 (Figure 3E,F). We found that the weight of a single curd was significantly increased in the varieties with the BOB01G136670 Hap1 allele compared to BOB01G136670 Hap2.
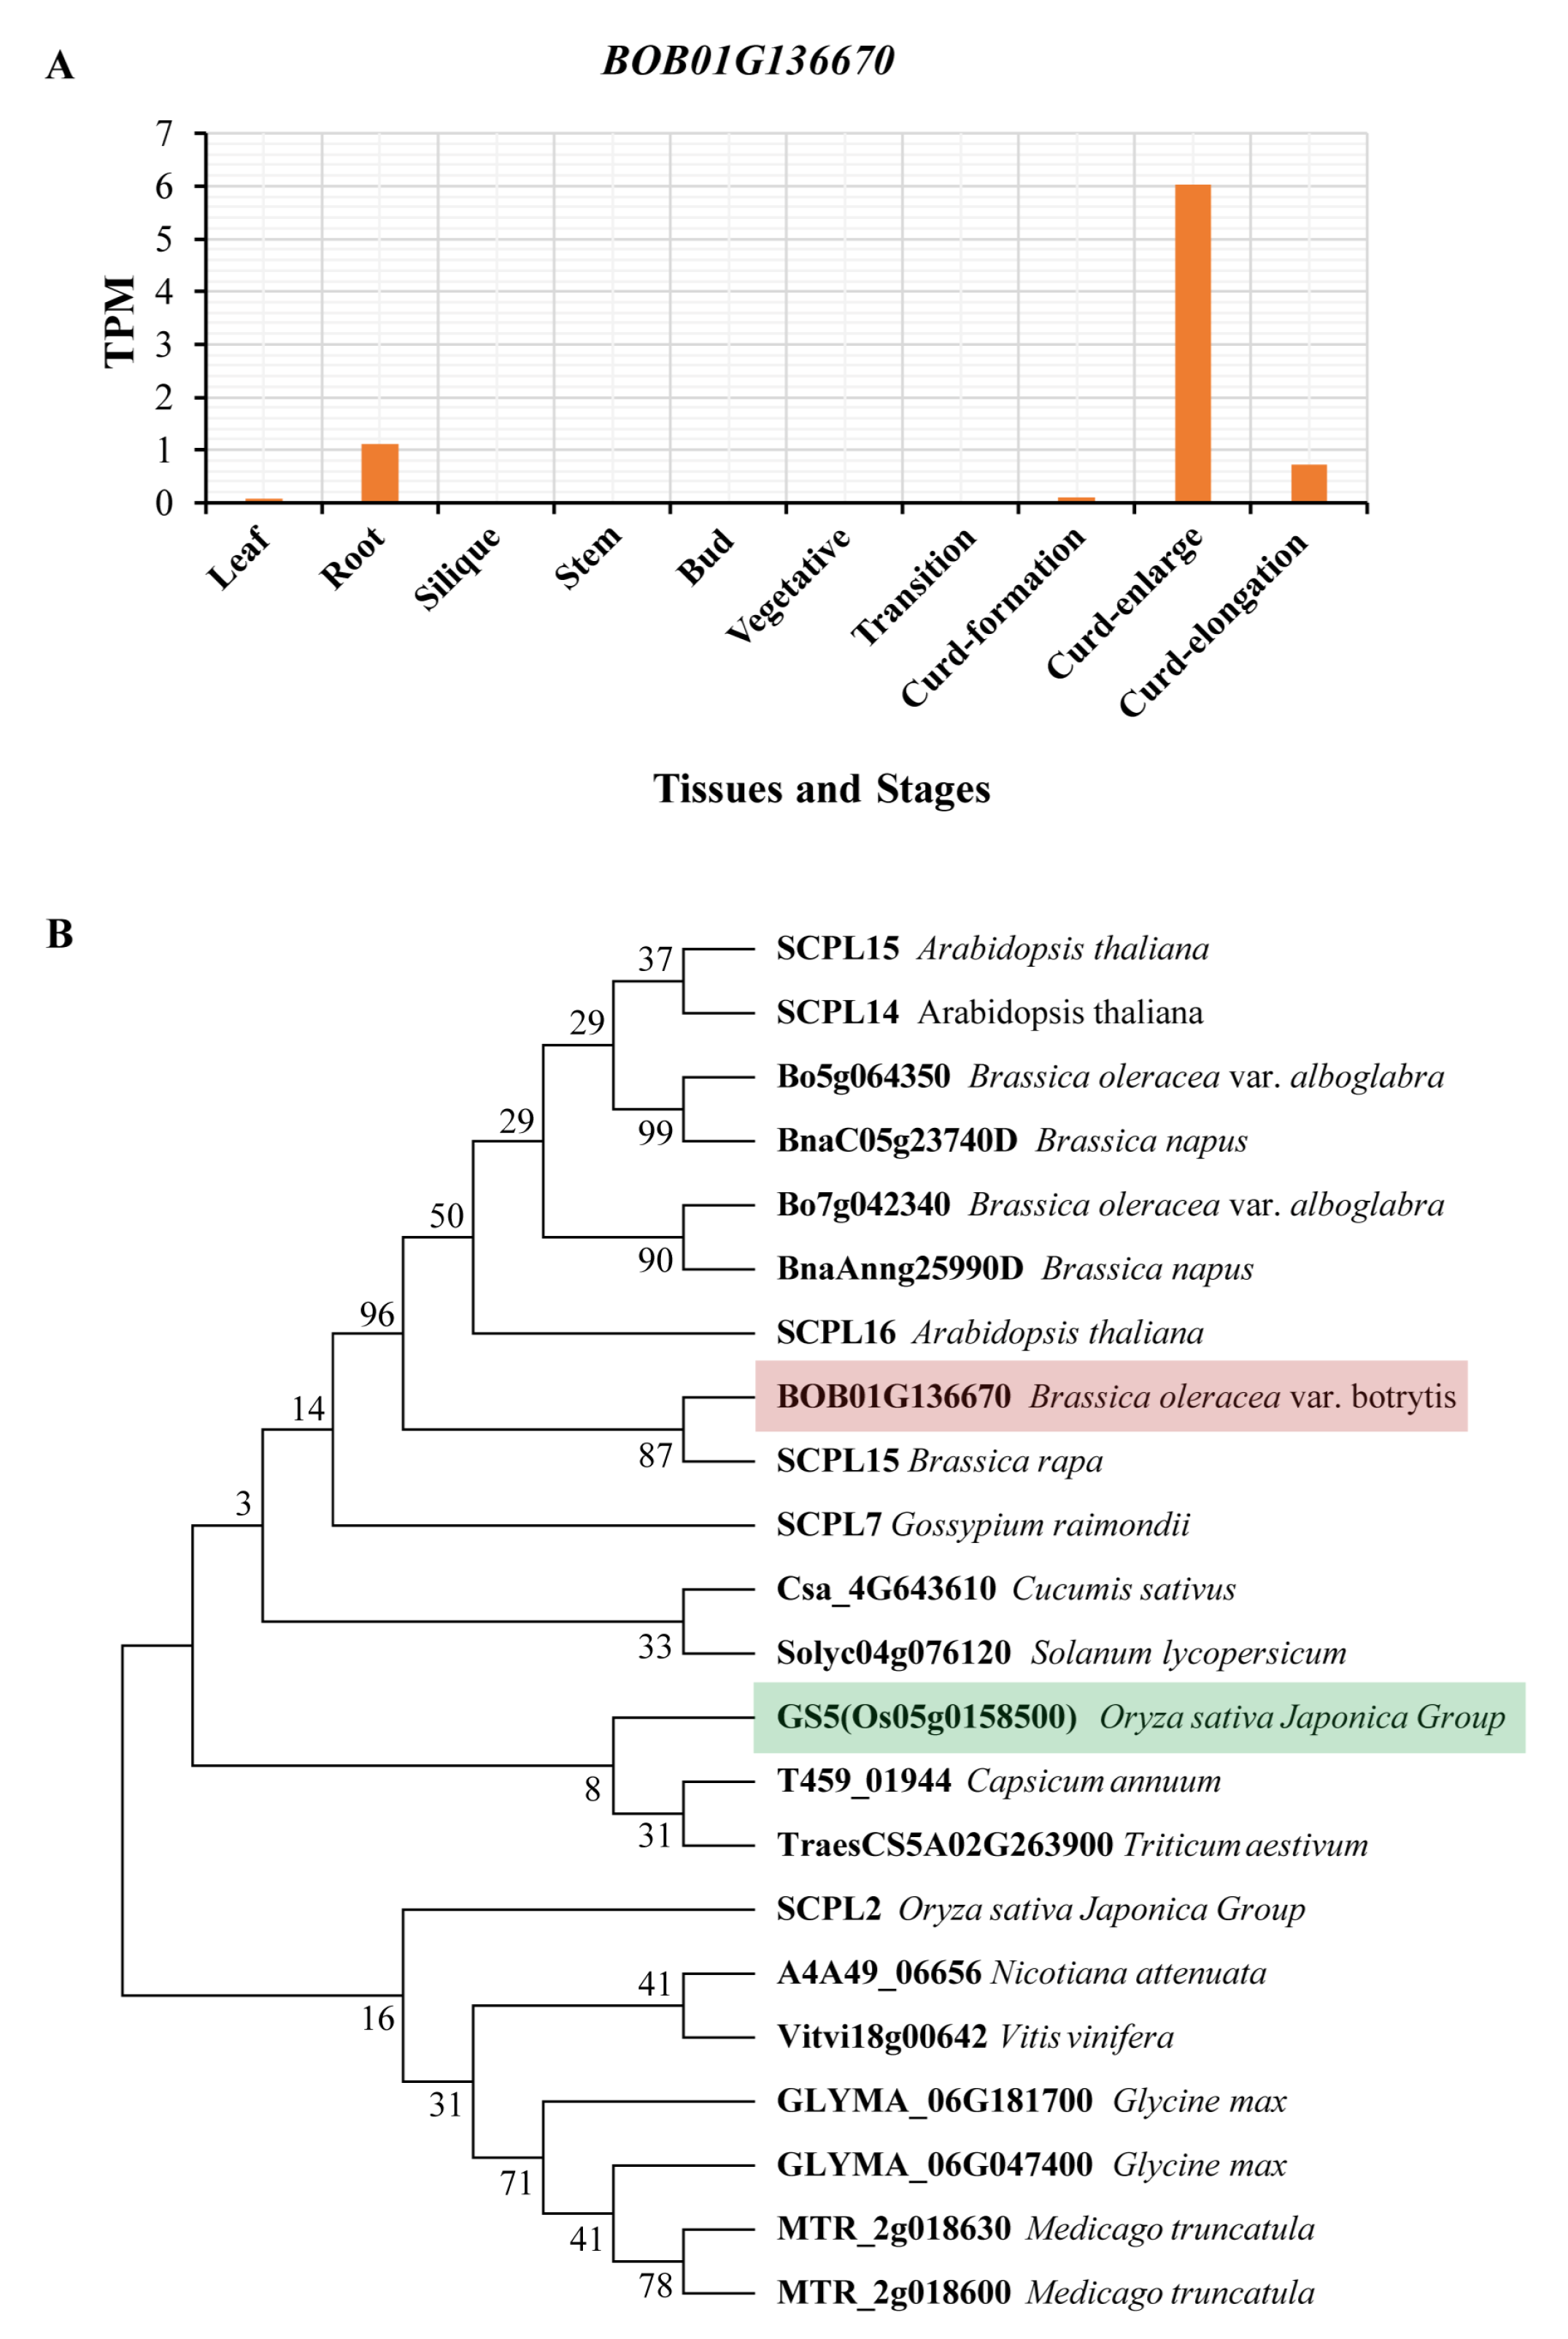
We analyzed the compact-curd cauliflower transcriptome data (PRJNA546441) from several tissues and developmental stages [44], and found that BOB01G136670 was specifically highly expressed at the curd enlargement stage but had low or even no expression at all other stages (Figure 4A). Given that the expression pattern is conserved in loose-curd cauliflowers, this result suggests that the high expression of BOB01G136670 at the curd enlargement stage is likely due to its function in regulating the weight of single curds.
BOB01G136670 was predicted to encode a serine carboxypeptidase belonging to the peptidase S10 family, which is homologous to ATSCP15 in A. thaliana. To analyze the phylogenetic relationships between BOB01G136670 and its close homologs, we searched the protein database of the NCBI database and Ensemble Plants by using BLASTP tools with the BOB01G136670 sequence as a query. A total of 21 homologous protein sequences were downloaded from 15 plant species and were used to construct a neighbor-joining phylogenetic tree together with the amino acid sequence of BOB01G136670 by MEGA 7.0 software (Figure 4B). Our results revealed that BOB01G136670 was highly conserved with respect to proteins such as SCPL in the S10 family in other species. Among the orthologous genes, GS5, which shares 30% identity with BOB01G136670, functions as a positive regulator of grain size, and its higher expression is correlated with larger grain size in rice, wheat and maize [45,46,47]. In addition, its paralogous gene SCPL22 positively regulates the carpels number and seeds per fruit (silique). This indicates that BOB01G136670 may play an important role in regulating curd weight and yield.

4. Discussion

Loose-curd cauliflower has emerged as an important cultivation type, especially in China, it displays a long and green stem and has a better edible quality, which meets the Chinese cooking habits. Dissection of the genetic architecture underlying the complex agronomic traits among a large number of loose-curd cauliflower accessions is helpful to improve the utilization of these germplasms, and provides a powerful resource for genetic improvement of loose-curd cauliflower. However, little is known about the genetic loci for its important traits. In this study, we performed GWAS on four important agronomic traits based on 220 core accessions of loose-curd cauliflower. Four significant associations were detected in both years for MSH, PC, ELW and WSC for the first time. In previous studies, the GWAS strategy was also used for the dissection of curd-related agronomic traits and temperature-dependent curding time of traditional compact-curd accessions [29,30], suggesting its promising role in cauliflower genetic prediction and improvement.
GWASs have been proven to be powerful and successful tools for the discovery of genetic factors associated with complex phenotypes [48]. Population size, differences in sample abundance and marker density are key factors for a successful GWAS. In contrast to previous studies, our sample collection only comprised loose-curd cauliflower modern breeding lines, without types such as compact-curd cauliflower, landraces/heirlooms and wild relatives. Although this sample strategy narrowed the genetic background and diversity of the population, as shown by the PCA and population structure analyses, we found that this population has a large phenotypic diversity in terms of, for example, yield, plant architecture, curd color, maturation time, etc., and that the population could be divided into two subgroups. Given the relatively large population size and wide variability among sample traits, we think that this population is adequate for GWAS.
The height of the main stem largely determines PH in cauliflower, which has a strong effect on yield, quality and mechanized harvesting. In a 2002 study, Sebastian et al. reported that stem length was a quantitative characteristic and was mapped to four QTL segments of three linked groups [49]. Based on a GWAS, we identified a significant interval on chromosome 2 ranging from 64.932 to 64.954 Mb and three candidate genes were detected. During the late developmental stage or when subjected to abiotic stress, the surface of white curds turns purplish, which has a highly adverse influence on their quality and marketability. Lang et al. speculated that this characteristic is closely related to the synthetic pathway of cyanidin [50]. Here, a significant and continuous signal on chromosome 2 (35.989–36.332 Mb) associated with PC was detected, and three genes with no definite function were harbored in this interval. In addition, our GWAS analysis identified an interval harboring 11 candidate genes for ELW on chromosome 6. These loci were novel and have not been reported in previous studies.
Plant breeders have paid special attention to plant yield for decades because of its significance in improving varieties. Increasing crop yield is one of the most important goals of plant science research [45]. Numerous genes or quantitative trait loci (QTLs) for yield traits, including grain weight or size and fruit size or weight, have been isolated by a map-based cloning approach or genome-wide analyses in rice [51,52,53,54,55], maize [56], tomato [57,58,59,60,61], etc. The weight of a single curd is a major determinant of yield in cauliflower and is a target trait for both domestication and artificial breeding. However, the genes responsible for this trait remain largely unexplored in cauliflower. Curd formation and enlargement are essential to the yield of cauliflower. Floral meristem regulators, such as BoCAL and BoAP1, were identified as essential genes for the specific curd formation [62]. However, they are necessary, but not sufficient, conditions for the formation of specific curds. The genomic loci/genes for curd enlargement (curd weight) are still inconclusive. Here, BOB01G136670 was identified as a candidate gene that was significantly associated with WSC through a GWAS, with five nonsynonymous mutant SNPs in the CDS region significantly affecting the single-curd weight.
BOB01G136670 encodes a typical serine carboxypeptidase that belongs to the group I in the SCPL family [63,64]. The SCPL genes are widely present in higher plants, playing essential roles in plant stress tolerance, disease resistance, plant growth and especially in seed development [63,64]. Their orthologs—OsGS5 in rice, TaGS5-3A in wheat and ZmGS5 in maize—have been proven to be positive regulators of grain size, meaning that higher expression of GS5 is correlated with larger grain size [45]. Additionally, its paralog SCPL22 positively regulates the carpel number and seeds per fruit (silique). BOB01G136670 was specifically highly expressed in the curd enlargement stage compared with other tissues and stages, which further indicated that BOB01G136670 is closely related to curd enlargement. Taken together, the GWAS, haplotype, RNA-seq and phylogenetic tree results demonstrate that BOB01G136670 is a potential candidate gene for WSC. The functional verification is still needed in future work.

5. Conclusions

In summary, we successfully explored some new loci, candidate genes and genetic architectures influencing key agronomic traits, including the main stem height, external leaf wing, purplish curd and weight of a single curd, in loose-curd cauliflower for the first time. Importantly, we identified that BOB01G136670 is a plausible candidate gene for WSC based on GWASs, haplotype, RNA-seq and phylogenetic tree analyses. These genomic and genetic resources lay a solid foundation for functional and evolutionary studies and will aid in molecular breeding, germplasm utilization and variety improvement in the future. Further studies that include traditional QTL mapping and functional characterization of candidate genes would be helpful in revealing the genetic basis for these important traits in cauliflower.

Author Contributions

Conceptualization, X.S. and D.S.; methodology, H.J.; software, G.N.; validation, L.L. and X.Y.; formal analysis, Z.W.; investigation, G.N.; resources, X.S.; data curation, Z.W.; writing—original draft preparation, X.Z.; writing—review and editing, X.Z.; visualization, H.J.; supervision, D.S.; project administration, X.S.; funding acquisition, X.Z. All authors have read and agreed to the published version of the manuscript.

Funding

This work was funded by grants from the National Natural Science Foundation of China (32002042), the Natural Science Foundation of Tianjin (20JCYBJC00480), and Innovative Research and Experimental Projects for Young Researchers of Tianjin Academy of Agricultural Science (2021012, 2022002). The work was performed in the State Key Laboratory of Vegetable Biobreeding, Tianjin Academy of Agriculture Sciences, Tianjin 300192, China.

Data Availability Statement

The datasets used and/or analyzed during the current study are available from the first author upon reasonable request.

Conflicts of Interest

The authors declare no conflict of interest.

Abbreviations

WSCweight of a single curd
MSHmain stem height
ELWexternal leaf wing
PCpurplish curd
TPMtranscripts per kilobase per million mapped reads

References

  1. Dixon, G. Origins and diversity of Brassica and its relatives. In Vegetable Brassicas and Related Crucifers; CABI: Wallingford, UK, 2006; pp. 1–33. [Google Scholar] [CrossRef]
  2. Cheng, F.; Wu, J.; Wang, X. Genome triplication drove the diversification of Brassica plants. Hortic. Res. 2014, 1, 14024. [Google Scholar] [CrossRef]
  3. Liu, S.; Liu, Y.; Yang, X.; Tong, C.; Edwards, D.; Parkin, I.A.; Zhao, M.; Ma, J.; Yu, J.; Huang, S.; et al. The Brassica oleracea genome reveals the asymmetrical evolution of polyploid genomes. Nat. Commun. 2014, 5, 3930. [Google Scholar] [CrossRef] [PubMed]
  4. Li, H.; Liu, Q.; Zhang, Q.; Qin, E.; Jin, C.; Wang, Y.; Wu, M.; Shen, G.; Chen, C.; Song, W. Curd development associated gene (CDAG1) in cauliflower (Brassica oleracea L. var. botrytis) could result in enlarged organ size and increased biomass . Plant Sci. 2017, 254, 82–94. [Google Scholar] [CrossRef] [PubMed]
  5. Anthony, R.G.; James, P.E.; Jordan, B.R. The cDNA sequence of a cauliflower apetala-1/squamosa homolog. Plant Physiol. 1995, 108, 441–442. [Google Scholar] [CrossRef]
  6. Anthony, R.G.; James, P.E.; Jordan, B.R. Cauliflower (Brassica oleracea var. botrytis L.) curd development: The expression of meristem identity genes. J. Exp. Bot. 1996, 47, 181–188. [Google Scholar] [CrossRef]
  7. Cheung, K.L.; Kong, A.N. Molecular targets of dietary phenethyl isothiocyanate and sulforaphane for cancer chemoprevention. AAPS J. 2010, 12, 87–97. [Google Scholar] [CrossRef]
  8. Gu, H.H.; Jin, C.L.; Zhao, Z.Q.; Sheng, X.G.; Yu, H.F.; Wang, J.S. Analysis of the present situation and prospect of Chinese cauliflower industry. China Veg. 2012, 23, 1–5. [Google Scholar]
  9. Shan, X.Z.; Zhang, X.L.; Wen, Z.H.; Liu, L.L.; Yao, X.W.; Jiang, H.M.; Niu, G.B.; Sun, D.L. Status, development trend and countermeasure analysis of cauliflower industry in Beijing-Tianjin-Hebei Region. Vegetables 2019, 3, 43–46. [Google Scholar]
  10. Zhao, Z.Q.; Sheng, X.G.; Yu, H.F.; Wang, J.S.; Shen, Y.S.; Gu, H.H. Identification of QTLs associated with curd architecture in cauliflower. BMC Plant Biol. 2020, 20, 177. [Google Scholar] [CrossRef]
  11. Hasan, Y.; Briggs, W.; Matschegewski, C.; Ordon, F.; Stützel, H.; Zetzsche, H.; Groen, S.; Uptmoor, R. Quantitative trait loci controlling leaf appearance and curd initiation of cauliflower in relation to temperature. Theor. Appl. Genet. 2016, 129, 1273–1288. [Google Scholar] [CrossRef] [PubMed]
  12. Rosen, A.; Hasan, Y.; Briggs, W.; Uptmoor, R. Genome-based prediction of time to curd induction in cauliflower. Front. Plant Sci. 2018, 9, 78. [Google Scholar] [CrossRef] [PubMed]
  13. Du, Q.; Lu, W.; Quan, M.; Xiao, L.; Song, F.; Li, P.; Zhou, D.; Xie, J.; Wang, L.; Zhang, D. Genome-wide association studies to improve wood properties: Challenges and prospects. Front. Plant Sci. 2018, 9, 1912. [Google Scholar] [CrossRef]
  14. Wang, Q.; Tang, J.; Han, B.; Huang, X. Advances in genome-wide association studies of complex traits in rice. Theor. Appl. Genet. 2020, 133, 1415–1425. [Google Scholar] [CrossRef] [PubMed]
  15. Cortes, L.T.; Zhang, Z.; Yu, J. Status and prospects of genome-wide association studies in plants. Plant Genome 2021, 14, e20077. [Google Scholar] [CrossRef]
  16. Wang, W.; Mauleon, R.; Hu, Z.; Chebotarov, D.; Tai, S.; Wu, Z.; Li, M.; Zheng, T.; Fuentes, R.R.; Zhang, F.; et al. Genomic variation in 3,010 diverse accessions of Asian cultivated rice. Nature 2018, 557, 43–49. [Google Scholar] [CrossRef]
  17. Li, H.; Peng, Z.; Yang, X.; Wang, W.; Fu, J.; Wang, J.; Han, Y.; Chai, Y.; Guo, T.; Yang, N.; et al. Genome-wide association study dissects the genetic architecture of oil biosynthesis in maize kernels. Nat. Genet. 2013, 45, 43–50. [Google Scholar] [CrossRef]
  18. Wang, M.; Yan, J.; Zhao, J.; Song, W.; Zhang, X.; Xiao, Y.; Zheng, Y. Genome-wide association study (GWAS) of resistance to head smut in maize. Plant Sci. 2012, 196, 125–131. [Google Scholar] [CrossRef]
  19. Liu, Y.; Shen, K.; Yin, C.; Xu, X.; Yu, X.; Ye, B.; Sun, Z.; Dong, J.; Bi, A.; Zhao, X.; et al. Genetic basis of geographical differentiation and breeding selection for wheat plant architecture traits. Genome Biol. 2023, 24, 114. [Google Scholar] [CrossRef]
  20. Zhou, Z.; Jiang, Y.; Wang, Z.; Gou, Z.; Lyu, J.; Li, W.; Yu, Y.; Shu, L.; Zhao, Y.; Ma, Y.; et al. Resequencing 302 wild and cultivated accessions identifies genes related to domestication and improvement in soybean. Nat. Biotechnol. 2015, 33, 408–414. [Google Scholar] [CrossRef]
  21. Zhang, Y.; Zhang, Y.; Ge, X.; Yuan, Y.; Jin, Y.; Wang, Y.; Zhao, L.; Han, X.; Hu, W.; Yang, L.; et al. Genome-wide association analysis reveals a novel pathway mediated by a dual-TIR domain protein for pathogen resistance in cotton. Genome Biol. 2023, 24, 111. [Google Scholar] [CrossRef]
  22. Lin, T.; Zhu, G.; Zhang, J.; Xu, X.; Yu, Q.; Zheng, Z.; Zhang, Z.; Lun, Y.; Li, S.; Wang, X.; et al. Genomic analyses provide insights into the history of tomato breeding. Nat. Genet. 2014, 46, 1220–1266. [Google Scholar] [CrossRef]
  23. Zhao, G.; Lian, Q.; Zhang, Z.; Fu, Q.; He, Y.; Ma, S.; Ruggieri, V.; Monforte, A.J.; Wang, P.; Julca, I.; et al. A comprehensive genome variation map of melon identifies multiple domestication events and loci influencing agronomic traits. Nat. Genet. 2019, 51, 1607–1615. [Google Scholar] [CrossRef] [PubMed]
  24. Guo, S.; Zhao, S.; Sun, H.; Wang, X.; Wu, S.; Lin, T.; Ren, Y.; Gao, L.; Deng, Y.; Zhang, J.; et al. Resequencing of 414 cultivated and wild watermelon accessions identifies selection for fruit quality traits. Nat. Genet. 2019, 51, 1616–1623. [Google Scholar] [CrossRef] [PubMed]
  25. Gajardo, H.A.; Wittkop, B.; Soto-Cerda, B.; Higgins, E.E.; Parkin, I.A.P.; Snowdon, R.J.; Federico, M.L.; Iniguez-Luy, F.L. Association mapping of seed quality traits in Brassica napus L. using GWAS and candidate QTL approaches. Mol. Breed. 2015, 35, 143. [Google Scholar] [CrossRef]
  26. Liu, S.; Huang, H.; Yi, X.; Zhang, Y.; Yang, Q.; Zhang, C.; Fan, C.; Zhou, Y. Dissection of genetic architecture for glucosinolate accumulations in leaves and seeds of Brassica napus by genome-wide association study. Plant Biotechnol. J. 2019, 18, 1472–1484. [Google Scholar] [CrossRef] [PubMed]
  27. Yao, M.; Guan, M.; Zhang, Z.; Zhang, Q.; Cui, Y.; Chen, H.; Liu, W.U.; Jan, H.; Voss-Fels, K.P.; Werner, C.R.; et al. GWAS and co-expression network combination uncovers multigenes with close linkage effects on the oleic acid content accumulation in Brassica napus. BMC Genom. 2020, 21, 320. [Google Scholar] [CrossRef]
  28. Wei, L.; Jian, H.; Lu, K.; Filardo, F.; Yin, N.; Liu, L.; Qu, C.; Li, W.; Du, H.; Li, J. Genome-wide association analysis and differential expression analysis of resistance to sclerotinia stem rot in Brassica napus. Plant Biotechnol. J. 2016, 14, 1368–1380. [Google Scholar] [CrossRef]
  29. Thorwarth, P.; Yousef, E.A.A.; Schmid, K.J. Genomic prediction and association mapping of curd-related traits in gene bank accessions of cauliflower. G3 Genes Genomes Genet. 2018, 8, 707–718. [Google Scholar] [CrossRef]
  30. Matschegewski, C.; Zetzsche, H.; Hasan, Y.; Leibeguth, L.; Briggs, W.; Ordon, F.; Uptmoor, R. Genetic variation of temperature-regulated curd induction in cauliflower: Elucidation of floral transition by genome-wide association mapping and gene expression analysis. Front. Plant Sci. 2015, 6, 720. [Google Scholar] [CrossRef]
  31. Allen, G.C.; Flores-Vergara, M.; Krasynanski, S.; Kumar, S.; Thompson, W. A modified protocol. for rapid DNA isolation from plant tissues using cetyltrimethylammonium bromide. Nat. Protoc. 2006, 1, 2320–2325. [Google Scholar] [CrossRef]
  32. Chen, S.; Zhou, Y.; Chen, Y.; Gu, J. fastp: An ultra-fast all-in-one FASTQ preprocessor. Bioinformatics 2018, 34, i884–i890. [Google Scholar] [CrossRef]
  33. Li, H.; Durbin, R. Fast and accurate short read alignment with Burrows–Wheeler transform. Bioinformatics 2009, 25, 1754–1760. [Google Scholar] [CrossRef] [PubMed]
  34. Li, H.; Handsaker, B.; Wysoker, A.; Fennell, T.; Ruan, J.; Homer, N.; Marth, G.; Abecasis, G.; Durbin, R. The sequence alignment/map format and SAMtools. Bioinformatics 2009, 25, 2078–2079. [Google Scholar] [CrossRef]
  35. McKenna, A.; Hanna, M.; Banks, E.; Sivachenko, A.; Cibulskis, K.; Kernytsky, A.; Garimella, K.; Altshuler, D.; Gabriel, S.; Daly, M. The Genome Analysis Toolkit: A MapReduce framework for analyzing next-generation DNA sequencing data. Genome Res. 2010, 20, 1297–1303. [Google Scholar] [CrossRef] [PubMed]
  36. Du, X.; Huang, G.; He, S.; Yang, Z.; Sun, G.; Ma, X.; Li, N.; Zhang, X.; Sun, J.; Liu, M.; et al. Resequencing of 243 diploid cotton accessions based on an updated A genome identifies the genetic basis of key agronomic traits. Nat. Genet. 2018, 50, 796–802. [Google Scholar] [CrossRef]
  37. Wang, K.; Li, M.; Hakonarson, H. ANNOVAR: Functional annotation of genetic variants from high-throughput sequencing data. Nucleic. Acids Res. 2010, 38, e164. [Google Scholar] [CrossRef] [PubMed]
  38. Peter, B.M. Admixture, population structure, and F-statistics. Genetics 2016, 202, 1485–1501. [Google Scholar] [CrossRef]
  39. Yang, J.; Lee, S.H.; Goddard, M.E.; Visscher, P.M. GCTA: A tool for genome-wide complex trait analysis. Am. J. Hum. Genet. 2011, 88, 76–82. [Google Scholar] [CrossRef]
  40. Zhang, C.; Dong, S.; Xu, J.; He, W.; Yang, T. PopLDdecay: A fast and effective tool for linkage disequilibrium decay analysis based on variant call format files. Bioinformatics 2019, 35, 1786–1788. [Google Scholar] [CrossRef]
  41. Zoubarev, A.; Hamer, K.M.; Keshav, K.D.; McCarthy, E.L.; Santos, J.R.C.; Van Rossum, T.; McDonald, C.; Hall, A.; Wan, X.; Lim, R. Gemma: A resource for the reuse, sharing and meta-analysis of expression profiling data. Bioinformatics 2012, 28, 2272–2273. [Google Scholar] [CrossRef]
  42. Kim, D.; Langmead, B.; Salzberg, S.L. HISAT: A fast spliced aligner with low memory requirements. Nat. Methods 2015, 12, 357–360. [Google Scholar] [CrossRef] [PubMed]
  43. Pertea, M.; Pertea, G.M.; Antonescu, C.M.; Chang, T.C.; Mendell, J.T.; Salzberg, S.L. StringTie enables improved reconstruction of a transcriptome from RNA-seq reads. Nat. Biotechnol. 2015, 33, 290. [Google Scholar] [CrossRef] [PubMed]
  44. Guo, N.; Wang, S.; Gao, L.; Liu, Y.; Wang, X.; Lai, E.; Duan, M.; Wang, G.; Li, J.; Yang, M.; et al. Genome sequencing sheds light. on the contribution of structural variants to Brassica oleracea diversification. BMC Biol. 2021, 19, 93. [Google Scholar] [CrossRef] [PubMed]
  45. Li, Y.; Fan, C.; Xing, Y.; Jiang, Y.; Luo, L.; Sun, L.; Shao, D.; Xu, C.; Li, X.; Xiao, J.; et al. Natural variation in GS5 plays an important role in regulating grain size and yield in rice. Nat. Genet. 2011, 43, 1266–1269. [Google Scholar] [CrossRef] [PubMed]
  46. Liu, J.; Deng, M.; Guo, H.; Raihan, S.; Luo, J.; Xu, Y.; Dong, X.; Yan, J. Maize orthologs of rice GS5 and their transregulator are associated with kernel development. J. Integr. Plant Biol. 2015, 57, 943–953. [Google Scholar] [CrossRef]
  47. Ma, L.; Li, T.; Hao, C.; Wang, Y.; Chen, X.; Zhang, X. TaGS5-3A, a grain size gene selected during wheat improvement for larger kernel and yield. Plant Biotechnol. J. 2016, 14, 1269–1280. [Google Scholar] [CrossRef]
  48. Visscher, P.M.; Wray, N.R.; Zhang, Q.; Sklar, P.; McCarthy, M.I.; Brown, M.A.; Yang, J. 10 years of GWAS discovery: Biology, function, and translation. Am. J. Hum. Genet. 2017, 101, 5–22. [Google Scholar] [CrossRef]
  49. Sebastian, R.L.; Kearsey, M.J.; King, G.J. Identification of quantitative trait loci controlling developmental characteristics of Brassica oleracea L. Theor. Appl. Genet. 2002, 104, 601–609. [Google Scholar] [CrossRef]
  50. Lang, L.; Niu, G.; Dan, X.; Zhang, X.; Wen, Z.; Jiang, H. Determination of metabolites and principal component analysis of purplish curd in white cauliflower. China Cucurbits Veg. 2021, 34, 57–61. [Google Scholar] [CrossRef]
  51. Fan, C.; Xing, Y.; Mao, H.; Lu, T.; Han, B.; Xu, C.; Li, X.; Zhang, Q. GS3, a major QTL for grain length and weight and minor QTL for grain width and thickness in rice, encodes a putative transmembrane protein. Theor. Appl. Genet. 2006, 112, 1164–1171. [Google Scholar] [CrossRef]
  52. Takano-Kai, N.; Jiang, H.; Kubo, T.; Sweeney, M.; Matsumoto, T.; Kanamori, H.; Padhukasahasram, B.; Bustamante, C.; Yoshimura, A.; Doi, K.; et al. Evolutionary history of GS3, a gene conferring grain size in rice. Genetics 2009, 182, 1323–1334. [Google Scholar] [CrossRef] [PubMed]
  53. Song, X.; Huang, W.; Shi, M.; Zhu, M.; Lin, H.A. QTL for rice grain width and weight encodes a previously unknown RING-type E3 ubiquitin ligase. Nat. Genet. 2007, 39, 623–630. [Google Scholar] [CrossRef] [PubMed]
  54. Shomura, A.; Izawa, T.; Ebana, K.; Ebitani, T.; Kanegae, H.; Konishi, S.; Yano, M. Deletion in a gene associated with grain size increased yields during rice domestication. Nat. Genet. 2008, 40, 1023–1028. [Google Scholar] [CrossRef] [PubMed]
  55. Weng, J.; Gu, S.; Wan, X.; Gao, H.; Guo, T.; Su, N.; Lei, C.; Zhang, X.; Cheng, Z.; Guo, X.; et al. Isolation and initial characterization of GW5, a major QTL associated with rice grain width and weight. Cell Res. 2008, 18, 1199–1209. [Google Scholar] [CrossRef]
  56. Chen, W.; Chen, L.; Zhang, X.; Yang, N.; Guo, J.; Wang, M.; Ji, S.; Zhao, X.; Yin, P.; Cai, L.; et al. Convergent selection of a WD40 protein that enhances grain yield in maize and rice. Science 2022, 375, 1372. [Google Scholar] [CrossRef]
  57. Frary, A.; Nesbitt, T.C.; Grandillo, S.; Knaap, E.; Cong, B.; Liu, J.; Meller, J.; Elber, R.; Alpert, K.B.; Tanksley, S.D. fw2.2: A quantitative trait locus key to the evolution of tomato fruit size. Science 2000, 289, 85–88. [Google Scholar] [CrossRef]
  58. Cong, B.; Liu, J.; Tanksley, S. Natural alleles at a tomato fruit size quantitative trait locus differ by heterochronic regulatory mutations. Proc. Natl. Acad. Sci. USA 2002, 99, 13606–13611. [Google Scholar] [CrossRef]
  59. Chakrabarti, M.; Zhang, N.; Sauvage, C.; Munos, S.; Blanca, J.; Canizares, J.; Diez, M.J.; Schneider, R.; Mazourek, M.; McClead, J.; et al. A cytochrome P450 regulates a domestication trait in cultivated tomato. Proc. Natl. Acad. Sci. USA 2013, 110, 17125–17130. [Google Scholar] [CrossRef]
  60. Li, M.; Wang, X.; Li, C.; Li, H.; Zhang, J.; Ye, Z. Silencing GRAS2 reduces fruit weight in tomato. J. Integr. Plant Biol. 2018, 60, 498–513. [Google Scholar] [CrossRef]
  61. Li, N.; He, Q.; Wang, J.; Wang, B.; Zhao, J.; Huang, S.; Yang, T.; Tang, Y.; Yang, S.; Aisimutuola, P.; et al. Super-pangenome analyses highlight genomic diversity and structural variation across wild and cultivated tomato species. Nat. Genet. 2023, 55, 852–860. [Google Scholar] [CrossRef]
  62. Smith, L.B.; King, G.J. The distribution of BoCAL-a alleles in Brassica oleracea is consistent with a genetic model for curd development and domestication of the cauliflower. Mol. Breed. 2000, 6, 603–613. [Google Scholar] [CrossRef]
  63. Liu, Y.; Ce, F.; Tang, H.; Tian, G.; Yang, L.; Qian, W.; Dong, H. Genome-wide analysis of the serine carboxypeptidase-like (SCPL) proteins in Brassica napus L. Plant Physiol. Bioch. 2022, 186, 310–321. [Google Scholar] [CrossRef] [PubMed]
  64. Xu, X.; Zhang, L.; Zhao, W.; Fu, L.; Han, Y.; Wang, K.; Yan, L.; Li, Y.; Zhang, X.; Min, D. Genome-wide analysis of the serine carboxypeptidase-like protein family in Triticum aestivum reveals TaSCPL184-6D is involved in abiotic stress response. BMC Genom. 2021, 22, 350. [Google Scholar] [CrossRef] [PubMed]
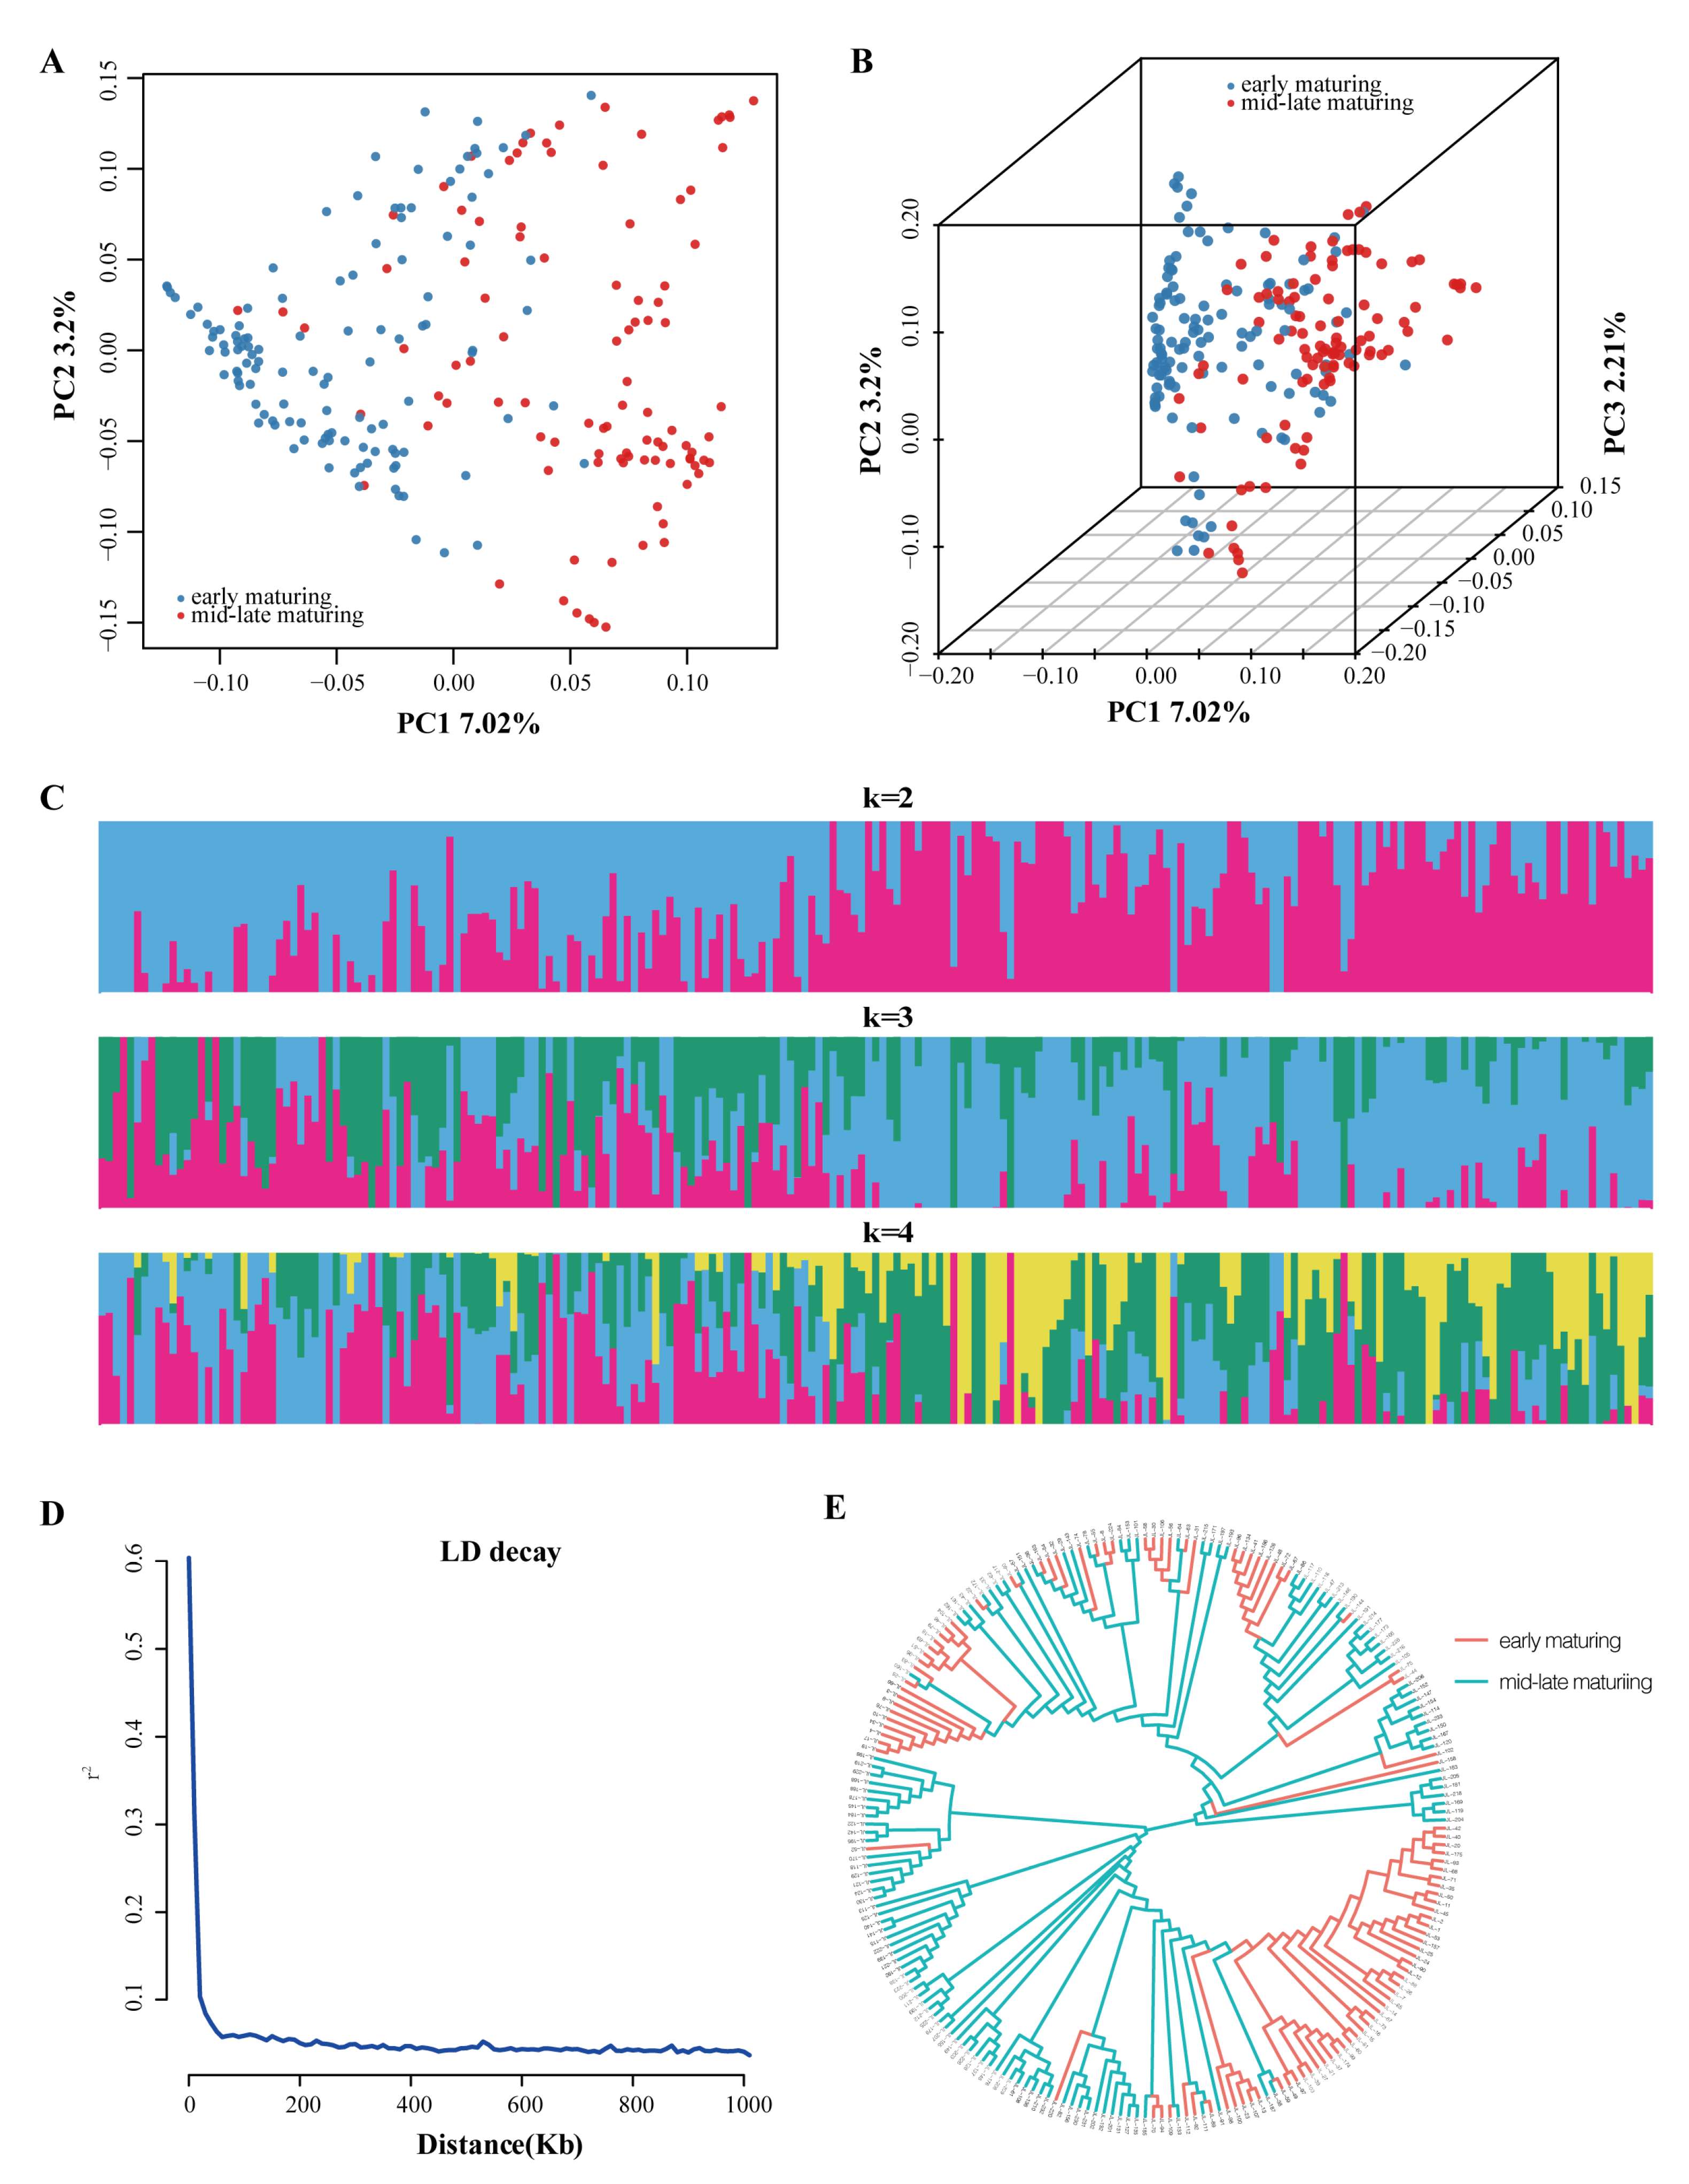
Figure 1. Principal component analysis (PCA), population structure, linkage disequilibrium (LD) decay and neighbor-joining clustering analysis in 220 accessions of loose-curd cauliflower. (A) PCA plot of the loose-curd cauliflower accessions. The dot color scheme is the same as that in PC1, the first principal component, and PC2, the second principal component. (B) Three-dimensional (3D) principal component analysis of 220 accessions. The dot color scheme is the same as that in PC1, PC2 and PC3 (third principal component). (C) Population structure of loose-curd cauliflower accessions with different numbers of clusters (k = 2, 3, and 4). When k = 2, accessions marked with a pink rectangle belong to the mid–late-maturing group; accessions marked with a blue rectangle belong to the early-maturing group. (D) LD decay–distance analysis. (E) Neighbor-joining clustering analysis of 220 loose-curd cauliflower accessions. Colors of branches on the two different groups: early–mid-maturing (orange) and mid–late-maturing (green).
Horticulturae 09 00970 g001
Figure 2. Phenotype, Manhattan and quantile–quantile (QQ) plots of MSH, PC and ELW. (A1) Images of differences in the main stem height; (A2) Histograms of MSH phenotypic data in 2020 and 2021; (A3) Manhattan plots of MSH in 2020. Red arrows indicate a significant signal, the same applies below; (A4) QQ plots of MSH in 2020; (A5) Manhattan plots of MSH in 2021; (A6) QQ plots of MSH in 2021; (B1) Images of the presence of purplish curd (PC-1) and absence of purplish curd (PC-0); (B2) Histograms of PC phenotypic data in 2020 and 2021; (B3) Manhattan plots of PC in 2020; (B4) QQ plots of PC in 2020; (B5) Manhattan plots of PC in 2021; (B6) QQ plots of PC in 2021; (C1) Images of the presence of external leaf wing (ELW-1) and absence of external leaf wing (ELW-0); (C2) Histograms of ELW phenotypic data in 2020 and 2021; (C3) Manhattan plots of ELW in 2020; (C4) QQ plots of PC in 2020; (C5) Manhattan plots of ELW in 2021; (C6) QQ plots of ELW in 2021.
Horticulturae 09 00970 g002
Figure 3. Phenotype, Manhattan and quantile–quantile (QQ) plots, and haplotype analysis of WSC. (A1) Histograms of WSC phenotypic data in 2020; (A2) Manhattan plots of WSC in 2020. Red arrows indicate a significant signal; the same applies below; (A3) QQ plots of WSC in 2020; (B1) Histograms of WSC phenotypic data in 2021; (B2) Manhattan plots of WSC in 2021; (B3) QQ plots of WSC in 2021; (C) Schematic view and haplotype information of the candidate gene BOB01G136670. Filled orange, filled blue and black lines represent CDS, UTR and introns, respectively. (D) Haplotype analysis of BOB01G136670; the blue color represents Hap1. (E,F) Differences in WSC traits among different haplotypes in 2020 and 2021, respectively. Data are presented as means ± SD. Asterisks indicate significant differences according to Student’s t-test. *** p < 0.001.
Horticulturae 09 00970 g003
Figure 4. (A) The expression pattern of BOB01G136670 in different tissues and developmental stages; (B) A neighbor-joining phylogenetic tree (1000 bootstrap replications) of BOB01G136670 and its related proteins.
Horticulturae 09 00970 g004
Disclaimer/Publisher’s Note: The statements, opinions and data contained in all publications are solely those of the individual author(s) and contributor(s) and not of MDPI and/or the editor(s). MDPI and/or the editor(s) disclaim responsibility for any injury to people or property resulting from any ideas, methods, instructions or products referred to in the content.