1. Introduction
The peach (
Prunus persica L. Batsch) belongs to the Rosaceae family and is one of the most common and productive crops of the temperate zone [
1,
2]. China is the center of origin of the peach, and also leads the world in peach production (15.02 million tons of fruit per year, which is more than 60% of total peach production in Europe), followed by Spain, Italy, Turkey, Greece, Iran, USA, Egypt, Chile and India [
3]. In addition to the fruit being used in fresh, canned and dried form, as well as juice, peach trees are also considered as ornamental plants [
4,
5].
In recent years, global warming and land aridification has been one of the main limiting factors in the distribution of agricultural plants [
6]. Drought is a key abiotic stress that limits agricultural development worldwide [
7,
8,
9] and often results in the loss of fruit crops [
10]. Growers certainly save water and irrigation costs in rainy years, but severe and extreme droughts are becoming more frequent, and water stress in peach trees impairs orchard growth and productivity [
11]. A water deficit can induce responses in plants at all levels of organization: cell, metabolism and molecular [
12,
13]. The primary effects of drought in trees are usually the reduction in plant stomatal conductance, water potential, osmotic potential, leaf length, and leaf photosynthesis, leading to a reduction in water losses, but also in plant productivity [
14,
15,
16].
One of the main techniques for counteracting arid climatic conditions is the selection of drought-resistant cultivars [
17]. However, some parameters used for evaluation of the drought tolerance of cultivars are insufficient, and their usage is very laborious. Currently, there are over 3000 cultivars of peach in the world [
18], as well as a huge number of hybrids and varieties. Such diversity of breeding material argues for the acceleration and simplification of the assessment of drought resistance in peach cultivars.
In order to develop new cultivars, it is very important to have effective criteria for selecting hybrid offspring. In the literature, there are a great number of different criteria and indicators for evaluating drought tolerance in fruit plants. Among them, chlorophyll content and the chlorophyll stability index [
19], photosynthetic activity in leaves (maximum and effective quantum yield of PSII, variable fluorescence, non-photochemical quenching) [
20], leaf water regime indicators (LWC—total leaf water content, WSD—water saturation deficit and WL—water loss) [
21,
22,
23,
24], enzymatic activity [
24], morphometric features (leaf length and width, leaf surface area, specific weight and specific area, leaf lamina density) [
25,
26], and anatomical indices (thickness of cuticle, epidermis, palisade and spongy parenchyma, palisade/spongy tissue ratio) [
27,
28,
29] are the most used. This diversity of coefficients and characteristics associated with the drought tolerance of plants certainly allows the most objective estimation of the genotype, but it is rather labor-consuming. A simpler approach for objective plant evaluation, allowing reliable and rapid screening of breeding material and genetic collections, is needed. In this regard, it is necessary to select the most informative criteria of drought tolerance, which take into account the individual characteristics of a particular fruit crop.
The aim of the presented work was to identify the most informative criteria of drought tolerance correlated with water loss during dehydration.
2. Materials and Methods
2.1. Plant Material and Growth Conditions
Perennial plants of the peach cultivars growing in the collection plots of Nikita Botanical Gardens—National Scientific Center (NBG-NSC, Yalta) in the same climatic and soil conditions were used for the studies. The locations of the sampling and experimentation sites are indicated by the GPS coordinates (44°50′66″ N 34°23′71″ E, 20–50 m above sea level). The area has a subtropical climate with dry and hot summers and humid winters, with rainfall mainly concentrated in the autumn and winter seasons. Annual average sunshine is 2285 h, and precipitation is 188 mm between May and September, and 595 mm for the whole year. The absolute maximum temperature is 39.0 °C, and the absolute minimum is −14.6 °C. The average annual temperature is +12.4 °C, and the average annual air humidity is 67%. The soil is brown, slightly calcareous, and heavy loamy on clay shales and limestones [
30].
The experiment was conducted on 12-year-old trees, which were grafted onto almond rootstock, trained as an open vase system, and planted 4 × 4 m apart, with a density of 625 trees per ha−1 and south–west row oriented.
Studies were carried out in 2018–2022 on the leaves of 60 peach cultivars with different genetic and geographic origins. Four contrasting genotypes, ‘Zhisele’, ‘Lyubava’, ‘Ruthenia’, and Prunus mira, one of the parental forms of these cultivars (as control) were selected for detailed investigation.
‘Zhisele’ (Patent No. RU 8557629). The tree is vigorous, sprawling, and 2.5 m high. The leaf is lance-oblong. The length of flowering shoots is 30–70 cm. The flowers are solitary or in nodes, chrysanthemum-shaped, double-flowering, 4.7–5.0 cm in diameter, purple-pink. The petal is large, broadly elliptical, medium corrugated. (
Figure 1).
‘Lyubava’ (Patent No. RU 8260658). The tree is vigorous, 2.5 m high, with a spreading crown. Leaves are medium in length and width. Flowering shoots are 30–70 cm in length. Flowers 5.0–5.2 cm in diameter, purple-pink, applanate and chrysanthemum-shaped, semi-double-flowering, slightly corrugated.
‘Ruthenia’ (Patent No. RU8559114). The tree is medium, sprawling, 2–2.5 m high. The leaf is elongated and medium in size. The flower is rose-shaped, semi-double-flowering, 3.5–4 cm in diameter, purple-pink. Petals are medium in size, broadly elliptical, 15–20 per flower.
Prunus mira Koehne, a
Prunus plant in Rosaceae, is also known as
Amygdalus mira (Koehne) Ricker [
31].
2.2. Water Status Measurements
Leaf water content (LWC) and water saturation deficit (WSD) in leaves were determined by the weight method [
32,
33] using precision scales Pioneer PA4102 (Ohaus, Shanghai, China) and drying cabinet PE-4610 (Ekroshim, Saint Petersburg, Russia). Adult leaves were sampled from the middle tier of the crown, from the middle part of shoots, evenly spaced along the crown. For each variant of the experiment, the average leaf sample was taken from 3 plants of each cultivar.
After the leaves were harvested, an instantaneous measurement was taken to determine the leaf fresh weight (FW). The turgid weight (TW) of the leaves was determined by their immersion in distilled water for 24 h at room temperature (until constant weight was reached) in the dark as described by M.S. Islam et al. [
34]. The leaf samples were dried in an oven at 105 °C to determine the dry weight.
Investigation of the water regime indicators was carried out annually during July and August in the period of maximum drought impact in three biological replicates ((3 plants × 20 leaves) × three times).
The Leaf Water Content was calculated using Formula (1)
The Water Saturation Deficit was calculated using Formula (2)
The Relation Water Content was calculated using Formula (3)
Leaves after 12, 24, and 48 h of dehydration were stained with aqueous Evans Blue solution (0.25%
m/v) during 24 h. Dye residue was removed by pure water and leaves were placed into a solution of anhydrous ethanol: glycerin (4:1) and boiled until its color turned white. Leaf damage area was determined with ImageJ 1.53 software [
23,
35,
36,
37]. The leaves were scanned by the printer Canon i-sensys MF734Cdw (Canon, Tokyo, Japan) at 200 dpi in grayscale mode and saved as a bmp file. The image area in pixels was converted to the image area in square centimeters using the formula: Ssm
2 = (Spix/40,000) × 6.45, where Ssm
2 is the leaf area in cm
2, and Spix is the leaf area in pixels.
Leaf damage area calculated as the ratio of damage to the total leaf blade area in percentages.
2.3. Chlorophyll Content Determination
Pigments were quantified according to B.B. Zhang et al. [
38]. Briefly, leaves (2 g) were homogenized and extracted with 10 mL of 95% ethanol at 25 °C overnight.
Chlorophyll
a and
b content in the supernatant was quantified with a spectrophotometer KFK-3KM (Technocom, Saint Petersburg, Russia) at wavelengths of 665 nm and 649 nm. Pigment content was calculated by the following Formulas (4)–(6):
Assays were carried out annually during July and August in the period of maximum drought impact in three biological replicates (3 plants × 5 leaves) on duplicate samples.
The blank control was 95% (
v/
v) ethanol [
39]. The contents for both Chl
a and Chl
b were expressed as mg per g of dry matter.
Chlorophyll stability index (CSI) was calculated by Formula (7):
2.4. Morphological and Anatomical Investigation
Morphometric measurements (length, width, leaf area) were made with Java-based image processing program—ImageJ according to S. Cosmulescu et al. [
40]. Calculated indicators were determined as following Formulas (8)–(10) [
41]:
To analyze stomata distribution, density, and size, leaf laminas from the adaxial and abaxial sides were varnished with a thin layer of nail polish. After complete drying, leaf surface prints were removed using forceps, mounted in water on the slides [
42,
43,
44], and observed with AxioScope 1 (Zeiss, Jena, Germany) (20 samples × 5 microscope’s field for each cultivar). The investigation was carried out at microscope magnification 200× with a coverage area of 0.24 mm
2, and the stomata number per one mm
2 was calculated. Stomata pore length (µm) was determined with Zeiss Axio Vision software v. 4.8.
The anatomical structure of the leaf blades was examined on fixed material. Leaves were separated from shoots and their dying cuttings were fixed in a solution of formalin, ethanol, acetic acid, and water (1:5:0.5:3.5), dehydrated in graded alcohol series (30%, 50%, 70%, 80%, 90%, 96%, 100%) and propylene oxide, embedded in Epon-Araldite epoxy resin mixture. Semi-thin sections (1–2 µm) were made with Ultracut E ultramicrotome (Reichert, Vienna, Austria), stained with methylene blue solution.
The obtained samples were examined using an AxioScope 1 (Zeiss, Jena, Germany) equipped with an Axiocam 105 color digital camera (Zeiss, Göttingen, Germany) and Zeiss Axio Vision software v. 4.8. For each investigated parameter (abaxial and adaxial cuticle thickness, epidermis thickness, palisade and spongy mesophyll thickness, etc.), 100 measurements were made.
2.5. Chlorophyll Fluorescence Measurment
Chlorophyll fluorescence measurements were made with a MINI-PAM II photosynthesis yield analyzer (HeinzWalz, Effeltrich, Germany).
Leaves were adapted to darkness for 30 min before measuring the fluorescence values. The following values were recorded during the experiments:
—zero, background level of fluorescence;
—maximum fluorescence;
—steady-state level of fluorescence indicating the establishment of stable and most intense photosynthesis;
and
—minimum and maximum levels of fluorescence in the light. In this work, the following Formulas (10)–(16) were used: variable fluorescence
, maximal photochemical quantum yield of PS II
, photosynthetic activity
, as well as fluorescence decrease ratio (vitality index)—
. The effective photochemical quantum yield of PS II was calculated using the formula:
. The quantum yield of regulated non-photochemical light energy dissipation in PS II was calculated by the formula:
, and the quantum yield of unregulated non-photochemical light energy dissipation in PS II was calculated as—
[
45,
46,
47].
Studies were carried out under field conditions as well as after artificial watering of leaf tissues (control) and after 12, 24, and 48 h of artificial dehydration.
Parameters of the chlorophyll fluorescence induction curves (Kautsky effect) were investigated in 2020–2022 during July and August in the period of maximum drought impact in three biological replicates ((three plants × five leaves) × three times).
2.6. Statistical Analyses
A statistical analysis (mean, LSD at
p ≤ 0.05, etc.) was performed using Statistica 6.0 and Microsoft Excel 2019 software. Before the statistical analysis, the normality of data distribution was checked using Shapiro–Wilk and Kolmogorov–Smirnov tests. Data visualization was made using Past software v. 4.03 [
48] as well as Matplotlib and Scikit-learn (comprehensive libraries for creating static, animated and interactive visualizations in Python).
4. Discussion
The similarity of physiological, biochemical, and molecular genetic processes occurring in plants during drought conditions makes it possible to use uniform methods for determining the drought resistance for different species, varieties, and cultivars [
79,
80,
81]. Despite this, there are also specific differences (e.g., for cultivars) due to morphological and anatomical traits, and the patterns of biochemical and other processes in cells of different cultures [
22]. Most plants have developed morphological and physiological mechanisms that allow them to adapt and survive under conditions of hydrothermal stress [
81,
82,
83]. These mechanisms mainly include leaf decreasing and rolling [
84,
85,
86,
87,
88,
89,
90], dense pubescence [
91,
92,
93], a thick cuticle and epicuticular waxy layer [
93,
94,
95], deep development of stomata (e.g., in chambers-crypts), accumulation of mucus and other secondary metabolites in the mesophyll [
94,
95,
96], an increase in mesophyll compactness, etc. [
81,
96,
97,
98].
Differences in resistance mechanisms to dehydration cause variable informativeness of the criteria for assessing drought resistance. For example, plants form resistance in several ways through: (1) morphological changes [
99]; (2) the stomatal apparatus functioning [
100,
101,
102]; (3) accumulation of protective compounds (sugars, phenols, heat shock proteins, abscisic acid, etc.) [
21,
23,
103,
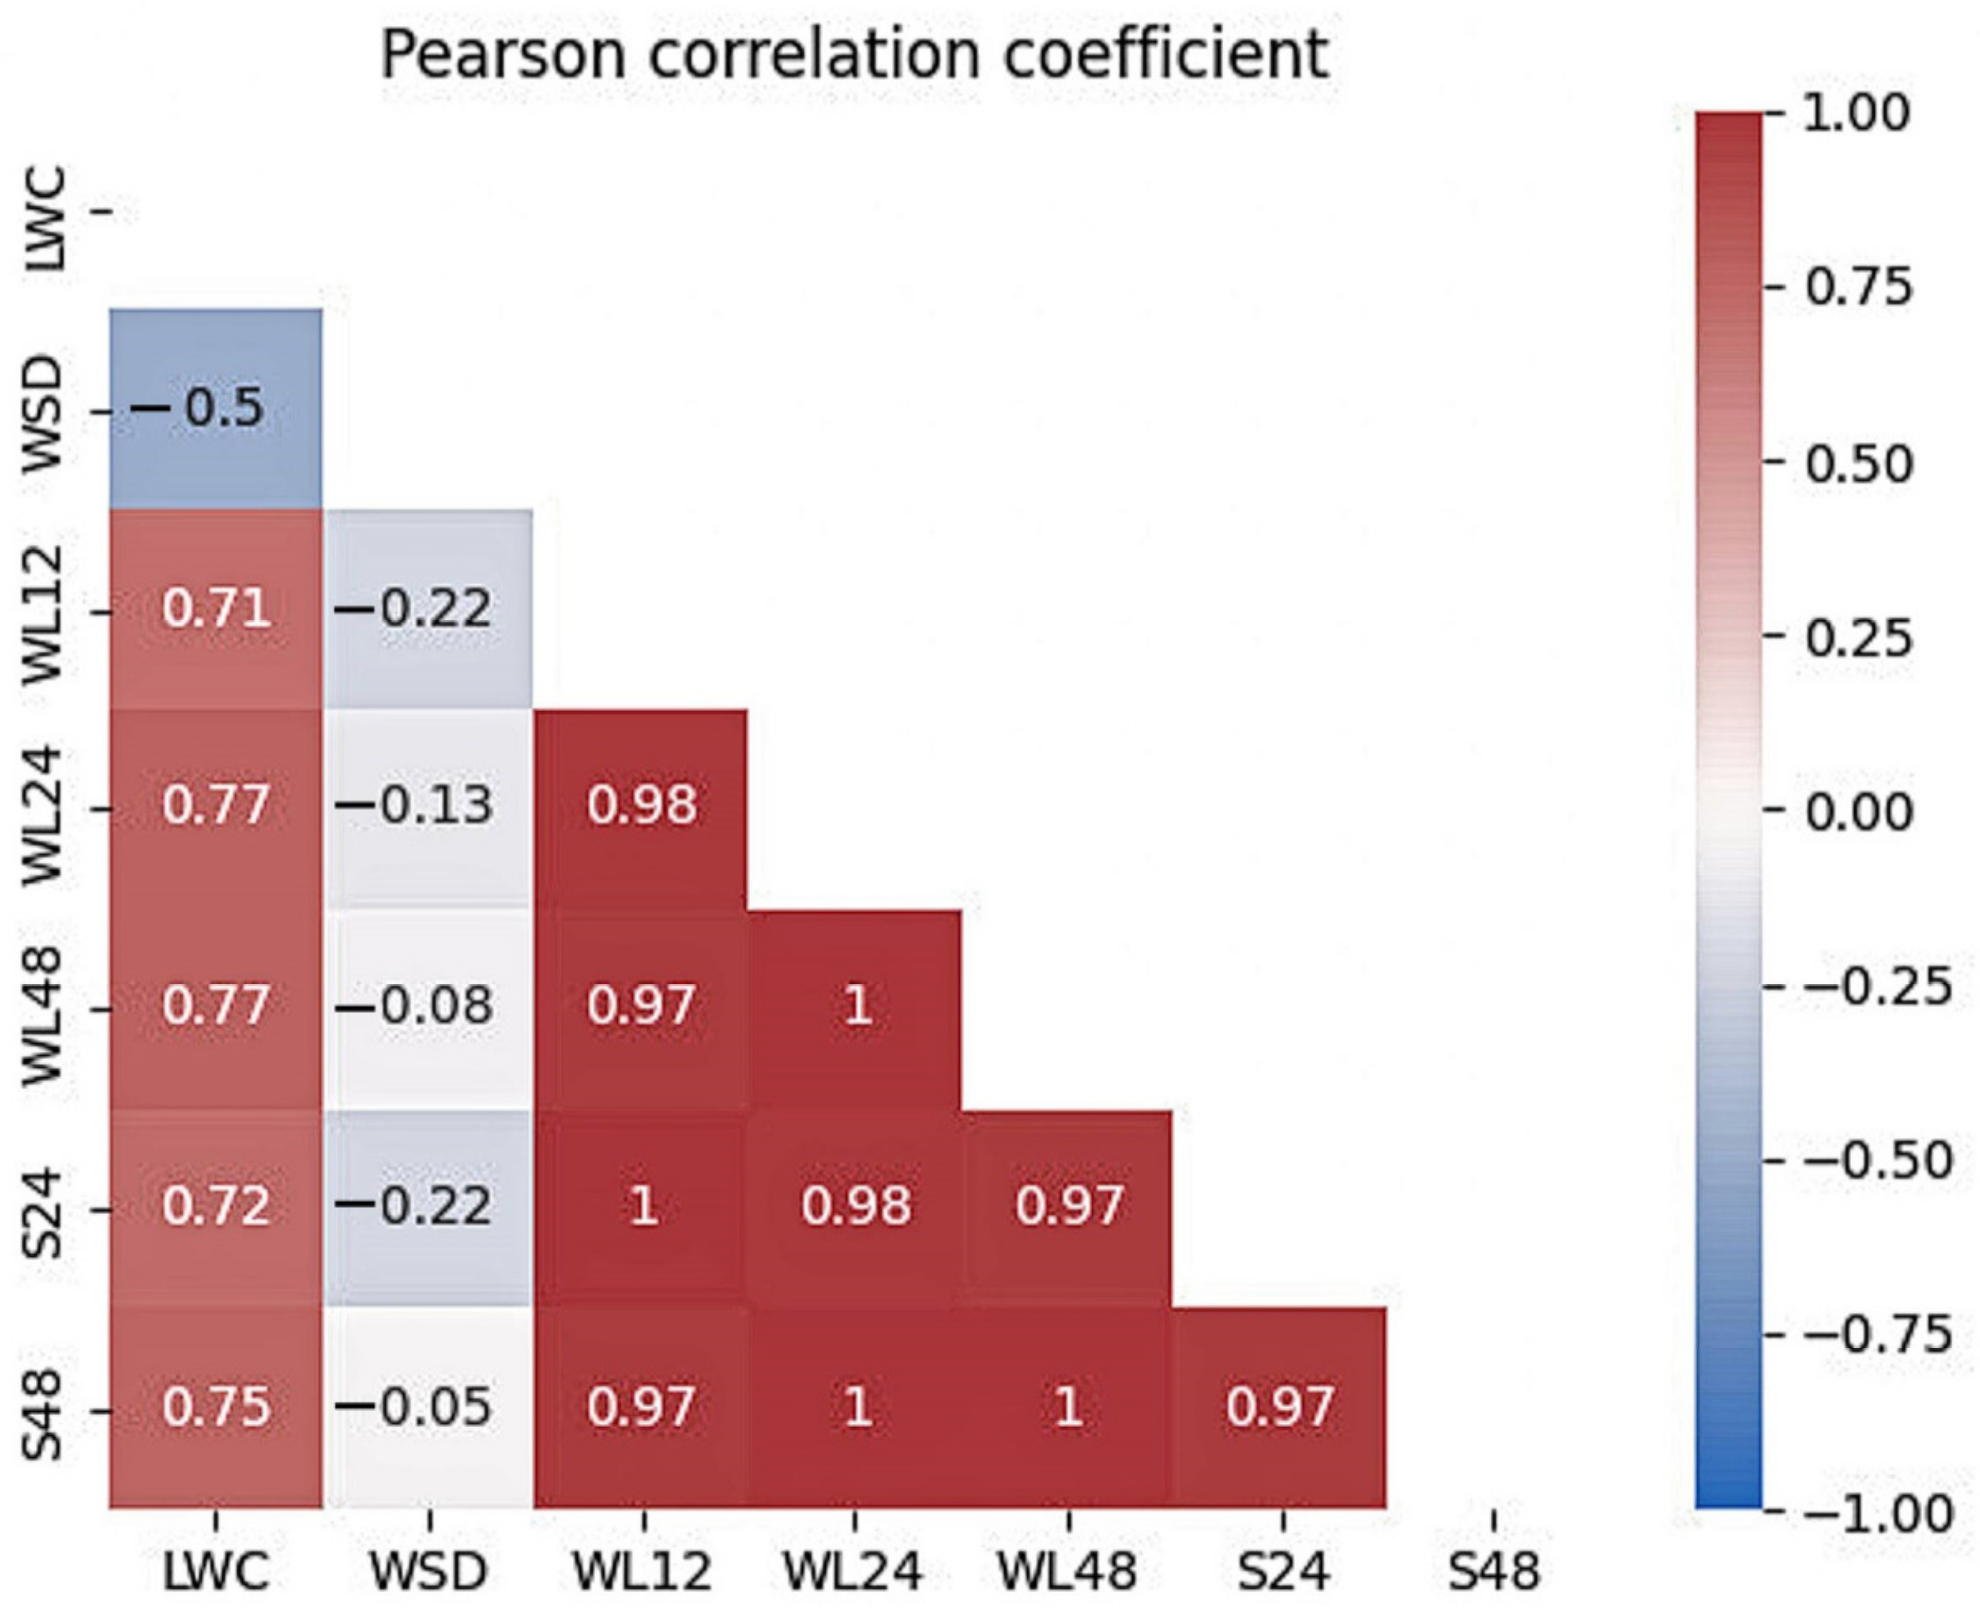
104]. Therefore, the informativity of various criteria associated with drought resistance will differ. So, an attempt to analyze the significance of various indicators associated with drought resistance for peach cultivars was made. One of the main methods for assessing the drought resistance of various peach genotypes is based on the water regime (leaf water content, water deficit, water loss, and ability to restore turgor) [
50,
105,
106]. This method allows mass analysis for hybrids and cultivars. The most important indicators of the water regime are water loss over certain periods and the rate of lethal dehydration. The decrease in leaf water content under drought in peach is indicated by Rieger et al. [
99], Haider et al. [
22], Wang et al. [
107], and Hajlaoui et al. [
108]. Zhang et al. [
23] demonstrated a decrease in relative moisture content (24%) in peach seedling leaves under a drought. Also, peach cultivation without irrigation for 70 days showed a significant decrease in the average pre-dawn leaf water potential from −0.34 to −3.30 MPa [
109]. In our studies, among peach cultivars with contrasting drought resistance (based on the amount of water loss and the area of damaged leaf surface after dehydration), no significant differences in leaf hydration and water deficit were found. According to the obtained results, these indicators are not very informative under conditions of minor stress. Ex situ gene pool collections of the Nikitsky Botanical Gardens are kept under standard agricultural practices, and the differences in LWC and WSD between drought-resistant and drought-susceptible cultivars were minimal. Similar results were also obtained for other peach cultivars and hybrids [
110], as well as apricot plants [
106]. As noted by Sofo et al. [
109], Mellisho et al. [
111], M. Rahmati [
105], and Hajlaoui et al. [
108], LWC and WSD well differentiate cultivars and hybrids of the genus Prunus under severe drought or in model experiments with a high degree of tissue dehydration.
A higher relation with drought resistance was found in the water loss (WL), which correlated (r = 0.97–1.00) with the leaf-area damage after dehydration (S24 and S48). The criterion’s effectiveness is confirmed by other numerous studies on peach and other plants of the genus Prunus [
110,
112,
113,
114]. The assessment of water regime indicators is fast and quite objective but, however, not always suitable given the destructive nature of this method. Due to the assessment of controlled water loss, ‘Rutenia’ and ‘Zhiselle’ cultivars were distinguished, and the high informativeness of dehydration after 12 h under controlled conditions was shown.
An alternative and frequently used method for studying drought resistance is based on the photosynthetic pigment’s content and the chlorophyll stability index. This method can be both destructive (by obtaining extracts based on various solvents: ethanol, acetone, etc.) and non-destructive using special portable devices. As mentioned by A.I. Lischuk, the gradual increase in water deficit enhances the accumulation of pigments, and this is one of the indicators of chlorophyll resistance to destruction. The prolonged effect of water deficiency causes a decrease in the pigment content of fruit crops [
115].
The response of the plastids to drought depends on plant- and cultivar-specific characteristics [
115]. The authors note that an important criterion for assessing plants for drought resistance is the stability of chlorophyll and the rate of its degradation during dehydration. A decrease in chlorophyll content during drought has been reported in many species depending on its duration and severity [
116,
117,
118,
119]. As noted by Bhusal et al. and Jiménez et al., physiological performance specific to Pn and Gs reduces due to a reduction in chlorophyll content because a reduction in Chl leads to a decrease in photosynthetic activity [
119,
120]. It has been shown that moderate drought could inhibit the accumulation of photosynthetic pigments by 16–30% in representatives of the genus Prunus [
22,
23], and severe stress decreased the content of chlorophylls up to 40% compared to the control [
22]. In our studies the highest chlorophyll content was observed in
P. mira, which also had the highest water loss and leaf damage area during dehydration. We noted the absence of significant differences between the studied peach genotypes in the rate of chlorophyll degradation. The dynamic of changes in the chlorophyll stability index (CSI) after 48 h of dehydration in the studied genotypes was approximately at the same level in drought-resistant and susceptible cultivars (CSI ranged from 71.3% in the ‘Rutenia’ cultivar to 78.7% in the ‘Lyubava’ cultivar). Therefore, this calls into question the informativeness of this criterion.
Investigation of the functional state of the photosynthetic apparatus under different stress factors is often used [
118,
121]. As noted by J. Flexas, G. Percival, C. N. Sheriffs, and S. Jiménez, photosynthesis is affected by various stress factors, including drought [
120,
122,
123,
124,
125]. Modelling of drought and excessive-moisture stress in apple plants showed a tendency for leaf water potential, sap production and photosynthetic traits to decrease; however, hydraulic traits recovered earlier than photosynthetic traits under both stress conditions [
119,
126]. Water stress reduces the gene expression associated with the photosystem I reaction center subunit (psaK) and photosystem II core complex protein (psbY) [
22]. Y. Guo [
127] showed that the maximum fluorescence, the maximum quantum yield of PSII, and photochemical quenching decreased after 21 d of drought in
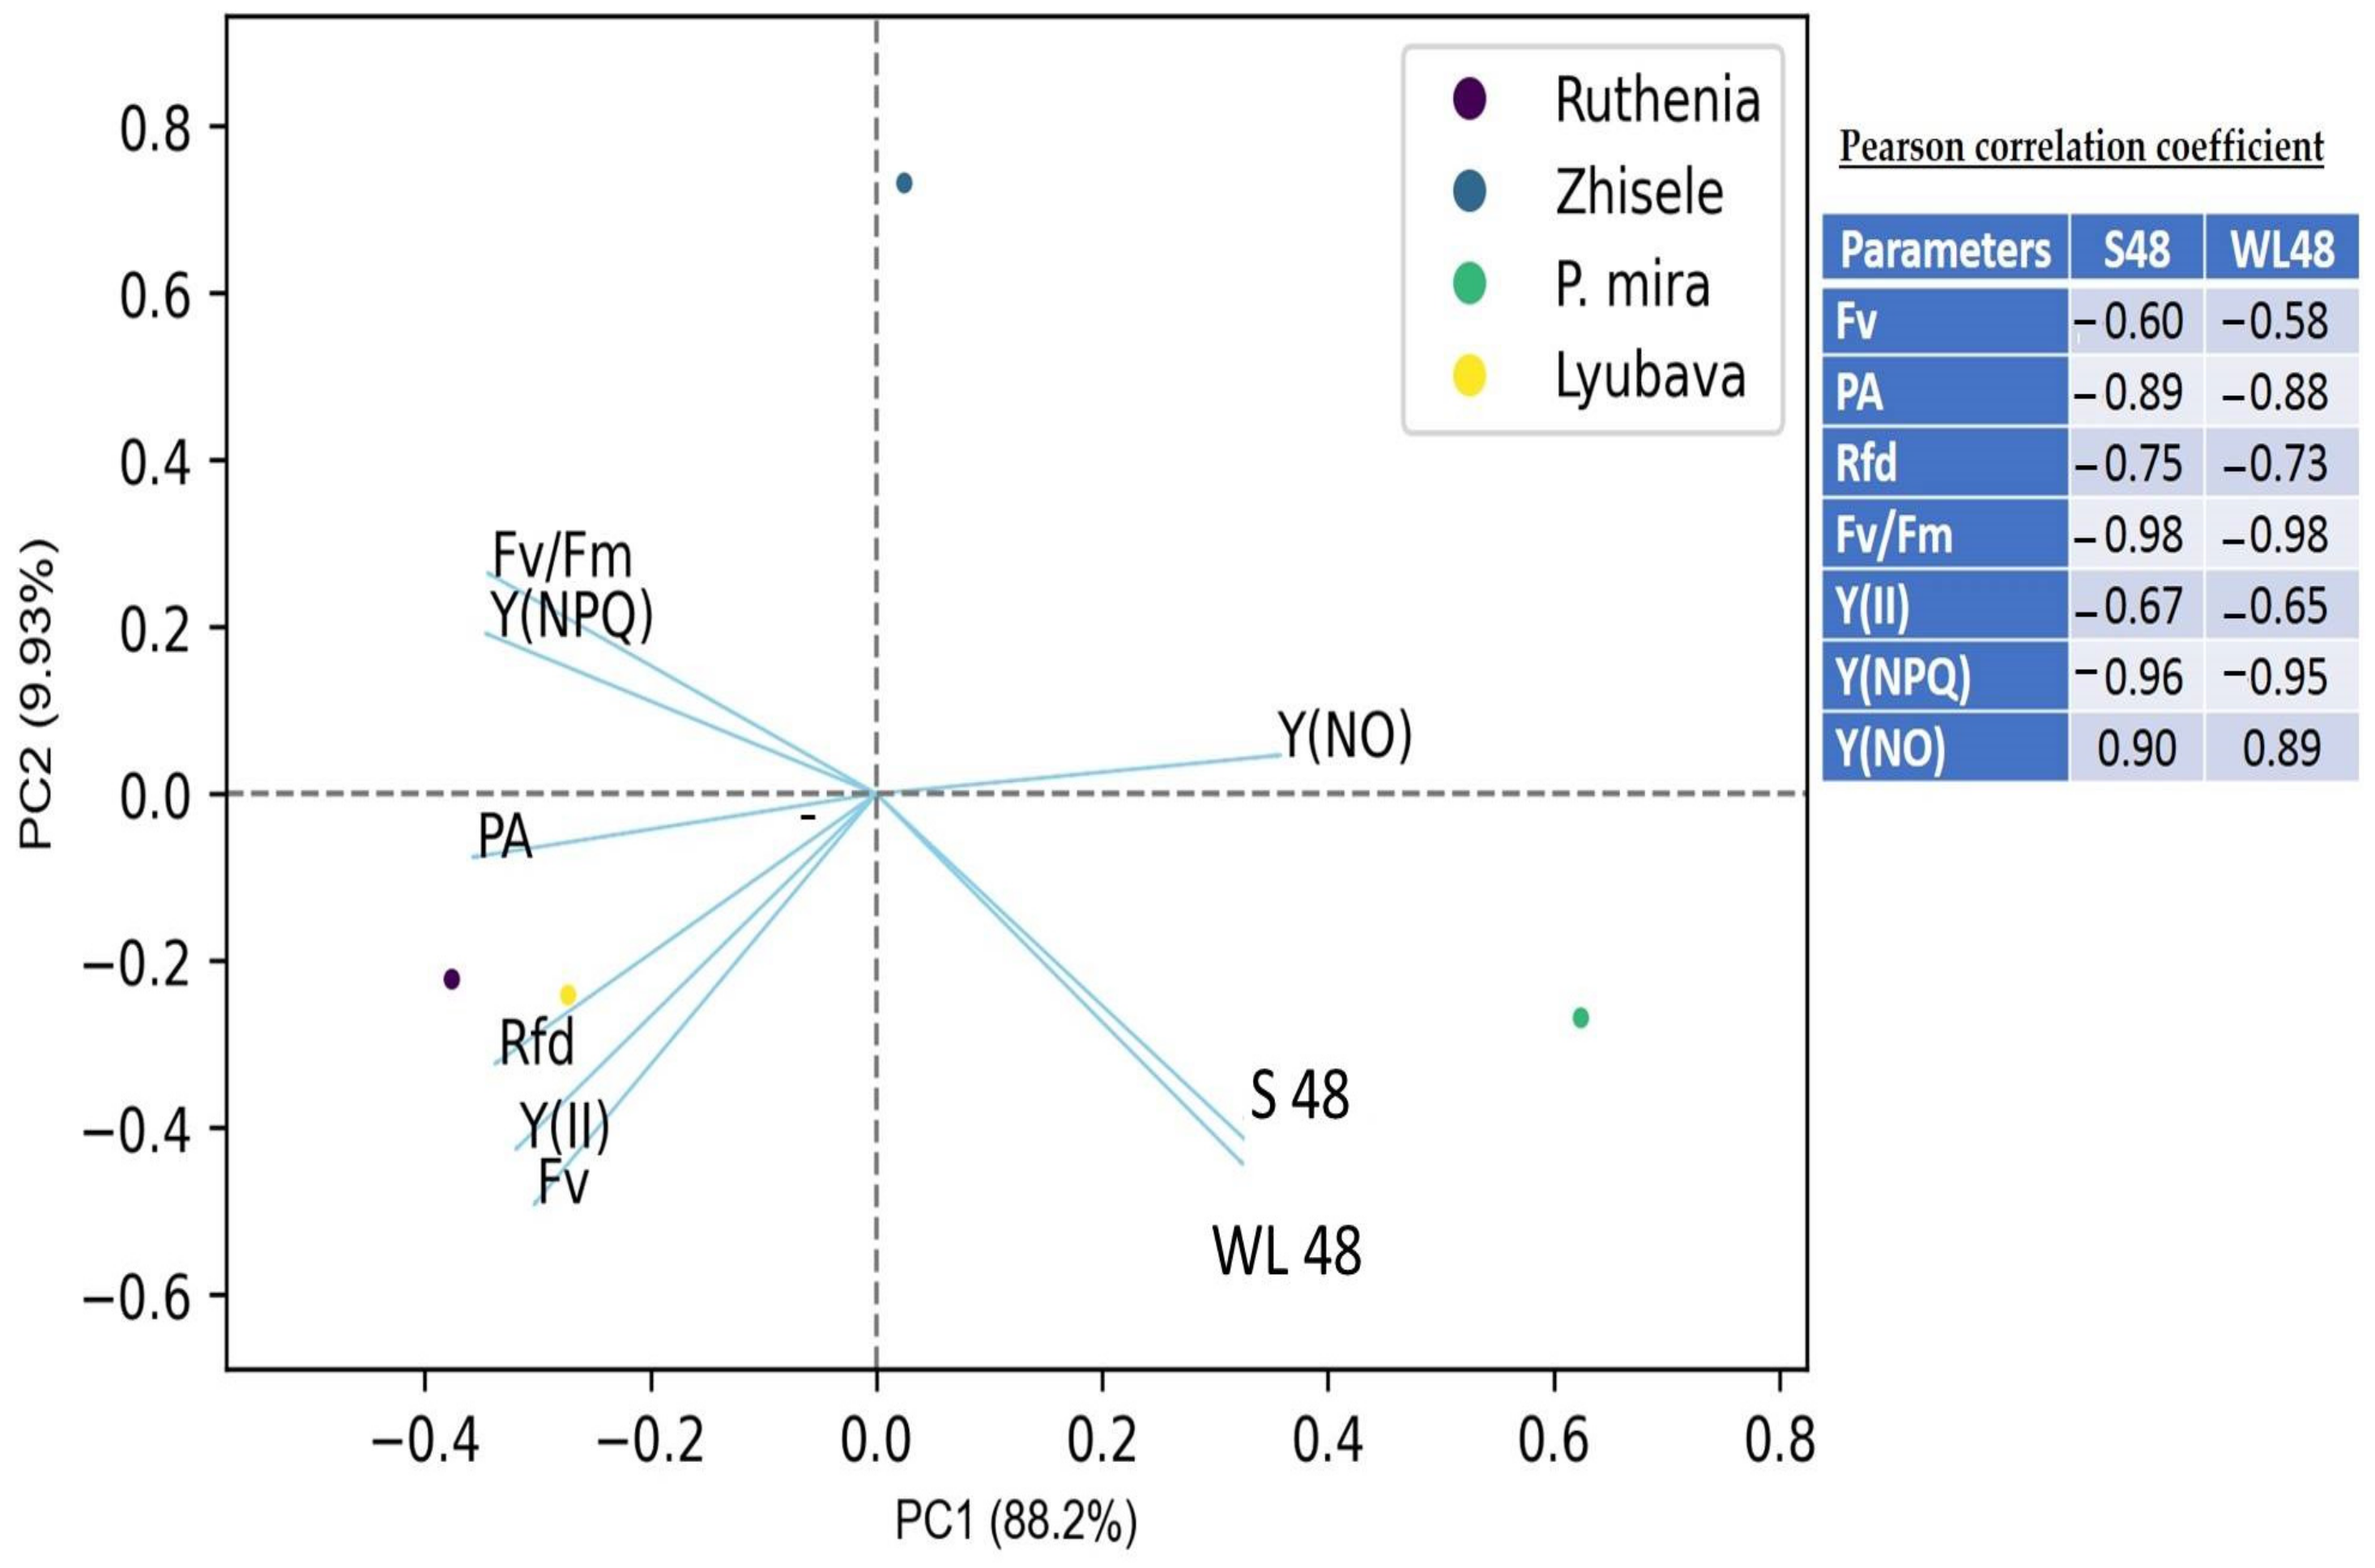
Prunus mongolica, which indicates the effect of drought on the openness of PSII reaction centers. In our studies, the most informative indicator that has a negative correlation with water loss was Fv/Fm and Y(II)—the maximum and effective photochemical quantum yield of PSII. A high negative correlation with water loss was also shown by regulated quantum losses—Y(NPQ). It is assumed that Y(II), Y(NPQ), and Fv/Fm are the most informative among the parameters of chlorophyll fluorescence induction during the selection of peach cultivars for drought tolerance. Our results confirm the data of fruit plants of the Rosaceae family obtained by pulse-amplitude modulation (PAM) [
100,
119,
127,
128].
Researchers point to the relationship between the morphological and anatomical parameters of leaves and the trait formation of drought resistance [
81]. Thus, Bhusal et al. [
16] showed a significant decrease in the size of leaves of
Prunus sargentii Rehder and
Larix kaempferi (Lamb.) Carrière under drought conditions. In addition,
Maclura pomifera [
88],
Oryza sativa [
89],
Triticum aestivum [
85],
Lens culinaris [
87], and
Dracocephalum moldavica [
86] were characterized by an obvious decrease in leaf area under drought stress. Severe drought can disrupt phloem transport enough to jeopardize tree survival, and drought-tolerant genotypes are capable of altering their phloem anatomy to reduce the size of sieve elements [
13]. In turn, studies of physiological and morphological parameters of gymnosperms under prolonged over-irrigation [
129] showed an increase in aboveground and belowground biomass in drought-sensitive plants. This was due to an increase in leaf size, leaf mass per area (LMA), maximum photosynthetic rate, and leaf water potential. Our studies are in agreement with the data obtained by other authors concerning the manifestation of xeromorphic features in the leaf structure of drought-resistant genotypes, stability in the work of their photosynthetic apparatus under stress, and the ability to slow down growth processes in response to drought.
Among the morphometric indicators of drought resistance, the leaf area and the dry and fresh weight of the leaf also showed the greatest negative relationship with water loss. A significant effect of the leaf specific weight, specific area, and density on the water loss of the studied peach genotypes was not confirmed. Thick epidermis and palisade parenchyma can increase resistance to water stress and promote growth under these conditions by improving the water balance and protecting leaf tissues [
130]. K. Zhu and I. Oliveira indicate an increase in the thickness of the leaf blade and the thickness of the cuticle in drought-resistant peach plants [
79,
94]. Among the anatomical indicators of drought resistance in the studied peach genotypes, the size of the stomatal pore showed a high positive relationship with water loss. Our data showed that plants with high drought tolerance have a high stomatal density, a thick layer of adaxial and abaxial epidermis, and a thick adaxial cuticle. This is consistent with the works of V. Brailko [
131], X. Yang, [
81], and A. Adiba [
42]. At the same time, the thickness of the leaf blade, as well as the thickness of the palisade and spongy parenchyma, the palisade coefficient, do not significantly affect the rate of water loss during artificial leaf dehydration.
It has been shown that the use of the most informative indicators makes it possible to estimate peach plants for drought resistance in a short period and is less laborious.


