Next Article in Journal
Vermicompost Improves Tomato Yield and Quality by Promoting Carbohydrate Transport to Fruit under Salt Stress
Previous Article in Journal
Role of Humic Acid on Inducing Salt Tolerance of Ivy Geranium (Pelargonium peltatum L.) Plants
 
 
Correction published on 21 November 2023, see Horticulturae 2023, 9(12), 1250.
Article

The Genome-Wide Identification of Stable Internal Reference Genes Related to Delayed Spoilage for Accurate qRT-PCR Normalization in Ethephon-Treated Pueraria thomsonii Benth.

1
Guangdong Province Key Laboratory of Utilization and Conservation of Food and Medicinal Resources in Northerrn Region, Shaoguan University, Shaoguan 512005, China
2
College of Biology and Agriculture, Shaoguan University, Shaoguan 512005, China
3
College of Agriculture, Henan Agricultural University, Zhengzhou 450046, China
4
State Key Laboratory for Conservation and Utilization of Subtropical Agro-Bioresources, South China Agricultural University, Guangzhou 510642, China
*
Authors to whom correspondence should be addressed.
These authors contributed equally to this work.
Horticulturae 2023, 9(9), 1014; https://doi.org/10.3390/horticulturae9091014
Submission received: 16 August 2023 / Revised: 3 September 2023 / Accepted: 6 September 2023 / Published: 8 September 2023 / Corrected: 21 November 2023
(This article belongs to the Section Genetics, Genomics, Breeding, and Biotechnology (G2B2))

Abstract

:
Pueraria thomsonii Benth. is a perennial leguminous vine with medicinal and nutritional value. However, rapid postharvest physiological deterioration (PPD) reduces its quality and market value. To detect gene expression levels, the quantitative reverse transcription polymerase chain reaction (qRT-PCR) technique requires stable internal reference genes (IRGs). Our findings indicated that an ethephon (C2H6ClO3P) treatment delayed PPD in P. thomsonii tuberous roots and an RNA-seq analysis revealed a significant number of differentially expressed genes (DEGs). To find stable IRGs for the further identification of the genes associated with delayed PPD in P. thomsonii, eight candidate IRGs of the tuberous roots were screened and assessed using qRT-PCR. The expression stability of these genes was determined and ranked using five different algorithms, including NormFinder, BestKeeper, ΔCt, GeNorm, and ReFinder. Consequently, we identified two genes, PtUBC10 and PtACT7, as the best candidate IRGs for qRT-PCR normalization in P. thomsonii, both exposed to ethephon treatment and in different tissues. Moreover, PtUBC10 was found to be the most stably expressed IRG of P. thomsonii during the ethephon treatment. The findings of this investigation furnish significant insights for future gene expression analyses concerning the delay of PPD via ethephon administration, which could also be used in other tuberous plants.

1. Introduction

Pueraria thomsonii Benth. is a perennial leguminous vine that has been recognized for its nutritional and health-promoting properties. Historically, it has been used both as a herbal remedy and food source, earning it the moniker ‘Southern ginseng’ [1]. The P. thomsonii cultivar Volcano, grown in Shaoguan City, is known for its high starch content and favorable taste and quality. It is commonly used as a soup ingredient and can also be processed into various products such as Pueraria powder, noodles, and tea. In addition, P. thomsonii contained in Puerarin is a flavonoid compound that has been shown to protect the cardio-cerebrovascular system [2,3], reduce blood sugar [4], increase antioxidants [5], provide liver protection [6], fight cancer [7,8], and serve as a neuroprotective agent [9,10]. Puerarin contributes to the high nutritional and health-promoting value of P. thomsonii. As a national product of geographical indication, P. thomsonii has significant potential for further development [11,12]. Additionally, the P. thomsonii cultivar Volcano exhibits resistance to cold, drought, and barren conditions, making its cultivation in keeping with green energy practices. As such, it has significant potential for supporting green agriculture development.
In recent years, the demand for the P. thomsonii cultivar Volcano has increased, leading to a rise in its price and an expansion of its cultivation area and yield. However, due to the particularity of its growth cycle and factors such as land use efficiency, P. thomsonii tuberous roots can only be supplied seasonally for a short period, failing to meet market demand [13]. After harvesting, the original tissue of the tuberous roots is destroyed and brown spots appear around the vascular bundle within 2–3 days, rapidly intensifying and leading to postharvest physiological deterioration (PPD), characterized by rotting and mold [14,15]. This limits its storage, processing, transportation, and comprehensive utilization, causing the P. thomsonii industry to face challenges such as difficulties in comprehensive postharvest utilization and a short supply period that cannot meet its large-scale market demand [16]. These challenges severely restrict the sustainable development of the P. thomsonii industry. Currently, P. thomsonii is primarily stored using methods such as ordinary storage, refrigeration, wrapping, and buried storage [17,18]. However, these methods are associated with challenges such as high loss rates, high economic costs, and complex operations [19]. Additionally, enzymatic browning can occur after cutting or damage during the storage process, which can significantly impact its quality and shelf life. Therefore, there is an urgent need to develop feasible and effective postharvest storage and preservation technologies for P. thomsonii.
Ethylene (2-Chloroethylphosphonic acid) is an important endogenous hormone in plants that plays a crucial role in regulating various physiological metabolisms. It is involved in plant growth and development, as well as responses to abiotic stress [20]. Additionally, it has significant functions in the physiological activities and nutritional quality of fruits and vegetables during postharvest storage [21,22]. Our previous research found that treatment with ethephon (C2H6ClO3P), a plant growth regulator, can delay the PPD of P. thomsonii and identified differentially expressed genes (DEGs) through a transcriptome data analysis. However, these results require further validation using quantitative reverse transcription polymerase chain reaction (qRT-PCR), a technique with a high accuracy, sensitivity, throughput, and ease of operation. qRT-PCR can be performed using either absolute or relative quantitative methods [23]. Absolute quantification is based on the copy number of a known template to establish a standard curve and is used to determine the absolute expression of a target gene in a sample. This method is commonly used to explore the essential attributes of a single sample. In contrast, relative quantification compares the expressions of the same gene between different samples [24,25].
In relative quantification experiments, genes that are stably expressed between different samples can be used as internal references to facilitate an accurate quantification of target genes and reduce sample variability. Commonly used internal reference genes (IRGs) in plants include Actin, GAPDH, EF-1α, and β-tubulin. However, the expression patterns of these IRGs can vary between species, tissues, and samples, due to these being subjected to different treatments. For instance, in Nitraria sibirica, ACT7 combined with R3H, GAPDH, TUB, or His were the most stable reference genes in its salt- or alkali-treated leaves, salt-treated roots, and drought-treated roots, respectively [26]. Under cold and drought stress, eIF-5α gene expression was the most stable under salt stress treatment, whereas UBQ expression was the most stable in mature leaves, stems, and roots [27]. In different tissue sites of Panax vietnamensis var. fuscidiscus, ACT1 and aTUB exhibited the greatest expression stability [28]. Therefore, the selection of stable IRGs based on specific species and experimental conditions is crucial for ensuring the accuracy of qRT-PCR results. In this study, we selected eight IRGs and used GeNorm, NormFinder, BestKeeper, and RefFinder to analyze their expressions in P. thomsonii under different concentrations of ethephon and water treatments. The most stable IRGs under these treatments were then used to evaluate the expression patterns of the genes involved in delaying the PPD of P. thomsonii under ethephon treatment.

2. Materials and Methods

2.1. Plant Material and Treatment

Ten-month-old tuberous roots of the P. thomsonii cultivar Volcano were grown and harvested from Datang Town, Shaoguan City. These specimens were procured from the Engineering Technology Development Center of Southern medicinal plants. The tuberous roots were cut into 0.005 m thick slices that were subsequently transferred into Petri dishes lined with wet filter paper [29]. To investigate the role of ethephon in PPD, the root slices were incubated in water (control) or different concentrations of ethephon (1% and 3% by mass). All the slices of each treatment were placed in a 2 L volume of each treatment solution for 2 h. Subsequently, the root slices were removed from the solutions, placed in Petri dishes with small holes, and covered with plastic wrap, then incubated at 28 °C and 60% relative humidity in darkness. In the meantime, the post-experiment ethylene solutions were sent to a local waste liquid disposal institution for appropriate treatment. After incubation for 0 h, 6 h, 12 h, 24 h, 48 h, and 72 h, the slices were frozen in liquid nitrogen for total RNA extraction or a physiological analysis. This experiment was conducted using three replicates per sampling time, with each replicate consisting of a single slice from one tuberous root for each treatment and time point.

2.2. Assessment of PPD in P. thomsonii Tuberous Roots

The tuberous roots were harvested and stored in a growth chamber at 28 °C and 60% relative humidity in the dark. After incubation for 0, 1, 2, and 4 days, the roots were collected and their deterioration rate was evaluated according to their degree of browning and starch concentration analyses. The roots were photographed under standard illumination settings and then cut into approximately 0.1 g pieces. These pieces were ground and homogenized in 10 mL of distilled water. The homogenate was centrifuged at 6000× g for 20 min at room temperature, and the supernatant was collected to measure the degree of browning and starch content. The browning index was measured using spectrophotometry with A410 nm × 10. The starch concentrations were determined using an Amylum content assay kit (D799325, Sangon Biotech, Shanghai, China), following the manufacturer’s instructions. Three biological replicates were collected for each sample.

2.3. Determination of MDA, H2O2 Content, and Antioxidant Enzyme Activities

A spectrophotometric analysis was performed to measure the activities of POD and SOD, as well as the contents of MDA and H2O2. Approximately 0.1 g of root slices was ground and homogenized in 1 mL of extraction buffer with 0.05 M phosphate buffer (pH 7.8). The homogenate was centrifuged at 8000× g for 10 min at 4 °C, then the supernatant was collected and used for the analysis of the MDA and H2O2 contents and enzyme activities. The total amounts of MDA and H2O2 were detected using MDA and H2O2 content assay kits (D799761 and D799773, Sangon Biotech, Shanghai, China), according to the manufacturer’s instructions. Similarly, the total activities of POD and SOD were measured using POD and SOD activity assay kits (D799592 and D799593, Sangon Biotech, Shanghai city, China), following the manufacturer’s instructions. Three replicates were collected at each sampling point (0, 6, 12, 24, 48, and 72 h), and each replicate consisted of three root slices.

2.4. Total RNA Isolation and First-Strand cDNA Synthesis

Each sample plant used was ground into a fine powder with a mortar and pestle in liquid nitrogen, and 100 mg of the material was used for RNA isolation. The total RNA was extracted using TRNzol Universal Reagent (DP424, TIANGEN, Beijing, China), according to the manufacturer’s instructions. To remove genomic DNA contamination, isolated RNA was eliminated using RNase-free DNaseI (RT411, TIANGEN, Beijing, China). The purity and concentration of the RNA samples were determined using a micro-volume UV spectrophotometer (Nano-600, JIAPENG, Shanghai, China), and their integrity was assessed via agarose gel electrophoresis. RNA samples with a 260/280 ratio between 1.8 and 2.1 were selected for reverse transcription. A first-strand cDNA synthesis using the All-in-One First-Strand Synthesis MasterMix (F0202, LABLEAD, Beijing, China) was performed according to the manufacturer’s instructions in a total volume of 20 μL containing 1 μg of total RNA. RNA extraction and cDNA synthesis on all the samples were performed for three biological replicates.

2.5. Transcriptomic Analysis

The sequencing procedures were completed by BGI Tech Co., Ltd. (Shenzhen, China), including RNA extraction, library construction, and sequencing. Illumina HiseqTM 2500/MiseqTM (Illumina, San Diego, CA, USA) was used as the sequencing platform. Adapter sequences and low-quality sequences produced during the sequencing were removed using the FASTX toolkit and FastQC program. Tophat v.2.0.10 was used to map the clean reads to the P. thomsonii genome [30]. Transcriptome data were assembled using Cufflinks [31]. The expression levels were calculated and normalized as FPKM. DEGs were identified with DEGseq [32]. Each sample was composed of three biological replicates, with each replicate consisting of a single slice from one tuberous root.

2.6. Selection of Candidate IRGs and Primer Design

A total of eight potential IRGs were selected, according to the reported potential candidates, and combined with our P. thomsonii cultivar Volcano transcriptome dataset (Table 1). The primer pairs for the qRT-PCR experiments were designed using the Primer Permier 5.0 software, based on the sequences of the eight candidate IRGs. The design parameters included a GC content range of 45–65%, an optimal Tm of 55–60 °C, a primer length of 18–22 nucleotides, and an amplicon length of 100–160 base pairs (Table 1). The feasibility of the eight primer pairs was initially assessed through standard qRT-PCR protocols using Ex Taq® DNA Polymerase (RR001A, TaKara, Dalian, China). To verify the reliability of each target gene amplification, the products were subjected to 2% agarose gel electrophoresis and subsequent sequencing.

2.7. qRT-PCR Analysis

The qRT-PCR analysis was carried out in 96-well plates with the Bio-Rad CFX ConnectTM Real-time System (Bio-Rad, Hercules, CA, USA). All the cDNA samples were thawed on ice and diluted five-fold with nuclease-free water for use in the RT-qPCR. A 20 μL PCR reaction mixture was prepared using Taq SYBR® Green qPCR Premix (R0202, LABLEAD, Beijing, China), according to the manufacturer’s instructions. The qRT-PCR conditions were pre-denaturation at 95 °C for 40 s, followed by 40 amplification cycles at 95 °C for 5 s, 60 °C for 30 s, and 72 °C for 30 s. To rule out nonspecific amplification and primer-dimer formation, a melt curve analysis was performed using default parameters by steadily increasing the temperature from 65 °C to 90 °C. All the qRT-PCR reactions were performed in three biological replicates and three technical replicates, and the results are presented as the mean ± standard error (SE) [40].

2.8. Gene Expression Stability Analysis of Candidate IRGs

A standard curve for each candidate IRG was generated using a five-fold cDNA dilution series (1, 1/51, 1/52, 1/53, and 1/54), and the corresponding qRT-PCR efficiencies (E) were calculated using the equation: E = (10[−1/slope] − 1) × 100%. To evaluate the stability of the expression among the candidate IRGs, the quantification cycle (Cq) data for each gene were analyzed using these statistical approaches: GeNorm [41], NormFinder [42], BestKeeper [43], and the ΔCt method [44]. These methods are based on different algorithms and each produced different results for the same gene’s expression data. In addition, RefFinder (https://blooge.cn/RefFinder/?type=reference#tabs-1, accessed on 20 October 2020) was employed to check the output of three programs (GeNorm, NormFinder, and BestKeeper) [45,46,47], as well an additional stability ranking method (ΔCt method) to rank all the genes in the P. thomsonii samples.

2.9. Membership Function Analysis of IRGs

The score of the IRGs in each method was evaluated using a principal component analysis (PCA). The PCA was performed for dimension reduction, and principal components with eigenvalues greater than 0.9 were extracted. The formulas for calculating the membership function values of the comprehensive indexes of the IRGs are as follows [48]:
μ X i = 1 ( X i X m i n ) ( X m a x X m i n )
where X i is the measured value of the index by the PCA and X m a x and X m i n are the maximum and minimum values of an index of all the tested IRGs, respectively [49].
The weight of each comprehensive index is:
W j = P j j = 1 n P j   j = 1 ,   2 , ,   n
where W j represents the weight of the j th comprehensive index and P represents the contribution rate of the j th comprehensive index of each IRG obtained by the PCA [49].
The combined stability of the IRGs is as follows:
D v a l u e = j = 1 n μ X j × W j   j = 1 ,   2 , ,   n
where D-value is the comprehensive evaluation value of the stability of the IRGs under different methods obtained from the comprehensive index evaluation [49]. The analysis was assessed using the IBM SPSS V.19 statistical software.

2.10. Validation of the Selected IRGs for qRT-PCR Normalization

To confirm the expression stability of the identified IRGs, as indicated by the four algorithms, five genes related to the ethylene-signaling pathway and antioxidant activity were selected based on our transcriptome data. Primers for the five genes were designed as described above and are listed in Table 1. The qRT-PCR analysis was performed to verify the effectiveness of the identified IRGs, with the results being calculated using the 2−ΔΔCT method, and all the reactions were carried out in triplicate.

2.11. Statistical Analysis

The differences between the values were calculated using a one-way analysis of variance (ANOVA) with a student’s t-test at a significance level of 0.05 in GraphPad Prism v9.5 (GraphPad Software, Inc., Chicago, IL, USA, www.graphpad.com, accessed on 1 January 2023). All of the data analyses were performed for the three biological repeats, and the values shown in the figures represent the average values for the three repeats. The sample variability is given as the mean ± SE.

3. Results

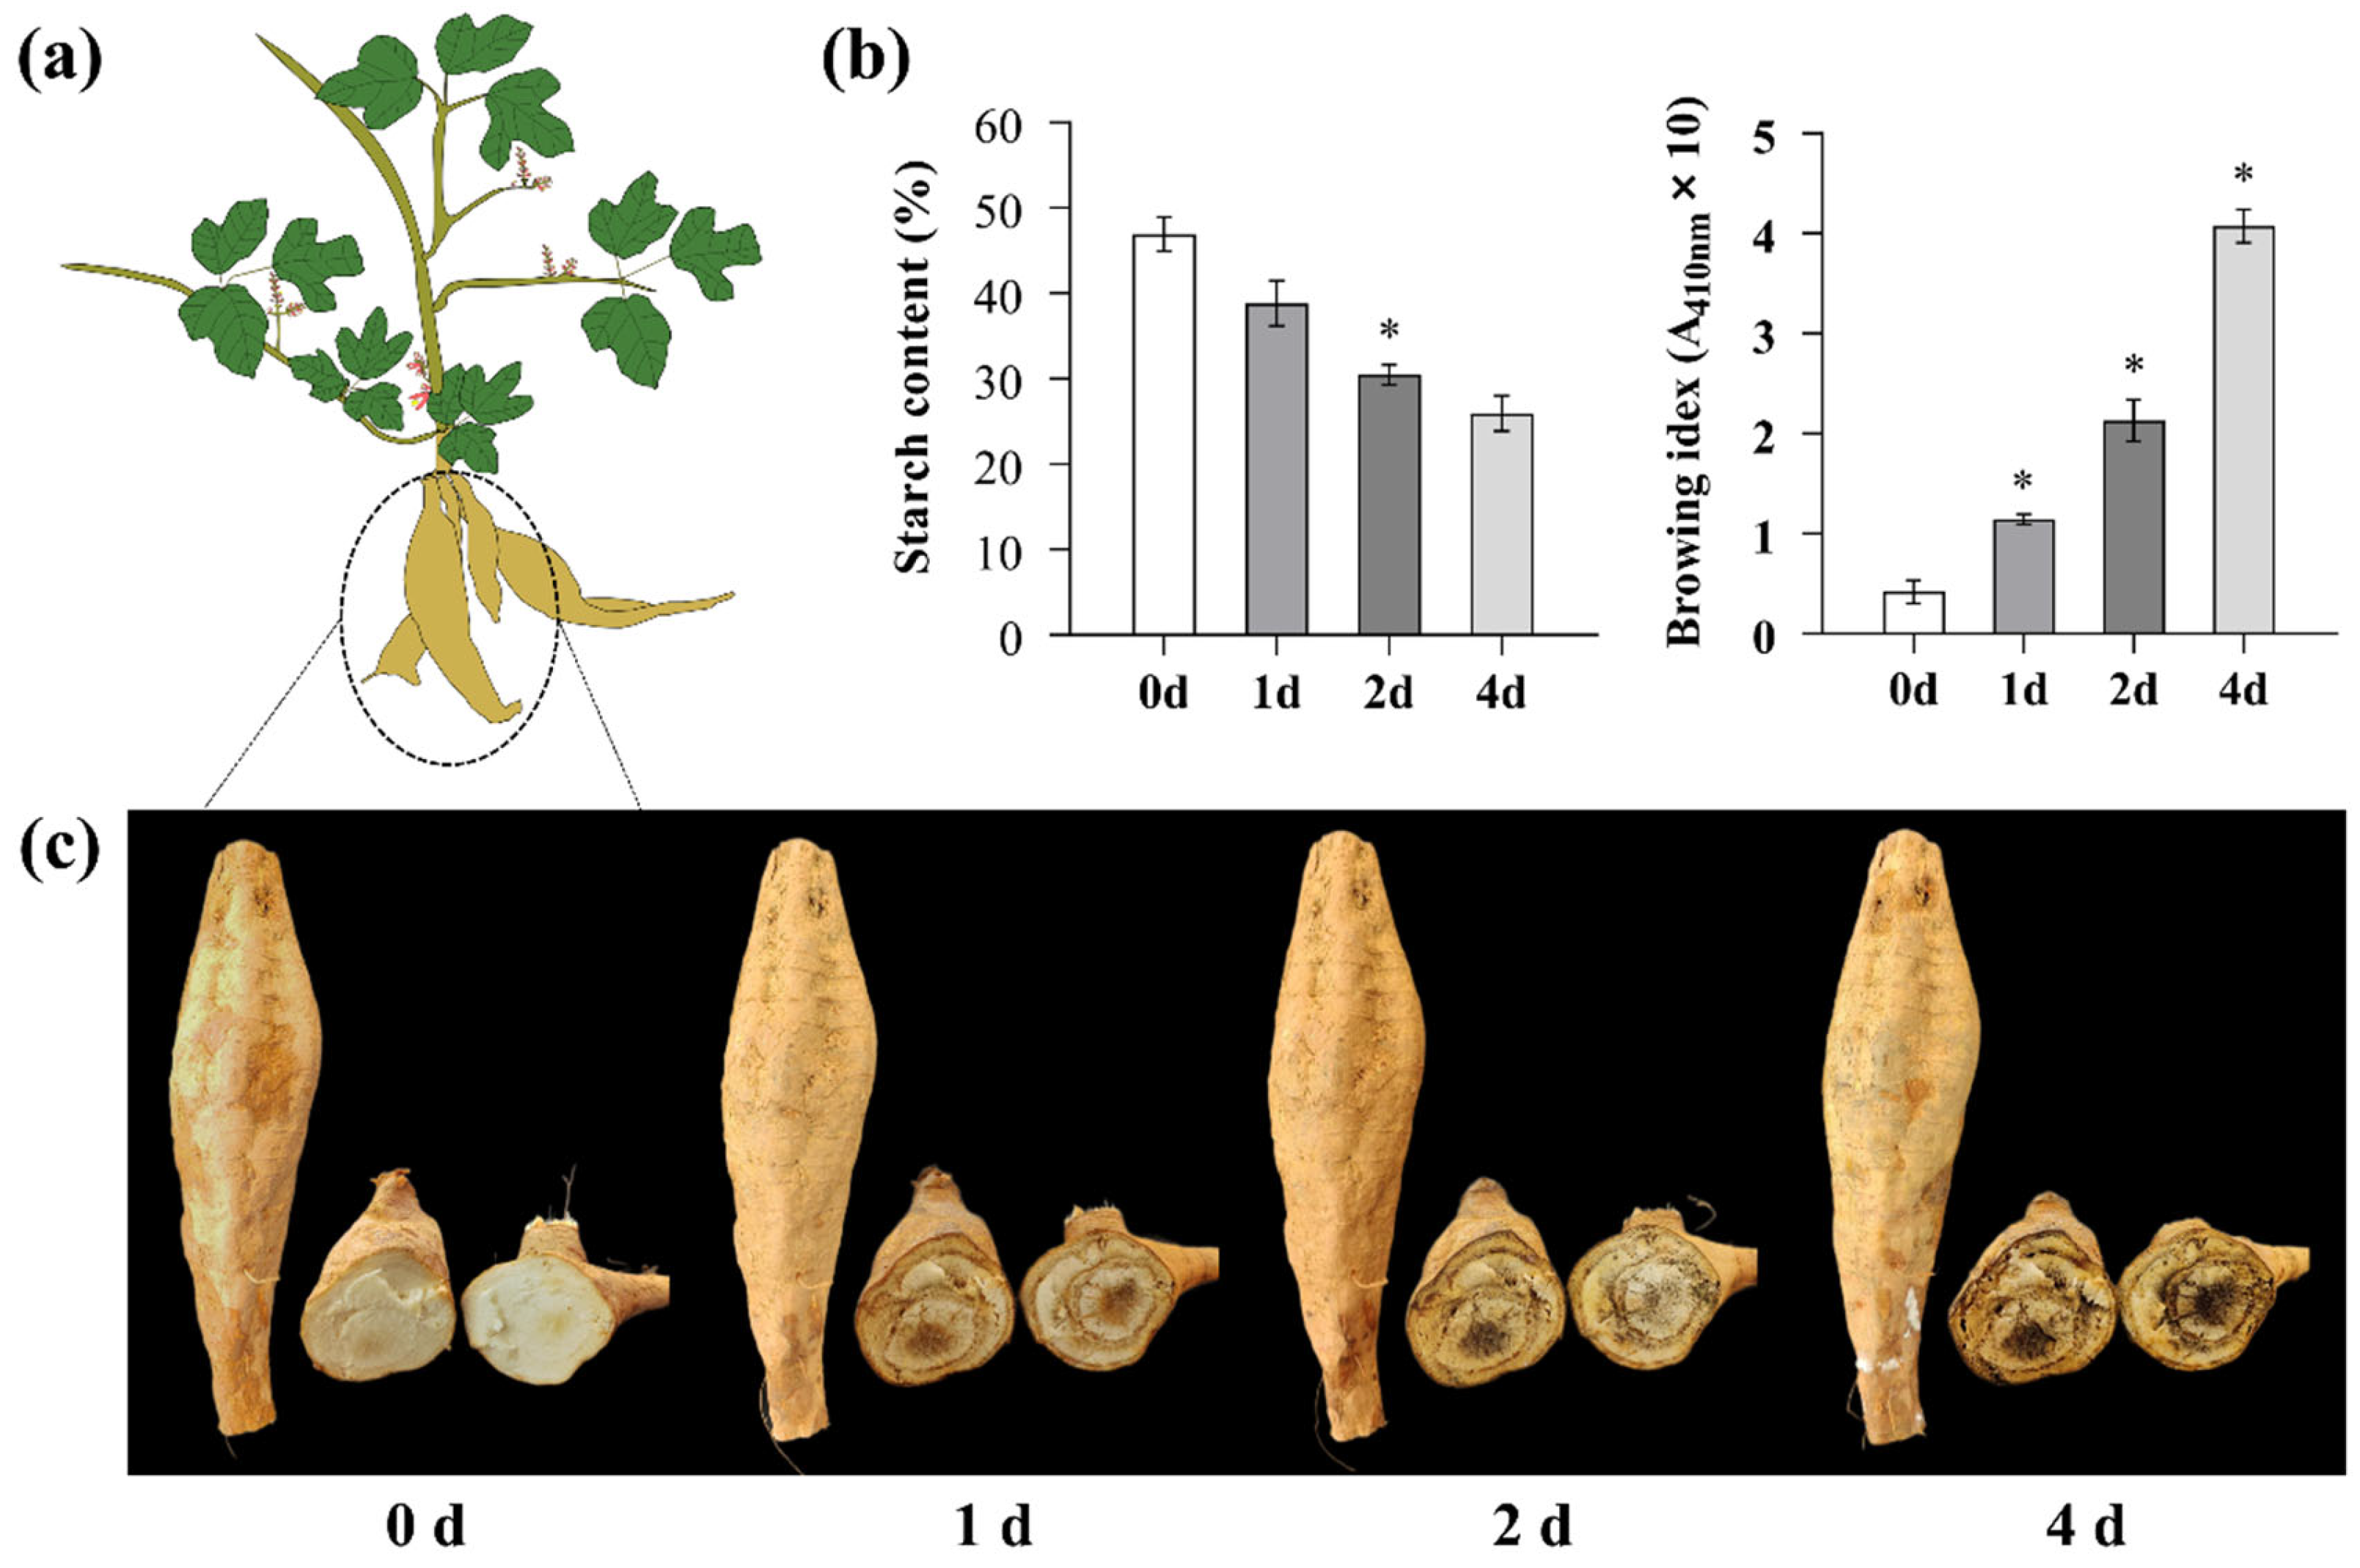
3.1. Exogenous Application of Ethephon Delayed PPD of P. thomsonii Tuberous Roots

P. thomsonii, a perennial vine in the Fabaceae family, produces edible tuberous roots (Figure 1a). Due to their low water content and high starch content, these roots are susceptible to PPD, such as mold growth and browning. Particularly at a wound surface on roots, this browning occurs immediately within 1 d of commencing storage and intensifies as the storage time increases. Then, the root browning becomes serious after 4 d of storage, with a significant reduction in starch content (Figure 1b,c).
To investigate the effect of ethephon on the PPD of the P. thomsonii tuberous roots, the Volcano cultivar grown exclusively in Shaoguan City was treated with either water (the control) or exogenous ethephon. The PPD symptoms were then observed at 0, 6, 12, 24, 48, and 72 h after treatment (Figure 2). After 6 h of water treatment, slight ‘vascular streaking’ was observed in the tuberous roots. After 12 h of water treatment, ‘vascular discoloration’ with a brown color spreading across the surface of the P. thomsonii tuber slices became visible. In comparison to the water treatment, the P. thomsonii tuberous roots treated with 1% ethephon showed ‘vascular streaking’ after 12 h and ‘vascular discoloration’ after 24 h, while those treated with 3% ethephon showed ‘vascular streaking’ after 24 h and ‘vascular discoloration’ after 48 h. These results indicate that an exogenous application of ethephon delays the onset of PPD in P. thomsonii tuberous roots.

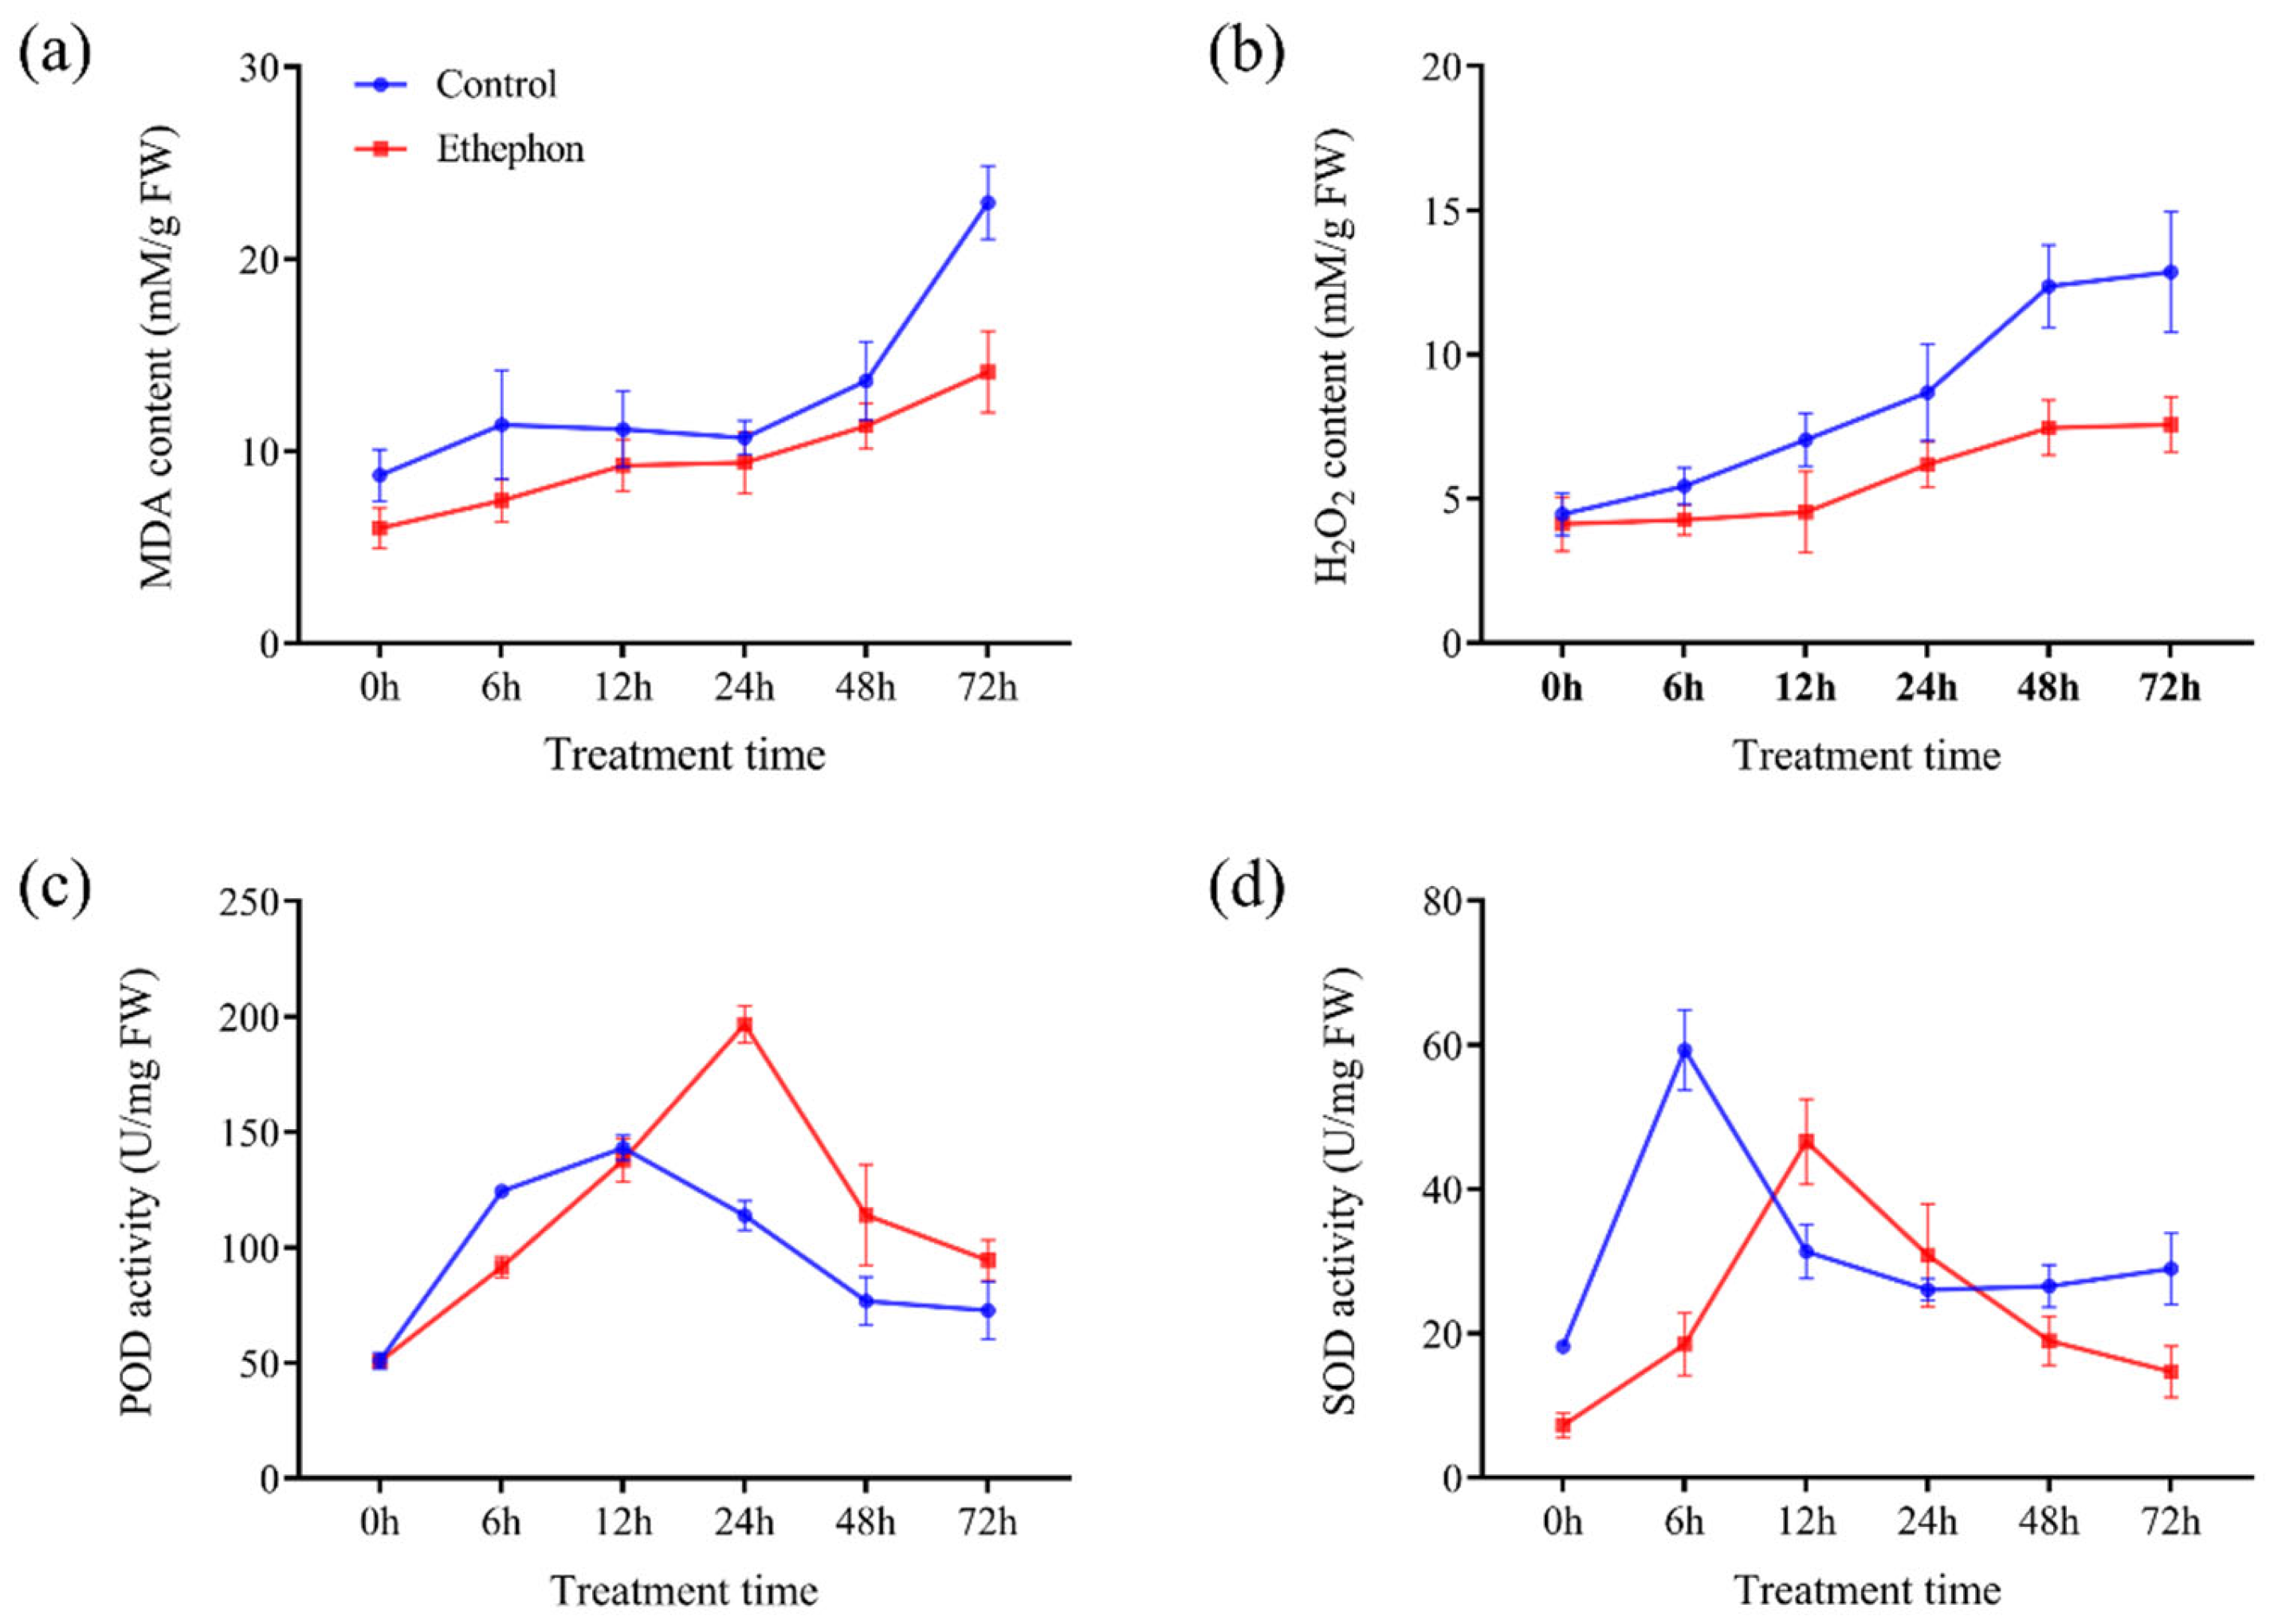
3.2. Exogenous Ethephon Application Decreased MDA and H2O2 Content and Enhanced POD and SOD Activities during PPD Process

To determine whether the ethephon-induced delay in PPD was related to reactive oxygen species (ROS) scavenging in the tuberous roots during the postharvest period, the amounts of malondialdehyde (MDA) and hydrogen peroxide (H2O2) were measured at various time points. In general, the MDA and H2O2 contents increased in the tuberous roots of the P. thomsonii cultivar Volcano during the first 72 h postharvest, with or without ethephon treatment, indicating an increase in oxidative damage. Compared to the water-treated samples, the P. thomsonii tuberous roots treated with 3% ethephon showed lower accumulations of both MDA and H2O2 during the 6 to 72 h postharvest period (Figure 3a,b).
To ascertain whether this ethephon-induced ROS scavenging was related to the activities of antioxidative enzymes during the postharvest period, the activities of peroxidase (POD) and superoxide dismutase (SOD) were measured at various time points. During the PPD process, the POD activity was significantly higher in the P. thomsonii tuberous roots treated with 3% ethephon compared to the control samples at 24 to 72 h after treatment (Figure 3c). Additionally, the SOD activity was significantly increased in the samples treated with 3% ethephon compared to the controls at 12 and 24 h after treatment (Figure 3d). These results suggest that these increased activities of POD and SOD may have been involved in the ethephon-induced ROS scavenging during the PPD process.

3.3. Transcriptome Analysis of PPD delay in P. thomsonii during Ethephon Treatment Based on RNA-Seq

To investigate the transcriptional regulation underlying the ethephon-mediated delay of PPD in P. thomsonii, we conducted a comparative transcriptomic analysis between the water-treated and ethephon-treated tuberous roots from the Volcano cultivar. Fragments per kilobase per million mapped fragments (FPKM) was used to calculate the gene expression based on the criteria of p-value < 0.05 for an adjusted p-value and > 1 for log2 base of the fold-change. A total of 9560 DEGs were identified following the exogenous ethephon treatment at various time points, including 313 genes that were continuously upregulated or downregulated in the ethephon-treated samples compared to the control at all time points (Figure S1 and Table S1). The volcano plots reflected the upregulation and downregulation of the DEGs in the P. thomsonii cultivar Volcano following the ethephon treatment at various time points compared to the control samples (Figure S2). Additionally, the analysis of the comparative transcripts showed 2081 non-DEGs (|log2 fold-change|<1, p-value ≤ 0.05) during the ethephon treatment at various time points (Table S2). These non-DEGs were used as the source of the candidate IRGs for the RNA-Seq dataset.

3.4. Selection of Candidate IRGs for Delaying PPD in P. thomsonii

In order to identify candidate IRGs for the PPD delay in P. thomsonii, we analyzed the expression patterns of the Volcano cultivar during the ethephon treatment and selected eight candidate IRGs (Table 1). These candidate IRGs, including PtGAPDH1, PtGAPDH2, PtEIF3, PtUBQ10, PtEF1, PtUBC10, PtACT7, and PtTUBB4, were selected based on reported and commonly used IRGs. We created a heatmap based on the expression patterns of these eight genes in the P. thomsonii cultivar Volcano for the water-treated (control) sample and at the various time points for the ethephon-treated samples. The transcript levels of the selected candidate IRGs were relatively stable under both the control and ethephon-treated conditions, with the exception of PtGAPDH1 and PtTUBB4 (Figure S3).

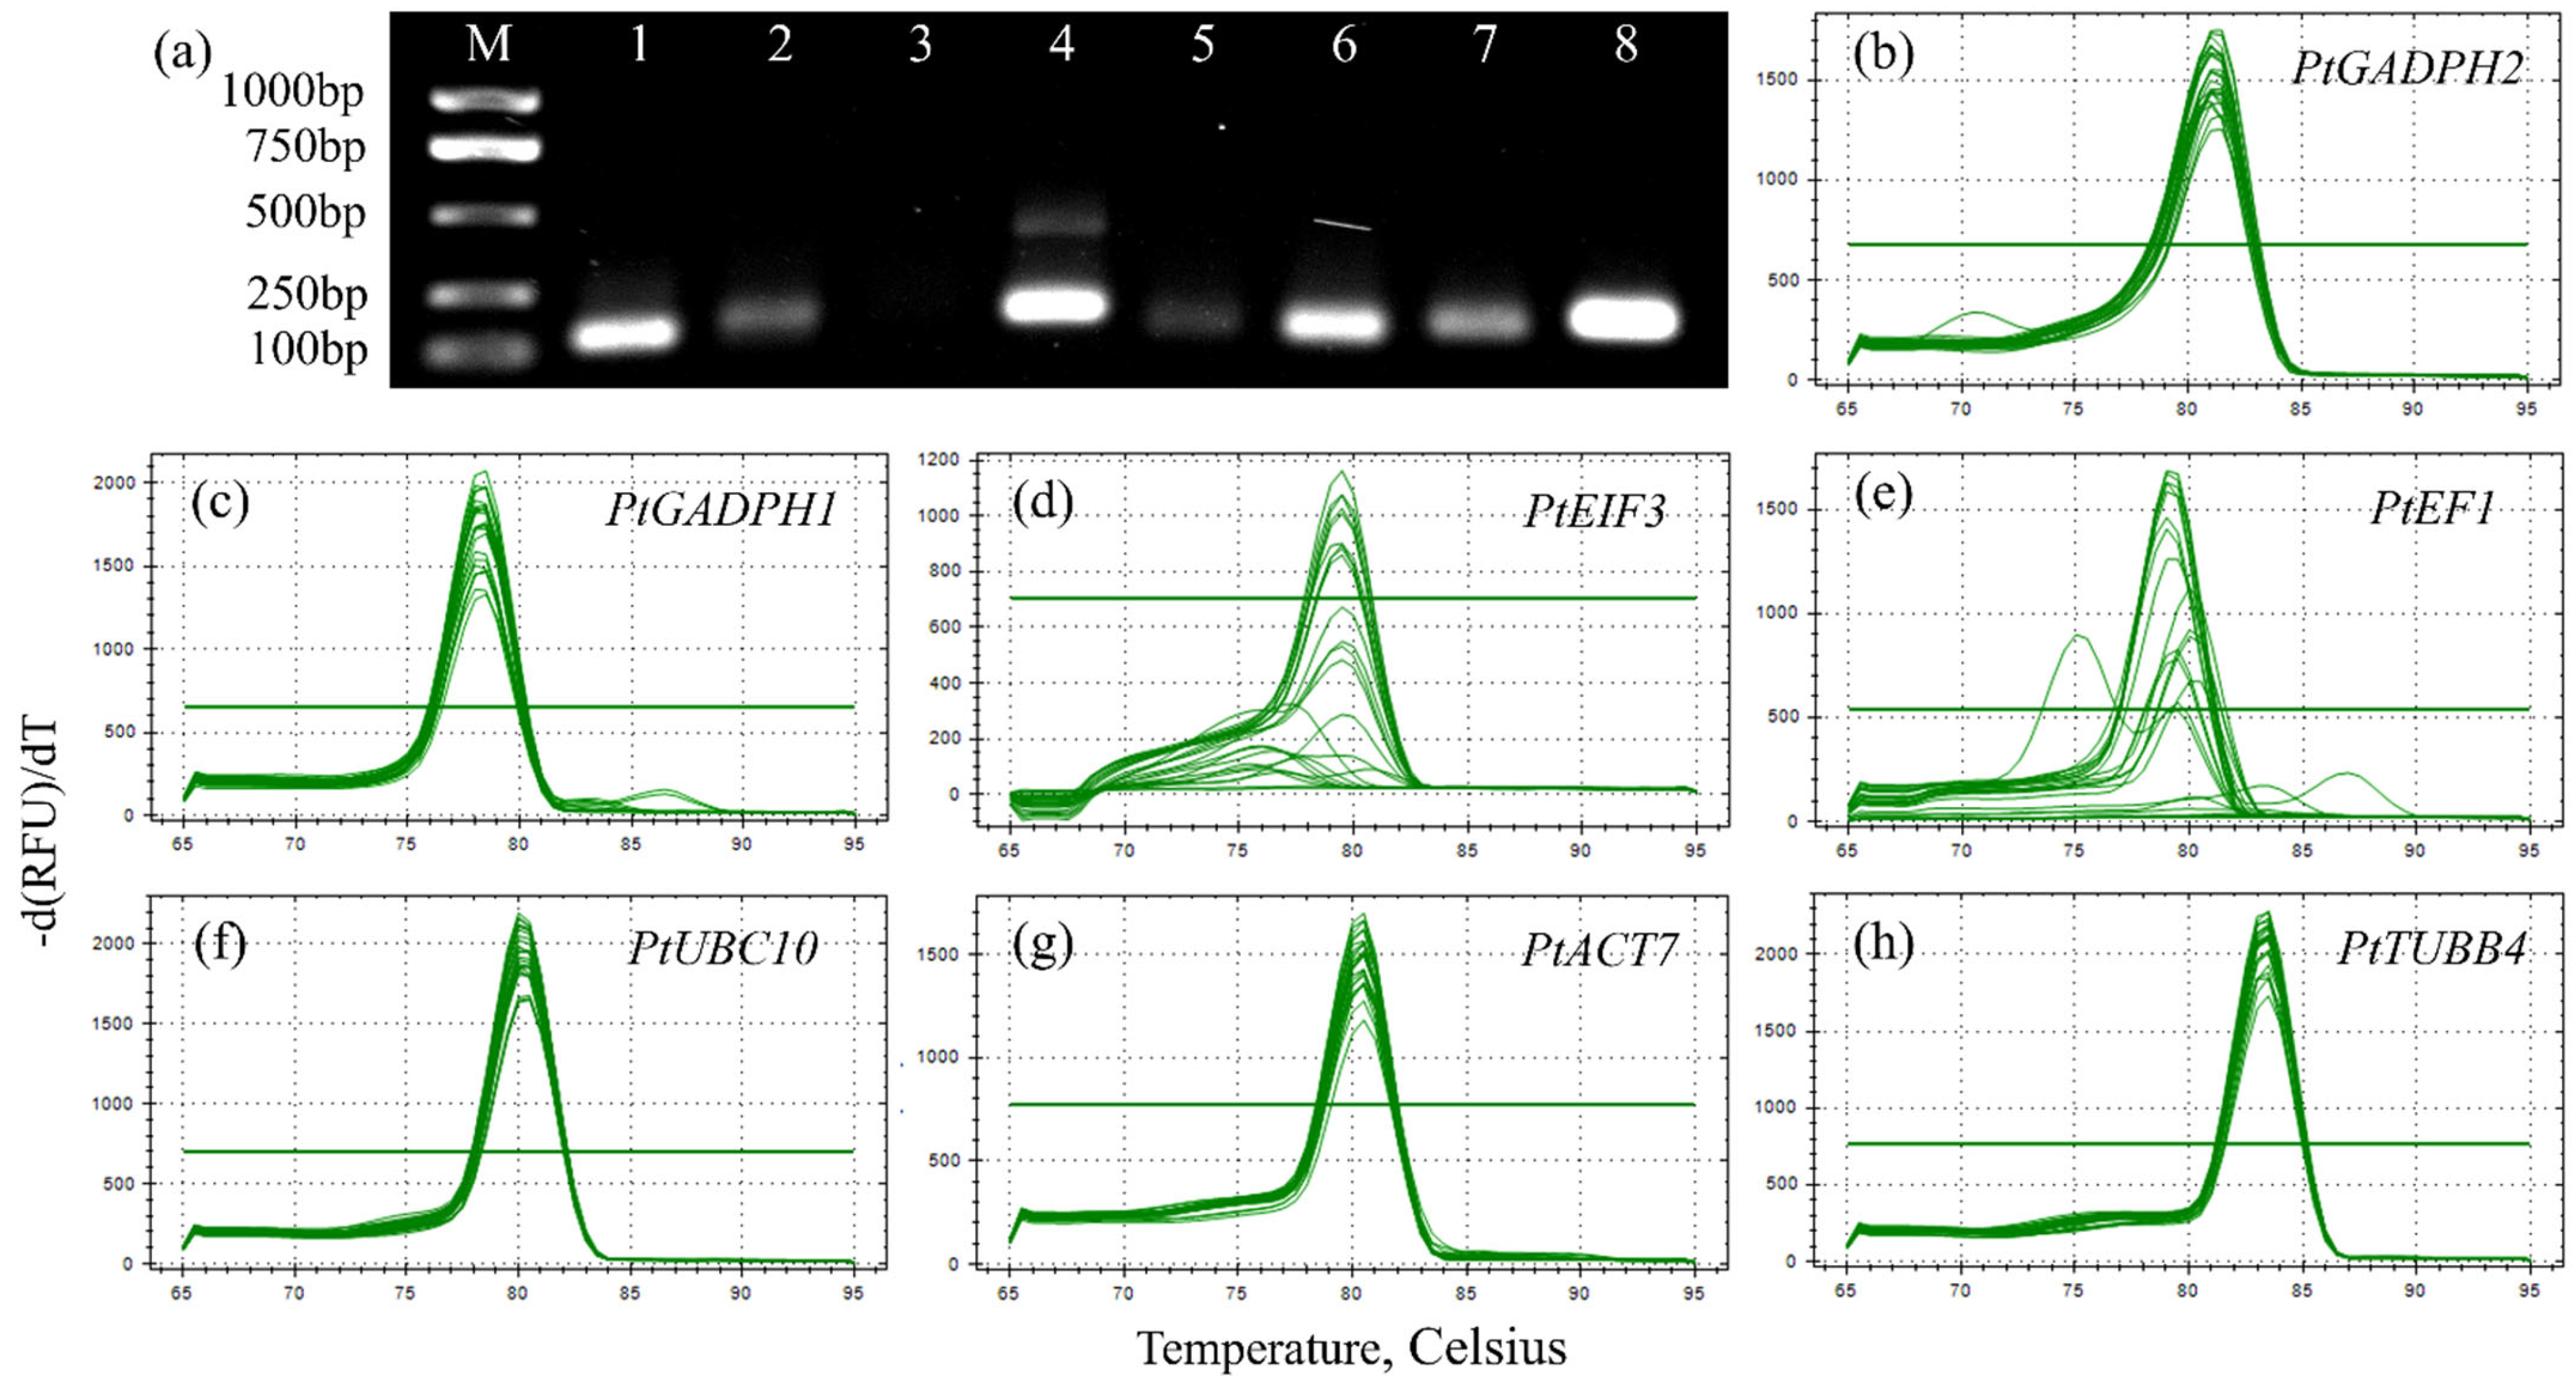
3.5. Assessment of Primer Specificity and PCR Amplification Efficiency

The amplification efficiencies (E%) ranged from 90% to 110%, with corresponding linear correlation coefficients (R2) greater than 0.99. These results suggest that both the efficiency of the reaction and the degree of agreement with the PCR standard curve were satisfactory [50]. The target specificity of the sequences for PtGAPDH1, PtGAPDH2, PtEIF3, PtEF1, PtUBC10, PtACT7, and PtTUBB4 in P. thomsonii was confirmed by the presence of a single qRT-PCR amplification, as determined by gel electrophoresis and a single peak in the melting curve analysis. The gel electrophoresis revealed that all eight IRGs produced a single fragment of the expected size (100–250 bp), with the exception of PtUBC10 (Figure 4a). A further fluorescence quantitative analysis showed that all seven genes had single peaks (Figure 4b–h). However, PtEF1 displayed some inconsistent levels of nonspecific amplification, potentially due to its low expression in some samples leading to unstable Cq values and melting curves (Figure 4e). The E% and R2 of seven IRGs were analyzed. The results indicated that the expression level of PtEIF3 was too low, with the Cq value exceeding 40 when the cDNA was diluted 53 times. Additionally, the E% of PtEF1 was 304%, exceeding the stable range by 90–110%.

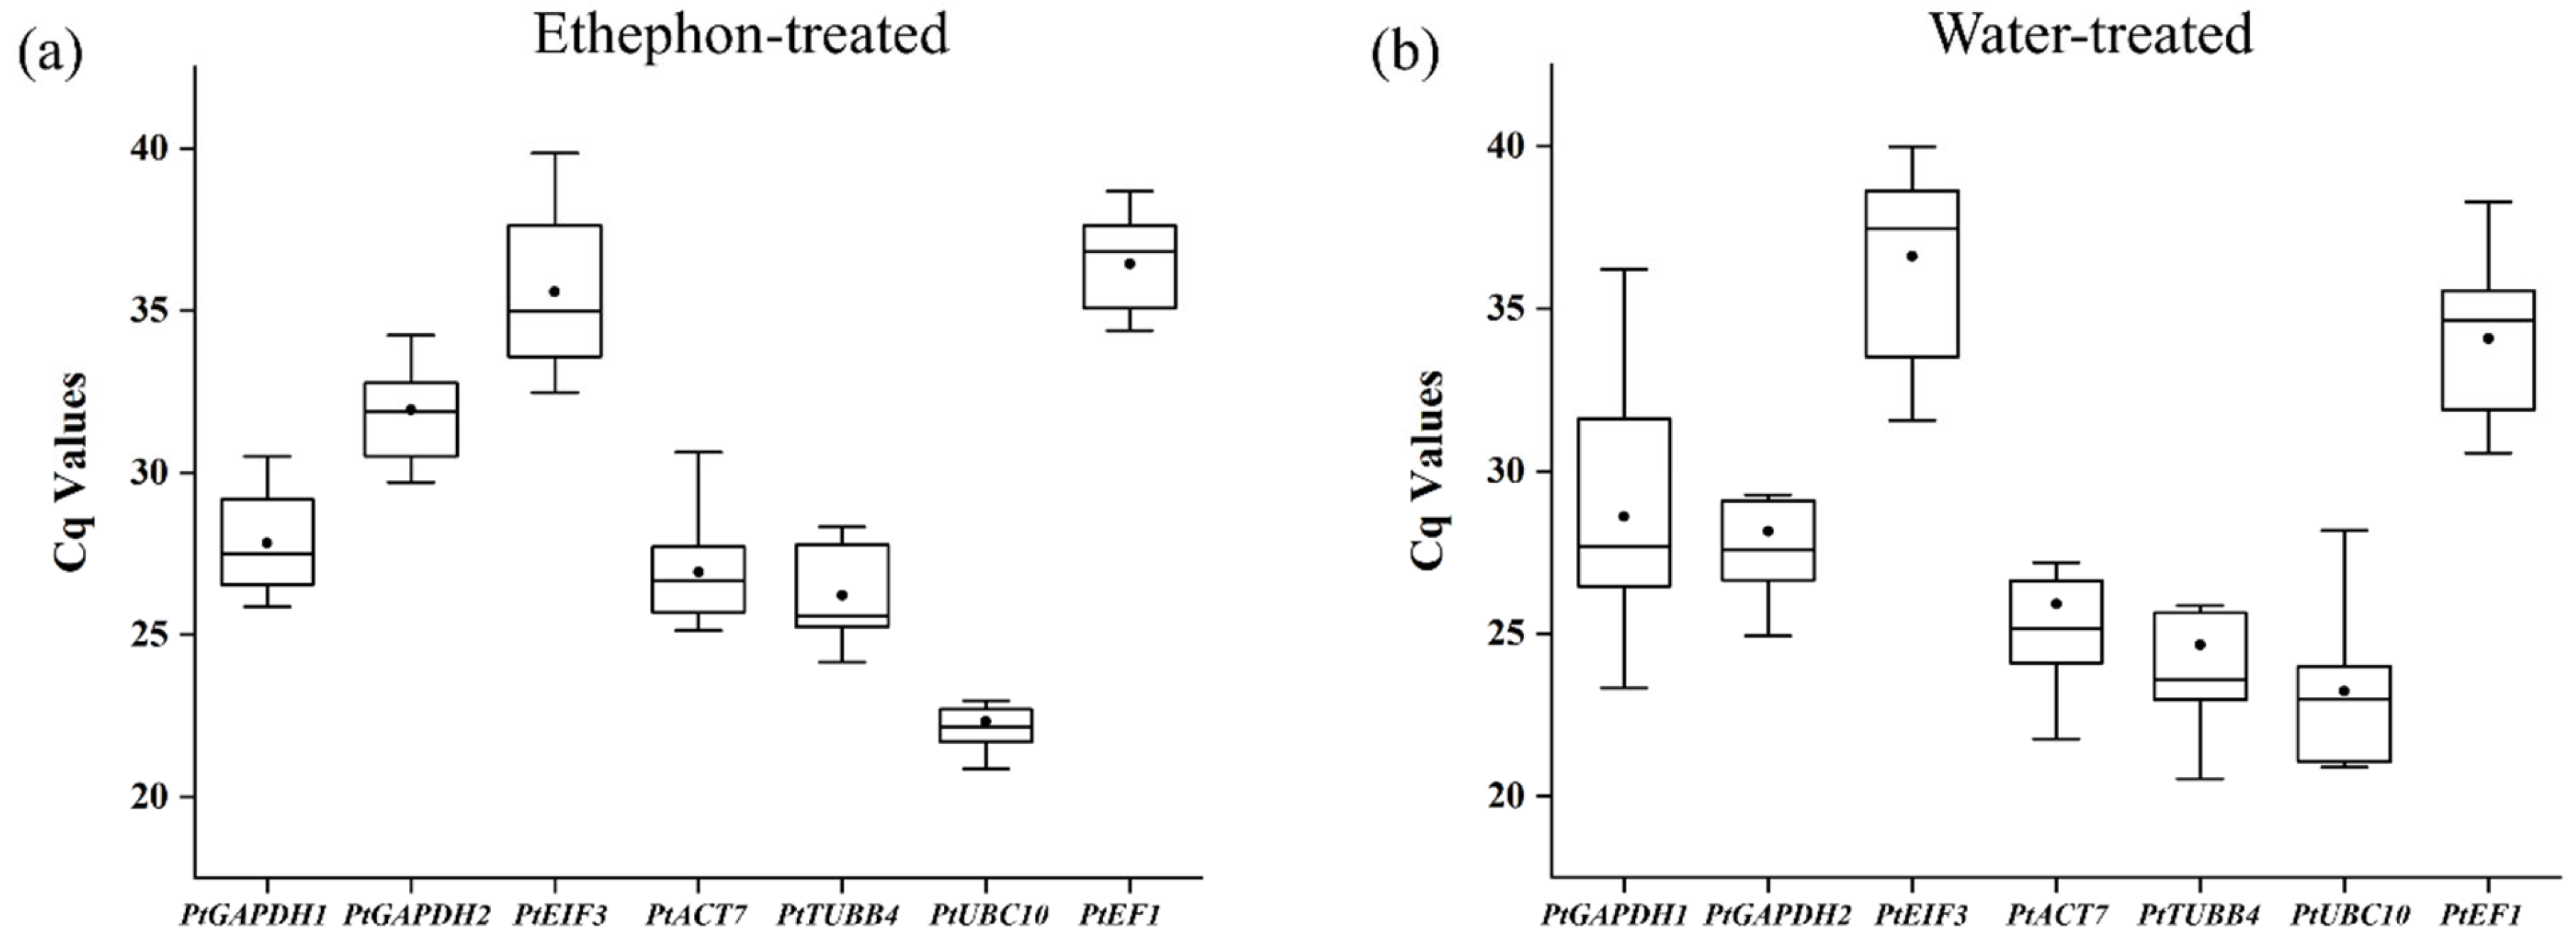
3.6. Cq Values of Candidate IRGs

In the qRT-PCR analysis, the Cq values generally reflected the abundance of the candidate IRGs’ expressions, with a lower Cq value indicating higher mRNA transcript levels. A high-quality IRG typically has a Cq value between 15 and 30 [51]. The Cq values of the seven candidate IRGs varied under different treatments. In the ethephon-treated samples, the Cq values of PtTUBB4 and PtUBC10 were between 20 and 30, with PtUBC10 having the lowest mean Cq value of 22.32 (Figure 5a). In the water-treated samples, the Cq values of PtACT7, PtGADPH2, PtTUBB4, and PtUBC10 were between 20 and 30, with PtUBC10 again having the lowest mean Cq value of 23.23 (Figure 5b).

3.7. Transcription Stability Analyses of Candidate IRGs

3.7.1. ΔCt Method

The expression stability of the seven candidate IRGs was evaluated using the ΔCt method. The gene with the lowest mean ± SE ΔCt value was considered to be the most stable IRG. The analysis of the mean ± SE ΔCt values revealed that PtUBC10 was the most stable IRG for the ethephon-treated samples, with an average standard deviation of 1.48 (Table 2). In contrast, PtACT7 was the most stable IRG for the water-treated samples, with a mean standard deviation of 2.17.

3.7.2. GeNorm Analysis

The expression stability of the eight candidate genes was further analyzed using the GeNorm software (https://seqyuan.shinyapps.io/seqyuan_prosper/, accessed on 21 January 2021). The M value of each gene was calculated by the software, with values below 1.5 indicating a stable gene expression. The lower the M value, the more stable the gene. The results of the GeNorm analysis are reported in Table 2. Under both the ethephon and water treatments, all eight IRGs showed stability with low M1 values (<1.5). PtACT7 and PtTUBB4 had the same values and were the most stable IRGs for all the samples, including both the ethephon- and water-treated groups, with M values of 0.0413 and 0.0362, respectively. PtACT7 and PtTUBB4 were the most stable, followed by PtUBC10. The least stable gene differed between the two treatments groups: PtEF1 in the ethephon treatment group and PtGADPH1 in the water treatment group.
In addition to calculating the M values, the GeNorm software version 1.48.0 [41] could also perform a pairwise variation (Vn/Vn + 1) analysis on the normalization factor of the candidate IRGs to determine the optimal number of IRGs for normalization. A cutoff value of 0.15 indicates that the addition of other IRGs (Vn + 1) is not necessary for reliable normalization and that ‘n’ is the optimal number. In this study, the V2/3 value for all the samples was below 0.15 (Figure 6), suggesting that the eight IRGs were sufficient for normalization.

3.7.3. NormFinder Analysis

The NormFinder program evaluated the stability of each gene by calculating its M2 value, with a lower value indicating a higher stability. For the ethephon-treated samples, NormFinder ranked the stability of the genes in descending order, as follows: PtUBC10, PtACT7, PtGADPH1, PtGADPH2, PtTUBB4, PtEIF3, and PtEF1 (Table 2). For the water-treated samples, the stability ranking was as follows: PtACT7, PtUBC10, PtTUBB4, PtEIF3, PtEF1, PtGADPH1, and PtGADPH2.

3.7.4. BestKeeper Analysis

The BestKeeper program [43] analyzed the stability of the IRGs by calculating the coefficient of variation (CV) and standard deviation (SD) of their expression levels. Lower SD and CV values indicate a higher stability. In contrast to the results obtained using the previous three methods, BestKeeper identified PtEF1 as the most stable gene for normalization in the ethephon-treated samples, followed by PtGADPH1 and PtEIF3 having the lowest expression levels (Table 2). The same ranking was observed for the water-treated samples.

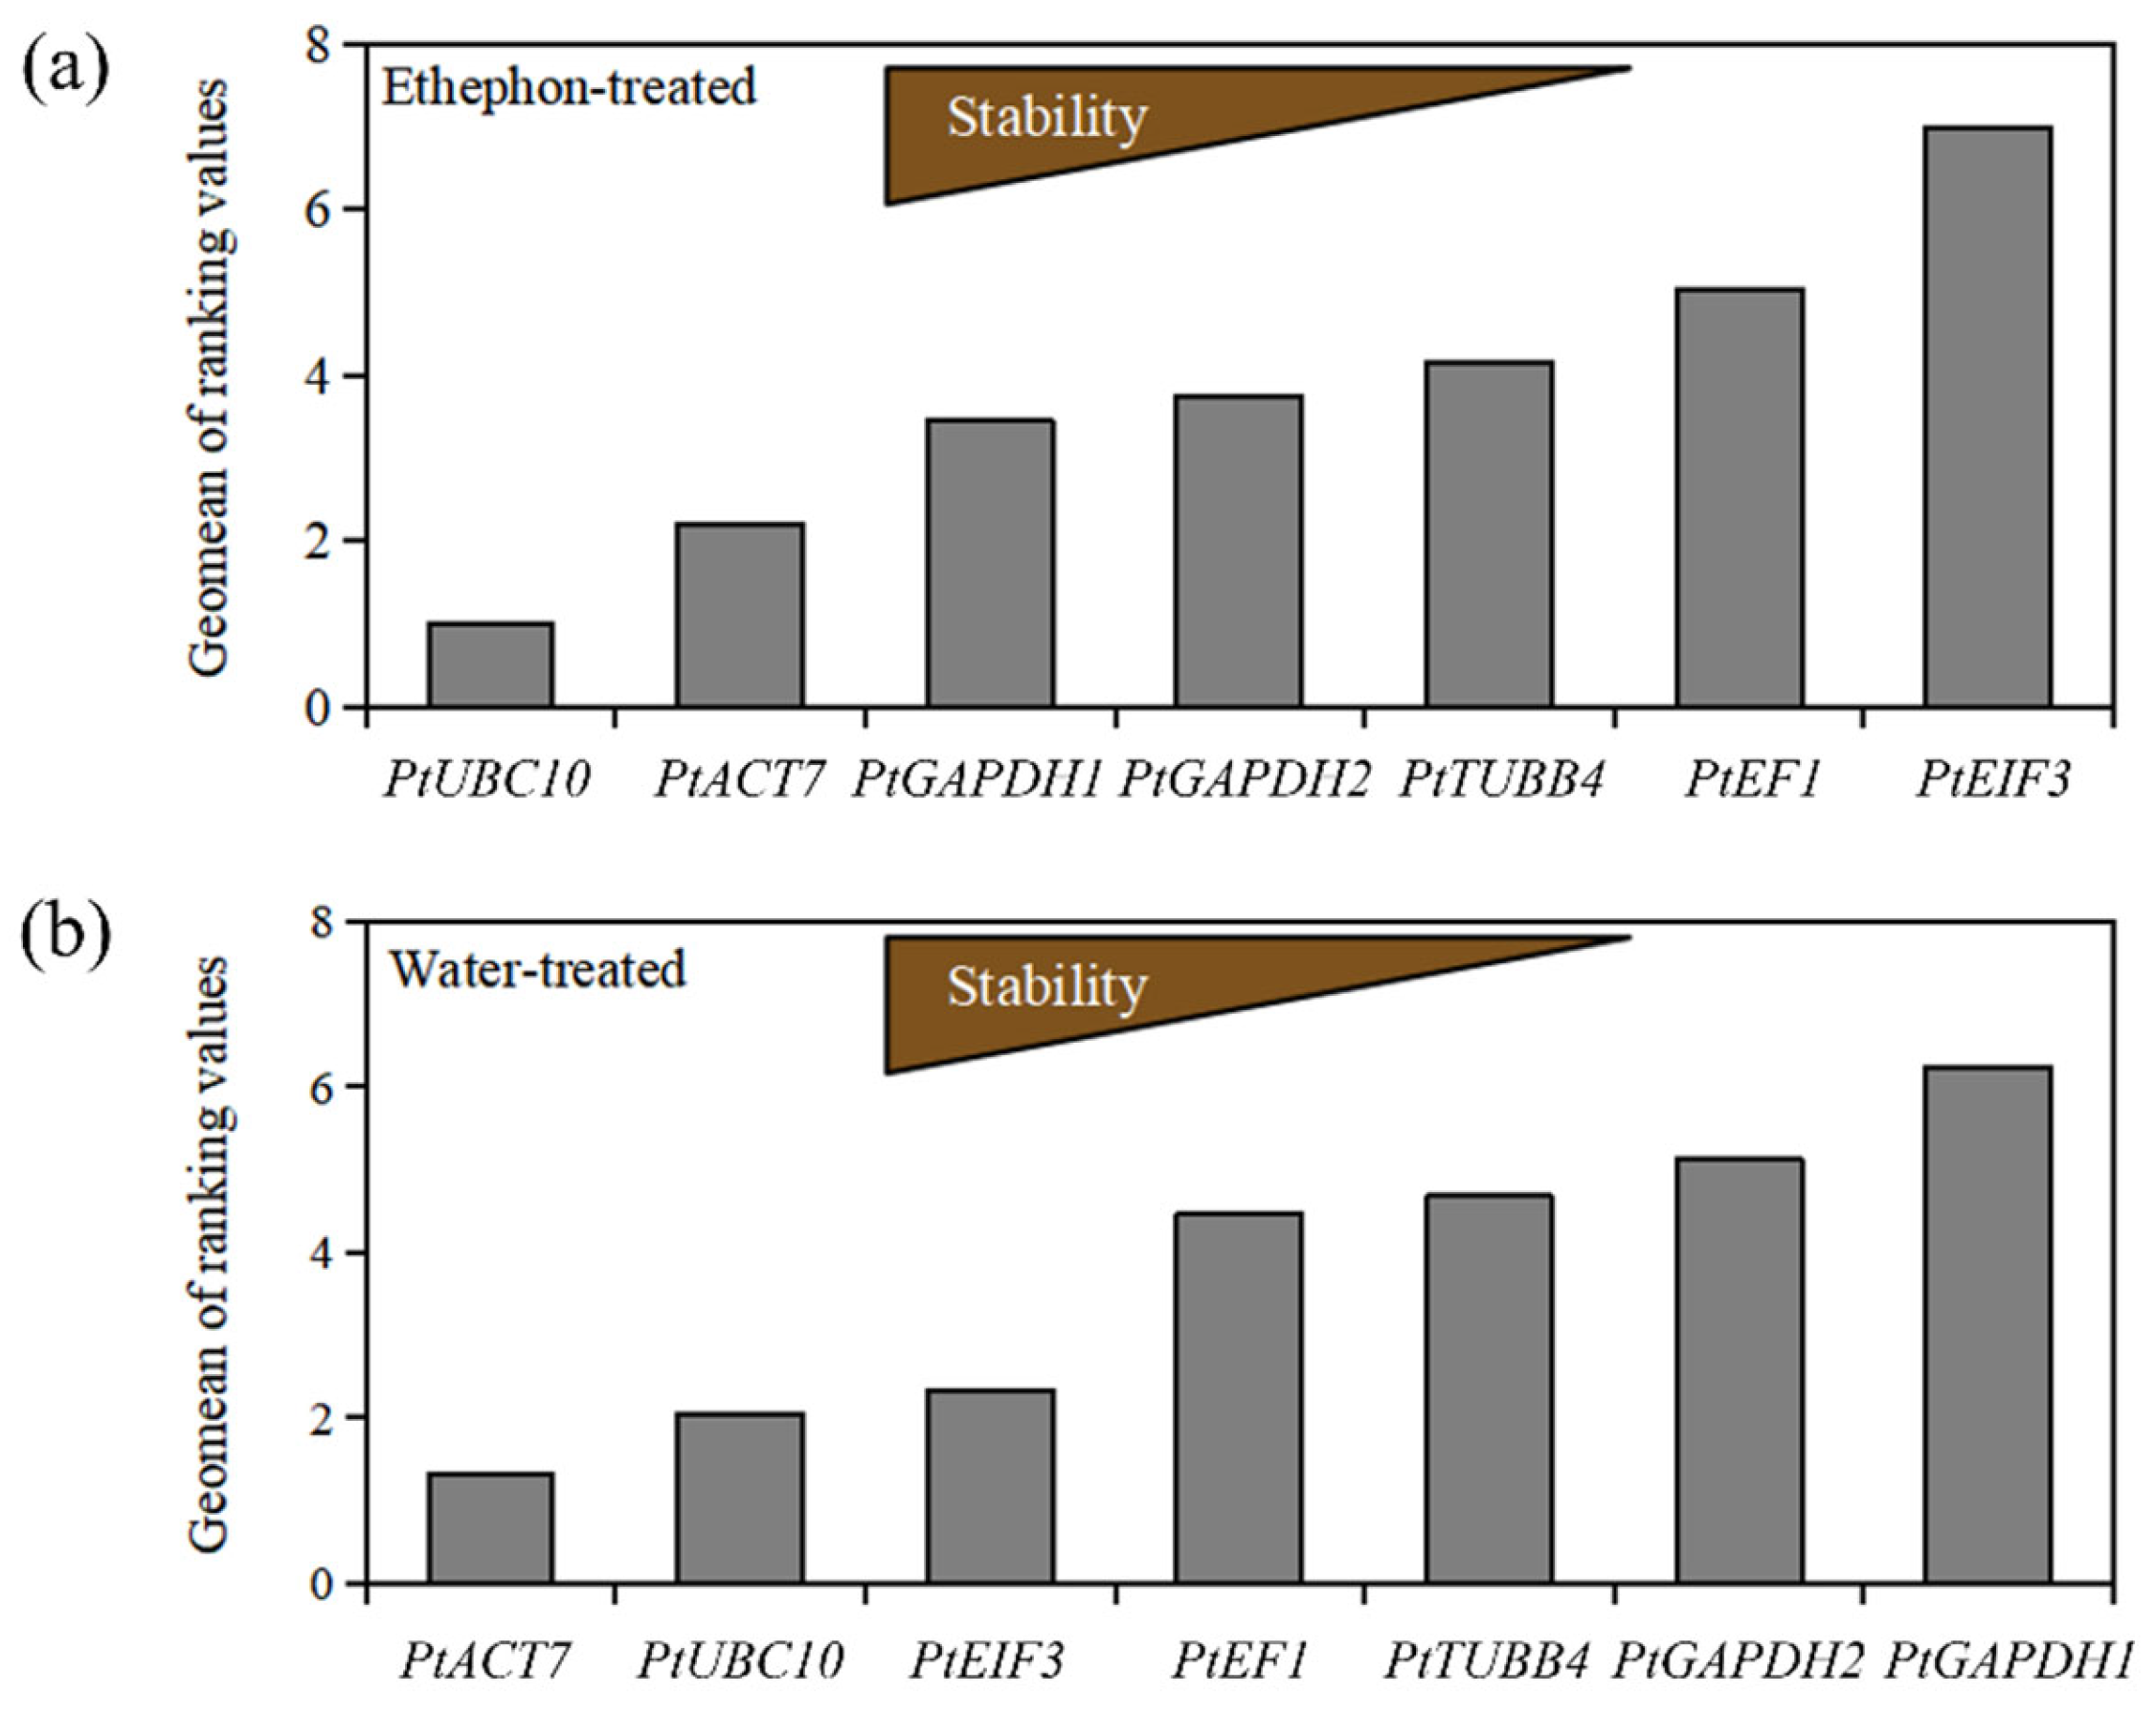
3.7.5. RefFinder Analysis

Due to the different calculation methods used by the four evaluation methods (GeNorm, NormFinder, BestKeeper, and the ΔCt method), their results varied, with particularly notable differences between the BestKeeper results and those of the other three methods. To obtain a comprehensive evaluation ranking, the results from all four methods were processed using the RefFinder (https://blooge.cn/RefFinder/?type=reference#tabs-1, accessed on 20 October 2020) [46,47]. The final ranking results are shown in Figure 7. Under the ethephon treatment, the stability ranking (from most to least stable) was as follows: PtUBC10 > PtACT7 > PtGADPH1 > PtGADPH2 > PtTUBB4 > PtEF1 > PtEIF3. Under the water treatment, the stability ranking was as follows: PtACT7 > PtUBC10 > PtEIF3 > PtEF1 > PtTUBB4 > PtGADPH2 > PtGADPH1.

3.7.6. Membership Functions Analysis

To further select and confirm the stability of the candidate IRGs, a membership functions analysis according to the IRGs score of the above methods (GeNorm, NormFinder, BestKeeper, and the ΔCt method) was employed by SPSS (Table 2). PtUBC10 and PtACT7 ranked the highest D-values scores, which was consistent with the results of the RefFinder analysis. Taken together, our results indicate that PtUBC10 and PtACT7 exhibited the best stability under both treatments.

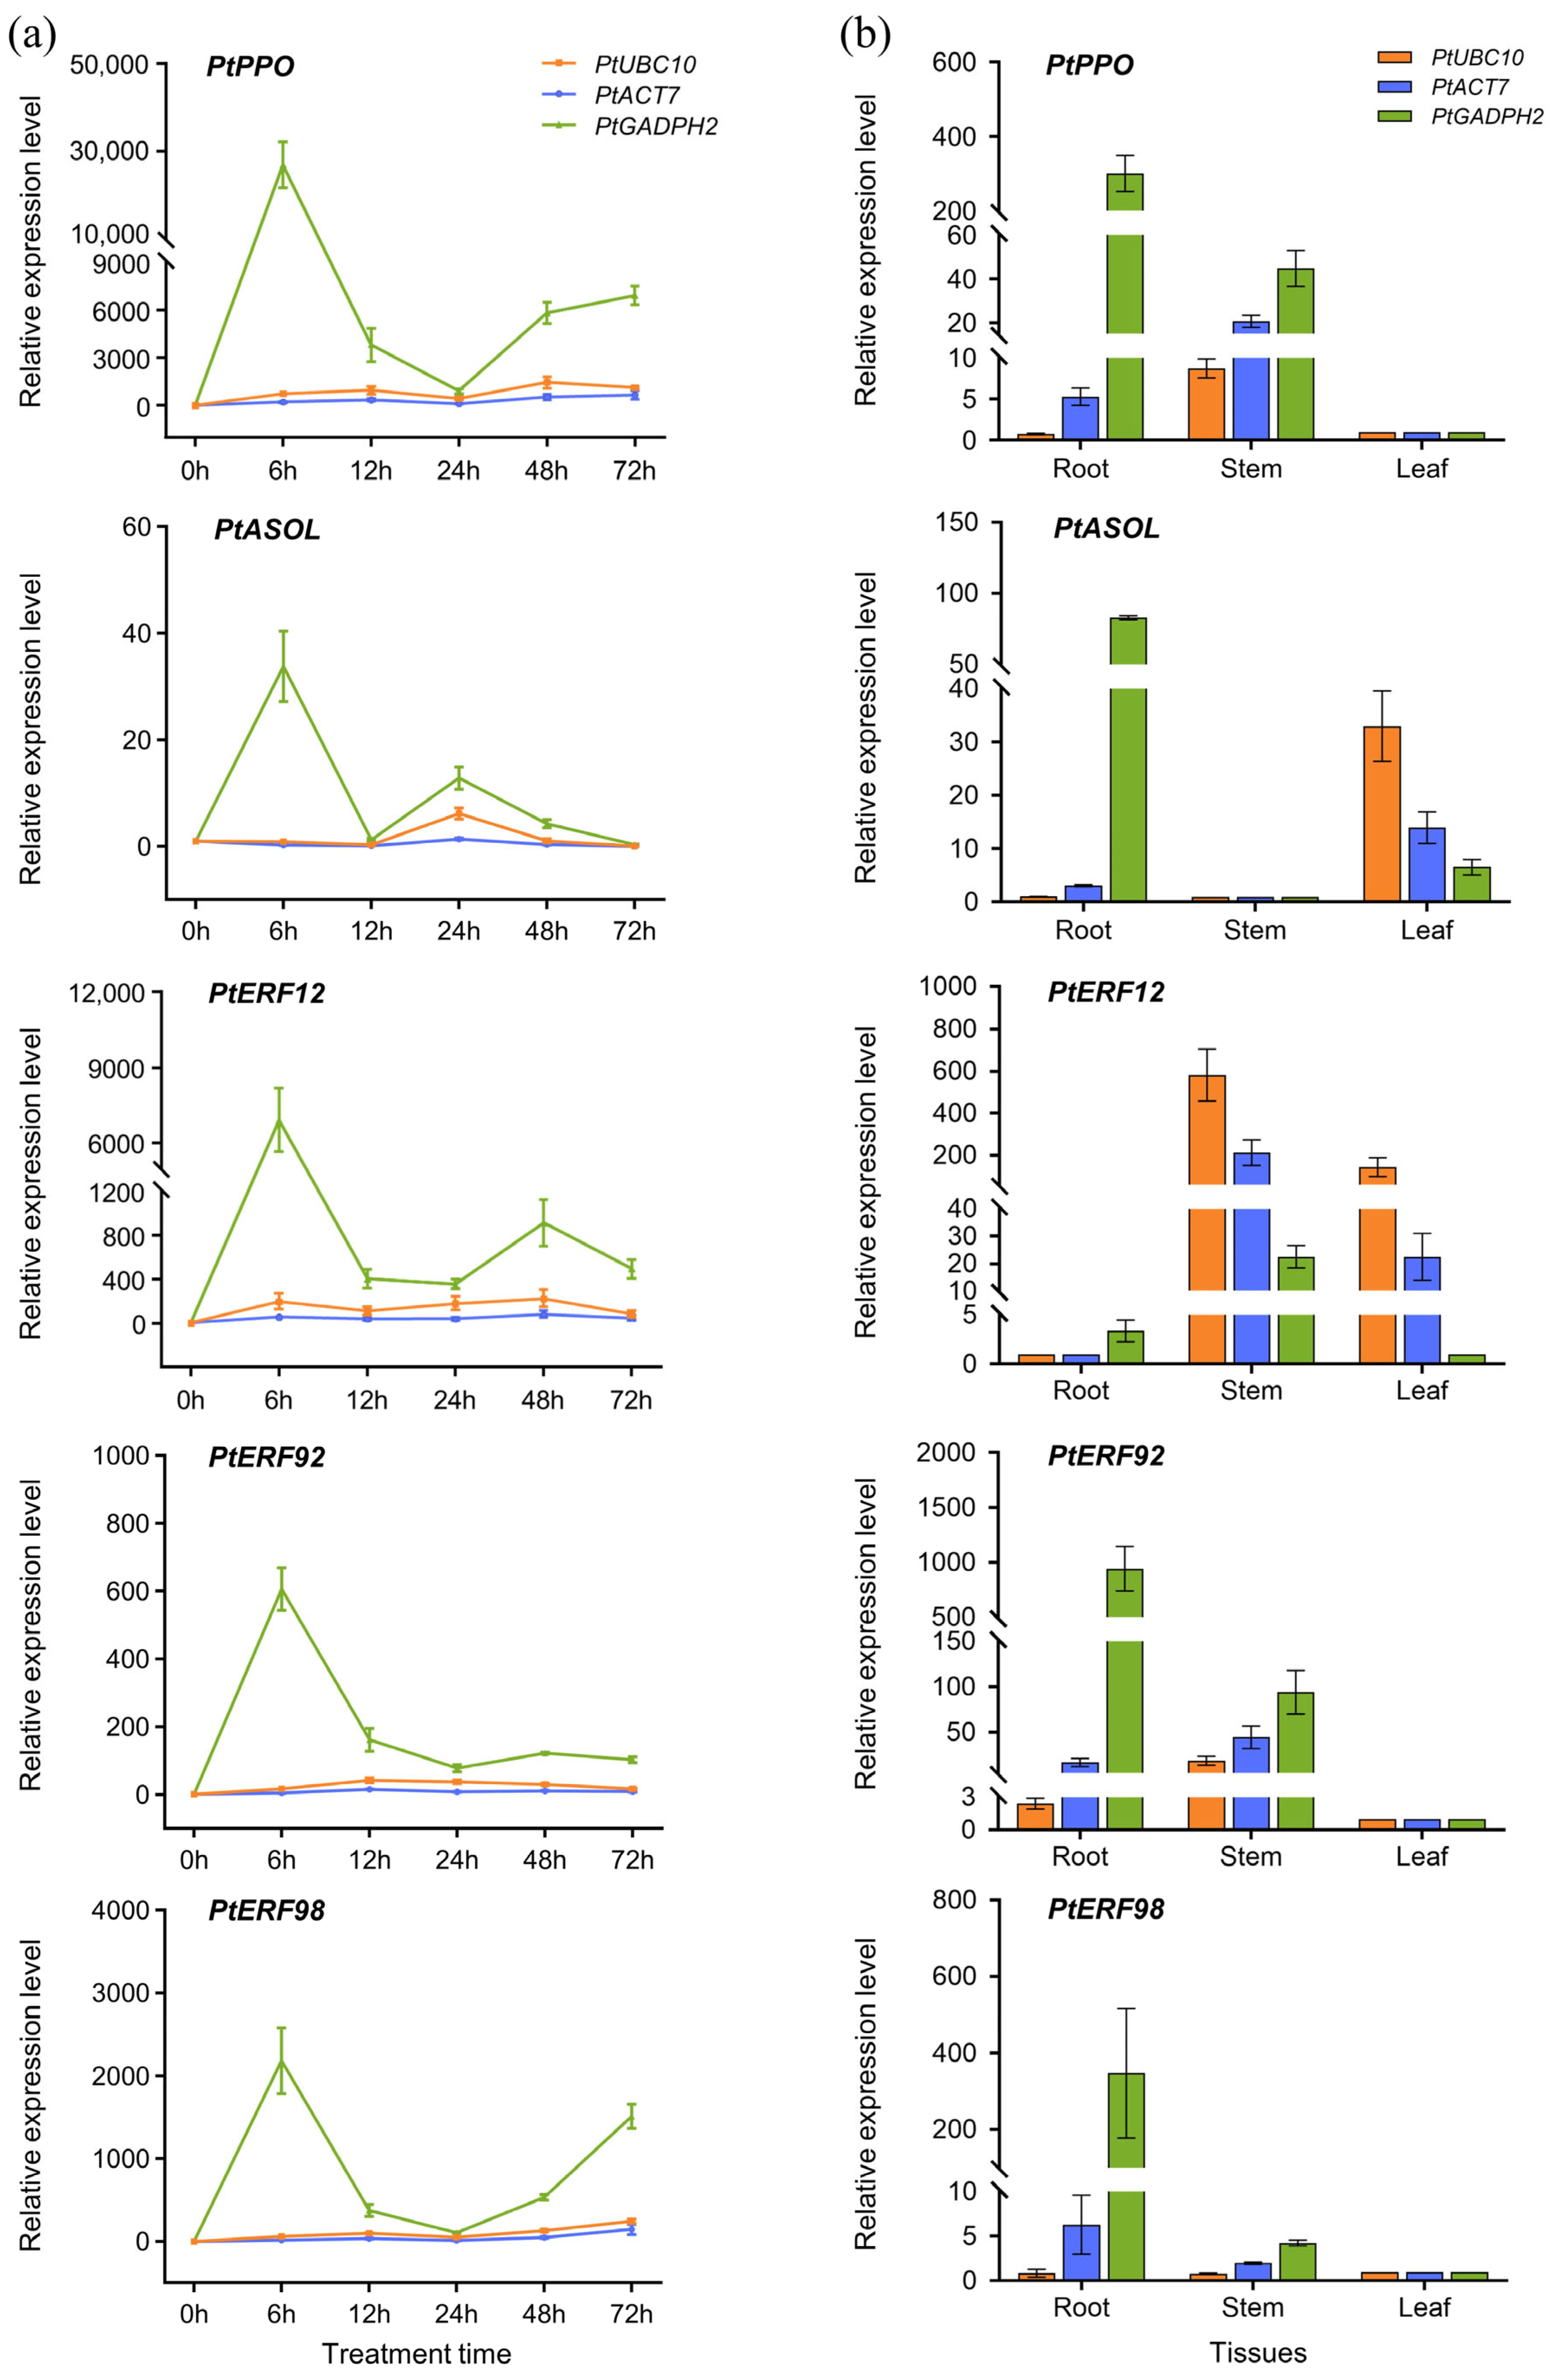
3.8. Validation of Recommended IRGs in P. thomsonii

To identify the most and least stable genes, we selected the two most stable IRGs (PtUBC10 and PtACT7) and the least unstable IRG (PtGADPH2) to verify the expression levels of five target genes related to delaying PPD during the ethephon treatment in P. thomsonii. These genes were filtered by comparing the RNA-seq data from the ethephon and water treatments (Figure 8). Among them, PtPPO encodes polyphenol oxidase and PtASOL encodes L-ascorbate oxidase, and both are associated with ROS scavenging. PtERF12, PtERF92, and PtPER98 are ethylene-responsive transcription factors involved in the ethylene-signaling pathway. A qRT-PCR analysis was conducted to measure the transcript levels using PtUBC10 or PtACT7 alone or in combination, and we found that the transcript levels of all five target genes detected were consistent with the transcriptome data and differed significantly from those of PtGADPH2 (Figure 8a, Figure S4). In addition, we also quantified the expression levels of the five target delaying PPD genes and performed the qRT-PCR analysis on different tissues (root, stem, and leaf) using the two most stable IRGs (PtUBC10 and PtACT7) and unstable IRG (PtGADPH2) (Figure 8b). We observed that the transcript levels of the target genes detected using PtUBC10 or PtACT7 as the IRG were similar, stable, and significantly different from the transcript levels of PtGADPH2 (Figure 8b). All of these results demonstrated that the IRGs selected from the transcriptome data using five different algorithms were reliable.

4. Discussion

4.1. Exogenous Application of Ethephon Delayed PPD of P. thomsonii Tuberous Roots

P. thomsonii is a dual-purpose plant recognized by the National Health Commission of China for its medicinal and food properties. It is widely cultivated in regions such as Hubei, Hunan, Guangdong, Guangxi, and Jiangxi [52]. In recent years, research has focused on delaying the PPD of fresh-cut P. thomsonii for storage and preservation purposes. Previous studies have shown that ROS production is an early event in its deterioration process [15,53]. Ethephon has been reported to reduce oxidative damage by enhancing the antioxidant levels and antioxidative enzyme activities [54]. Additionally, NaCl and citric acid have been found to reduce the MDA content by increasing the polyphenol oxidase (PPO) and POD activity, thereby delaying the browning [17,55]. In this study, P. thomsonii tuberous roots were treated with ethephon and compared to a water (control) treatment. The results showed that the ethephon-treated tuberous roots exhibited a delayed PPD process, indicating a clear preservation effect.

4.2. Selection of Candidate IRGs Is Indispensable to Analyzing the Gene Expression Patterns after Ethephon Treatment

The reliability and accuracy of an RT-qPCR analysis can be affected by factors such as RNA quality and reverse transcription efficiency [56,57]. Selecting reliable IRGs is crucial for a qRT-PCR analysis, as improper selection can impact the results or lead to incorrect conclusions [58]. However, appropriate IRGs vary among plant species, tissues, and experimental conditions [59,60]. For instance, studies on IRG stability in citrus have found that GAPDH is the most stable under drought stress, while ACT is the most stable under low-temperature stress [61]. In Benincasa hispida, TUA was identified as the optimal IRG under drought stress and ELF1α under low-temperature stress [62]. In this study, eight candidate housekeeping genes (PtGAPDH1, PtGAPDH2, PtACT7, PtTUBB4, PtUBC10, PtEF1, PtEIF3, and PtUBQ10) were chosen based on reported potential candidates and the transcriptome datasets of the P. thomsonii cultivar Volcano during ethephon treatments. We evaluated the specificity of PtUBQ10 primers in PCR detection and found them to be nonspecific. As a result, PtUBQ10 was excluded from further analysis. Then, we assessed the stability of the remaining seven genes’ IRGs using four commonly used methods: the ΔCt method, GeNorm, NormFinder, and BestKeeper. Our results showed that the different methods produced varying stability rankings for the same genes, however, the rankings obtained by the ΔCt method, GeNorm, and NormFinder were similar, while those obtained by BestKeeper differed significantly. This discrepancy may be attributed to differences in the algorithms used by each method [63].
To obtain a comprehensive stability ranking of the seven IRGs, we used RefFinder. Our results indicated that PtUBC10 and PtACT7 were the most stable IRGs under both the ethephon and water treatments. A further analysis using GeNorm, according to the Vn/Vn+1 value, revealed that the optimal combination of two stable IRGs could effectively correct systematic bias and produce more accurate expression results [64]. The V2/V3 values for all the ethephon- and water-treated samples were much lower than 0.15, indicating that the use of two IRGs was sufficient for relative quantitation and that the inclusion of a third IRG was unnecessary. Thus, based on the ranking results of the RefFinder analysis, PtUBC10 and PtACT7 were identified as the most suitable housekeeping genes for use in the ethephon- and water-treated experimental groups.
To assess the stability of our candidate IRGs, we normalized raw qRT-PCR data for polyphenol oxidase (PtPPO), L-ascorbate oxidase (PtASOL), and ethylene-responsive related genes (PtERF12, PtERF92, and PtPER98) using PtUBC10, PtACT7, and PtGADPH2 at various time points following ethephon treatment. The results indicated that, when the two most stable IRGs (PtUBC10 and PtACT7) were used for normalization, the expression patterns of the five target genes were consistent, with only slight differences in expression level. In contrast, when using the unstable IRG (PtGADPH2) for normalization, the expression levels of the five target genes showed significant differences in their expression patterns during certain time periods compared to when the stable IRGs were used. These findings demonstrated that the selection of appropriate IRGs is critical for accurately determining the expression levels of target genes.

5. Conclusions

In summary, our study suggested that an exogenous application of ethephon delays PPD in P. thomsonii tuberous roots by regulating the ethylene-signaling pathway to enhance ROS-scavenging capacity. Importantly, this study represents the first effort to identify suitable IRGs for normalizing the gene expression data in P. thomsonii under ethephon treatment using qRT-PCR. We evaluated and ranked the stability of eight candidate IRGs in ethephon- and water-treated samples using five different evaluation methods and validated our findings by analyzing the expressions of the PtPPO, PtASOL, PtERF12, PtERF92, and PtPER98 genes. Our results showed that, for P. thomsonii, PtUBC10 and PtACT7 were the most suitable IRGs for use in both the ethephon- and water-treated samples. These findings have important implications for extending the shelf life and improving the quality of P. thomsonii tuberous roots.

Supplementary Materials

The following supporting information can be downloaded at: https://www.mdpi.com/2311-7524/9/9/1014/s1, Figure S1: The differentially expressed genes (DEGs) identified in the P. thomsonii cultivar Volcano during various time points of ethephon treatments (0 h, 6 h, 12 h, 24 h, 48 h, and 72 h) compared to the water treatment (control); Figure S2: Comparison of differentially expressed genes (DEGs) identified between ethephon-treated vs. water-treated (control) samples at different time points in the P. thomsonii cultivar Volcano; Figure S3: Transcriptome data reveal expression profiles of eight candidate IRGs in the P. thomsonii cultivar Volcano under control (water treatment) and ethephon treatment at various time points; Figure S4: Transcript levels of PPD-delaying genes (PtPPO, PtASOL, PtERF12, PtERF92, and PtPER98) in the P. thomsonii cultivar Volcano during ethephon treatment at various time points; Table S1: Statistics on the number of differential gene expression in P. thomsonii following ethephon treatment; Table S2: Non-differentially expressed genes in P. thomsonii following ethephon treatment.

Author Contributions

Project design and coordinate, Y.L. (Yujia Liu), X.L. and B.L.; materials collection, C.M., J.C., T.Z. and H.Z.; scientific experiments, Y.L. (Yujia Liu), Y.L. (Ya Li) and B.H.; data analysis, B.Y. and Y.L. (Yuanlong Liu); writing—original draft preparation, Y.L. (Yujia Liu), Y.L. (Ya Li) and X.L; writing—review and editing, Y.L. (Yujia Liu), X.L. and B.L. All authors have read and agreed to the published version of the manuscript.

Funding

This work was supported by grants from the National Science Foundation of China (32000266), Basic and Applied Research Projects of Guangdong Province (2020A1515011438 and 2016KZDXM010), Key Fields Projects of Guangdong Province (2022ZDZX4044), the Open Fund of the Guangdong Provincial Key Laboratory of Utilization and Conservation of Food and Medicinal Resources in Northern Region (FMR2022002Z), Shaoguan Science and Technology Program (210726114532224 and 210805114531189) and Key Projects of Shaoguan University (SZ2022KJ04).

Data Availability Statement

The raw data supporting our conclusions of this current study are provided in the manuscript and Additional Files.

Acknowledgments

The authors would like to thank all colleagues from our laboratory for providing the useful technical assistance. We are very grateful to “Xia Rui’s Research Group of South China Agricultural University” for assistance with the biological data analyses. We also sincerely thank the editor and reviewers for critically evaluating this manuscript and providing constructive comments for its improvement.

Conflicts of Interest

The authors declare no competing interests.

References

  1. Liu, X.; Wang, F.; Chen, Y.; An, Y.; Cheng, L.; Wang, L.; Kong, D.; Zhao, W.; Tian, J.; Niu, Y.; et al. Research Progress on Chemical Components and Pharmacological Action of Solanum Lyratum Thunb. J. Pharm. Pharmacol. 2023, 75, 328–362. [Google Scholar] [CrossRef] [PubMed]
  2. Zhou, S.; Li, Y.; Hong, Y.; Zhong, Z.; Zhao, M. Puerarin Protects against Sepsis-Associated Encephalopathy by Inhibiting NLRP3/Caspase-1/GSDMD Pyroptosis Pathway and Reducing Blood-Brain Barrier Damage. Eur. J. Pharmacol. 2023, 945, 175616. [Google Scholar] [CrossRef] [PubMed]
  3. Ding, Y.; Li, L.; Peng, S.; Zhou, G.; Chen, S.; Wei, Y.; Xu, J.; Gu, H.; Li, J.; Liu, S.; et al. Puerarin Protects against Myocardial Ischemia/Reperfusion Injury by Inhibiting Ferroptosis. Biol. Pharm. Bull. 2023, 46, 524–532. [Google Scholar] [CrossRef]
  4. Liang, T.; Xu, X.; Ye, D.; Chen, W.; Gao, B.; Huang, Y. Correction to: Caspase/AIF/Apoptosis Pathway: A New Target of Puerarin for Diabetes Mellitus Therapy. Mol. Biol. Rep. 2022, 49, 3369–3372. [Google Scholar] [CrossRef] [PubMed]
  5. Mo, Q.; Li, S.; You, S.; Wang, D.; Zhang, J.; Li, M.; Wang, C. Puerarin Reduces Oxidative Damage and Photoaging Caused by UVA Radiation in Human Fibroblasts by Regulating Nrf2 and MAPK Signaling Pathways. Nutrients 2022, 14, 4724. [Google Scholar] [CrossRef] [PubMed]
  6. Zhang, X.; Lang, Y.; Li, X.; Li, Z.; Xu, Y.; Chu, H. The Protective Effect of Puerarin-Loaded Mesoporous Silicon Nanoparticles on Alcoholic Hepatitis through MTOR-Mediated Autophagy Pathway. Biomed. Microdevices 2022, 24, 37. [Google Scholar] [CrossRef]
  7. Cai, Y.; Gao, Q.; Meng, J.; Chen, L. Puerarin Suppresses Glycolysis and Increases Cisplatin Chemosensitivity in Oral Squamous Cell Carcinoma via FBXW7/MTOR Signaling. Nutr. Cancer 2023, 75, 1028–1037. [Google Scholar] [CrossRef]
  8. Lang, J.; Guo, Z.; Xing, S.; Sun, J.; Qiu, B.; Shu, Y.; Wang, Z.; Liu, G. Inhibitory Role of Puerarin on the A549 Lung Cancer Cell Line. Transl. Cancer Res. 2022, 11, 4117–4125. [Google Scholar] [CrossRef]
  9. Liu, X.; Huang, R.; Wan, J. Puerarin: A Potential Natural Neuroprotective Agent for Neurological Disorders. Biomed. Pharmacother. 2023, 162, 114581. [Google Scholar] [CrossRef]
  10. Zhang, W.; Xu, M.; Wen, S.; Wang, L.; Zhang, K.; Zhang, C.; Zou, H.; Gu, J.; Liu, X.; Bian, J.; et al. Puerarin Alleviates Cadmium-Induced Rat Neurocyte Injury by Alleviating Nrf2-Mediated Oxidative Stress and Inhibiting Mitochondrial Unfolded Protein Response. Ecotoxicol. Environ. Saf. 2022, 247, 114239. [Google Scholar] [CrossRef]
  11. Qu, F.; Sun, Z.J.; Xiong, W.Z.; Wang, S.; Sun, Z. Thoughts on Protection of Geographical Indication Intellectual Property of Kudzu. Acta Agric. Jiangxi 2011, 23, 172–175. [Google Scholar] [CrossRef]
  12. Ma, C.; Zheng, S.Y.; Zhuo, H.B. Study on Micropropagation of Pueraria thomsonii Benth. In Vitro. Guangdong Agric. Sci. 2013, 40, 28–35. [Google Scholar] [CrossRef]
  13. Zhang, G.; Liu, J.; Gao, M.; Kong, W.; Zhao, Q.; Shi, L.; Wang, Q. Tracing the Edible and Medicinal Plant Pueraria Montana and Its Products in the Marketplace Yields Subspecies Level Distinction Using DNA Barcoding and DNA Metabarcoding. Front. Pharmacol. 2020, 11, 336. [Google Scholar] [CrossRef]
  14. Cui, X.; Cai, Y.; Chen, R.; Liu, Q. First Report of Bacterial Leaf Spot Disease on Pueraria Montana var. thomsonii Caused by Robbsia Andropogonis in China. Plant Dis. 2022, 106, 2985. [Google Scholar] [CrossRef] [PubMed]
  15. Vanderschuren, H.; Nyaboga, E.; Poon, J.S.; Baerenfaller, K.; Grossmann, J.; Hirsch-Hoffmann, M.; Kirchgessner, N.; Nanni, P.; Gruissem, W. Large-Scale Proteomics of the Cassava Storage Root and Identification of a Target Gene to Reduce Postharvest Deterioration. Plant Cell 2014, 26, 1913–1924. [Google Scholar] [CrossRef] [PubMed]
  16. Dong, X.; Mei, Y.; Wang, J.; Huang, N.; Cai, S. Research progress on a medicinal and edible plant Radix puerariae. J. Chang. Veg. 2020, 43–47. [Google Scholar]
  17. Zhang, L.; Song, K.; Hui, G.U.; Jia, Z.; Chang, J.; Hong, K.; Hou, X. Effect of Citric Acid Treatment on Browning of Fresh-Cut Pueraria. Chin. J. Trop. Crops 2017, 38, 1143–1148. [Google Scholar] [CrossRef]
  18. Liu, S.; Du, X. Enzymatic Browning and Its Reaction under Control during Radix Pueraria Processing. Acad. Period. Farm Prod. Process. 2011, 40–45. [Google Scholar]
  19. Ma, C.; Wu, Y.; Chen, S.; Wang, G. Effect of Storage Time and Manner on the Quality of Pueraria thomsonii Benth. North. Hortic. 2016, 367, 133–135. [Google Scholar] [CrossRef]
  20. Ren, M.Y.; Feng, R.J.; Shi, H.R.; Lu, L.F.; Yun, T.Y.; Peng, M.; Guan, X.; Zhang, H.; Wang, J.Y.; Zhang, X.Y.; et al. Expression Patterns of Members of the Ethylene Signaling-Related Gene Families in Response to Dehydration Stresses in Cassava. PLoS ONE 2017, 12, e0177621. [Google Scholar] [CrossRef]
  21. Moscoso-Ramírez, P.A.; Palou, L. Effect of Ethylene Degreening on the Development of Postharvest Penicillium Molds and Fruit Quality of Early Season Citrus Fruit. Postharvest Biol. Technol. 2014, 91, 1–8. [Google Scholar] [CrossRef]
  22. Mayuoni, L.; Sharabi-Schwager, M.; Feldmesser, E.; Porat, R. Effects of Ethylene Degreening on the Transcriptome of Mandarin Flesh. Postharvest Biol. Technol. 2011, 60, 75–82. [Google Scholar] [CrossRef]
  23. Dai, Z.J.; Wang, Y.; Wang, X.T.; Yang, Q.; Zhang, Y.Y.; Bao-Quan, L.I.; Wang, L.P.; Centre, C.D. Reference Genes Selection for Real-Time Quantitative PCR under Rough Dwarf Virus Induced Disease in Maize. Plant Physiol. J. 2019, 55, 1545–1553. [Google Scholar] [CrossRef]
  24. Shakeel, M.; Rodriguez, A.; Tahir, U.B.; Jin, F. Gene Expression Studies of Reference Genes for Quantitative Real-Time PCR: An Overview in Insects. Biotechnol. Lett. 2018, 40, 227–236. [Google Scholar] [CrossRef] [PubMed]
  25. Guénin, S.; Mauriat, M.; Pelloux, J.; Van Wuytswinkel, O.; Bellini, C.; Gutierrez, L. Normalization of QRT-PCR Data: The Necessity of Adopting a Systematic, Experimental Conditions-Specific, Validation of References. J. Exp. Bot. 2009, 60, 487–493. [Google Scholar] [CrossRef] [PubMed]
  26. Hu, A.; Yang, X.; Zhu, J.; Wang, X.; Liu, J.; Wang, J.; Wu, H.; Zhang, H.; Zhang, H. Selection and Validation of Appropriate Reference Genes for RT-QPCR Analysis of Nitraria Sibirica under Various Abiotic Stresses. BMC Plant Biol. 2022, 22, 592. [Google Scholar] [CrossRef]
  27. Yao, J.; Zhu, G.; Liang, D.; He, B.; Wang, Y.; Cai, Y.; Zhang, Q. Reference Gene Selection for QPCR Analysis in Schima Superba under Abiotic Stress. Genes 2022, 13, 1887. [Google Scholar] [CrossRef] [PubMed]
  28. Zhou, Q.; Xu, F.; Zeng, L.; Zhu, L.; Wang, Y.; Wang, B.; Ma, X. Selection and validation of appropriate reference genes for quantitative real-time PCR analysis in Panax vietnamensis var. fuscidiscus. Plant Physiol. J. 2020, 56, 329–335. [Google Scholar] [CrossRef]
  29. Hu, W.; Tie, W.; Ou, W.; Yan, Y.; Kong, H.; Zuo, J.; Ding, X.; Ding, Z.; Liu, Y.; Wu, C.; et al. Crosstalk between Calcium and Melatonin Affects Postharvest Physiological Deterioration and Quality Loss in Cassava. Postharvest Biol. Technol. 2018, 140, 42–49. [Google Scholar] [CrossRef]
  30. Trapnell, C.; Pachter, L.; Salzberg, S.L. TopHat: Discovering Splice Junctions with RNA-Seq. Bioinformatics 2009, 25, 1105–1111. [Google Scholar] [CrossRef]
  31. Trapnell, C.; Roberts, A.; Goff, L.; Pertea, G.; Kim, D.; Kelley, D.R.; Pimentel, H.; Salzberg, S.L.; Rinn, J.L.; Pachter, L. Differential Gene and Transcript Expression Analysis of RNA-Seq Experiments with TopHat and Cufflinks. Nat. Protoc. 2012, 7, 562–578. [Google Scholar] [CrossRef] [PubMed]
  32. Wang, L.; Feng, Z.; Wang, X.; Wang, X.; Zhang, X. DEGseq: An R Package for Identifying Differentially Expressed Genes from RNA-Seq Data. Bioinformatics 2010, 26, 136–138. [Google Scholar] [CrossRef]
  33. Ovesná, J.; Kučera, L.; Vaculová, K.; Štrymplová, K.; Svobodová, I.; Milella, L. Validation of the β-Amy1 Transcription Profiling Assay and Selection of Reference Genes Suited for a RT-QPCR Assay in Developing Barley Caryopsis. PLoS ONE 2012, 7, e41886. [Google Scholar] [CrossRef] [PubMed]
  34. Lin, S.; Xu, S.; Huang, L.; Qiu, F.; Wu, J. Selection and Validation of Reference Genes for Normalization of RT-QPCR Analysis in Developing and Abiotic-Stressed Tissues of Loquat (Eriobotrya Japonica). Phyton-Int. J. Exp. Bot. 2020, 92, 1181–1201. [Google Scholar] [CrossRef]
  35. Kaczmarczyk, A.; Bowra, S.; Elek, Z.; Vincze, E. Quantitative RT-PCR Based Platform for Rapid Quantification of the Transcripts of Highly Homologous Multigene Families and Their Members during Grain Development. BMC Plant Biol. 2012, 12, 184. [Google Scholar] [CrossRef] [PubMed]
  36. Guo, L.; Li, Y.; Wei, Z.; Wang, C.; Hou, X. Reference Genes Selection of Paeonia Ostii “Fengdan” under Osmotic Stresses and Hormone Treatments by RT-QPCR. Mol. Biol. Rep. 2023, 50, 133–143. [Google Scholar] [CrossRef] [PubMed]
  37. Yin, H.; Yin, D.; Zhang, M.; Gao, Z.; Tuluhong, M.; Li, X.; Li, J.; Li, B.; Cui, G. Validation of Sppropriate Reference Genes for QRT-PCR Normalization in Oat (Avena Sativa L.) under UV-B and High-Light Stresses. Int. J. Mol. Sci. 2022, 23, 11187. [Google Scholar] [CrossRef]
  38. Vinje, M.A.; Willis, D.K.; Duke, S.H.; Henson, C.A. Differential RNA Expression of Bmy1 during Barley Seed Development and the Association with β-Amylase Accumulation, Activity, and Total Protein. Plant Physiol. Biochem. 2011, 49, 39–45. [Google Scholar] [CrossRef]
  39. Ferdous, J.; Li, Y.; Reid, N.; Langridge, P.; Shi, B.; Tricker, P.J. Identification of Reference Genes for Quantitative Expression Analysis of MicroRNAs and MRNAs in Barley under Various Stress Conditions. PLoS ONE 2015, 10, e0118503. [Google Scholar] [CrossRef]
  40. Kundu, A.; Patel, A.; Pal, A. Defining Reference Genes for QPCR Normalization to Study Biotic and Abiotic Stress Responses in Vigna Mungo. Plant Cell Rep. 2013, 32, 1647–1658. [Google Scholar] [CrossRef]
  41. Vandesompele, J.; De Preter, K.; Pattyn, F.; Poppe, B.; Van Roy, N.; De Paepe, A.; Speleman, F. Accurate Normalization of Real-Time Quantitative RT-PCR Data by Geometric Averaging of Multiple Internal Control Genes. Genome Biol. 2002, 3, research0034. [Google Scholar] [CrossRef] [PubMed]
  42. Andersen, C.L.; Jensen, J.L.; Ørntoft, T.F. Normalization of Real-Time Quantitative Reverse Transcription-PCR Data: A Model-Based Variance Estimation Approach to Identify Genes Suited for Normalization, Applied to Bladder and Colon Cancer Data Sets. Cancer Res. 2004, 64, 5245–5250. [Google Scholar] [CrossRef] [PubMed]
  43. Pfaffl, M.W.; Tichopad, A.; Prgomet, C.; Neuvians, T.P. Determination of Stable Housekeeping Genes, Differentially Regulated Target Genes and Sample Integrity: BestKeeper-Excel-Based Tool Using Pair-Wise Correlations. Biotechnol. Lett. 2004, 26, 509–515. [Google Scholar] [CrossRef] [PubMed]
  44. Silver, N.; Best, S.; Jiang, J.; Thein, S.L. Selection of Housekeeping Genes for Gene Expression Studies in Human Reticulocytes Using Real-Time PCR. BMC Mol. Biol. 2006, 7, 33. [Google Scholar] [CrossRef] [PubMed]
  45. Long, X.; He, B.; Gao, X.; Qin, Y.; Yang, J.; Fang, Y.; Qi, J.; Tang, C. Validation of Reference Genes for Quantitative Real-Time PCR during Latex Regeneration in Rubber Tree. Gene 2015, 563, 190–195. [Google Scholar] [CrossRef] [PubMed]
  46. Xie, F.; Xiao, P.; Chen, D.; Xu, L.; Zhang, B. miRDeepFinder: A MiRNA Analysis Tool for Deep Sequencing of Plant Small RNAs. Plant Mol. Biol. 2012, 80, 75–84. [Google Scholar] [CrossRef]
  47. Xie, F.; Wang, J.; Zhang, B. RefFinder: A Web-based Tool for Comprehensively Analyzing and Identifying Reference Genes. Funct. Integr. Genomics. 2023, 23, 125. [Google Scholar] [CrossRef]
  48. Li, Q.; Zhu, C.; Li, X.; Wu, B.; Yi, J.; Fu, H.; Chen, D.; Zhang, H. Comprehensive evaluation and identification index of drought resistance at germination stage of rice. Acta Agric. Boreali-Occident. Sin. 2023, 32, 18–32. [Google Scholar] [CrossRef]
  49. Zhang, R.; Hussain, S.; Wang, Y.; Liu, Y.; Li, Q.; Chen, Y.; Wei, H.; Gao, P.; Dai, Q. Comprehensive Evaluation of Salt Tolerance in Rice (Oryza Sativa L.) Germplasm at the Germination Stage. Agronomy 2021, 11, 1569. [Google Scholar] [CrossRef]
  50. Taylor, S.; Wakem, M.; Dijkman, G.; Alsarraj, M.; Nguyen, M. A Practical Approach to RT-QPCR-Publishing Data That Conform to the MIQE Guidelines. Methods 2010, 50, S1–S5. [Google Scholar] [CrossRef]
  51. Li, F.; Sun, J.; Men, J.; Li, H.; Wang, J. Selection and Validation of Reference Genes for RT-QPCR Analysis in the Pericarp of Litchi Chinensis. Biol. Plant. 2020, 66, 103–111. [Google Scholar] [CrossRef]
  52. Shang, X.; Cao, S.; Yan, H.; Chen, Y.; Xiao, L.; Wang, Y.; Ou, K.; Qin, X.; Gan, X. Development status and countermeasures of Pueraria lobata (Willd.) Ohwi var. thomsoni (Benth.) van der Maesen industry in Guangxi. J. South. Agric. 2021, 52, 1510–1519. [Google Scholar] [CrossRef]
  53. Zidenga, T.; Leyva-Guerrero, E.; Moon, H.; Siritunga, D.; Sayre, R. Extending Cassava Root Shelf Life via Reduction of Reactive Oxygen Species Production. Plant Physiol. 2012, 159, 1396–1407. [Google Scholar] [CrossRef]
  54. Lv, J.; Zhou, Y.; Ge, Y.; Li, C.; Zhang, M. Effects of 1-Methylcyclopropene and Ethephon Treatment on Physiological Changes and Reactive Oxygen Metabolism of Postharvest “Golden Delicious” Apple Fruit during Storage at Ambient Temperature. Sci. Technol. Food Ind. 2017, 38, 297–302. [Google Scholar] [CrossRef]
  55. Song, K.H.; Zhang, L.B.; Hui, G.U.; Jia, Z.W.; Chang, J.M. Study on the Mechanism of NaCl Treatment Delaying Browning of Fresh-Cut Pueraria. Sci. Technol. Food Ind. 2018, 39, 285–288+295. [Google Scholar] [CrossRef]
  56. Liu, W.; Deng, Y.; Zhou, Y.; Chen, H.; Dong, Y.; Wang, N.; Li, X.; Jameel, A.; Yang, H.; Zhang, M.; et al. Normalization for Relative Quantification of MRNA and MicroRNA in Soybean Exposed to Various Abiotic Stresses. PLoS ONE 2016, 11, e0155606. [Google Scholar] [CrossRef] [PubMed]
  57. Li, J.; Han, J.; Hu, Y.; Yang, J. Selection of Reference Genes for Quantitative Real-Time PCR during Flower Development in Tree Peony (Paeonia Suffruticosa Andr.). Front. Plant Sci. 2016, 7, 516. [Google Scholar] [CrossRef] [PubMed]
  58. Lü, J.; Yang, C.; Zhang, Y.; Pan, H. Selection of Reference Genes for the Normalization of RT-QPCR Data in Gene Expression Studies in Insects: A Systematic Review. Front. Physiol. 2018, 9, 1560. [Google Scholar] [CrossRef] [PubMed]
  59. Zhao, Z.; Zhang, Z.; Ding, Z.; Meng, H.; Shen, R.; Tang, H.; Liu, Y.-G.; Chen, L. Public-Transcriptome-Database-Assisted Selection and Validation of Reliable Reference Genes for QRT-PCR in Rice. Sci. China Life Sci. 2020, 63, 92–101. [Google Scholar] [CrossRef]
  60. Mafra, V.; Kubo, K.S.; Alves-Ferreira, M.; Ribeiro-Alves, M.; Stuart, R.M.; Boava, L.P.; Rodrigues, C.M.; Machado, M.A. Reference Genes for Accurate Transcript Normalization in Citrus Genotypes under Different Experimental Conditions. PLoS ONE 2012, 7, e31263. [Google Scholar] [CrossRef]
  61. Xiao, C.; Yan, J.W.; Long, G.Y.; Dai, S.M.; Li, D.; Deng, Z.N. Stability Evaluation of Reference Genes in Citrus. J. Fruit Sci. 2012, 29, 978–984. [Google Scholar] [CrossRef]
  62. Ye, X.; Zhu, H.; Lin, H.; Liu, J.; Wang, B.; Chen, M.; Wen, Q. Screening and evaluation of reference genes for RT-qPCR in wax gourd (Benincasa hispida Cogn.). J. Nucl. Agric. Sci. 2019, 33, 473–481. [Google Scholar] [CrossRef]
  63. Ransbotyn, V.; Reusch, T.B.H. Housekeeping Gene Selection for Quantitative Real-Time PCR Assays in the Seagrass Zostera Marina Subjected to Heat Stress. Limnol. Oceanogr. Methods 2006, 4, 367–373. [Google Scholar] [CrossRef]
  64. Hu, R.; Qi, G.; Kong, Y.; Kong, D.; Gao, Q.; Zhou, G. Comprehensive Analysis of NAC Domain Transcription Factor Gene Family in Populus Trichocarpa. BMC Plant Biol. 2010, 10, 145. [Google Scholar] [CrossRef]
Figure 1. Evaluation of PPD in tuberous roots of the P. thomsonii cultivar Volcano. (a) Schematic presentation of the P. thomsonii plant. (b) Measurement of starch concentration and browning degree of tuberous roots at 0, 1, 2, and 4 days. Each bar indicates the mean ± SE of triplicate assays and asterisks indicate significant differences between day 0 and the number of days a sample was stored (*, p < 0.05). (c) P. thomsonii tuberous roots display significant appearance and physiological changes during the PPD process. The roots were incubated at a constant temperature of 28 °C in the dark. Photographs were taken at 0, 1, 2, and 4 days after storage to document changes in PPD.
Horticulturae 09 01014 g001
Figure 2. Effect of ethephon on PPD of tuberous roots in the P. thomsonii cultivar Volcano. Tuberous roots were sliced into 5 mm thick sections and treated with either a control (soaking in water) or ethephon at concentrations of 1% or 3% for 2 h. The root slices were then incubated at a constant temperature of 28 °C in the dark. Photographs were taken at 0, 6, 12, 24, 48, and 72 h after treatment to document changes in PPD.
Horticulturae 09 01014 g002
Figure 3. Effect of ethephon on the accumulation of MDA (a) and H2O2 (b), as well as the activities of POD (c) and SOD (d), during the PPD process in the P. thomsonii cultivar Volcano. Data represent means ± SE calculated from three biological replicates.
Horticulturae 09 01014 g003
Figure 4. Primer specificity and amplification size. (a) Amplification of PCR products for eight candidate IRGs in agarose gel (1.5%) electrophoresis. Lane M represents the DNA Marker; lanes 1–8 represent amplicons for PtGAPDH2, PtGAPDH1, PtEIF3, PtUBQ10, PtEF1, PtUBC10, PtACT7, and PtTUBB4 from P. thomsonii, respectively. Graphs (bh) represents melting curves for seven candidate IRGs to assess primer specificity.
Horticulturae 09 01014 g004
Figure 5. Expression levels of eight candidate IRGs in qRT-PCR experimental samples. The data are presented as Cq values for each IRGs across all samples. The median is indicated by the horizontal line across the box, while the box represents the 25th and 75th percentiles. The whiskers show the maximum and minimum values, and points represent the average. The graphs present the data for the (a) ethephon treatment, and (b) water treatment.
Horticulturae 09 01014 g005
Figure 6. Optimal number of IRGs for normalization determined by pairwise variation (V) analysis with GeNorm software. The average pairwise variations (Vn/Vn+1) were analyzed to measure the effect of adding the reference gene in the qRT-PCR. The term ‘water-treated’ on the x-axis denotes all samples of P. thomsonii tuberous roots treated with water, while ‘ethephon-treated’ refers to all samples of P. thomsonii tuberous roots treated with ethephon. The y-axis represents the pairwise variation (V).
Horticulturae 09 01014 g006
Figure 7. Expression stability of candidate IRGs analyzed by RefFinder: (a) ethephon treatment and (b) water treatment.
Horticulturae 09 01014 g007
Figure 8. qRT-PCR analysis of the relative expression levels of PPD-delaying genes (PtPPO, PtASOL, PtERF12, PtERF92, and PtPER98) normalized to selected IRGs (PtUBC10, PtACT7, and PtGADPH2) during ethephon treatment at various time points (a), and in different tissues (b), respectively.
Horticulturae 09 01014 g008
Table 1. Candidate IRGs and primer sequences.
No.GeneGene IDPrimer Sequences (Forward/Reverse)Amplicom Length (bp)Tm (°C)E (%)R2
1PtGAPDH1 [33]Pmon004G015005’-GAAAGTTCTTGGTGTCGGA-3’
5’-TTAAAAGGTGGAATGGCTA-3’
103 bp56.0900.994
2PtGAPDH2Pmon007G034945’-TCACCATCTTTATCCACACTC-3’
5’-CACTTCTCTTCACCTTTTCCT-3’
127 bp57.01060.995
3PtEIF3 [34]Pmon010G012805’-TCGTATAAAAGAGAGAGAC-3’
5’-TTGAGTAAAAACTGACATC-3’
149 bp55.2--
4PtUBQ10 [35]Pmon003G028955’-AAAGGCAAAGATCCAAGAC-3’
5’-ATACCTCCCCTCAGACGAA-3’
153 bp55.4--
5PtEF1 [36]Novel050735’-AGGTTCTTCTGGATGGTTC-3’
5’-TTGTCGGATTTTCTTGGTA-3’
115 bp56.33040.969
6PtUBC10 [37]Pmon010G025415’-AACTATTTCGAAGGTGTTG-3’
5’-CGTACTTGTTCCTGTCTGT-3’
113 bp57.41030.992
7PtACT7 [38]Pmon003G051195’-TGTTCTTAGTGGTGGCTCA-3’
5’-ATATTTTCTTTCTGGTGGA-3’
121 bp59.11070.995
8PtTUBB4 [39]Pmon002G028745’-TGGAAACTCGACCTCGATT-3’
5’-ATGTTGCTCTCTGCCTCTG-3’
141 bp58.81040.993
Table 2. Membership function of stability IRGs under different extrinsic conditions.
Candidate GeneEthephon-TreatedWater-TreatedMembership Function Analysis
Delta CTGeNorm (M1)Normfinder (M2)Bestkeeper (SD ± CV)Delta CTGeNorm (M1)Normfinder (M2)Bestkeeper (SD ± CV)Principal Components ValueMembership Function ValueD-ValueRanking
StabilityRankingStabilityRankingStabilityRankingStabilityRankingStabilityRankingStabilityRankingStabilityRankingStabilityRankingX1X2X3μ1μ2μ3
PtACT71.6720.041310.0524.53 ± 1.2242.1710.036211.0418.4 ± 2.186−1.34540.46200.36360.4168−0.2128−0.32680.10762
PtTUBB41.8240.041310.0754.67 ± 1.2252.3820.036211.5736.75 ± 2.475−0.8446−0.13160.73320.20800.0232−0.46760.01923
PtUBC101.4810.043130.0413.43 ± 0.7632.4730.0831.5626.99 ± 1.621−0.9374−0.7342−0.70090.24670.26280.07880.21451
PtGADPH11.7130.066240.0535.03 ± 1.463.0160.134172.41610.25 ± 2.9320.50271.0172−1.4941−0.3535−0.43360.3810−0.21505
PtGADPH21.8750.075950.0643.41 ± 1.0923.1270.126662.5876.59 ± 1.8630.7629−1.0732−0.8311−0.46190.39760.1284−0.13104
PtEIF32.2870.083460.0965.97 ± 2.1272.7340.118351.9149.36 ± 2.3170.80781.44190.7989−0.4806−0.6024−0.4927−0.51227
PtEF12.2260.094570.1173.19 ± 1.1612.8450.10942.1656.75 ± 2.341.0539−0.98221.1303−0.58320.3614−0.6190−0.36636
Notes: X1, X2, and X3 are principal component values corresponding to each method; and µ1, µ2, and µ3 are membership function values corresponding to each IRG.
Disclaimer/Publisher’s Note: The statements, opinions and data contained in all publications are solely those of the individual author(s) and contributor(s) and not of MDPI and/or the editor(s). MDPI and/or the editor(s) disclaim responsibility for any injury to people or property resulting from any ideas, methods, instructions or products referred to in the content.

