Article

Determining the Relationship between Aroma and Quality of Bao-Chung Tea by Solid-Phase Microextraction (SPME) and Electronic Nose Analyses

1
Plant Technology Research Center, Agricultural Technology Research Institute, Hsinchu 300, Taiwan
2
Tea Research and Extension Station (TRES), Taoyuan 326, Taiwan
*
Author to whom correspondence should be addressed.
Retired.
Horticulturae 2023, 9(8), 930; https://doi.org/10.3390/horticulturae9080930
Submission received: 6 July 2023 / Revised: 26 July 2023 / Accepted: 3 August 2023 / Published: 16 August 2023
(This article belongs to the Special Issue Flavor Chemistry and Sensory Evaluation of Horticultural Products)

Abstract

:
Despite extensive studies, the relationship between the quality/quantity of tea odorants and oolong tea quality remains unclear. To investigate the key components affecting Bao-chung tea quality, we collected samples of different grades from a tea-tasting competition and determined the content and composition of volatile components and individual catechins using gas chromatography–mass spectrometry and high-performance liquid chromatography. We used an electronic nose (E-nose) to collect odor component signals and established a quality recognition model. The different tea grades did not significantly differ in catechin content, but their specific odor intensity and proportion of odor components varied significantly. Linear discriminant analysis showed that the intensity and proportion of volatile organic compounds could be used for distinguishing the different grades of Bao-chung tea. By combining different quantities of indole, linalool, and butanoic acid and proportions of p-cymene, cis-β-ocimene, nonanal, allo-ocimene, cis-jasmone, and α-farnesene, the ability to distinguish among Bao-chung tea grades was significantly improved. Our results revealed that the quality of Bao-chung tea should be evaluated based on the combined perception of odor component intensity and proportion rather than solely relying on the concentration or composition of specific compounds. Therefore, individuals can judge a Bao-chung tea grade based on the combined perception of odor component intensity and proportion. The E-nose can be used to identify Bao-chung tea grades based on its ability to determine the odorant composition.

1. Introduction

Oolong tea generally refers to a wide range of partially oxidized (partially fermented) varieties of tea, which are categorized based on their aroma characteristics and the production process used to prepare them [1]. In Taiwan, partially oxidized teas include Bao-chung, ball-type oolong, oriental beauty, and Tieh-Kuan-Yin teas. Bao-chung tea consists of strip-shaped, partially oxidized tea leaves with pleasant floral notes [2]. By contrast, ball-shaped oolong tea consists of spherical, partially oxidized tea leaves, which usually exude floral, fruity, and roasted aromas [3].
Understanding oolong tea quality and characteristics is important for deconstructing the combination of compounds that afford its unique olfactory signature and for developing new tea characterization technologies. In recent years, the effects of various tea quality measures, such as the type of tea production technology used, tea variety, cultivation environment, fertilizer management, and severity of insect damage, have been previously investigated [4,5]. Several previous studies have focused on specific tea aroma compounds (such as indole, linalool, nonanal, and cis-jasmone) attributable to different production processes [2,6] and have mainly explored variations in tea composition originating from the cultivation and manufacturing perspectives. To improve tea quality, the key components that affect tea quality must first be identified before the component proportions that give rise to a given set of tea characteristics can be determined [7,8,9].
The relationship between the quality of green and black tea varieties and their volatile and non-volatile components has been intensively investigated. High-quality black tea generally contains high contents of theaflavin [10,11] and some particular aroma compounds [12,13]. However, higher-grade green teas taste bitter and astringent despite having high amounts of sweet and umami components [14,15]. Specific non-volatile compounds such as catechins, theaflavins, and thearubigins may be used to distinguish between quality grades of green or black tea. However, few studies have explored the relationship between the quality and chemical composition of partially oxidized teas [5].
In this study, we investigated the relationship between aroma components and the quality of a partially oxidized tea. Our study focused on Bao-chung tea (an elegant tea with a flower-like fragrance and refreshing taste [3]) produced from the Chin-Shin-Oolong variety, which is considered the most popular variety of Bao-chung tea among tea drinkers. Deconstructing some of the fermented components that affect tea quality is challenging. To reduce the number of factors that influence the quality-related components of Bao-chung tea, we collected stable-grade tea samples of the same variety, which were prepared using the same production process as those used by participants from different competitions. These participants may have used other field management and manufacturing processes for the same variety of Bao-chung tea.
Gas chromatography–mass spectrometry (GC–MS) has long been used to analyze the quality and quantity of specific tea aroma components [16,17,18] because of its ability to separate, identify, and quantify the volatile components present in tea. We used GC–MS to examine the relationship between specific aroma compounds and Bao-chung tea grades to prove that this aroma information could serve as a determinant index for grading Bao-chung tea quality and be the foundation of the electronic nose (E-nose) technology. An E-nose is capable of aroma sensing and identification and can be used as a rapid technique for grading Bao-chung tea quality.
The metal oxide semiconductor-based E-nose is a type of E-nose technology that facilitates a rapid differentiation of aromas [19]. Although this E-nose cannot distinguish individual chemical components, it can identify complex odors using sensor arrays and has been extensively proven to be effective in discriminating tea aromas [19,20]. Recently, some studies have used E-noses with electronic tongues or spectral analyses to distinguish the quality, variety, and origins of various teas [19,20]. Useful results have been obtained previously, but the precise origin of the odor differential effects remains challenging because of the difficulty in analyzing individual odor components using the E-nose. Although the E-nose can be used for various odor discrimination applications, it cannot be used to identify which odor molecules are responsible for the discrimination. By contrast, GC–MS analysis can provide additional experimental data to help elucidate the E-nose discrimination results.
Human olfaction can distinguish a wide range of odors; however, understanding how these compounds can be utilized to assess tea quality remains challenging. Comprehending the olfactory compositions that influence tea quality is an essential pathway to improving overall characteristics of tea. Therefore, this study employs the widely used linear discriminant analysis (LDA) to link GC–MS, the E-nose technology, and human sensory evaluations. By doing so, we aim to gain a deeper understanding of how the concentration and proportional composition of different odor compounds affect tea quality, thereby providing valuable insights for enhancing tea quality in the future.
In addition, tea aroma may be affected by the properties of tea extraction solvents [21]. Therefore, to prevent solvents from affecting the properties of the teas, most previous studies used deionized water or NaCl additives in the extraction step [21,22]. Although earlier studies have confirmed that different extracts affect the composition of tea aroma [17,21], data on whether different solvents affect the performance of volatile organic compounds (VOCs) in tea quality grading are scarce. To confirm and collect the maximum information on the quality and quantity of aroma components that are similar to those assessed by judges evaluating brewed tea, we studied two extracts with different mineral compositions to understand how different extracts affect the aroma of tea dregs after extraction. In addition, we analyzed the tea aroma components to establish the correlation between aroma components and tea quality.

2. Materials and Methods

2.1. Tea Source

We used 24 tea samples collected from the 1500 tested and graded by a panel of judges at the 2021 Pinglin Bao-chung Tea Spring Tea Competition held by the New Taipei City Government. The panel of judges of the tea competition consisted of trained and selected evaluators appointed by the government [3]. The judges conducted the reviews in a double-blind manner and assessed each tea sample individually. The brewing process followed the specifications outlined in the ISO 31031 standard, which involved steeping 5 g of tea leaves in 150 mL of water. The samples were classified into five grades: first, second, third, formal, and disuse. The tea we purchased had the following grades: grade 1 (combination of 1st and 2nd grades), grade 2 (3rd grade), and grade 3 (formal grade). For each grade, 300 g of eight different tea samples were randomly purchased and stored under the same vacuum conditions before evaluation. An appropriate amount of tea was retrieved from the vacuum packaging for each GC–MS or E-nose analysis. The remaining tea was again vacuum packed to maintain its aroma.

2.2. Analysis of the VOCs in Tea

To perform tea extraction, we added 5 g of each tea sample and 150 mL of water filtered by reverse osmosis (RO; 475 MΩ cm resistivity at 25 °C) or deionized water (18.2 MΩ cm resistivity at 25 °C) at 100 °C into a 150 mL serum bottle. The bottle was then covered with a polyethylene (PE) material. We performed the tea extraction step for chemical analysis using the same amount of the tea sample and the same brewing liquid as in the competition sensory evaluation. After 5 min of extraction, the water was decanted, and the serum bottle with the tea leaves was immediately covered with a Teflon cap. Then, the bottle was placed at the center of a heating tray at 40 °C (the human evaluation was conducted at the same temperature). A solid-phase microextraction (SPME) needle was inserted into the serum bottle through the Teflon cap to collect the VOCs released from the brewed tea leaves placed in a dry bath maintained at 40 °C. The SPME needle was removed after 20 min of VOC collection, and the collected sample was analyzed by GC–MS.
GC–MS analysis was performed as follows: the SPME fiber [50/30 μm divinylbenzene/carboxen/polydimethylsiloxane, Supelco, St. Louis, MO, USA] with adsorbed VOCs was inserted into the inlet of the GC–MS apparatus (Agilent 6890 GC coupled with an Agilent-5973 mass spectrometer, Agilent Technologies Inc., Santa Clara, CA, USA) for desorbing the VOCs. The inlet temperature was 250 °C. The mass spectrometer was equipped with a capillary column (30 m × 0.25 mm and 0.25 μm thickness; HP-5MS UI), which was used for the chromatographic separation. The temperature of the oven was initially maintained at 40 °C for 2 min, increased to 90 °C at a rate of 15 °C min−1, and further increased to 125 °C at a slower rate of 3 °C min−1. Finally, the temperature was increased to 220 °C at a rate of 10 °C min−1 and held for 2 min; a method used by Lin et al. [2] and Lin, Ya-Hsin, and Chen [6] was modified and used herein. Helium was used as the carrier gas at a constant pressure of 6 psi (>99.999%) during chromatography. Mass spectrometry was conducted at an ionization voltage of 70 eV.
The mass spectra were obtained through automatic scanning, and the fragmentation pattern of each compound was compared with that obtained from the National Institute of Standards and Technology (NIST 11) database. The matching factor was ≥80, indicating the presence of the following putatively identified compounds: benzaldehyde (grass and floral aroma [23]), p-cymene (rosemary aroma [24]), D-limonene (citrus-like and herbal aroma [25]), cis-β-ocimene (citrus or spicy aroma [26]), trans- and cis-linalool oxide (earthy, floral, and creamy aroma [27]), linalool (floral aroma [28]), hotrienol (floral aroma [17]), nonanal (sweet, floral and fruity aroma [23,29]), allo-ocimene (floral aroma [30]), butanoic acid, 3-hexenyl ester (floral and fruity aroma [31]), (E)-hexanoic acid, 3-hexenyl ester (rancid aroma [29]), (Z)-geraniol (rose-like aroma [28]), indole (animal-like aroma [28]), hexanoic acid (sweaty, green aroma [32]), cis-jasmone (floral, jasmine-like aroma [28]), caryophyllene (woody–spicy, dry, and clove-like aroma [33]), trans-β-Ionone (woody and violet aroma [28]), α-farnesene (fruity, herbaceous aroma [33]), and nerolidol (floral aroma [34]).
The retention index (RI) of the VOCs was calculated using the retention time of the compounds and a standard saturated n-alkanes mixture (C8–C20) (Sigma-Aldrich, St. Louis, MO, USA) obtained under the same GC–MS conditions, and the values were published by the NIST library [6].
The extraction and analysis of each tea sample were conducted in two batches, and the external standard curves (ethyl decanoate (≥98%), Sigma-Aldrich Co., St. Louis, MO, USA) were used to quantify the concentrations of each volatile compound. The external standard curves ranged from 0 μg mL−1 to 220 μg mL−1, with an R2 value of 0.9985. The average of the two batches of each sample was referred to as the intensity index of that compound in each case. The concentrations of all the volatile aroma compounds mentioned above were integrated, and the proportion of each compound was calculated as the relative content of that chemical component.

2.3. Analysis of Catechins in Tea

The tea sample was ground, and 0.5 g of the powder was added to 50 mL of boiling deionized water and allowed to stand for 20 min for extraction. The entire extraction process was conducted in a water bath at 90 °C, and the tea extract was cooled and filtered using a 0.45 μm syringe filter. The filtered liquid was subsequently analyzed by high-performance liquid chromatography (HPLC, Agilent 1290 infinity II, 1290 DAD FS detector, Agilent Technologies Inc., Santa Clara, CA, USA) using a C18 column (5 μm × 4.6 mm × 250 mm; Waters, Milford, MA, USA). The column was eluted using 0.1% formic acid (v/v) in water (solvent A) and acetonitrile (solvent B) as the mobile phases, using the following gradient: a linear increase of B from 1% to 10% over 15 min and then from 10% to 20% over 14 min, followed by an increase from 20% to 22% within 6 min. Finally, the mobile phase was maintained at 22% of B for 5 min at a flow rate of 1.0 mL min−1. Absorbance at 280 nm was used for the real-time monitoring of peak intensities [2,6]. The concentrations of epicatechin (EC), epicatechin gallate (ECG), epigallocatechin (EGC), epigallocatechin gallate (EGCG), gallocatechin (GC), gallocatechin gallate (GCG), catechin (C), and catechin gallate (CG) were determined by comparing their peak areas with those of their respective standards (Sigma-Aldrich, St. Louis, MO, USA).

2.4. E-Nose Analysis of Tea Leaves

Tea powder (5 g) and filtered RO water (150 mL) at 100 °C were added to a 150 mL serum bottle, and the bottle was covered with a closed PE material for tea extraction. After 5 min of extraction, the water was decanted. The bottle with the tea leaves was immediately covered with a Teflon cap that allowed the insertion of the 3 mm long adsorption pipeline of the E-nose device. Then, the bottle was placed in a heating tray at 40 °C during each E-nose analysis.
The E-nose used in this study was a device with 14 metal oxidation sensors (ENOSIM BIO-TECH CO, LTD), which were used to collect the aroma compounds of tea leaves after brewing. Aroma analysis using the E-nose was performed on every tea sample. Prior to collecting the data from each sample, an environmental odor balance operation was performed for 10 min using the E-nose. After the equilibration process, the background air in the environment was drawn from the serum bottle into the sensor analysis chamber at an airflow rate of 300 mL min−1 for 1 min of data collection. After the odor data of the brewed tea leaves were collected, the E-nose adsorption pipeline was drawn away from the tea sample. The aroma compounds were desorbed until the sensor returned to the level before sensing. Then, sufficient time was allowed before the next sample was analyzed.
The E-nose signal was acquired using the automatic acquisition system of the equipment. The formula for calculating the change in resistance is as follows:
Resistance difference ratio = (RmaxRbase)/Rbase
Maximal slope of resistance = Max{Rslope}
Maximal slope of voltage = Max{Vslope}

2.5. Statistical Analysis

The experimental data were analyzed using analysis of variance, using CoStat 6.451 (Cohort Software, Monterey, CA, USA), and the difference in significance was determined using the least significant difference (LSD) method. We performed Pearson’s correlation analysis using CoStat 6.451 and regression analysis of the scatter plots using SigmaPlot. We used SYSTA version 13 to perform LDA. All data were plotted using SigmaPlot version 14.0.

3. Results and Discussion

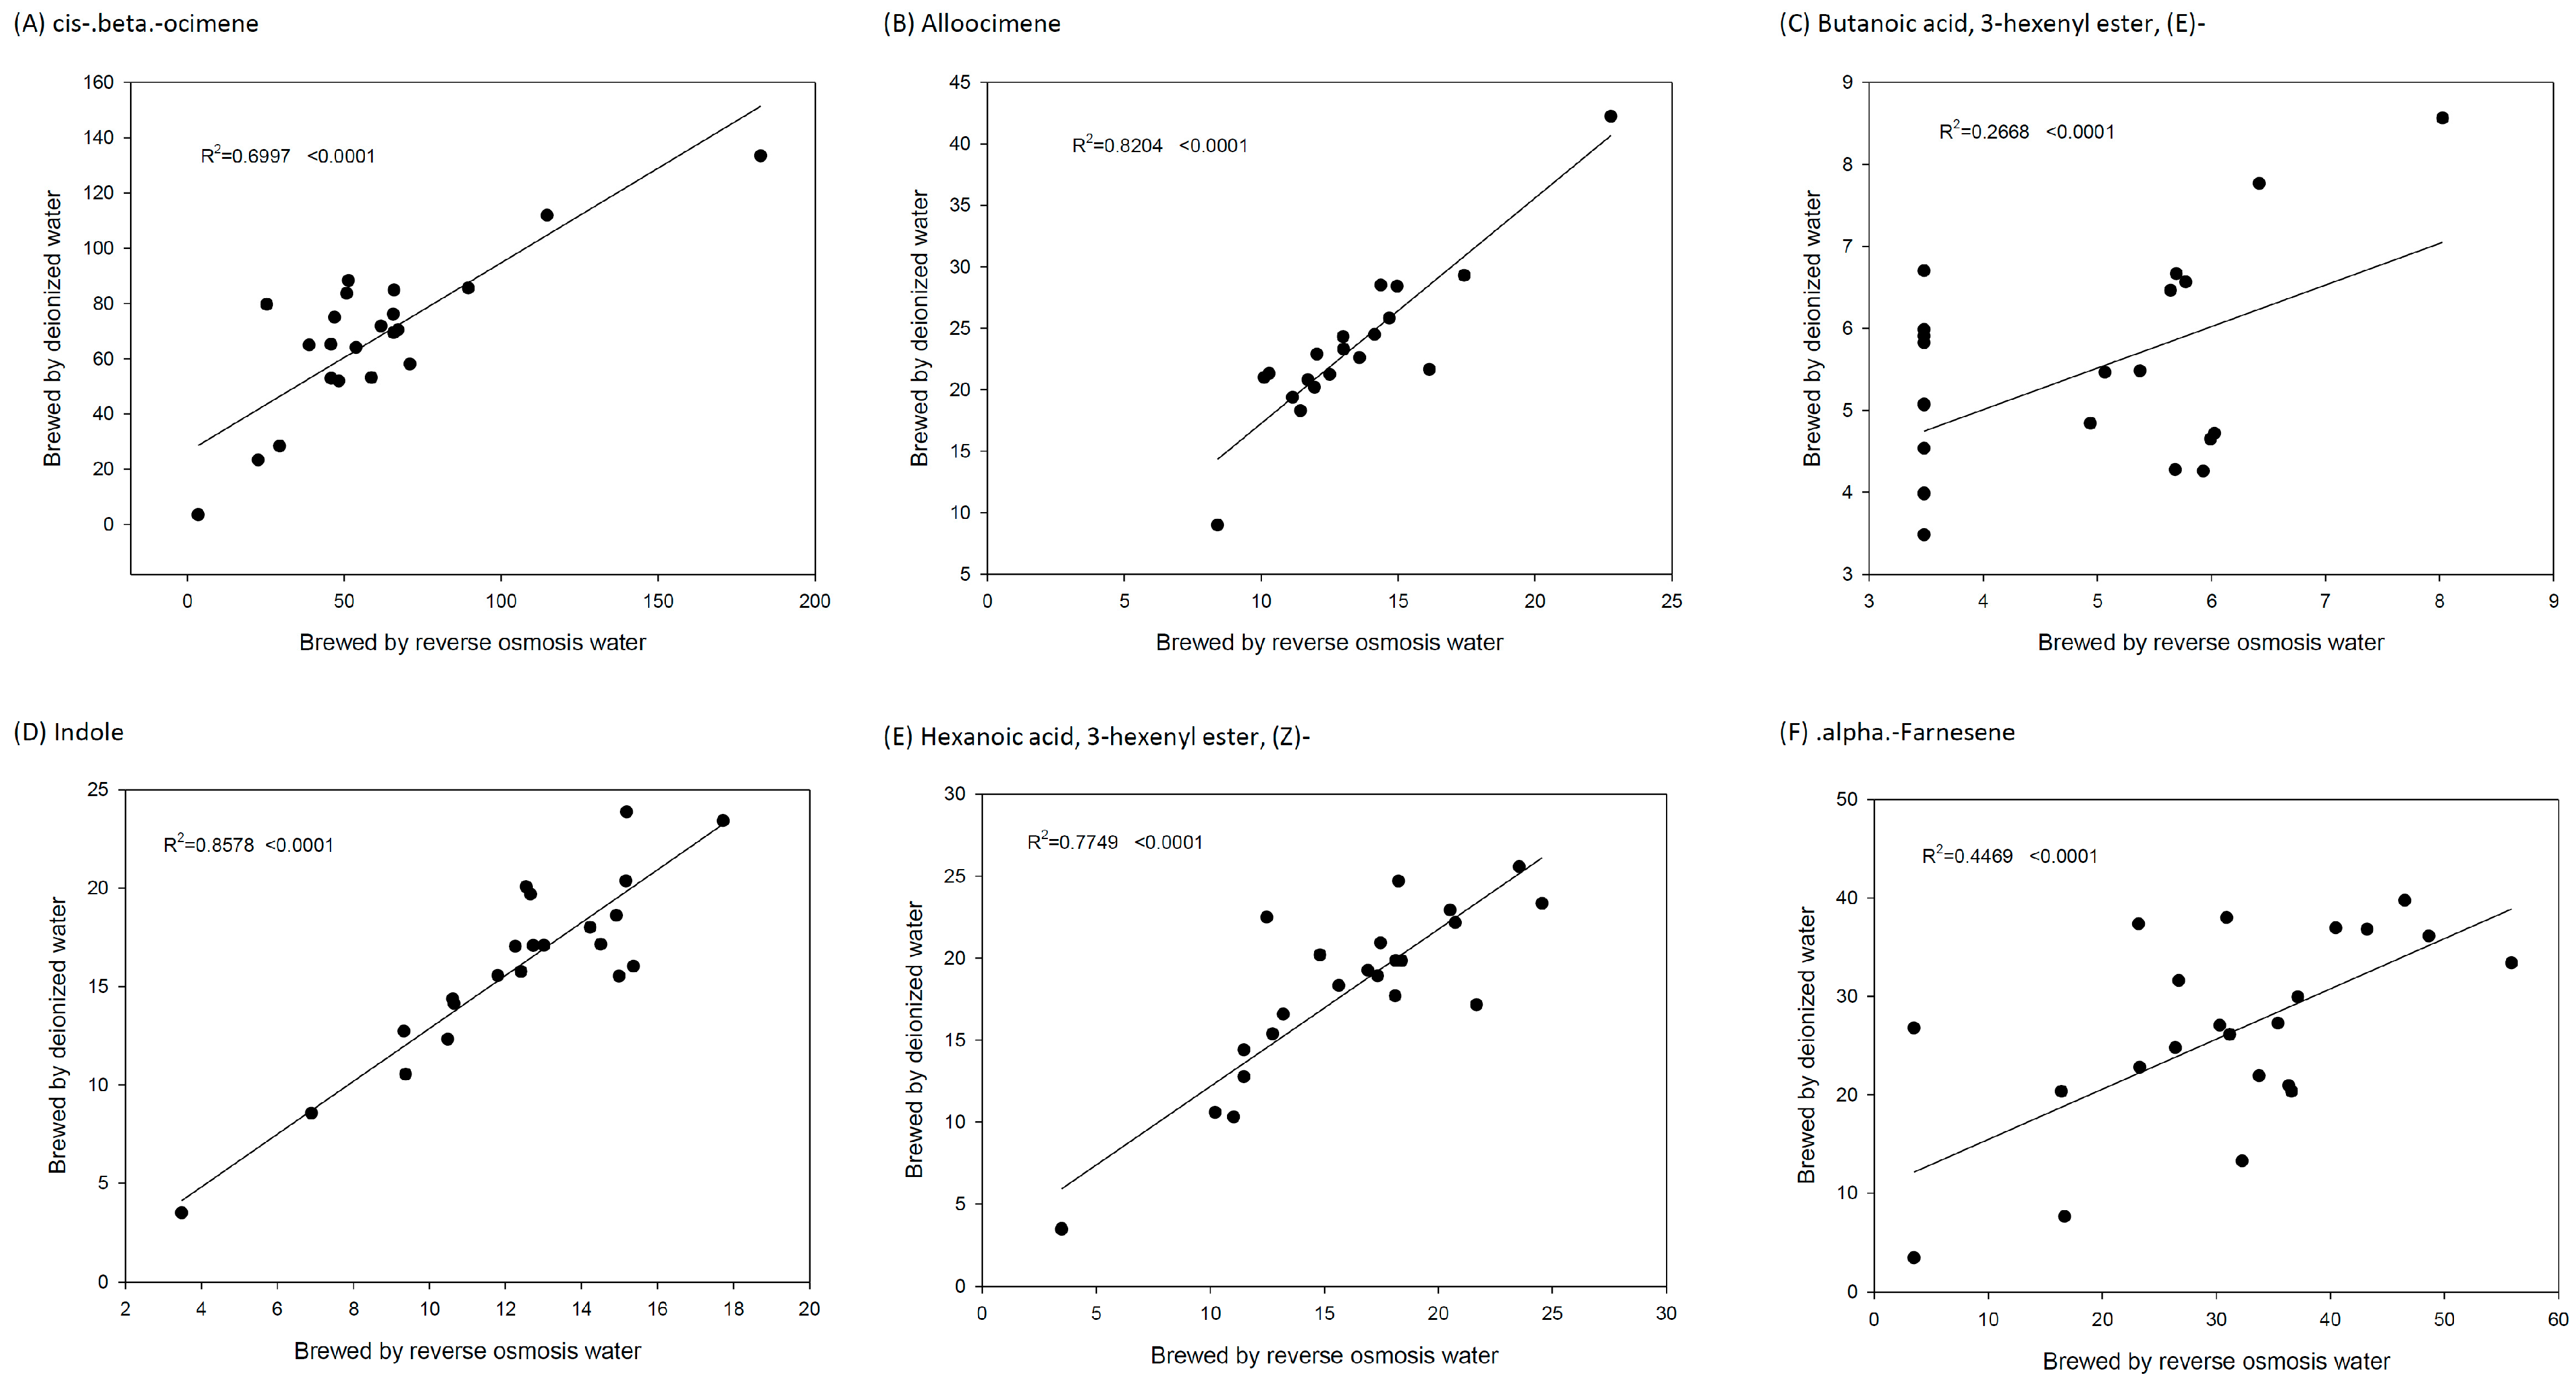
3.1. Effect of the Extraction Solvent on the Aroma of Tea

We used water purified by RO and deionized water to investigate the effect of different extraction solvents on the aroma volatilization of tea residues after extraction.
The results of using two types of water to brew tea revealed the emission of 19 main aroma compounds from the tea residue of the Bao-chung tea extracted with RO water: benzaldehyde, p-cymene, D-limonene, cis-β-ocimene, trans- and cis-linalool oxide, linalool, hotrienol, nonanal, allo-ocimene, butanoic acid, 3-hexenyl ester, (E)-hexanoic acid, 3-hexenyl ester, (Z)-geraniol, indole, hexanoic acid, cis-jasmone, caryophyllene, trans-β-Ionone, α-farnesene, and nerolidol. By contrast, only eight aroma components in the tea residues were extracted with deionized water: benzaldehyde, cis-β-ocimene, linalool, allo-ocimene, butanoic acid, 3-hexenyl ester, (E)-hexanoic acid, 3-hexenyl ester, (Z)-indole, hexanoic acid, and α-farnesene (Table 1).
The indole content of the volatiles from the tea dregs after the deionized water extraction had the highest correlation with the indole content of the volatiles from the tea dregs obtained after the RO water extraction (R2 = 0.71). β-Ocimene and allo-ocimene had moderate correlations (R2 = 0.58–068), whereas almost no correlation was found for the other components (Figure 1).
These results reveal that different extraction liquids affect the volatilization state of the components of brewed tea leaves, affecting the results of GC–MS analysis and sensory evaluation. To compare the results of the instrumental analysis with those of the sensory evaluation performed by the panel of judges and to determine the key aroma components used for grading Bao-chung tea, we used RO water in this study. RO water is similar to that used by tea tasters for tea brewing and aroma extraction. We performed GC–MS and E-nose odor analysis to obtain the aroma composition state closest to the sensory evaluation conducted by the tea experts. We used the results of the GC–MS and E-nose measurements to identify the key aroma components affecting the quality of Bao-chung tea.

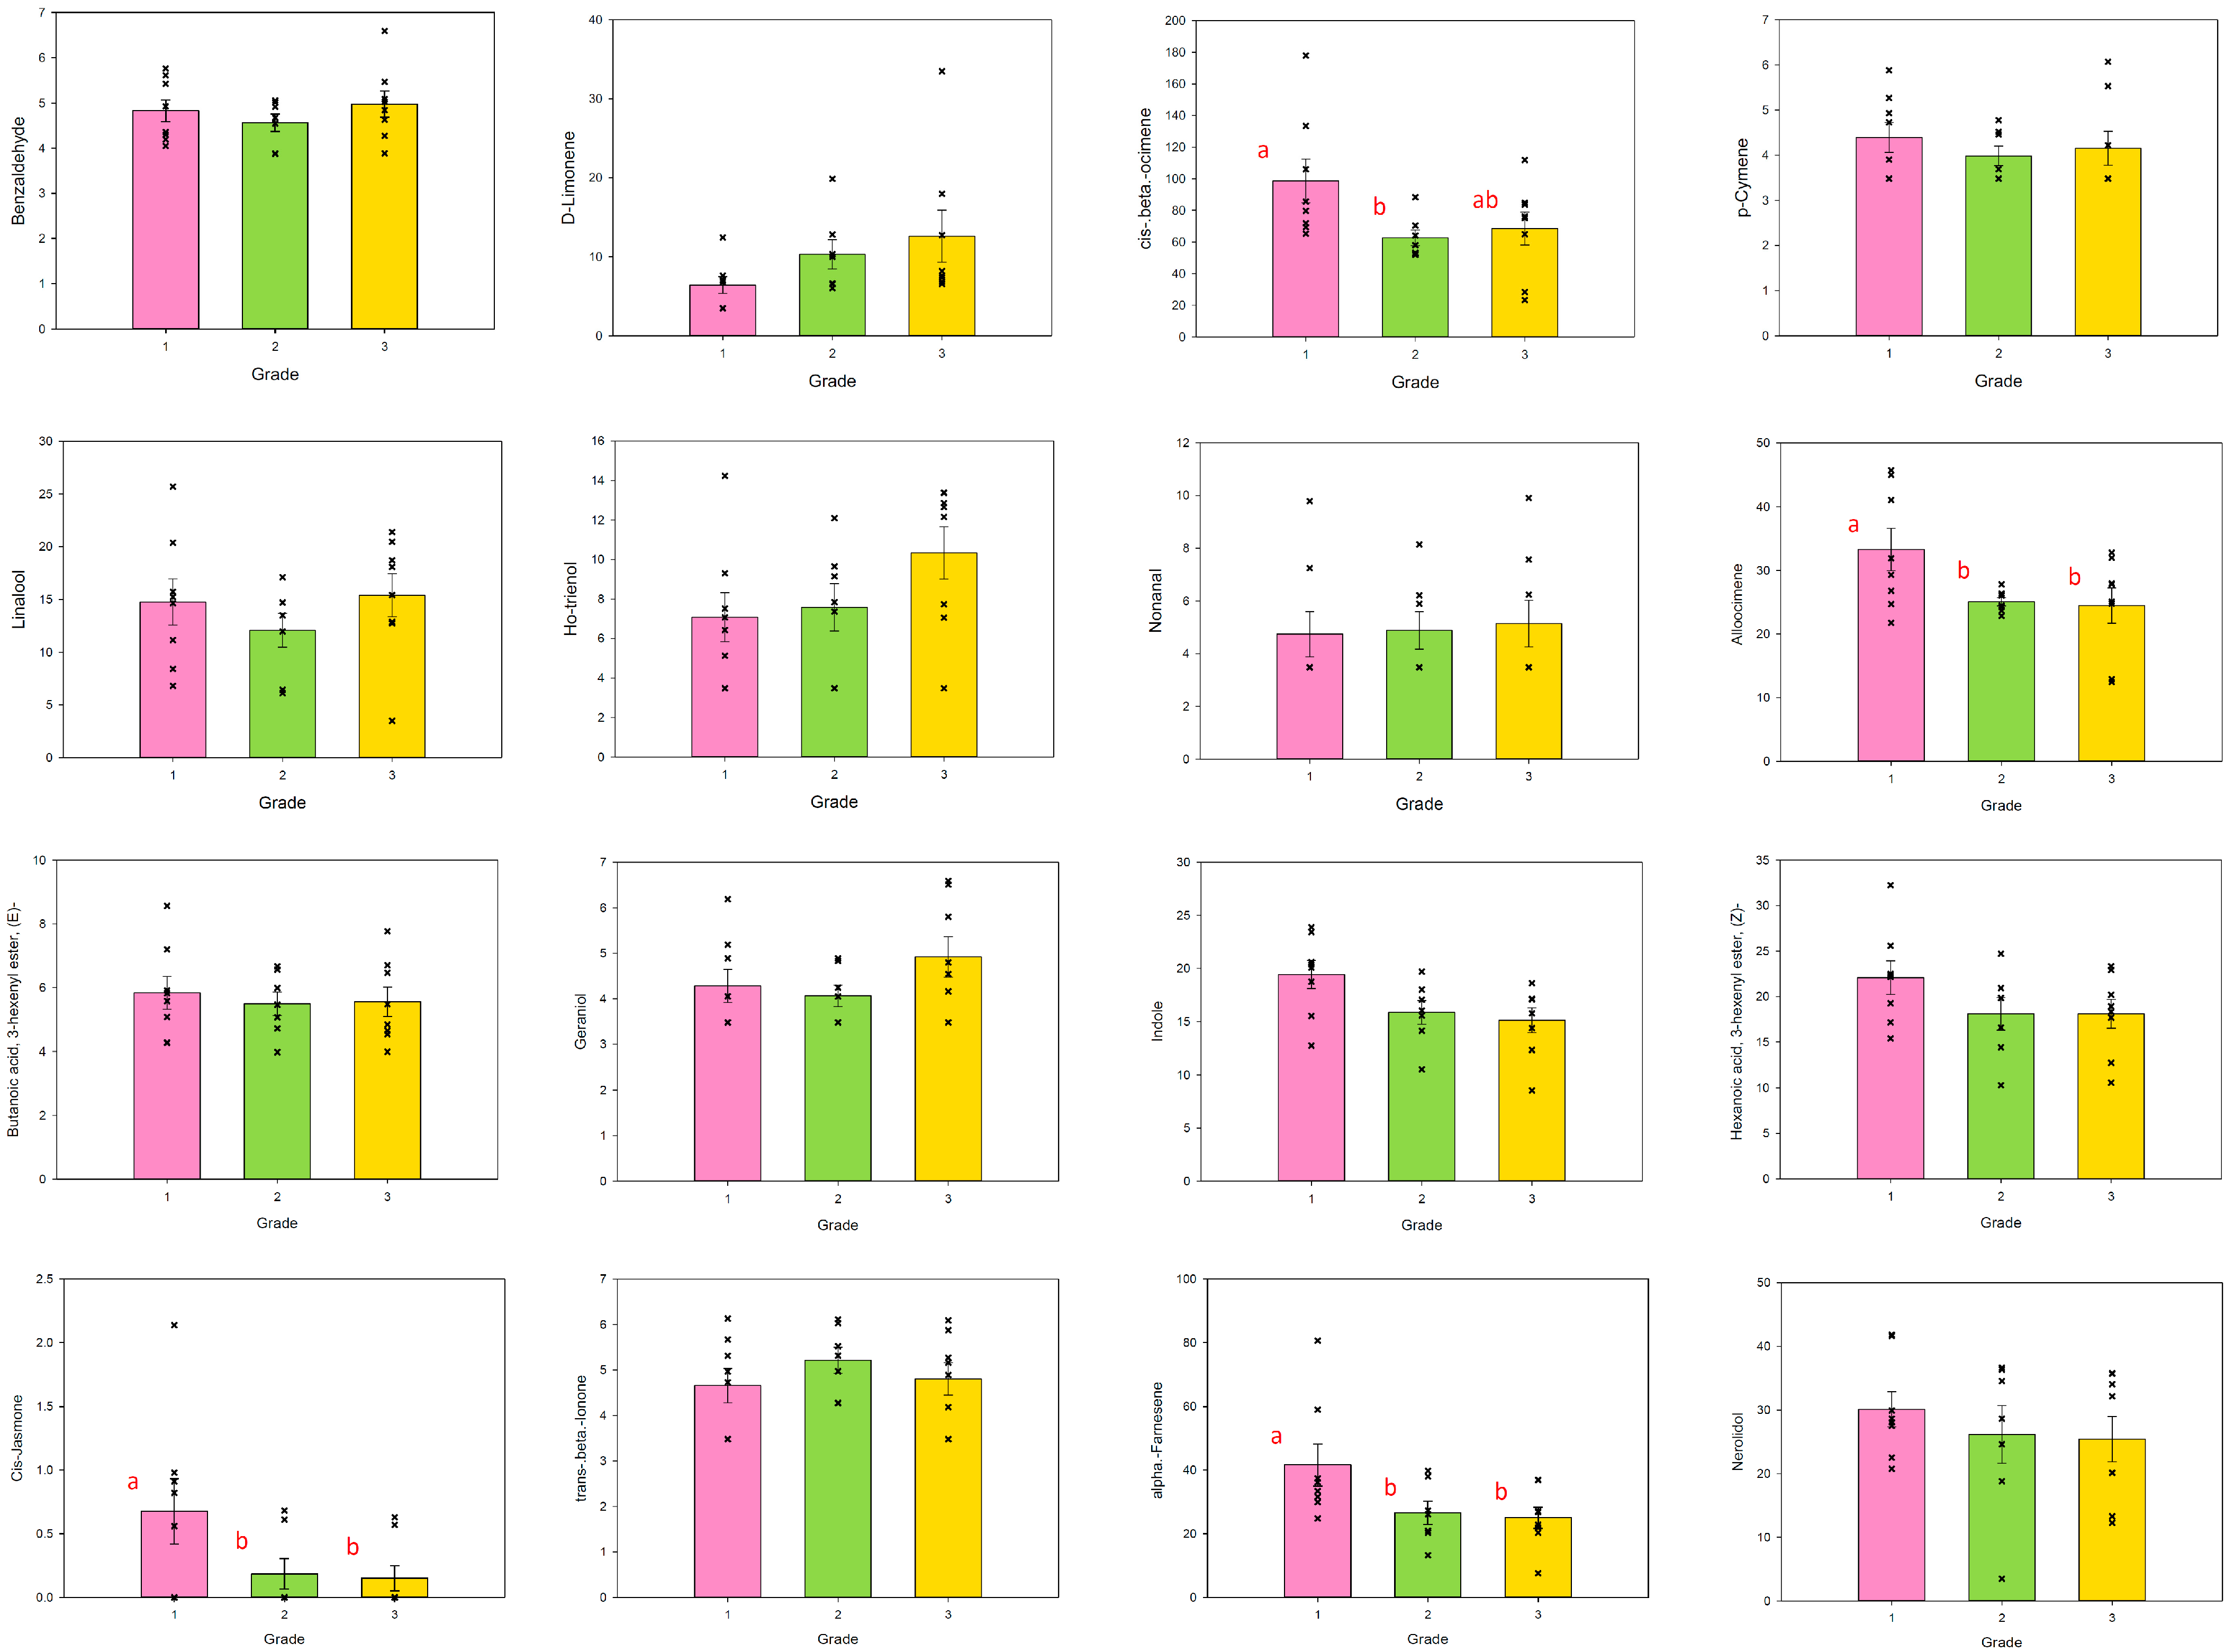
3.2. Volatile Components of Different Bao-Chung Tea Grades

Among the 19 main volatile compounds extracted from the Bao-chung tea dregs, the intensity of the floral aroma compounds, which are considered key quality-related compounds [16,22,23,24,25] such as allo-ocimene, cis-jasmone, and α-farnesene (contributing to floral, jasmine-like, and fruity aroma, respectively [28,30,33], was significantly higher in higher-quality grade tea samples. The intensity of the fresh aroma compound, cis-β-ocimene [26], was also higher in superior-grade tea samples. These results demonstrate that Bao-chung tea possesses unique floral and fruity aromas while exhibiting a refreshing fragrance.
Further, as shown in Figure 2, the average values of VOCs in each tea grade were different, as determined by ANOVA analysis. However, a significant overlap in the aroma intensity was observed between tea samples of different grades. This result clearly suggests that a specific aroma compound intensity alone cannot distinguish the tea grade. These results also explain why identifying a particular compound as a quality indicator has been difficult in previous oolong tea studies and why the key component indicators (chemical markers) determined by extensive studies are difficult to apply in the tea industry [3,5,9,36].
The ratios of D-limonene and α-farnesene were different in tea samples of different grades. Similar to aroma intensity, the ratio of these components alone cannot be directly used as an absolute indicator for judging the tea grade (Figure 3).
Based on the results presented earlier, we conclude that no individual VOC intensity or proportion can fully differentiate different quality grade teas. However, when considering the human perception of aromas, the combined influence of both the intensity and proportion of aroma molecules is a crucial consideration. The aroma compound α-farnesene displayed significant differences in content and proportion in the tea sample grades that we analyzed; therefore, it may be considered an important aroma indicator as it satisfies both the “quality” and “quantity” aspects necessary in human aroma perception. Our results indicate that no individual VOC intensity or proportion can fully discriminate among different tea quality grades. However, when considering the human perception of an aroma, the combined contribution of various elements that influence the intensity and proportion of the aroma molecules must be considered. Among the different grades of the tea samples analyzed, α-farnesene displayed significant differences in both content and proportion; therefore, it may be considered an important indicator as it satisfies both the “quality” and “quantity” aspects necessary for human aroma perception. Thus, we hypothesize that α-farnesene could be a key aroma molecule for indicating the quality of Bao-chung tea.
Given the difficulty of performing grade discrimination for a single specific component, we applied forward stepwise LDA to distinguish different grades of tea. The results indicate that different grades of Bao-chung tea cannot be well distinguished based on the VOC intensity or proportion. However, three grades could be well distinguished based on the combination of the VOC intensity and proportion (Figure 4). The LDA results obtained using both the intensity and proportion parameters indicate that higher proportions of p-cymene, cis-β-ocimene, nonanal, allo-ocimene, cis-jasmone, and α-farnesene, a higher quantity (intensity index) of indole, and lower amounts of linalool and butanoic acid would improve tea quality.
The GC–MS results indicate that although a single specific VOC cannot be used to judge the quality of Bao-chung tea, the tea grade can be distinguished from its aroma compound composition. The results also suggest that the individual aroma intensity or proportion may not be the key quality indicator; instead, the aroma compound composition should be considered in quality evaluation. This may be because humans focus more on comprehensive sensation, which includes a collective influence of the intensity and ratio of aroma molecules released from tea rather than only the aroma strength. Based on these results, the aroma characteristics can be used as an index to judge the quality of Bao-chung tea, providing an essential theoretical basis for using an E-nose to distinguish Bao-chung tea quality.

3.3. Catechin Contents of Different Bao-Chung Tea Grades

Catechin content is a key factor affecting the bitterness and astringency of a tea [37,38]. Therefore, catechin content is often used as an indicator to judge tea grades. However, in the superior-grade Bao-chung tea samples (i.e., the tea samples qualified in the competition) collected in this study, we found no significant differences in the content of individual catechins in the tea leaves of different grades, and the distribution of individual catechins in differently graded Bao-chung tea was highly similar (Figure 5).
Many studies have demonstrated that different catechins can be used for grading green and black teas [39,40,41]. In addition, other studies [42,43] have suggested that catechins are grading indicators for specific partially oxidized tea types. However, the catechin content may not necessarily serve as a quality indicator in oolong tea or partially fermented teas. Some studies have indicated that catechins cannot serve as quality indicators for partially oxidized teas [44,45]. Our study revealed similar results; when LDA was used for grouping, only grade 3 tea could be discriminated from grade 1 and 2 tea samples, and the samples belonging to grades 1 and 2 could not be discriminated (Figure 4). This result may have occurred because previous studies primarily analyzed tea samples with significant differences in grades, where the degree of bitterness may have been the key factor affecting tea quality. However, catechin content is difficult to use as an indicator for discriminating tea of grades 1 and 2 because samples of higher quality have a similar range of bitterness.
LDA results indicate that although we cannot use individual catechins as key indicators of Bao-chung tea grades, they have a specific impact on quality. In higher quality Bao-chung tea, the smell components may be more important than the taste components; this also indirectly suggests that compared to other types of partially oxidized teas, Bao-chung tea was developed to emphasize aroma expression.

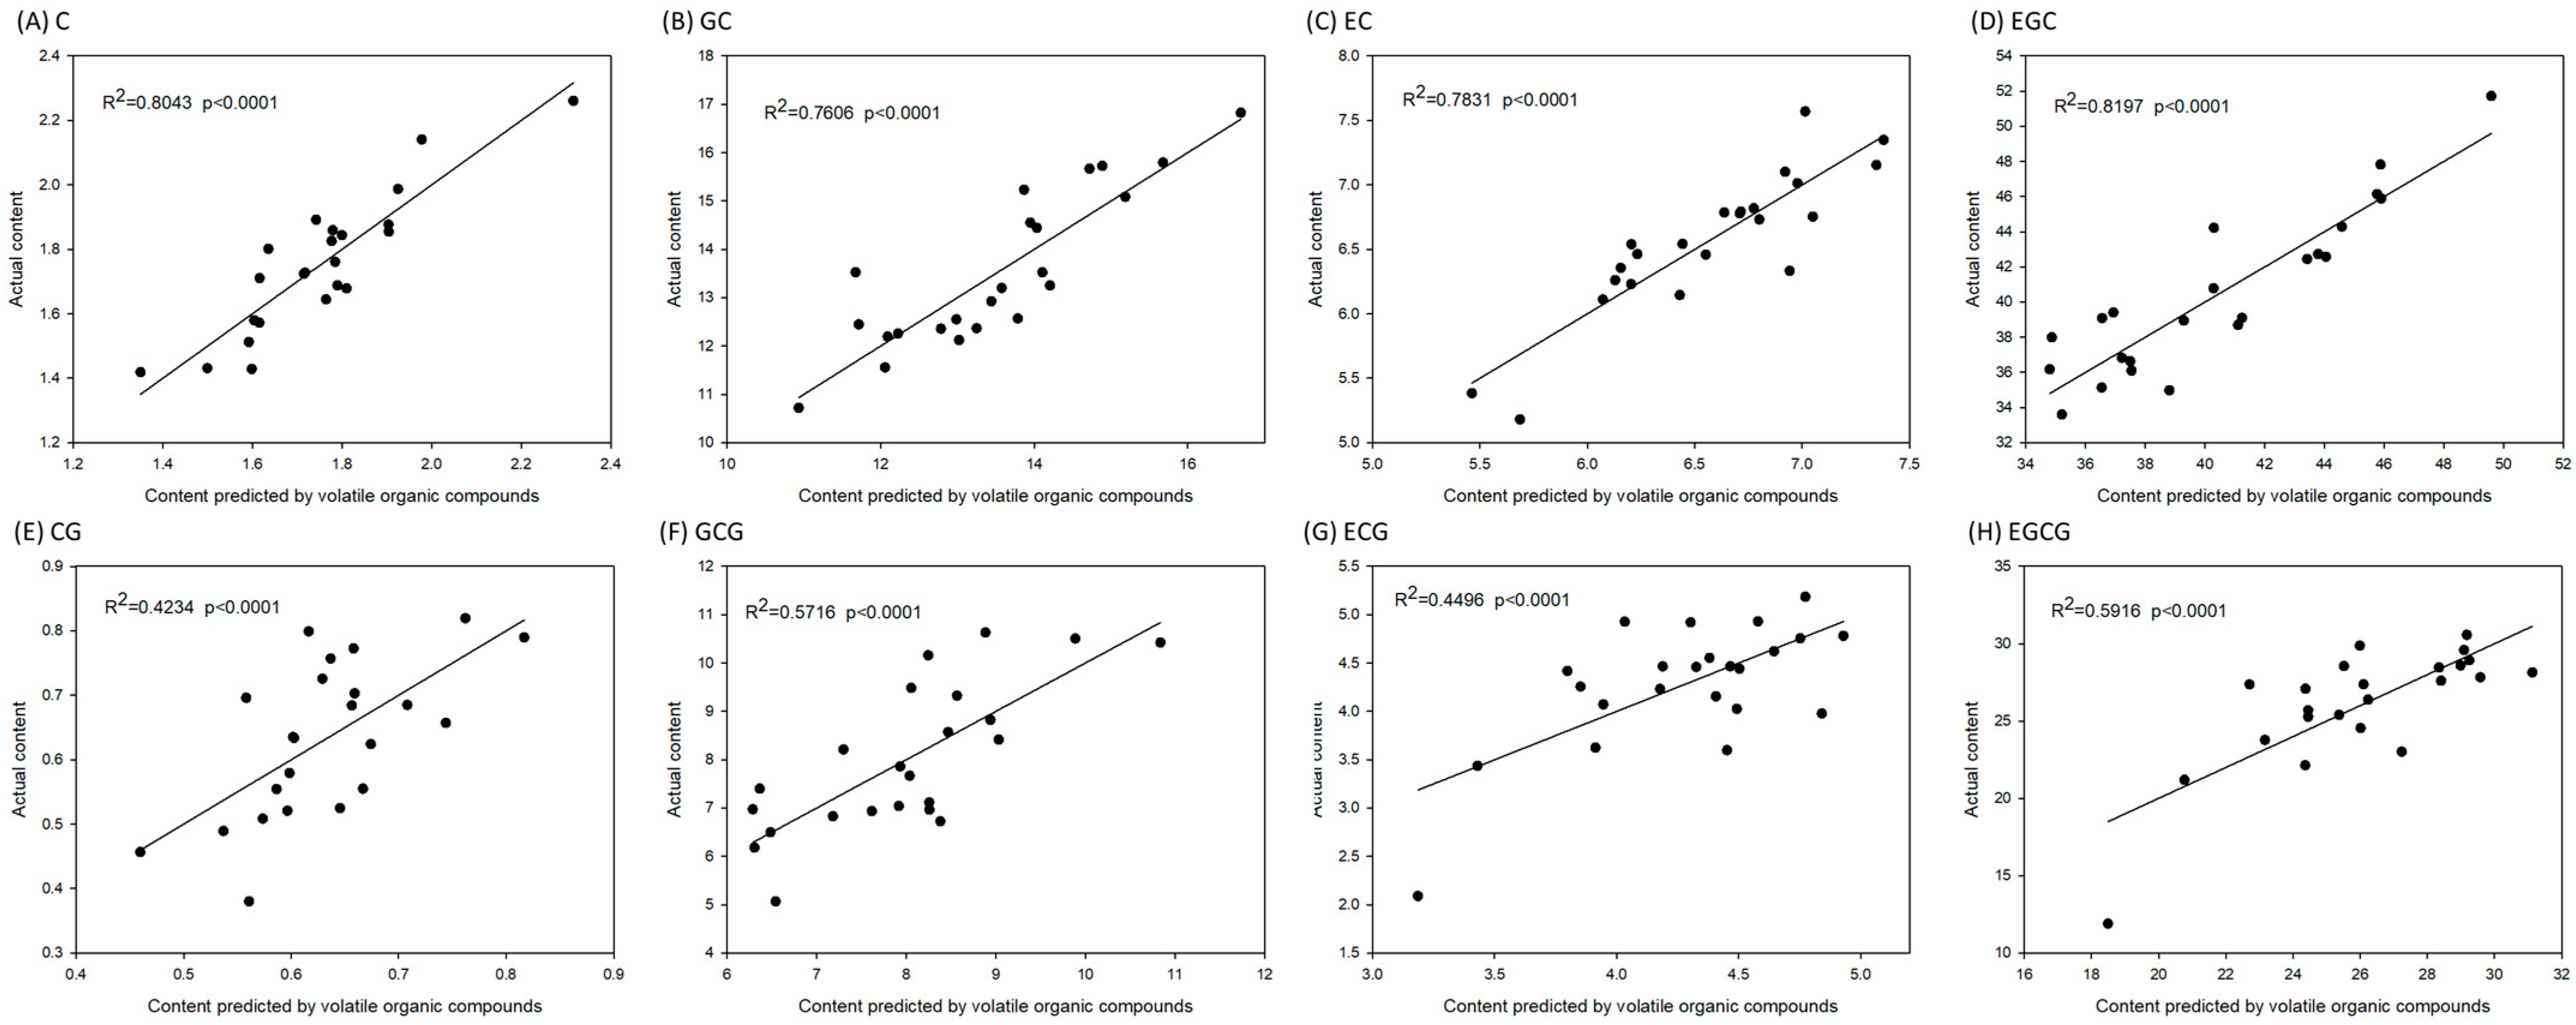
3.4. Relationship between the VOC of Bao-Chung Tea and the Contents of Individual Catechins

To further elucidate the relationship between the quality of Bao-chung tea and its composition and to identify the scientific basis for the grading of Bao-chung tea by experts, a correlation study and a forward stepwise regression analysis of the VOC data of tea samples used in the test and the catechin data were conducted. The results revealed that the correlation between individual VOCs and catechins was only as high as R = 0.58. However, VOC data can be used to predict the contents of individual catechins, particularly in the prediction of free form catechins (R2 > 0.819) (Figure 6).
Therefore, we can infer the individual catechin content of tea leaves from the state of the odor composition. When the ratio of D-limonene to nonanal was higher, the contents of the respective catechins were lower. Similarly, when the ratio of cis-β-ocimene to hotrienol was higher, the contents of the respective catechins were lower. Therefore, when the aroma composition of Bao-chung tea is more fragrant and floral, the catechin content will be lower, probably because the oxidation of catechins can form specific aroma compounds [46,47]. However, when the catechin content is too low, the degree of oxidation may be too high [2]. As the oxidation level increases, the tea may transform into other types of oolong tea, which may have different aromas, and deviate from the unique characteristics of Bao-chung tea [3]. In this case, the taste becomes too weak [21], and a smell that does not belong to Bao-chung tea is produced [3]. Therefore, based on the combined results of the aroma data mentioned above, we infer that the smell of Bao-chung tea has a greater impact on its quality than its taste. Because the catechin content is the key source of bitterness and flavor in sensory evaluation, we deduce the possible reasons why tea taste experts use the smell of Bao-chung tea to estimate its taste and quality.

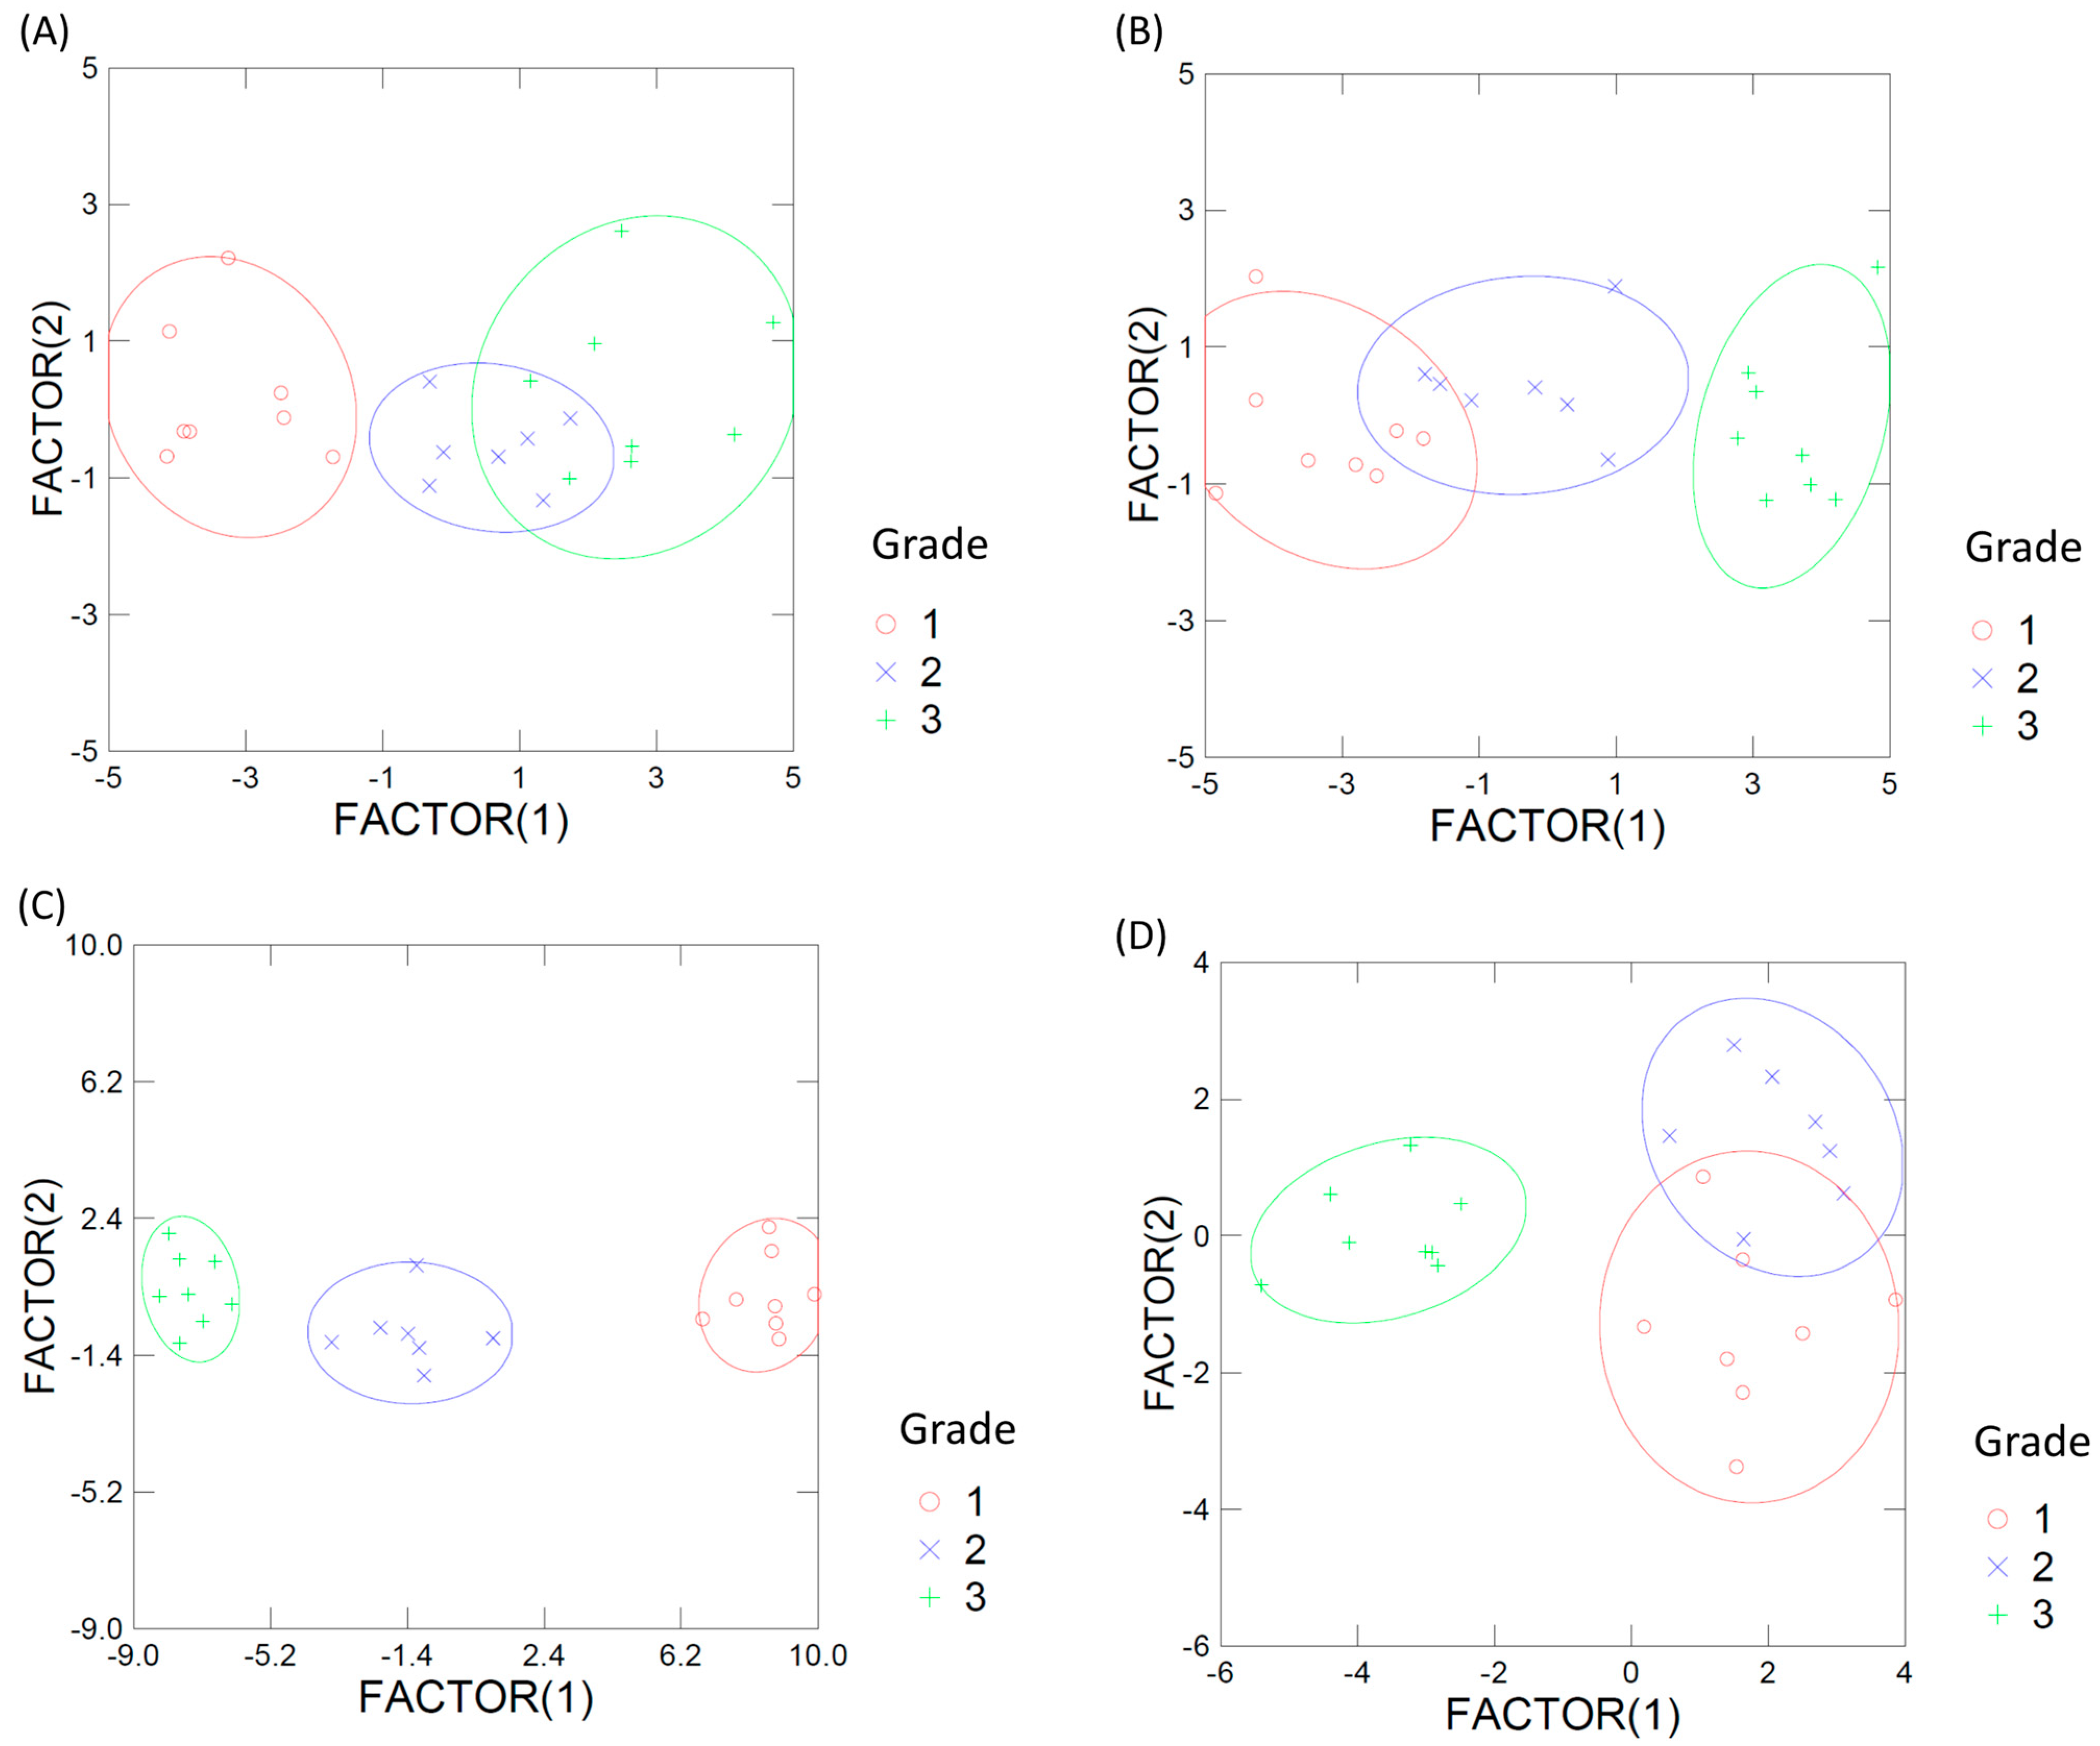
3.5. Quality Grading of Bao-Chung Tea Using E-Nose

According to previously discussed results, the quality of Bao-chung tea can be judged based on its aroma, which lays the foundation for classifying Bao-chung. Using the nine characteristic data obtained by four E-nose sensors, the 24 tea samples evaluated in this study could be efficiently graded (Figure 7). This observation indicates that the E-nose is not only suitable for grading green [48] and black [49] tea but also for classifying Bao-chung tea.

4. Conclusions

This study is the first comprehensive work to investigate the relationship between the VOCs, catechins, and Bao-chung tea quality grades. The results indicated that the key aroma components in Bao-chung tea include indole, linalool, butanoic acid, p-cymene, cis-β-ocimene, nonanal, allo-ocimene, cis-jasmone, and α-farnesene; the concentration ranges of these aroma components in the highest-grade Bao-chung tea samples were 12.73–23.87, 6.8–25.71, 4.26–8.56, 3.48–5.88, 65.22–177.92, 3.48–9.79, 21.76–45.73, 3.48–5.62, and 24.78–80.64 μg mL−1, respectively. However, the concentration or ratio of individual compounds cannot serve as the basis for quality differentiation.
The results were obtained by combining the quality and quantity of specific Bao-chung tea aromas (indole, linalool, butanoic acid, p-cymene, cis-β-ocimene, nonanal, allo-ocimene, cis-jasmone, and α-farnesene) for a comprehensive tea aroma evaluation. Our results also demonstrate that this method can be used to efficiently discern different tea grades. This combined-parameter method performed better than a grading method based on individual catechins, indicating that Bao-chung tea is a particular type of oolong tea that emphasizes floral and fresh aromas. These specific aromas are important characteristics of Bao-chung tea and can be used as a reference for further research on improved tea cultivation and processing techniques. Using an E-nose for quickly collecting odor data and subsequent LDA can facilitate a quicker classification of Bao-chung tea grades.

Author Contributions

Conceptualization, P.-A.C.; methodology, P.-A.C. and C.-I.L.; software, P.-A.C.; investigation, P.-A.C., C.-I.L. and K.-R.C.; writing—original draft preparation, P.-A.C.; writing—review and editing, P.-A.C.; supervision, P.-A.C.; project administration, P.-A.C.; funding acquisition, P.-A.C. All authors have read and agreed to the published version of the manuscript.

Funding

This research was funded by the National Science and Technology Council, grant numbers NSTC 110-2321-B-866-002- and NSTC 111-2622-B-866-001-.

Data Availability Statement

Data sharing not applicable.

Conflicts of Interest

The authors declare no conflict of interest.

References

  1. Wang, C.; Lv, S.; Wu, Y.; Gao, X.; Li, J.; Zhang, W.; Meng, Q. Oolong tea made from tea plants from different locations in Yunnan and Fujian, China showed similar aroma but different taste characteristics. SpringerPlus 2016, 5, 576. [Google Scholar] [CrossRef]
  2. Lin, S.-Y.; Lo, L.-C.; Chen, L.-Z.; Chen, P.A. Effect of shaking process on correlations between catechins and volatiles in oolong tea. J. Food Drug Anal. 2016, 24, 500–507. [Google Scholar] [CrossRef]
  3. Su, T.-C.; Yang, M.-J.; Huang, H.-H.; Kuo, C.-C.; Chen, L.-Y. Using sensory wheels to characterize consumers’ perception for authentication of Taiwan specialty teas. Foods 2021, 10, 836. [Google Scholar] [CrossRef]
  4. Shao, C.; Zhang, C.; Lv, Z.; Shen, C. Pre-and postharvest exposure to stress influence quality-related metabolites in fresh tea leaves (Camellia sinensis). Sci. Hortic. 2021, 281, 109984. [Google Scholar] [CrossRef]
  5. Zeng, L.; Zhou, X.; Su, X.; Yang, Z. Chinese oolong tea: An aromatic beverage produced under multiple stresses. Trends Food Sci. Technol. 2020, 106, 242–253. [Google Scholar] [CrossRef]
  6. Lin, S.-Y.; Ya-Hsin, H.; Chen, P.-A. Revealing the profound meaning of pan-firing of oolong tea—A decisive point in odor fate. Food Chem. 2022, 375, 131649. [Google Scholar] [CrossRef]
  7. Hu, C.-J.; Li, D.; Ma, Y.X.; Zhang, W.; Lin, C.; Zheng, X.Q.; Liang, Y.-R.; Lu, J.-L. Formation mechanism of the oolong tea characteristic aroma during bruising and withering treatment. Food Chem. 2018, 269, 202–211. [Google Scholar] [CrossRef]
  8. Liu, G.-F.; Liu, J.J.; He, Z.R.; Wang, F.M.; Yang, H.; Yan, Y.-F.; Gao, M.J.; Gruber, M.Y.; Wan, X.-C.; Wei, S. Implementation of CsLIS/NES in linalool biosynthesis involves transcript splicing regulation in Camellia sinensis. Plant Cell Environ. 2018, 41, 176–186. [Google Scholar] [CrossRef]
  9. Zheng, X.-Q.; Li, Q.-S.; Xiang, L.P.; Liang, Y.R. Recent advances in volatiles of teas. Molecules 2016, 21, 338. [Google Scholar] [CrossRef]
  10. McDowell, I.; Sarah, T.; Clifton, G. The phenolic pigment composition of black tea liquors—Part I: Predicting quality. J. Sci. Food Agric. 1995, 69, 467–474. [Google Scholar] [CrossRef]
  11. Owuor, P.O.; Obanda, M. Clonal variation in the individual theaflavin levels and their impact on astringency and sensory evaluations. Food Chem. 1995, 54, 273–277. [Google Scholar] [CrossRef]
  12. Pang, X.; Qin, Z.; Zhao, L.; Cheng, H.; Hu, X.; Song, H.; Wu, J. Development of regression model to differentiate quality of black tea (Dianhong): Correlate aroma properties with instrumental data using multiple linear regression analysis. Int. J. Food Sci. Technol. 2012, 47, 2372–2379. [Google Scholar] [CrossRef]
  13. Chen, J.; Yang, Y.; Deng, Y.; Liu, Z.; Xie, J.; Shen, S.; Yuan, H.; Jiang, Y. Aroma quality evaluation of Dianhong black tea infusions by the combination of rapid gas phase electronic nose and multivariate statistical analysis. LWT 2022, 153, 112496. [Google Scholar] [CrossRef]
  14. Han, W.-Y.; Huang, J.-G.; Li, X.; Li, Z.-X.; Ahammed, G.J.; Peng, Y.; Stepp, J.R. Altitudinal effects on the quality of green tea in east China: A climate change perspective. Eur. Food Res. Technol. 2017, 243, 323–330. [Google Scholar] [CrossRef]
  15. Tarachiwin, L.; Ute, K.; Kobayashi, A.; Fukusaki, E. 1H NMR based metabolic profiling in the evaluation of Japanese green tea quality. J. Agric. Food Chem. 2017, 55, 9330–9336. [Google Scholar] [CrossRef]
  16. Zeng, L.; Naoharu, W.; Ziyin, Y. Understanding the biosyntheses and stress response mechanisms of aroma compounds in tea (Camellia sinensis) to safely and effectively improve tea aroma. Crit. Rev. Food Sci. Nutr. 2019, 59, 2321–2334. [Google Scholar] [CrossRef]
  17. Yang, Z.; Susanne, B.; Naoharu, W. Recent studies of the volatile compounds in tea. Food Res. Int. 2013, 53, 585–599. [Google Scholar] [CrossRef]
  18. Zhu, J.; Chen, F.; Wang, L.; Niu, Y.; Yu, D.; Shu, C.; Chen, H.; Wang, H.; Xiao, Z. Comparison of aroma-active volatiles in oolong tea infusions using GC–olfactometry, GC–FPD, and GC–MS. J. Agric. Food Chem. 2015, 63, 7499–7510. [Google Scholar] [CrossRef]
  19. Li, Z.; Yu, J.; Dong, D.; Yao, G.; Wei, G.; He, A.; Wu, H.; Zhu, H.; Huang, Z.; Tang, Z. E-nose based on a high-integrated and low-power metal oxide gas sensor array. Sens. Actuators B 2023, 380, 133289. [Google Scholar] [CrossRef]
  20. Kaushal, S.; Nayi, P.; Rahadian, D.; Chen, H.H. Applications of Electronic Nose Coupled with Statistical and Intelligent Pattern Recognition Techniques for Monitoring Tea Quality: A Review. Agriculture 2022, 12, 1359. [Google Scholar] [CrossRef]
  21. Sánchez-López, J.A.; Yener, S.; Smrke, S.; Märk, T.D.; Bonn, G.; Zimmerman, R.; Biasioli, F.; Yeretzian, C. Extraction kinetics of tea aroma compounds as a function brewing temperature, leaf size and water hardness. Flavour Fragr. J. 2020, 35, 365–375. [Google Scholar] [CrossRef]
  22. Wang, Y.; Zheng, P.-C.; Liu, P.P.; Song, X.-W.; Guo, F.; Li, Y.Y.; Ni, D.-J.; Jiang, C.-J. Novel insight into the role of withering process in characteristic flavor formation of teas using transcriptome analysis and metabolite profiling. Food Chem. 2019, 272, 313–322. [Google Scholar] [CrossRef] [PubMed]
  23. Yang, Y.; Zhu, H.; Chen, J.; Xie, J.; Shen, S.; Deng, Y.; Zhu, J.; Yuan, H.; Jiang, Y. Characterization of the key aroma compounds in black teas with different aroma types by using gas chromatography electronic nose, gas chromatography-ion mobility spectrometry, and odor activity value analysis. LWT 2022, 163, 113492. [Google Scholar] [CrossRef]
  24. Özcan, M.M.; Chalchat, J.C. Chemical composition and antifungal activity of rosemary (Rosmarinus officinalis L.) oil from Turkey. Int. J. Food Sci. Nutr. 2008, 59, 691–698. [Google Scholar] [CrossRef]
  25. Xu, K.; Tian, C.; Zhou, C.; Zhu, C.; Weng, J.; Sun, Y.; Lin, Y.; Lai, Z.; Guo, Y. Non-targeted metabolomics analysis revealed the characteristic non-volatile and volatile metabolites in the Rougui Wuyi rock tea (Camellia sinensis) from different culturing regions. Foods 2022, 11, 1694. [Google Scholar] [CrossRef] [PubMed]
  26. Malongane, F.; McGaw, L.J.; Debusho, L.K.; Mudau, F.N. Sensory characteristics and volatile compounds of herbal teas and mixtures of bush tea with other selected herbal teas of South Africa. Foods 2020, 9, 496. [Google Scholar] [CrossRef] [PubMed]
  27. Wang, D.; Yoshimura, T.; Kubota, K.; Kobayashi, A. Analysis of glycosidically bound aroma precursors in tea leaves. 1. Qualitative and quantitative analyses of glycosides with aglycons as aroma compounds. J. Agric. Food Chem. 2000, 48, 5411–5418. [Google Scholar] [CrossRef]
  28. Wang, K.; Liu, F.; Liu, Z.; Huang, J.; Xu, Z.; Li, Y.; Chen, J.; Gong, Y.; Yang, X. Comparison of catechins and volatile compounds among different types of tea using high performance liquid chromatograph and gas chromatograph mass spectrometer. Int. J. Food Sci. Technol. 2011, 46, 1406–1412. [Google Scholar] [CrossRef]
  29. Liu, P.P.; Feng, L.; Xu, Y.Q.; Zheng, L.; Yin, P.; Ye, F.; Gui, A.H.; Wang, S.P.; Wang, X.P.; Teng, J.; et al. Characterization of stale odor in green tea formed during storage: Unraveling improvements arising from reprocessing by baking. LWT 2023, 174, 114458. [Google Scholar] [CrossRef]
  30. Hong, X.; Wang, C.; Jiang, R.; Hu, T.; Zheng, X.; Huang, J.; Liu, J.; Li, Q. Characterization of the key aroma compounds in different aroma types of Chinese yellow tea. Foods 2022, 12, 27. [Google Scholar] [CrossRef]
  31. Shimoda, M.; Shigematsu, H.; Shiratsuchi, H.; Osajima, Y. Comparison of volatile compounds among different grades of green tea and their relations to odor attributes. J. Agric. Food Chem. 1995, 43, 1621–1625. [Google Scholar] [CrossRef]
  32. Schuh, C.; Schieberle, P. Characterization of the key aroma compounds in the beverage prepared from Darjeeling black tea: Quantitative differences between tea leaves and infusion. J. Agric. Food Chem. 2006, 54, 916–924. [Google Scholar] [CrossRef] [PubMed]
  33. Zhou, L.; Yu, C.; Cheng, B.; Wan, H.; Luo, L.; Pan, H.; Zhang, Q. Volatile compound analysis and aroma evaluation of tea-scented roses in China. Ind. Crops Prod. 2020, 155, 112735. [Google Scholar] [CrossRef]
  34. Lapczynski, A.; Bhatia, S.P.; Letizia, C.S.; Api, A.M. Fragrance material review on nerolidol (isomer unspecified). Food Chem. Toxicol. 2008, 46, S247–S250. [Google Scholar] [CrossRef] [PubMed]
  35. Guo, X.; Schwab, W.; Ho, C.T.; Song, C.; Wan, X. Characterization of the aroma profiles of oolong tea made from three tea cultivars by both GC–MS and GC-IMS. Food Chem. 2022, 376, 131933. [Google Scholar] [CrossRef] [PubMed]
  36. Wang, K.; Liu, F.; Liu, Z.; Huang, J.; Xu, Z.; Li, Y.; Chen, J.; Gong, Y.; Yang, X. Analysis of chemical components in oolong tea in relation to perceived quality. Int. J. Food Sci. Technol. 2010, 45, 913–920. [Google Scholar] [CrossRef]
  37. Xu, Y.-Q.; Zhang, Y.-N.; Chen, J.-X.; Wang, F.; Du, Q.-Z.; Yin, J.-F. Quantitative analyses of the bitterness and astringency of catechins from green tea. Food Chem. 2018, 258, 16–24. [Google Scholar] [CrossRef]
  38. Zhang, L.; Cao, Q.Q.; Granato, D.; Xu, Y.Q.; Ho, C.T. Association between chemistry and taste of tea: A review. Trends Food Sci. Technol. 2020, 101, 139–149. [Google Scholar] [CrossRef]
  39. Guo, X.; Long, P.; Meng, Q.; Ho, C.T.; Zhang, L. An emerging strategy for evaluating the grades of Keemun black tea by combinatory liquid chromatography-Orbitrap mass spectrometry-based untargeted metabolomics and inhibition effects on α-glucosidase and α-amylase. Food Chem. 2018, 246, 74–81. [Google Scholar] [CrossRef]
  40. Liang, Y.; Lu, J.; Zhang, L.; Wu, S.; Wu, Y. Estimation of black tea quality by analysis of chemical composition and colour difference of tea infusions. Food Chem. 2003, 80, 283–290. [Google Scholar] [CrossRef]
  41. Wen, B.; Zhang, X.; Ren, S.; Duan, Y.; Zhang, Y.; Zhu, X.; Wang, Y.; Ma, Y.; Fang, W. Characteristics of soil nutrients, heavy metals and tea quality in different intercropping patterns. Agroforest. Syst. 2020, 94, 963–974. [Google Scholar] [CrossRef]
  42. Chen, Y.; Jiang, Y.; Duan, J.; Shi, J.; Xue, S.; Kakuda, Y. Variation in catechin contents in relation to quality of ‘Huang Zhi Xiang’ Oolong tea (Camellia sinensis) at various growing altitudes and seasons. Food Chem. 2010, 119, 648–652. [Google Scholar] [CrossRef]
  43. Tao, W.; Zhou, Z.; Zhao, B.; Wei, T. Simultaneous determination of eight catechins and four theaflavins in green, black and oolong tea using new HPLC–MS–MS method. J. Pharm. Biomed. Anal. 2016, 131, 140–145. [Google Scholar] [CrossRef]
  44. Zeng, L.; Fu, Y.Q.; Liu, Y.Y.; Huang, J.S.; Chen, J.X.; Yin, J.F.; Lin, S.; Sun, W.J.; Xu, Y.Q. Comparative analysis of different grades of Tieguanyin oolong tea based on metabolomics and sensory evaluation. LWT 2023, 174, 114423. [Google Scholar] [CrossRef]
  45. Wang, L.F.; Lee, J.Y.; Chung, J.O.; Baik, J.H.; So, S.; Park, S.K. Discrimination of teas with different degrees of fermentation by SPME–GC analysis of the characteristic volatile flavour compounds. Food Chem. 2008, 109, 196–206. [Google Scholar] [CrossRef]
  46. Ho, C.-T.; Xin, Z.; Shiming, L. Tea aroma formation. Food Sci. Hum. Wellness 2015, 4, 9–27. [Google Scholar] [CrossRef]
  47. Zeng, L.; Jin, S.; Xu, Y.Q.; Granato, D.; Fu, Y.Q.; Sun, W.J.; Yin, J.-F.; Xu, Y.-Q. Exogenous stimulation-induced biosynthesis of volatile compounds: Aroma formation of oolong tea at postharvest stage. Crit. Rev. Food Sci. Nutr. 2022, 1–11. [Google Scholar] [CrossRef] [PubMed]
  48. Dai, Y.; Zhi, R.; Zhao, L.; Gao, H.; Shi, B.; Wang, H. Longjing tea quality classification by fusion of features collected from E-nose. Chemom. Intell. Lab. Syst. 2015, 144, 63–70. [Google Scholar] [CrossRef]
  49. Hidayat, S.N.; Triyana, K.; Fauzan, I.; Julian, T.; Lelono, D.; Yusuf, Y.; Ngadiman, N.; Veloso, A.C.A.; Peres, A.M. The electronic nose coupled with chemometric tools for discriminating the quality of black tea samples in situ. Chemosensors 2019, 7, 29. [Google Scholar] [CrossRef]
Figure 1. Relationship between each volatile organic compound (VOC) of Bao-chung tea leaves brewed using reverse osmosis (RO) water and deionized water. Each point indicates the average of two batches of analysis for each tea sample by RO or deionized water separately. The concentration (μg mL−1) represents the quantitative result of each compound relative to the external standard (Ethyl decanoate).
Horticulturae 09 00930 g001
Figure 2. Intensity of VOCs released from brewed tea leaves of different Bao-chung tea grades. Each dot indicates the average of two batches of analysis for each tea sample brewed with RO water. Each bar represents the average of each tea grade set, and the error bar indicates the standard error of each grade set. The concentration (μg mL−1) represents the quantitative result of each compound relative to the external standard (ethyl decanoate). Different lower case letters suggest significant differences among different quality levels indicated by the LSD test at p ≤ 0.05.
Horticulturae 09 00930 g002
Figure 3. Ratio of VOCs released from brewed tea leaves of different Bao-chung tea grades. Each dot indicates the average of two batches of analysis for each tea sample brewed with RO water. Each bar represents the average of each tea grade set, and the error bar indicates the standard error of each grade set. The ratio (%) indicates that the peak area of a specific compound is proportional to the total peak area of all compounds. The concentration represents the quantitative result of each compound relative to the external standard (ethyl decanoate). Different lower-case letters suggest significant differences among different quality levels indicated by the LSD test at p ≤ 0.05.
Horticulturae 09 00930 g003
Figure 4. Distinguishing results of different Bao-chung tea grades based on LDA: (A) intensity of VOCs, (B) ratio of VOCs, (C) intensity and ratio of VOCs, and (D) contents of eight individual catechins of brewed tea leaves.
Horticulturae 09 00930 g004
Figure 5. Catechin content in the brewed tea samples of different Bao-chung tea grades. Each dot indicates the average of two batches of analysis for each tea sample brewed with RO water. Each bar represents the average of each tea grade set, and the error bar means the standard error of each grade set.
Horticulturae 09 00930 g005
Figure 6. Relationship between the relevant catechin content predicted by the regression equation of volatile organic compounds and the actual catechin content of Bao-chung tea. Each point indicates the average of two batches analysis for each tea sample.
Horticulturae 09 00930 g006
Figure 7. LDA distinguishing results of different Bao-chung tea grades from the E-nose data.
Horticulturae 09 00930 g007
Table 1. Odor descriptions and odor threshold values of the identified volatiles in Bao-chung tea from collected samples.
No.Volatile CompoundsRI zOdor Description yThreshold x
1Benzaldehyde880Grass, floral350
2p-Cymene1010Rosemary11.4
3D-Limonene1013Citrus-like, herbal200
4cis-β-ocimene1027Citrus, spicy1.2036
5trans-Linalool oxide1049Earthy, floral, creamy3000
6cis-Linalool oxide1049Earthy, floral, creamy3000
7Linalool1072Floral0.22
8Hotrienol1076Floral110
9Nonanal1076Sweet, floral1.1
10Allo-ocimene1111FloralN.A. w
11Butanoic acid, 3-hexenyl ester, (E)-1149Floral, fruity781
12Geraniol1213Rose-like7.5
13Indole1251Animal-like40
14Hexanoic acid, 3-hexenyl ester, (Z)-1342Rancid40
15cis-Jasmone1375Floral, jasmine-like7
16Caryophyllene1388Woody–spicy, dry, clove-like14
17trans-β-Ionone1470Woody, violet0.007
18α-Farnesene1495Fruity, herbaceous87
19Nerolidol1574Floral250
z RI, retention index, which is calculated, refers to the retention time of C5–C28 n-alkanes under the same conditions. y Odor descriptions were found in the literature [16,24,25,26,27,28,29,30,31,32,33,34]. x All odor threshold information was found in the literature [25,35]. w ‘N.A.’, no odor threshold information was found in the literature.
Disclaimer/Publisher’s Note: The statements, opinions and data contained in all publications are solely those of the individual author(s) and contributor(s) and not of MDPI and/or the editor(s). MDPI and/or the editor(s) disclaim responsibility for any injury to people or property resulting from any ideas, methods, instructions or products referred to in the content.

