Article

Olive Oil Quality of Cultivars Cultivated in Super-High-Density Orchard under Cold Weather Conditions

by
Maria Gomez-del-Campo
1,*,
Ana G. Pérez
2 and
José M. García
2
1
CEIGRAM, Departamento Producción Agraria, Escuela Técnica Superior de Ingeniería Agronómica, Alimentaria y de Biosistemas (ETSIAAB), Universidad Politécnica de Madrid, Av. Puerta de Hierro 2, 28040 Madrid, Spain
2
Instituto de la Grasa (CSIC), Ctra. de Utrera km. 1, 41013 Sevilla, Spain
*
Author to whom correspondence should be addressed.
Horticulturae 2023, 9(7), 824; https://doi.org/10.3390/horticulturae9070824
Submission received: 5 June 2023 / Revised: 11 July 2023 / Accepted: 12 July 2023 / Published: 18 July 2023
(This article belongs to the Section Postharvest Biology, Quality, Safety, and Technology)

Abstract

:
In this work, the quality parameters of the oils of seven different varieties of olives (Olea europaea cvs, “Arbequina”, “Arbosana”, “Cobrançosa”, “Cornicabra”, “Koroneiki”, “Cacereña”, and “Chiquitita”) grown in hedgerow under cold conditions during three consecutive seasons were analyzed in order to evaluate their adaptation to this growing system. For this purpose, virgin olive oils (VOOs) were extracted, and, in addition to evaluating the indices of hydrolytic, oxidative, and sensory deterioration of the oils, their content in photosynthetic pigments and their composition in fatty acids and phenolic compounds were determined. The correlation between oxidative stability and the parameters evaluated has been studied, with the highest correlation coefficients found for the ratio MUFA/PUFA (0.871) and the content of secoiridoid phenolic compounds (0.816). Furthermore, principal component analysis was performed with the phenolic composition data from each season, which demonstrated the major influence of genetic factors in the phenolic composition of VOO. None of the VOOs presented hydrolytic, oxidative, or sensory deterioration, so all of them remained in the “extra” category. However, it should be noted that the mean ultraviolet absorbance values were significantly higher in “Cornicabra” and significantly lower in “Cacereña” oils. In spite of this, the oxidative stability was significantly higher in “Cornicabra” oils (125 h), which also had the highest mean phenolic content (1035 mg kg−1 oil), while the lowest phenolic content values were found in “Arbequina” and “Chiquitita” (58 and 52 h, respectively).

1. Introduction

High-density hedgerow orchards were first developed in Spain in the mid-1990s, and the possibility of complete mechanical harvest has encouraged their increase in surface [1]. After more than 20 years of the first hedgerow orchard, more than 100.000 ha have been established all along the olive-growing countries [2]. Meanwhile, very few cultivars have adapted to this system [1]. In fact, more than 90% of these orchards have been established with “Arbequina”, and few hectares with “Arbosana” and “Koroneiki” [3,4]. “Chiquitita” is one of the last olive cultivars selected for high-density orchards [4]. It was obtained in Córdoba (Spain) from a cross of “Picual” and “Arbequina” [5].
The comparative study of oil production and quality of the cultivars used for hedgerow cultivation is gaining interest. Most studies have been carried out in regions with relatively warm climates such as Tunisia [6], Sicily [7], Cyprus [8], and California [4], comparing the performance of the cultivars “Arbequina”, “Arbosana”, “Koroneiki”, and “Chiquitita”. More recently, Rodrigues et al. [9] tested the viability of eleven different cultivars in high-density cultivation in a grove located in Valladolid, characterized by a moderate cold winter, with cool nights and a hot summer. They tested the behavior of the cultivars “Arroniz”, “Cornicabra”, “Frantoio”, “Hojiblanca”, “Manzanilla”, “Picual”, “Picudo”, “Redondilla”, and “Royuela2, until now little used in hedgerow cultivation, and that of the most widely used Spanish cultivars: “Arbequina” and “Arbosana”. The authors found similar levels of quality among the oils of the cultivars tested under these conditions and those showed by the oils obtained from the same cultivars in other warmer Mediterranean regions.
In 2015, Morales-Sillero and García [10] tested the effect of the harvesting system on fruit physiology and oil quality in the cultivars Manzanilla de Sevilla (“Manzanilla”) and Manzanilla “Cacereña” (“Cacereña”) grown in a hedgerow orchard in Portugal (38° 56′ N; 07° 02′ W; 210 masl). In both cultivars, the mechanical harvesting caused fruit physiological damage and had detrimental effect on the antioxidant content and on the intensity of positive sensory attributes of the virgin olive oil (VOO) extracted. However, they kept the best “extra” level of commercial quality. “Cacereña” olives presented better adaptation to hedgerows and to mechanical harvesting. The VOO extracted from this cultivar is considerably more stable against oxidation than the one obtained from “Arbequina”. The effect of the cultivation of “Cacereña” fruit in hedgerow on VOO characteristics is a factor that deserves to be studied in more detail.
Under cold conditions, vigor problems are reduced, but the olive tree is only moderately frost-resistant [11], and harvesting should be carried out earlier in the season to avoid damage caused by the freezing of fruits. This fact determines that the oil subsequently extracted from less-ripe fruit exhibits better oil quality with a higher oleic acid concentration in the fatty acid composition, less free fatty acid content, lower values in the parameters used to evaluate the oxidation level (peroxide value and ultraviolet absorbance), and higher content in pigment, phenolic, and volatile components [12]. The cold area of the center of Spain, the high plateau of south Castilla (39°53′ N, 4°27′ W, 479 masl), has suitable conditions for obtaining high-quality VOO, and the number of hedgerow olive plantations has increased considerably in the last 10 years. Our research team has evaluated over 9 years the characteristics of seven different olive cultivars under hedgerow cultivation, analyzing their productivity in order to know the suitability of these cultivars for hedgerows under cold weather conditions [13]. Cultivars were chosen for their proven adaptation to high-density orchards (“Arbequina”, “Arbosana”, “Koroneiki”, and “Chiquitita”) and for their resistance to cold temperatures (“Cobrançosa”, “Cornicabra”, and “Cacereña”). This paper presents the results obtained in the evaluation of the quality of the oils that were extracted from these cultivars during the last three seasons of this study.
There is a reduced number of cultivars suitable for super-high-density orchards in cold areas, and the decision regarding plantation should be determined not only considering production characteristics but also oil quality. The results presented here would add new qualitative information to the production data already published [13] in order to have the best possible criterion to determine the potential of these cultivars under these growing conditions.

2. Material and Methods

2.1. Site and Orchard

The trial was conducted in an east–west hedgerow spaced 4 × 1.3 m (1923 olives/ha) planted in La Puebla de Montalbán (39°53′ N, 4°27′ W, 479 masl), Toledo, Castilla, central Spain. An experiment of three randomized blocks of 8 consecutive trees of cultivars was established in June 2008 with cv. “Arbequina”, “Arbosana”, “Cobrançosa”, “Cornicabra”, “Koroneiki”, and “Cacereña”. “Chiquitita” was planted one year later.
The soil was a clay–loam of three layers; an A horizon (0–0.15 m), a B horizon (0.15–0.40 m), and below, a carbonaceous C horizon which impeded root penetration. The experimental hedgerows were managed using standard commercial practice. Hedgerows received supplementary irrigation, using single drip lines per row with emitters at 0.5 m spacing discharging 3.0 L/h; the amount depended on the yearly climatic conditions (1700 to 2000 L/tree from March to October). Fertigation was used to apply nutrient amounts determined by prior leaf analysis. The central exe of the youth trees were trained until 2012.

2.2. Oil Characteristics and Components

Olives (3 kg) were harvested from six olive trees per triplicate on 27 October 2014, 24 October 2015, and 7 November 2016, respectively, for each season. Oils of each 3 kg triplicates were physically extracted separately, using an “Abencor” analyzer (Comercial Abengoa S.A., Seville, Spain). The triplicate fruit samples were separately crushed in a hammer mill (radius 47.5 mm, with a sieve of 5.0 mm diameter) at 3000 rpm. The resulting olive paste was placed in stainless steel 1 L jars and malaxed for 30 min in the thermo-beater at 28 °C, using 4 stainless steel cross blades at 54.5 rpm (radius 53 mm). Subsequently, the paste was centrifuged in a pulp centrifuge for 1 min at 3500 rpm (radius 100 mm) to separate the liquid phase (oil and wastewater) from the solid waste. The oil was then decanted into graduated tubes, removed with a pipette, filtered through filter paper, and stored in a N2 atmosphere at –20 °C until analysis [14].
Free acidity, peroxide index, K232, and K270 values of each oil extracted were evaluated according to the European Union Standard Methods (EEC, 1991). Informal sensory evaluation of the oils was carried out by 2 trained tasters only, because we did not have the amount of samples required for an analytical panel of 8 tasters for the oils of the two first seasons (2014 and 2015). The main positive (olive fruit, bitterness, and pungent) and negative (fusty, musty, winey, rancid, and unspecified others) sensory attributes of the VOOs were evaluated using an unstructured scale, marking the intensity level of each sensory attribute in a 10 cm line, considering the left end of the line the point that indicates the absence of the attribute, and the right end its maximum possible intensity. Each determination was evaluated according to the distance (cm) between the left end and the mark carried out by each taster in the intensity scale line. Each presented value corresponds to the median of the distribution of intensities for each sensory attribute in each oil sample. In addition, the tasters described the sensory notes of the oils.
Oxidative stability was measured using the Rancimat method, which evaluates the time (h) of resistance to oxidation of 3 g of oil sample exposed to a stream of dry air (20 L·h−1) at a temperature of 100 °C [15]. The chlorophyll and carotenoid contents of the VOOs were estimated, respectively, through their absorbances at 470 and 670 nm, and the results expressed as mg kg−1 [16].
The fatty acid composition was determined by gas–liquid chromatography of the methyl esters formed according to the method proposed by Mancha and Sanchez [17]. This analysis was performed on an Agilent 6890 gas chromatograph equipped with a flame ionization detector, and fitted with a fused-silica capillary column (SP-2380, 60 m 0.25 mm I.D.) coated with cyanopropylsilicone (0.20 mm film thickness). Hydrogen was employed as the carrier gas at a flow of 1 mL min−1. The oven temperature was maintained at 185 °C, and the injector (split 1:20) and detector at 225 °C. The data presented here refer to the main fatty acids (number of carbons/number of unsaturations): palmitic (16:0), palmitoleic (16:1), stearic (18:0), oleic (18:1), and linoleic (18:2). Other fatty acids such as myristic (14:0), palmitoleic (16:1), margaric (17:0), margaroleic (17:1), linolenic (18:3), arachidic (20:0), gadoleic (20:1), or behenic acid (22:0) were analyzed but are not individually shown, because their content values were too low (<0.6%) and do not play any significant role in oil quality.
The following formulas using fatty acid content variables were calculated:
Oleic/linoleic Ratio (OLR) = |18:1|/|18:2|
Saturated fatty acid (SAFA) = |16:0| + |17:0| + |18:0| + |20:0| + |22:0|
Monounsaturated fatty acid (MUFA) = |16:1| + |17:1| + |18:1| + |20:1|
Polyunsaturated fatty acid (PUFA) = |18:2| + |18:3|
Unsaturated fatty acid (UNFA) = |16:1| + |17:1| + |18:1| + |18:2| + |18:3| + |20:1|
UNFA/SAFA
MUFA/PUFA
The phenolic fraction of the same replicate samples was isolated via solid-phase extraction [18] and analyzed using reverse-phase HPLC using a Beckman Coulter liquid chromatographic system equipped with a System Gold 168 detector, a solvent module 126, and a Mediterranea Sea 18 column (4.0 mmi.d. × 250 mm, particle size 5 µm) (Teknokroma, Barcelona, Spain) following a previously described methodology [19]. The quantification of phenolic compounds was carried out at 280 nm using p-hydroxyphenylacetic acid as an internal standard, whereas that of flavones was made at 335 nm using o-coumaric acid as an internal standard. The content of each phenolic compound was calculated considering its individual response factor in relation to the internal standard.

2.3. Statistical Analysis

The effect of the cultivar on the measured parameters was statistically analyzed using a randomized block complete design with 3 replicates and one-way ANOVA. When ANOVA detected a significant effect due to the factor cultivar (p ≤ 0.05), the differences in the mean values of the different treatments were separated using the LSD-test for a level of significance p ≤ 0.05. The correlation between the possible oxidative-stability-related variables was calculated using the Pearson’s correlation coefficients, considering three seasons (from 2014–2015 to 2016–2017). Principal component analysis (PCA) considering the variables of the contents of the different phenolic molecules in all the tested cultivars was separately evaluated in the same seasons. All the data were statistically evaluated using STATISTICA 5.0 (Statsoft Inc., Tulsa, OK, USA).

3. Results and Discussion

3.1. Oil Analysis

The oils extracted from the different cultivars studied always presented values of free acidity below the limit legally established for the best commercial category of VOO, called extra (0.8% oleic acid), during the three seasons in which this parameter was analyzed (Table 1). The cultivar factor does not seem to have any effect on the oil hydrolytic alteration parameter. However, in the second season (2015), the values of this parameter systematically decreased in all the cultivars tested compared to the precedent and the subsequent seasons.
The peroxide values of these oils were also below the limit established for extra virgin olive oils (EVOOs) (20 meq O2 kg−1). The mean values of the different cultivars during the three seasons tested did not show significant differences in this parameter. However, considering each season individually, only during the second season was no significant effect due to the different cultivars found. In the first and the third seasons, the oils of the cultivars exhibited significant differences between them. Thus, in 2014, the highest peroxide values corresponded to the oil from “Cobrançosa” (11.4 meq O2 kg−1), and the lowest by “Arbequina”, “Cacereña”, and “Cornicabra” (7.0, 8.3, and 8.4 meq O2 kg−1, respectively), while in 2016, the highest values corresponded to the oil from “Koroneiki” (14.2 meq O2 kg−1), and the lowest from “Cacereña” (9.0 meq O2 kg−1). The season clearly affected this parameter, which decreased to the lowest mean values in the second season, and, subsequently, in 2016, the mean values were the highest.
The absorbance of the oils at 232 nm measures the presence of conjugated fatty acids in the oils, a step that precedes the entry of atmospheric oxygen into the fatty acyl molecules of triacylglycerides, breaking a double bond to form hydroperoxides that are measured by the peroxide value. The high values of K232 found in the oils extracted in the first season studied are noteworthy. Some of oils exhibited values quite close to limit established for the EVOO (2.50). However, no effect was observed due to the cultivar in this season. Considering the mean values, “Cornicabra” oils presented the highest values among the cultivars tested by a significant margin. K270 evaluates the contents in compounds with a carbonyl group in VOOs. They are formed as a result of the rupture of the oxidized acyls of hydroperoxides at an advanced stage of the oxidative alteration of VOOs.
Similarly, regarding what was observed in the K232 values, the highest values of K270 were found during the first season tested (2014); this was the only season that presented significant differences in this parameter between different cultivars, and the “Cornicabra” oil also presented the highest value of this parameter, indicative of oxidative alteration (0.20 in 2014 and 0.17 as the mean value). In contrast, “Cacereña” and “Arbequina” oils showed the lowest values of this parameter in 2014 (0.08 and 0.11, respectively), with mean values of 0.10 and 0.11, respectively, for the three seasons. In any case, none of the parameters measuring hydrolytic or oxidative deterioration of the oils exceeded the legally established limits for the extra category of commercial-quality virgin olive oils. Normally, if the fruit is processed immediately after harvest, it should not experience quality deterioration that would result in downgrading. Thus, for instance, Wang et al. [20], working in southwest China with the cultivars “Arbequina”, “Coratina”, “Frantoio”, and “Koroneiki”, as well as Polari et al. [4], working in California with “Arbequina”, “Arbosana”, and “Koroneiki”, found that all the extracted oils from these cultivars show quality parameters within limits for the extra virgin category, according to the legally stablished standards. However, Usanmaz et al. [8] obtained oils from “Arbequina” cultivated in hedgerows in northern Cyprus with a higher free fatty acid content than the International Olive Council (IOC) limit (0.8% oleic acid) for extra virgin olive oil, while the oils extracted from “Arbosana”, “Chiquitita”, “Koroneiki”, and “Tosca” also grown in the same location under the same conditions maintained the extra quality level. “Arbequina” fruits are especially sensible to mechanical harvesting and a short delay in their processing could induce a serious deterioration in the virgin oil [21].
An evaluation by only two trained tasters does not have the scientific rigor of an analytical panel, which requires a minimum of eight tasters, but offers a valid approximation of the sensory characteristics of the cultivars used in this research (Table 2). No negative attributes were detected in any of the oil extracted. All of them exhibited a medium intensity level of the fruity attribute, so all may be classified as EVOOs according to their sensory properties. The VOOs extracted from “Cobrançosa” had the highest level of the fruity attribute during the two seasons tested, while “Arbosana” and “Koroneiki” oils exhibited the lowest values, and the other oils occupied intermediate positions. In the second season, most of the oils were evaluated with a higher intensity of bitterness and pungency. This fact is consistent with the different degree of maturity index (MI) exhibited by the fruits harvested in both seasons [13]. This circumstance can explain the differences in intensity found in the oils of the same cultivars in both seasons. Thus, “Arbequina” oils from fruits that were harvested with MI 3.4 and 0.1 in 2014 and 2015, respectively, did not clearly differ in bitterness, but notably in intensity of pungency (0.7 and 2.1, respectively). In “Arbosana”, the oils obtained from fruits that did not appreciably differ in MI (0.6 and 0.1, respectively) were only slightly different in bitterness (1.3 and 2.2, respectively). “Cobrançosa” fruits, which differed clearly in MI (4.2 and 1.5, respectively), produced oils which were clearly different in terms of pungency intensity (2.6 and 4.9). “Cornicabra” fruits were harvested with MI 2.4 and 0.3, and their corresponding oils had only a slight difference in bitterness intensity (2.0 and 2.6, respectively), and they also showed a reduction in pungency intensity (4.4 to 4.1). “Koroneiki” fruits were harvested with MI 1.7 and 0.1, respectively, but in the second season, their oils experienced a clear reduction in both sensory attributes (3.2 to 2.2 and 5.5 to 4.5, respectively, for bitter and pungent intensities), making this cultivar the clearest exception of the general behavior previously described. “Cacereña” olives were harvested with MI 5.4 and 2.2 and their oils exhibited the clearest differences in the intensity of both sensory attributes (0.0 and 3.7 for bitter and 0.5 and 3.6 for pungent). Finally, the oils obtained from “Chiquitita” fruits, with an MI of 1.5 and 0.3, exhibited only clear differences in the intensity of bitterness in the two seasons tested (0.6 and 2.4, respectively). The descriptive profiles also correlated with the different maturity indices of the fruits in both the seasons tested. Thus, in the second season the, flavor notes defined as “grass” or “leaf” were found in five of the seven oils tested, indicating that those oils were obtained from fruits with a reduced MI. In contrast, these descriptive notes were not found in any of the oils extracted in the first season.
The results obtained support the idea that the sensory expression of virgin oils is mainly influenced by two factors: the type of variety, whose particular genetics control both its phenolic composition and the formation of volatile compounds [22], and the level of ripening of the fruit, which also determines the content of these molecules [23]. Other factors associated with the characteristic of each season, such as olive bearing or the volume of raining, could also condition the sensory quality of the virgin oils [24]. However, hedgerow cultivation requires annual systematic pruning and programmed fertirrigation, which minimize the factors that depend on each season, such as the level of irrigation or the olive tree alternate bearing [25]. In addition, the low temperature during the harvest period makes it necessary to bring it forward to minimize frost on the fruit, so harvesting should be limited to very low degrees of ripeness. Consequently, under the perspective of this work, the genetic factor is the one that should be mainly considered. Thus, “Cobrançosa”, “Cornicabra”, and “Koroneiki” presented a better-balanced presence of positive attributes in the virgin oils during the two seasons in which their sensory quality was assessed.
The oils extracted from the “Cornicabra” fruit systematically exhibited the significantly highest values of oxidative stability in each season tested (Table 3). In contrast, the cultivars “Chiquitita”, “Arbequina”, “Cobrançosa”, and “Cacereña” were those that showed the lowest mean values of this parameter, but without exhibiting a regular behavior in each season. The mean values of this parameter were significantly lower in the first season tested due to the higher level of MI presented by the cultivars [13]. The high stability of “Cornicabra” oils is a well-known fact due to their high phenol content [26]. Alvarruiz et al. [27] and Montaño et al. [28] found that “Cornicabra” oils were more stable than “Arbequina” and “Cacereña” oils, respectively.

3.2. Photosynthetic Pigments

The mean content in photosynthetic pigments (carotenoids and chlorophylls) varied significantly among the three seasons studied. The lowest values corresponded to the first one (2014), and the highest values to the second one (Table 3), coinciding, respectively, with the higher and lower values of the fruit IM [13]. Previously, Criado et al. [12] found a clear decrease in the pigment content of the olive oil extracted from “Arbequina” and Farga fruits with an increasing level of ripening. The factor cultivar also exerted a significant effect on these variables during the three seasons tested, and the oils from “Koroneiki” and “Chiquitita” were those that systematically presented the highest mean values, while “Cacereña” also systematically exhibited the lowest content the three seasons. In contrast, the oils from “Arbequina” showed very different contents in each season. This fact could be related to the higher MI of this cultivar in the 2014 season [13]. The genetic influence in the pigment content has already been observed in other studies; even chlorophyll content has been proposed as a methodology for olive oil cultivar differentiation [29,30]. Criado et al. [31] obtained clearly lower pigment contents in virgin oils from “Arbequina” olives grown in Catalonia (northwest Spain) than the ones presented in this paper. This fact indicates that the growth zone also influences this parameter. It is possible that our conditions of higher altitude and lower temperature induce a higher recovery of these compounds in olive oils. Considering the proven antioxidant character of carotenoids and the sensory appeal of the green color in virgin olive oils, which favors the consumer’s association of this product with its origin from a fresh, young, and healthy olive, the varieties with a higher content of these pigments would be the most advisable to use; in this case, “Koroneiki” and “Chiquitita”.

3.3. Fatty Acid Composition

The highest contents of palmitic acid were found in the oils extracted from “Arbequina” (15.2%) and “Chiquitita” (15.0%), while the lowest contents were obtained from the oils of “Cornicabra” (12.0%) and “Koroneiki” (12.5%) (Table 4). Similarly, the highest contents of palmitoleic acid corresponded to the same cultivars, with 1.5% in both of them, while “Koroneiki” (0.8%) and “Cornicabra” (1.1%) oils showed the lower lowest percentages. In contrast, the higher mean contents of stearic acid corresponded to the VOO of “Cobrançosa” (4.1%), and the lowest ones to “Chiquitita” (0.8%) and “Arbequina” (2.0). As was expected for any VOO, the greatest content was found to be the oleic acid in all the tested cultivars, highlighting those presented by “Cornicabra” (78.7%) and “Koroneiki” (76.7%), while “Arbequina” (68.3%) and “Cobrançosa” (68.9%) oils showed the smallest percentages. The only polyunsaturated fatty acid that showed a content > 0.6% was linoleic acid, the highest values corresponding to “Arbequina” oils (10.3%) and “Cobrançosa” (9.9%), and the lowest to “Cornicabra” oils (3.2%) and “Koroneiki” (5.5%).
The mean values of the percentages of palmitic and palmitoleic acid in the oils of all the cultivars tested decreased in the third and fourth seasons compared to the mean values shown during the first two seasons. In contrast, the percentages of estearic and oleic acids exhibited an inverse behavior, with higher values in the last two seasons tested. Linoleic acid percentages showed significantly higher mean values during the second season (2014), coinciding with the lowest mean values of oleic acid.
As predicted, the higher mean values of OLR corresponded to oils that contained simultaneously higher and lower percentages of oleic and linoleic acids, respectively (Table 5). Thus, the VOOs of “Cornicabra” (24.9%) were those that showed significantly higher ratios, while “Arbequina” (6.8), “Cobrançosa” (7.7), and “Chiquitita” (7.9) showed the lowest values. “Arbequina” and “Cobrançosa” VOOs exhibited the highest SAFA values (18.6 and 17.8, respectively), while “Koroneiki” (15.5), “Cornicabra” (15.8), and “Cacereña” (16.2) showed the lowest values of this addition of percentages. These same oils, but in a different order, exhibited the highest MUFA values (80.7, 78.5, and 77.6 for “Cornicabra”, “Koroneiki”, and “Cacereña”, respectively); on the opposite side are the oils of “Arbequina” (71.0), “Cobrançosa” (71.2), and “Chiquitita” (73.1). The oils from these three cultivars contained the highest mean values of PUFA. Thus, “Arbequina” (10.7), “Cobrançosa” (10.3), and “Chiquitita” (9.6) oils presented the highest values of this parameter, and the oil extracted from “Cornicabra” (3.5%) showed the lowest percentage of this group of fatty acids by a significant margin.
The UNFA percentage and the UNFA/SAFA ratio did not show any effect due to the different cultivars tested, in each one of the seasons analyzed, or in the mean values of these seasons. The MUFA/PUFA ratio offered similar results to OLR because, respectively, oleic and the linoleic acids are the main components of the MUFA and the PUFA groups. The OLR and MUFA/PUFA mean values were slightly affected by the different seasons, presenting a reduction during the second season tested, but this decrease only resulted statistically significant compared to the mean values of this parameter exhibited in the last season tested (2016). SAFA mean percentages decreased the third and the fourth seasons in relation to the values exhibited during the first two seasons. PUFA, UNFA, and UNFA/SAFA were not affected by the different seasons. However, the mean values of MUFA/PUFA increased in the last two seasons.
The composition of fatty acids depends mainly on the genetic characteristic of each cultivar, but the maturity level of the fruit [32], the growing temperature [33], and the growing conditions [34] also are determinant. The comparison of the results obtained in this paper with those previously obtained by other authors working with the same cultivars in different locations under different maturities and growing conditions indicates that each cultivar always exhibited a particular fatty acid composition, but they show a wide range of variability in each of its main fatty acids: palmitic, oleic, and linoleic.
Thus, the oil from “Arbequina” fruits can exhibit contents of palmitic acid that can vary from 13.86% in fruits harvested in Sicily [7] to 20.5% in oils extracted in the south of Spain [17]; the oleic acid in this cultivar normally shows relatively low values (<65%) [1,17,34], but Marino et al. [7] obtained “Arbequina” oils with 72.39% of this fatty acid. Finally, this cultivar can exhibit a wide range of linoleic acid content values, which can vary from 9.50% [19] to 18.00% [24]. Under our conditions, the composition of fatty acids of “Arbequina” oils exhibited relatively low values of palmitic and linoleic acids and high values of oleic acid in comparison to those obtained by other authors. This fact can be attributed to the low level of ripening of the fruits used for oil extraction. Normally, the progress of olive ripening coincides with the increase in the presence of palmitic and linoleic acids and the reduction in oleic acid [32,33].
In “Arbosana” oils, the highest values of palmitic and linoleic content and the lowest values of oleic acid were found by Allalout et al. [6] in fruits harvested in Tunisia (17.8%, 12.9%, and 58.8%, respectively), while the reverse situation was observed by Marino et al. [7] in oils extracted in Sicily (12.3%, 9.9%, and 75.0%, respectively). The results obtained in this work are closer to those obtained in Tunisia and almost coincide with those obtained by Wang et al. [35] in China (14.3%, 71.1%, and 8.7%, respectively).
In the literature consulted, the concentrations of palmitic, oleic, and linoleic acids of the “Cacereña” oils ranged between the composition found by Morales–Sillero and García [10] (12.8%, 78.5%, and 4.4%, respectively) in oils extracted from olives cultivated in hedgerow in Portugal and those extracted in China, in the study published by Wang et al. [35] (15.0%, 68.2%, and 9.0%, respectively); our results are more similar to the former.
The composition of fatty acids of the “Cobrançosa” oils presented in this study differs substantially from those previously obtained in Portugal by Pereira et al. [36], Mateos et al. [18], and Amaral et al. [37], which presented higher values of oleic acid (>75.0%) and lower values of palmitic and linoleic acids (<10.0% and <7%). This fact is probably due to the different growing location.
According to the fatty acid composition results obtained, the oils extracted from the “Cornicabra”, “Koroneiki”, and “Cacereña” cultivars were those with the highest oleic content. The oils extracted from the “Cornicabra” and “Koroneiki” cultivars had the highest oleic and lowest palmitic contents, which makes them very interesting from a nutritional point of view.

3.4. Phenolic Composition

Sixteen different phenolic compounds were analyzed in the VOOs. In most cultivars, the major phenolic fraction was that of secoiridoid phenolic compounds composed of four different phenolic molecules. The main phenolic molecule was the dialdehydic form of the decarboxymethyl oleuropein aglycone (3,4-DHPEA-EDA), named oleacein; followed by the dialdehydic form of the decarboxymethyl ligstroside aglycone (p-HPEA-EDA), also named oleocanthal; the hydroxytyrosyl elenolate (3,4-DHPEA-EA); and the Tyrosyl-elenolate (p-HPEA-EA) (Table 6). Besides these four secoiridoid compounds, two flavones (luteolin and apigenin), two lignans (pinoresinol and acetoxypinoresinol), four phenolic acids (vanillic, p-coumaric, cinnamic, and ferulic acid), and other simple phenolic compounds such as tyrosol (p-HPEA), hydroxytytrosol, vainillin, and hydroxytyrosol acetate (3,4-DHPEA acetate) were also analyzed.
“Cornicabra” oils showed the highest mean value of 3,4-DHPEA-EDA and systematically maintained the first statistical position in the three seasons tested. “Arbequina” oils represented the second place in the mean value of this phenolic compound, but there was no significant difference compared with the first one (“Cornicabra”), nor was there between the third and the fourth (“Cobrançosa” and “Arbosana”). This relevant position is due to the highest content exhibited by this cultivar the third season (406.9 mg kg−1). In contrast, the oils from “Koroneiki”, “Cacereña”, and “Chiquitita” exhibited the lowest mean contents of this phenolic compound. The harvesting season seems to affect the phenolic content of all the cultivars, which generally exhibited the highest values in the last season (2016).
Differences in the degree of ripening would explain the low values obtained in the first year, when olives were harvested with a higher ripening index. However, in the third year, in which the oils reached the highest levels of 3,4-DHPEA-EDA, olive fruits had a greater ripening index than those used in the second year [38]. These results show that the growing conditions, which can vary annually, can also affect the phenolic composition of the oils. Recently, Miho et al. [39] studied the effect of cultivar and inter-annual growing conditions on the phenolic content of oils extracted from olives with the same degree of ripeness (2.0) from 44 different olive cultivars grown in Cordoba (southern Spain) during three consecutive seasons under an intensive regime. Similarly, to what is observed in Table 7, Miho et al. [39] concluded that the most important determinant of the phenolic composition of olive oils was genetic, due to the different cultivars, but that growing conditions could also influence these contents. On the other hand, the oils extracted by these authors from “Arbequina”, “Arbosana”, “Cornicabra”, “Koroneiki”, and “Chiquitita” olives presented higher mean oleacein contents than their counterparts obtained in this work. In our trial, only the “Cacereña” oils exceeded the values found in their counterpart oil from Córdoba. This fact supports the idea that the geographical factor can also influence phenolic composition.
In addition to the four major secoiridoid compounds already mentioned, significant differences were also found in relation to other phenolic compounds such as acetoxypinoresinol, luteolin, hydroxytyrosol, tyrosol, hydroxytyrosol acetate, apigenin, and Pinoresinol. The highest mean values of acetoxypinoresinol were again found in “Cornicabra” oils (40.1 mg kg−1), but without significant differences compared to “Arbosana” oils (32.0 mg kg−1). On the contrary, the lowest mean value was exhibited by “Chiquitita” oils (16.4 mg kg−1), which did not statistically differ from those of “Cobrançosa” and “Cacereña” oils (21.1 and 23.6 mg kg−1, respectively). This phenolic compound was also affected by the season; the highest mean value was found in the third season and the lowest in the second. The main flavone was luteolin, and the oils from “Chiquitita” exhibited the highest mean content (13.9 mg kg−1). However, this value did not significantly differ from those of the oils from “Cacereña” and “Arbequina” (11.0 and 10.9 mg kg−1, respectively). In contrast, “Koroneiki” and “Cornicabra” oils showed, without significant differences between them, the lowest values (5.7 and 5.1). The harvesting season did not significantly affect this variable. The mean content of hydroxytyrosol and tyrosol in the oils from “Koroneiki” cv. (Table 7) were the highest (18.3 and 24.8 mg kg−1, respectively) due to the high concentration presented by these oils during the 2015 season (44.4 and 61.3 mg kg−1, respectively). No significant differences were found between the mean values of the rest of the oils in both parameters. However, in the first season, the oils from “Cacereña” fruits showed the highest values of the two phenolic alcohols. The factor season determined significant differences between the mean values of these variables in each year tested, and those found in the last season were significantly lower. The oils from “Arbequina” and “Chiquitita” were those with the highest content in hydroxytyrosol acetate content, both as mean value of all the seasons studied as well as in each season separately. The phenolic composition of “Arbequina” and “Chiquitita” oils analyzed in this study seems to be quite similar to those described in previous studies [40,41]. No effect due to the season was detected in this variable. “Arbosana” oils showed the highest content of apigenin during the three seasons tested. In contrast, “Cornicabra” oils systematically showed the lowest content of this flavone. The oils extracted from “Cornicabra” fruit systematically showed the highest content of pinoresinol among the three seasons tested, whereas the oils from “Chiquitita” had the lowest content. The mean value of this phenolic compound in all the cultivars tested significantly decreased in the second season, indicating that its content is affected by growing conditions.

3.5. Correlations among Oxidative Stability and Possible Related Variables

Only 4 of the 17 variables selected did not significantly correlate with the oxidative stability of the oils extracted from the different variables (Table 8). Thus, the peroxide value, K232, and the contents of photosynthetic pigments (carotenoids and chlorophylls) showed a poor correlation coefficient with this variable.
In contrast, the highest correlations were obtained with the MUFA/PUFA ratio (0.871) and the set formed by the secoiridoid derivatives (3,4-DHPEA-EDA, p-HPEA-EDA, 3,4-DHPEA-EA, and p-HPEA-EA, 0.816). Both oleic and linoleic acids also exhibited high coefficients of correlation with this variable, positive for oleic (0.793) and negative for linolenic acid (−0.824). The O-diphenols (hydroxytyrosol, hydroxytyrosol acetate, 3,4-dHPEA-EDA, 3,4-DHPEA-EA, and luteolin), the total phenolic content, a few selected phenolic molecules, and the K270 value showed significant correlations with the oxidative stability of the oils. Among the individual phenolic molecules, the secoiridoid p-HPEA-EDA had the best correlation with oxidative stability (0.802), followed by p-HPEA-EA (0.702). These two compounds also had the highest correlation coefficients with K270. The contents in oleic and linoleic acid did not significantly correlate with the values of K232 and peroxides. Furthermore, the presence of linoleic acid did not correlate with the contents of both photosynthetic pigments.

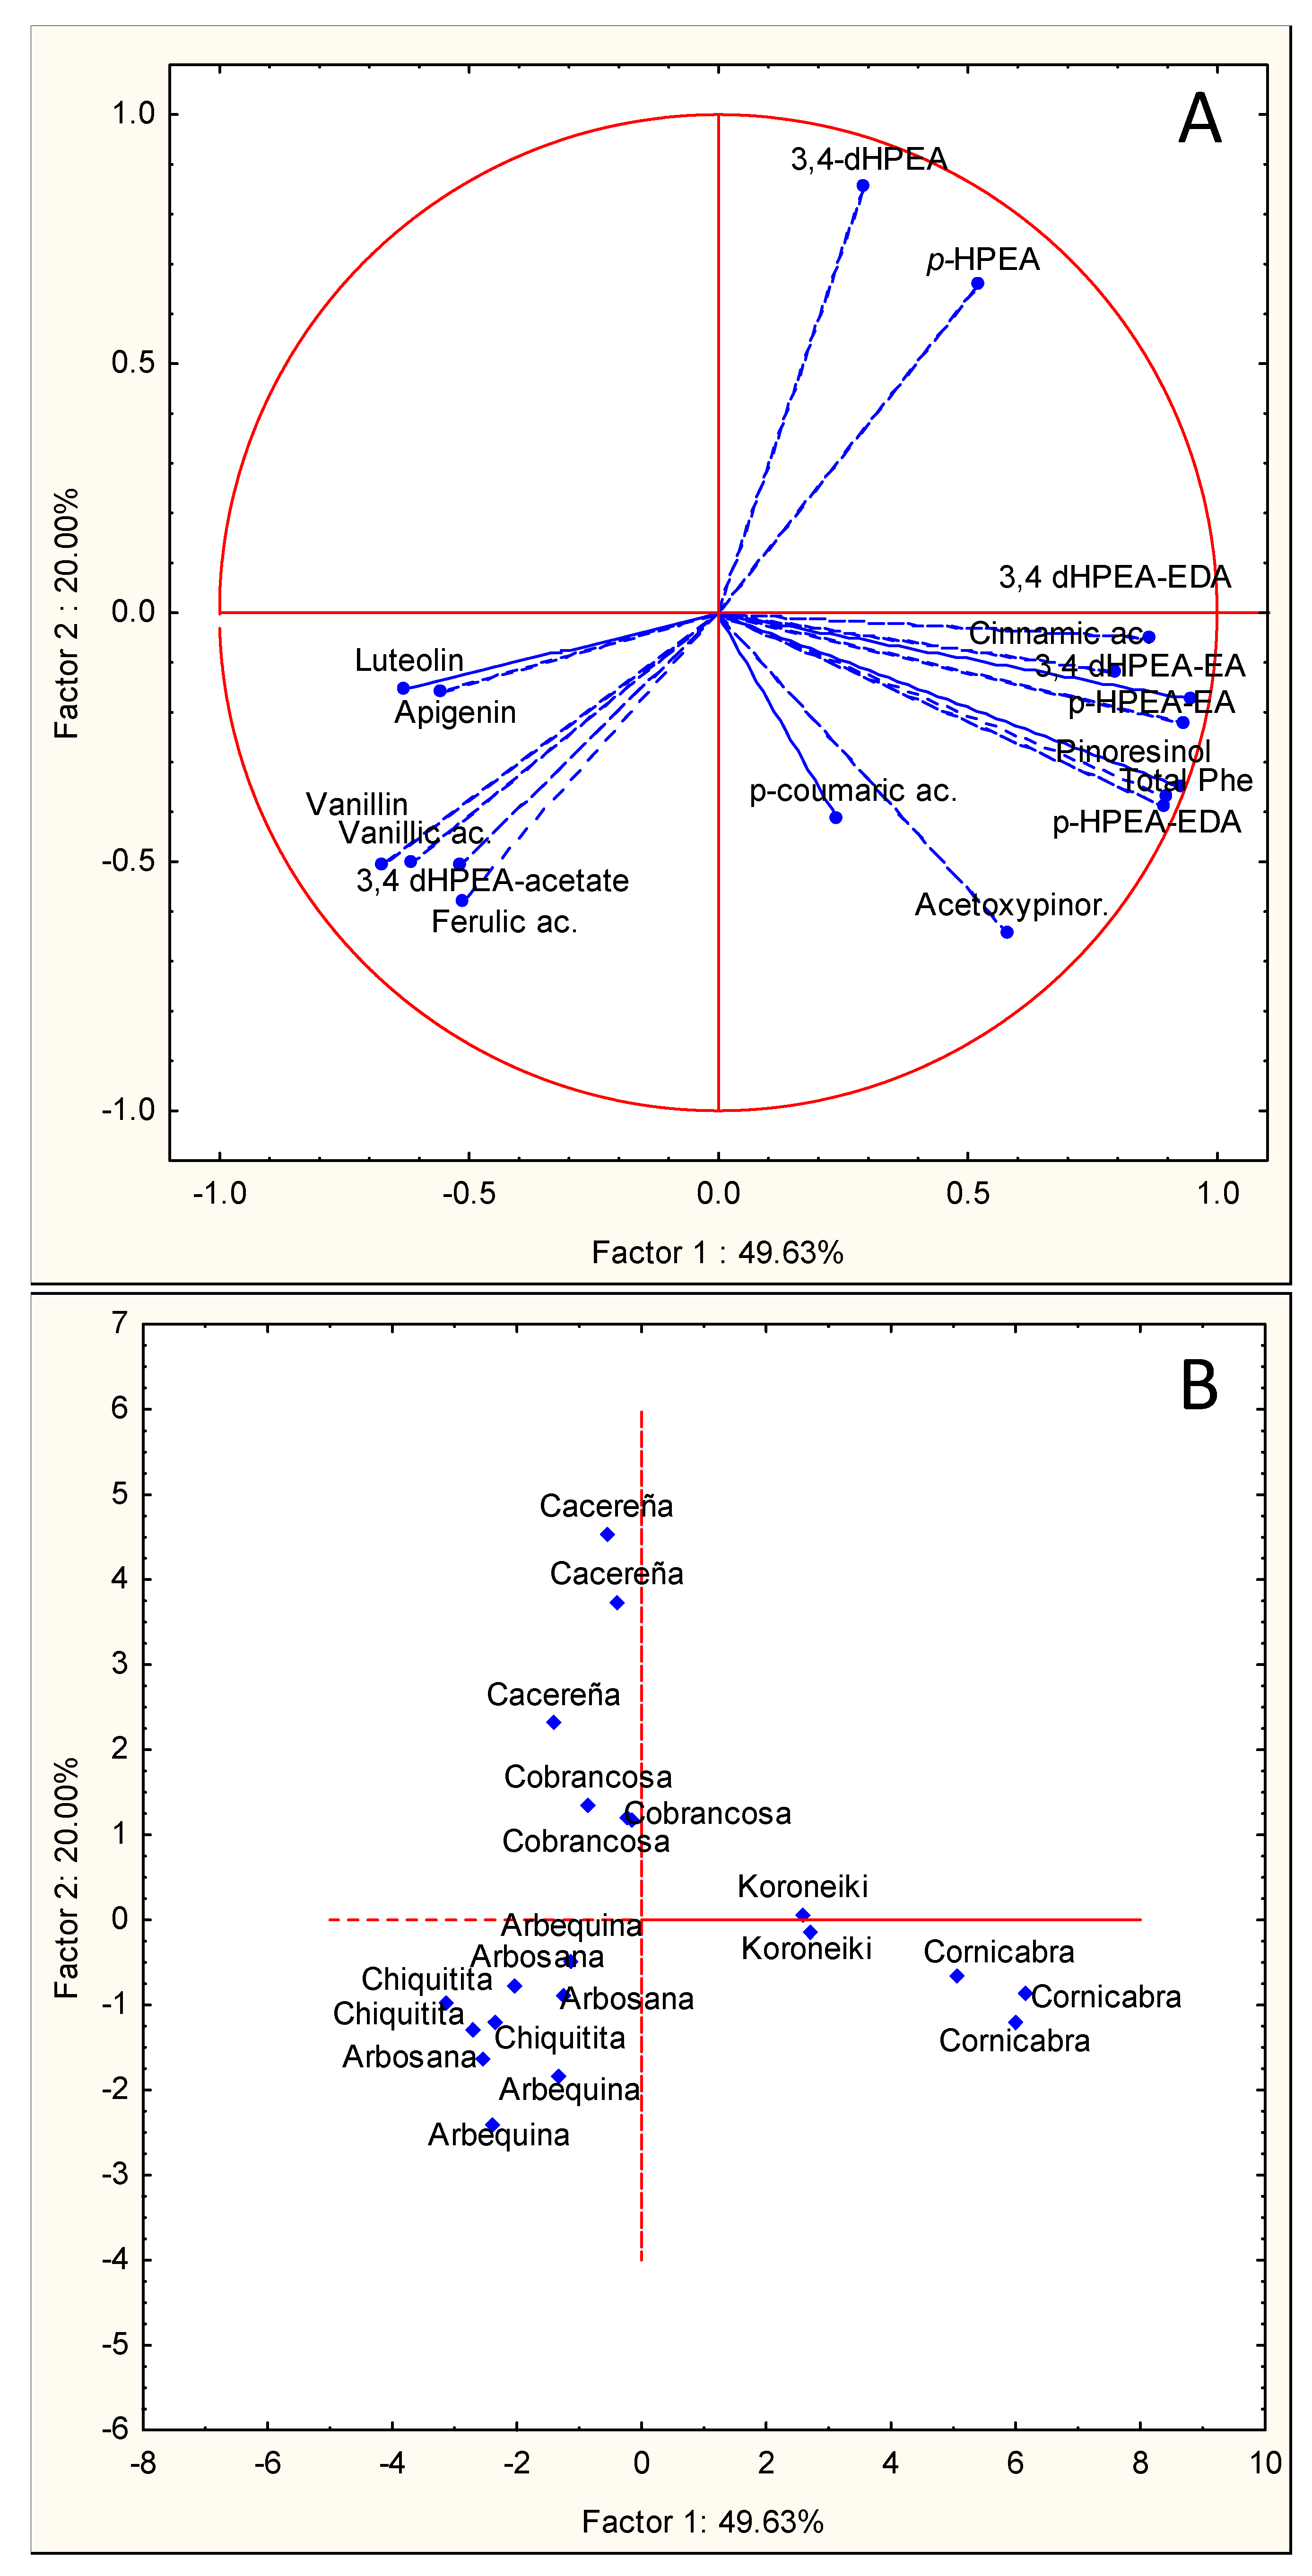
3.6. Principal Component Analysis (PCA) of the Phenolic Compound Contents

Given the very significant contribution of phenolic compounds to VOO organoleptic and nutritional properties and also to the oxidative stability of the oils (Table 7), to further investigate the factors affecting the phenolic composition of the oils, a principal component analysis (PCA) was carried out. To evaluate the influence of genetic and environmental factors on the phenolic composition of the oils from the seven cultivars tested, PCA was performed with the phenolic data obtained in each season. The projections into the two main principal component coordinates, Principal Component 1 (PC1) and Principal Component 2 (PC2), during the 2014, 2015, and 2016, seasons are presented in Figure 1, Figure 2, and Figure 3, respectively. In each figure, chart A presents the projection of the variables: 16 individual phenolic compounds and the total phenolic content (21 independent analyses per variable), and chart B shows the projection of the samples analyzed: seven olive cultivars (three oils per cultivar and season). Figure 1 clearly shows separated clustering according to the particular conditions of the 2014 season. In Figure 1A PC1, which explains 49.63% of the found variability, the content of the flavones and some simple phenolic compounds (vanillin, vanillic acid, 3,4 DHPEA-acetate, and ferulic acid) are placed in third quadrant (bottom left) clearly separated from the main secoiridoid derivatives and lignans, that are located in the fourth quadrant (bottom right). PC2, which explains 20.00% of the variability found, only correlates positively with the phenolic alcohols hydroxytyrosol or 3,4-DHPEA (0.85) and Tyrosol or p-HPEA (0.65) placed in first quadrant (upper right).
Projection showed in Figure 1B allows a clear separation of the cultivars tested. The PC1 axis perfectly separates “Cornicabra” from “Koroneiki”, both having a very high phenolic content and both located in the positive zone of the axis. “Arbequina”, “Arbosana”, and “Chiquitita” are located in the opposite part of PC1 (third quadrant), also relatively close to this axis. On the contrary, “Cobrançosa” and “Cacereña” are located along the positive region of PC2.
PCA obtained with the results of the second season tested (2015) also allows a clear clustering of the variables (Figure 2A) and the cultivars (Figure 2B) tested. The main secoiridoid derivatives and the total phenolic content are highly and positively correlated with the PC1 axis, explaining 34.72% of the variability found. The rest of phenolic molecules were distributed along this PC1 axis except vanillin, 3,4 DHPEA, and p-HPEA, which exhibited a very negative correlation with the PC2 axis, which explains 15.8% of the found variability. The projection of the cultivars in the plane formed by the intersection of the axis PC1 and PC2 allows the separation of the different cultivars tested. The different oils obtained from the “Cornicabra” cultivar are located in the first quadrant, while “Koroneiki” oils are located in the negative part of PC2 due to their very high content of 3,4 DHPEA and p-HPEA in this season. “Arbosana”, “Arbequina”, and “Chiquitita” are closely located in the second quadrant, the same one in which the flavones are located (Figure 2B). The oils from the “Cobrançosa” and “Cacereña” cultivars are located in the central part of the chart.
In the third season, PCA also allowed a good separation of the phenolic compounds (Figure 3A) and olive cultivars (Figure 3B); PC1 and PC2 explain 45.96% and 16.53% of the found variability. PC1 positively correlates with the total sum of phenols (0.91) and with the contents of the main secoiridoid derivatives p-HPEA-EDA (0.94) and 3,4-DHPEA-EA (0.87), and negatively with ferulic acid (−0.60) and 3,4-DHPEA acetate (−0.71). PC2 positively correlates with the phenolic alcohols p-HPEA (0.59) and 3,4-DHPEA (0.57) and negatively with 3,4-DHPEA-EDA (−0.67) and p-coumaric acid (−0.79). In this last harvesting season, the different cultivars were, in general, less efficiently separated by PCA (Figure 3B). Thus, while “Arbequina” oils were clearly clustered and a significant segregation of other cultivars such as “Cornicabra”, “Chiquitita”, and “Arbosana” was also achieved, the cultivars “Koroneiki”, “Cacereña”, and “Cobrançosa” occupied the central part of the chart.

4. Conclusions

None of the VOOs presented hydrolytic, oxidative, or sensory deterioration, and all of them remained in the “extra” category. However, while acidity is only affected by the climatic conditions of each season, oxidative deterioration is also influenced by the genetic factor determined by the variety. Thus, the K232 and K270 values of “Cornicabra” oils were higher than the other oils tested, while “Cacereña” oils showed the lowest values. Nevertheless, the oxidative stability was significantly higher in “Cornicabra” oil (125 h), which also had the highest mean phenolic content, and “Arbequina” and “Chiquitita” (58 and 52 h, respectively) had the lowest phenolic contents.
The high correlation coefficients obtained when analyzing the global data (three harvesting seasons and seven olive varieties) demonstrate the key role of VOO phenolic compounds to guarantee the oxidative stability of the oil. In the same way, although it seems clear that the climatological factors influence the phenolic content of the oils obtained in each harvesting season, it is also evident that the phenolic composition of each variety is genetically controlled. Thus, although the total phenolic content, and especially that of secoiridoid derivatives, were highest in the 2016 harvesting season and lowest in 2014, the phenolic profile of each olive cultivar remained relatively constant. Despite minor seasonal variations, the phenolic profile of each cultivar retained a specific pattern. In the three harvesting seasons analyzed here, the “Cornicabra” cv, the one with the highest phenolic content, is separated from the others by aligning itself in the same position as the variable “Total phenolics” and also to the four most abundant secoiridoid derivatives. This high content of secoiridoids also quite high in “Koroneiki” oils, which are very closely located in the PCA projection to the “Cornicabra” ones in the first and last season, and are strongly related to the high bitterness and pungency found in these oils in the sensory evaluation. Similarly, “Arbequina” Cv. is always aligned with the variable 3,4 dHPEA acetate, “Chiquitita” cv. is aligned with lutein and apigenin, and “Cornicabra” cv. is aligned with pinoresinol. In the same way, the always-close positions of “Arbequina”, “Chiquitita”, and “Arbosana” cv. confirm the genetic proximity of these three olive varieties. It is important to point out that the total phenolic contents of these three cultivars, usually classified as medium or low, cultivated under the climatic and growing conditions described in the experimental section, are above the limit established by the EFSA for VOO phenolic health claim (250 μg/g oil).
The decision made regarding olive cultivars for new super-high-density olive plantations should consider production and high oil quality. Our results indicate that the oil quality of the most productive cultivars (“Chiquitita” and “Arbequina”) is lower. Meanwhile, “Koroneiki” produced a large amount of oil with high quality.

Author Contributions

Conceptualization, J.M.G. and M.G.-d.-C.; Methodology, J.M.G. and M.G.-d.-C.; Validation, A.G.P., J.M.G. and M.G.-d.-C.; Formal Analysis, A.G.P., J.M.G. and M.G.-d.-C.; Investigation, A.G.P., J.M.G. and M.G.-d.-C.; Resources, A.G.P., J.M.G. and M.G.-d.-C.; Data Curation, A.G.P., J.M.G. and M.G.-d.-C.; Writing—Original Draft Preparation, A.G.P., J.M.G. and M.G.-d.-C.; Writing—Review and Editing, A.G.P., J.M.G. and M.G.-d.-C.; Visualization, A.G.P., J.M.G. and M.G.-d.-C.; Supervision, A.G.P., J.M.G. and M.G.-d.-C. All authors have read and agreed to the published version of the manuscript.

Funding

This research received no external funding.

Data Availability Statement

Data is contained within the article.

Acknowledgments

We gratefully acknowledge “Casa de Hualdo” for access to olive orchards where this research was conducted. The companies Todolivo, Regaber, and Agromillora financed the installation of the experiments. We also thank Hector Rodríguez, Rubén Rodríguez, Roberto Hermoso, Anna Lin, and many other undergraduate students for their assistance in data collection. Finally, the authors would like to thank M.C. Martínez Peláez for his technical assistance in the analysis of the samples.

Conflicts of Interest

The authors declare no conflict of interest.

References

  1. Rallo, L.; Barranco, D.; Castro-Gacía, S.; Connor, D.J.; Gómez del Campo, M.; Rallo, P. High-density olive plantations. Hortic. Rev. 2014, 41, 303–382. [Google Scholar]
  2. Rius, X.; Lacarte, J.M. La Revolución del Olivar: El Cultivo en Seto; Ediciones Paraninfo: Madrid, Spain, 2015; pp. 1–518. [Google Scholar]
  3. Connor, D.J.; Gomez-del-Campo, M.; Rousseaux, M.C.; Searles, P.S. Structure, management and productivity of hedgerow olive orchards: A review. Sci. Hortic. 2014, 169, 71–93. [Google Scholar] [CrossRef]
  4. Polari, J.J.; Mori, M.; Wang, S.C. Virgin olive oils from super-high-density orchards in california: Impact of cultivar, harvest time, and crop season on quality and chemical composition. Eur. J. Lipid Sci. Tech. 2020, 123, 2000180. [Google Scholar] [CrossRef]
  5. Rallo, L.; Barranco, D.; de la Rosa, R.; Leon, L. “Chiquitita” olive. HortScience 2008, 43, 529–531. [Google Scholar] [CrossRef]
  6. Allalout, A.; Krichène, D.; Methenni, K.; Taamalli, A.; Daoud, D.; Zarrouk, M. Behavior of super-intensive spanish and greek olive cultivars grown in northern tunisia. J. Food Biochem. 2011, 35, 27–43. [Google Scholar] [CrossRef]
  7. Marino, G.; Macaluso, L.; Marra, F.P.; Ferguson, L.; Marchese, A.; Campisi, G.; Volo, P.; Laudicina, V.A.; Caruso, T. Horticultural performance of 23 Sicilian olive genotypes in hedgerow systems: Vegetative growth, productive potential and oil quality. Sci. Hortic. 2017, 217, 217–225. [Google Scholar] [CrossRef]
  8. Usanmaz, S.; Kahramanoglu, I.; Alas, T.; Okatan, V. Performance and oil quality of seven olive cultivars under high density planting system in Northern Cyprus. Pak. J. Bot. 2019, 51, 1775–1781. [Google Scholar] [CrossRef]
  9. Rodrigues, N.; Casal, S.; Pinho, T.; Cruz, R.; Baptista, P.; Martín, H.; Asensio-Manzanera, M.C.; Peres, A.M.; Pereira, J.A. Olive oil characteristics of eleven cultivars produced in a high-density grove in Valladolid province (Spain). Eur. Food Res. Technol. 2021, 247, 3113–3122. [Google Scholar] [CrossRef]
  10. Morales-Sillero, A.; García, J.M. Impact assessment of mechanical harvest on fruit physiology and consequences on oil physicochemical and sensory quality from “Manzanilla de Sevilla” and “Manzanilla “Cacereña” super-high-density hedgerows. A preliminary study. J. Sci. Food Agric. 2015, 95, 2445–2453. [Google Scholar] [CrossRef] [Green Version]
  11. Connor, D.J.; Fereres, E. The physiology of adaptation and yield expression in olive. Hortic. Rev. 2005, 31, 155–156. [Google Scholar]
  12. Criado, M.N.; Motilva, M.J.; Goni, M.; Romero, M.P. Comparative study of the effect of the maturation process of the olive fruit on the chlorophyll and carotenoid fractions of drupes and virgin oils from “Arbequina” and Farga cultivars. Food Chem. 2007, 100, 748–755. [Google Scholar] [CrossRef]
  13. Centeno, A.; Hueso, A.; Gómez-del-Campo, M. Long-term evaluation of growth and production of olive cultivars in super high-density orchard under cold-weather conditions. Sci. Hortic. 2019, 257, 108657. [Google Scholar] [CrossRef]
  14. Martinez, J.M.; Muñoz, E.; Alba, J.; Lanzón, A. Report about the use of the ‘’Abencor’’ analyzer. Grasas Aceites 1975, 26, 379–385. [Google Scholar]
  15. Läubli, W.; Bruttel, P.A. Determination of the oxidative stability of fats and oils by the Rancimat method. J. Am. Oil Chem. Soc. 1986, 63, 792–794. [Google Scholar] [CrossRef]
  16. Mínguez-Mosquera, M.I.; Rejano-Navarro, L.; Gándul-Rojas, B.; Sánchez-Gómez, A.H.; Garrido-Fernández, J. Color pigment correlation invirgin olive oils. J. Am. Oil Chem. Soc. 1991, 68, 332–336. [Google Scholar] [CrossRef]
  17. Mancha, M.; Sánchez, J. lncorporation of free fatty acids into acylthioesters and lipids of developing sunflower seeds. Phytochemistry 1981, 20, 2139–2142. [Google Scholar] [CrossRef]
  18. Mateos, R.; Espartero, J.L.; Trujillo, M.; Rios, J.J.; Leon-Camacho, M.; Alcudia, F.; Cert, A. Determination of phenols, flavones, and lignans in virgin olive oils by solid-phase extraction and high performance liquid chromatography with diode array ultraviolet detection. J. Agric. Food Chem. 2001, 49, 2185–2192. [Google Scholar] [CrossRef]
  19. Pérez, A.G.; León, L.; Pascual, M.; Romero-Segura, C.; Sánchez-Ortiz, A.; De La Rosa, R.; Sanz, C. Variability of virgin olive oil phenolic compounds in a segregating progeny from a single cross in Olea europaea L. and sensory and nutritional quality implications. PLoS ONE 2014, 9, e92898. [Google Scholar] [CrossRef] [Green Version]
  20. Wang, Y.; Yu, L.; Shehzad, Q.; Kong, W.; Wu, G.; Jin, Q.; Zhang, H.; Wang, X. A comprehensive comparison of Chinese olive oils from different cultivars and geographical origins. Food Chem. 2023, 18, 100665. [Google Scholar] [CrossRef]
  21. Yousfi, K.; Weiland, C.M.; Garcia, J.M. Effect of harvesting system and fruit cold storage on virgin olive oil chemical composition and quality of superintensive cultivated “Arbequina” olives. J. Agric. Food Chem. 2012, 60, 4743–4750. [Google Scholar] [CrossRef]
  22. Grilo, F.; Novara, M.E.; D’Oca, M.C.; Rubino, S.; Lo Bianco, R.; Di Stefano, V. Quality evaluation of extra-virgin olive oils from Sicilian genotypes grown in a high-density system. Int. J. Food Sci. Nutr. 2020, 71, 397–409. [Google Scholar] [CrossRef]
  23. Dos Santos, M.M.O.; Gama, R.S.; de Carvalho, I.M.; Santos, P.H.; Gonçalves, M.S.; de Carvalho, M.S.; de Barros, E.V.; de Oliveira, J.R.; Mendes, A.A.; Franco, M. Sensory variations in olive oils from the “Arbequina” variety elaborated with changes in fruit selection and process. Food Anal. Meth. 2021, 14, 1645–1653. [Google Scholar] [CrossRef]
  24. García, J.M.; Morales-Sillero, A.; Pérez-Rubio, A.G.; Diaz-Espejo, A.; Montero, A.; Fernández, J.E. Virgin olive oil quality of hedgerow “Arbequina” olive trees under deficit irrigation. J. Sci. Food Agric. 2017, 97, 1018–1026. [Google Scholar] [CrossRef] [Green Version]
  25. Tous, J.; Romero, A.; Plana, J.; Hermoso, J.F. Olive oil cultivars suitable for very-high density planting conditions. Acta Hortic. 2008, 791, 403–408. [Google Scholar] [CrossRef]
  26. Sena-Moreno, E.; Alvarez-Ortí, M.; Zied, D.C.; Pardo-Giménez, A.; Pardo, J.E. Olive oils from Campos de Hellin (Spain) exhibit significant varietal differences in fatty acid composition, sterol action, and oxidative stability. Eur. J. Lipid Sci. Technol. 2015, 117, 967–975. [Google Scholar] [CrossRef]
  27. Alvarruiz, A.; Álvarez-Ortí, M.; Mateos, B.; Sena, E.; Pardo, J.E. Quality and composition of virgin olive oil from Portuguese grown in Castilla-La Mancha (Spain). J. Oleo Sci. 2015, 64, 1075–10822. [Google Scholar] [CrossRef] [Green Version]
  28. Montaño, A.; Hernández, M.; Garrido, I.; Llerena, J.L.; Espinosa, F. Fatty acid and phenolic compound concentrations in eight different monovarietal virgin olive oils from extremadura and the relationship with oxidative stability. Int. J. Mol. Sci. 2016, 17, 1960. [Google Scholar] [CrossRef] [Green Version]
  29. Roca, M.; Minguez-Mosquera, M.I. Involvement of chlorophyllase in chlorophyll metabolism in olive varieties with high and low chlorophyll content. Physiol. Plant. 2003, 117, 459–466. [Google Scholar] [CrossRef]
  30. Karabagias, I.K.; Badeka, A.; Casiello, G.; Longobardi, F.; Kontominas, M.G. Rapid screening of olive oil cultivar differentiation based on selected physicochemical parameters, pigment content and fatty acid composition using advanced chemometrics. Eur. Food Res. Technol. 2019, 245, 2027–2038. [Google Scholar] [CrossRef]
  31. Criado, M.N.; Romero, M.P.; Casanovas, M.; Motilva, M.J. Pigment profile and colour of monovarietal virgin olive oils from “Arbequina” cultivar obtained during two consecutive crop seasons. Food Chem. 2008, 110, 873–880. [Google Scholar] [CrossRef]
  32. Gutiérrez, F.; Jímenez, B.; Ruíz, A.; Albi, M.A. Effect of olive ripeness on the oxidative stability of virgin olive oil extracted from the varieties Picual and Hojiblanca and on the different components involved. J. Agric. Food Chem. 1999, 47, 121–127. [Google Scholar] [CrossRef]
  33. Bodoira, R.; Torres, M.; Pierantozzi, P.; Aguate, F.; Taticchi, A.; Servili, M.; Maestri, D. Dynamics of fatty acids, tocopherols and phenolic compounds biogenesis during olive (Olea europaea L.) fruit ontogeny. J. Am. Oil Chem. Soc. 2016, 93, 1289–1299. [Google Scholar] [CrossRef]
  34. Morelló, J.R.; Romero, M.P.; Motilva, M.J. Effect of the maturation of the olive fruit on the phenolic fraction of drupes and oils from “Arbequina”, Farga, and Morrut cultivars. J. Agric. Food Chem. 2004, 52, 6002–6009. [Google Scholar] [CrossRef]
  35. Wang, J.W.; Ma, L.Y.; Gómez-del-Campo, M.; Zhang, D.S.; Deng, Y.; Jia, Z.K. Youth tree behavior of olive (Olea europaea L.) cultivars in Wudu, China: Cold and drought resistance, growth, fruit production, and oil quality. Sci. Hortic. 2018, 236, 106–122. [Google Scholar] [CrossRef]
  36. Pereira, J.A.; Oliveira, M.B.P.P.; Casal, S.; Alves, M.R. Discrimination of varietal olive oils of the Portuguese Cultivars “Cobrançosa”, madural and verdeal based on their fatty acids composition. Acta Hortic. 2002, 586, 591–594. [Google Scholar] [CrossRef] [Green Version]
  37. Amaral, J.; Mafra, I.; Oliveira, M.; Beatriz, P.P. Characterization of three Portuguese varietal olive oils based on fatty acids, triacylglycerols, phytosterols and vitamin E profiles: Application of chemometrics. In Olives and Olive Oil in Health and Disease Prevention; Preedy, V.R., Watson, R.S., Eds.; Academic Press: London, UK, 2010; pp. 581–589. [Google Scholar]
  38. Di Vaio, C.; Nocerino, S.; Paduano, A.; Sacchi, R. Influence of some environmental factors on drupe maturation and olive oil composition. J. Sci. Food Agric. 2012, 93, 1134–1139. [Google Scholar] [CrossRef]
  39. Miho, H.; Moral, J.; Barranco, D.; Ledesma-Escobar, C.A.; Priego-Capote, F.; Díez, C.M. Influence of genetic and interannual factors on the phenolic profiles of virgin olive oils. Food Chem. 2021, 342, 128357. [Google Scholar] [CrossRef]
  40. García-González, D.L.; Tena, N.; Aparicio, R. Quality Characterization of the New Virgin Olive Oil Var. “Chiquitita” by Phenols and Volatile Compounds. J. Agric. Food Chem. 2010, 58, 8357–8364. [Google Scholar] [CrossRef]
  41. Pérez, A.G.; León, L.; Sanz, C.; de la Rosa, R. Fruit Phenolic Profiling: A New Selection Criterion in Olive Breeding Programs. Front. Plant Sci. 2018, 9, 241. [Google Scholar] [CrossRef] [Green Version]
Figure 1. Principal component analysis of the main phenolic components of VOOs from olive cultivars “Arbequina”, “Arbosana”, “Cobrancosa”, “Cornicabra”, “Koroneiki”, “Cacereña”, and “Chiquitita” cultivated in a super-high-density orchard under cold weather conditions in the season 2014. (A) Vector distribution of the phenolic compounds. (B) Distribution of olive cultivars.
Horticulturae 09 00824 g001
Figure 2. Principal component analysis of the main phenolic components of VOOs from olive cultivars “Arbequina”, “Arbosana”, “Cobrancosa”, “Cornicabra”, “Koroneiki”, “Cacereña”, and “Chiquitita” cultivated in a super-high-density orchard under cold weather conditions in the season 2015. (A) Vector distribution of the phenolic compounds. (B) Distribution of olive cultivars.
Horticulturae 09 00824 g002
Figure 3. Principal component analysis of the main phenolic components of VOOs from olive cultivars “Arbequina”, “Arbosana”, “Cobrancosa”, “Cornicabra”, “Koroneiki”, “Cacereña”, and “Chiquitita” cultivated in a super-high-density orchard under cold weather conditions in the season 2016. (A) Vector distribution of the phenolic compounds. (B) Distribution of olive cultivars.
Horticulturae 09 00824 g003
Table 1. Physical–chemical analysis of the oils extracted from olive cultivars planted in super-high-density orchards.
Free Acidity
(Oleic Acid%)
Peroxide Value
(meq O2 kg−1)
K232K270
2014
“Arbequina”0.5 7.0 d1.920.11 e
“Arbosana”0.4 9.7 bc2.160.14 c
“Cobrançosa”0.4 11.4 a2.020.15 c
“Cornicabra”0.5 8.4 cd2.300.20 a
“Koroneiki”0.5 8.7 c2.180.18 b
“Cacereña”0.5 8.3 cd1.800.08 f
“Chiquitita”0.3 10.6 ab2.240.12 d
2015
“Arbequina”0.2 4.81.39 c0.10
“Arbosana”0.3 6.01.50 bc0.13
“Cobrançosa”0.2 6.71.58 b0.15
“Cornicabra”0.3 5.81.78 a0.14
“Koroneiki”0.2 5.11.53 bc0.12
“Cacereña”0.2 5.21.58 b0.11
“Chiquitita”0.2 6.41.42 bc0.11
2016
“Arbequina”0.4 10.4 c1.800.10
“Arbosana”0.4 11.4 b1.500.10
“Cobrançosa”0.5 11.0 bc1.700.20
“Cornicabra”0.5 10.7 bc1.700.20
“Koroneiki”0.4 14.2 a1.600.10
“Cacereña”0.3 9.0 d1.700.10
“Chiquitita”0.4 11.1 b1.500.10
MEAN
“Arbequina”0.4 7.4 1.70 b0.11 de
“Arbosana”0.3 9.0 1.72 b0.14 bc
“Cobrançosa”0.4 9.7 1.77 b0.15 b
“Cornicabra”0.4 8.3 2.01 a0.17 a
“Koroneiki”0.4 9.3 1.89 ab0.14 b
“Cacereña”0.3 7.5 1.69 b0.10 e
“Chiquitita”0.3 9.4 1.73 b0.12 cd
20140.4 a9.2 b2.09 a0.14 a
20150.2 b5.7 c1.54 b0.12 b
20160.4 a11.1 a1.64 b0.13 ab
Values with the same letter are not significantly different among cultivars within each year by LSD test, p ≤ 0.05. Absence of letter means no effect due to the different cultivars by one-way ANOVA p ≤ 0.05.
Table 2. Sensory attributes of the oils extracted from 7 olive cultivars planted in super-high-density orchards. No negative attributes were found.
FruityBitterPungentDescriptive Profile
2014
“Arbequina”5.91.50.7Banana, tomato, and dried fruits
“Arbosana”4.81.32.8Banana, tomato, dried fruits, apple, and citric fruits
“Cobrançosa”6.82.02.5Dried fruits
“Cornicabra”5.72.64.4Dried fruits, apple, and banana
“Koroneiki”5.63.25.5Banana and apple
“Cacereña”5.90.00.5Banana and apple
“Chiquitita”5.70.62.3Banana and citric fruits
2015
“Arbequina”5.11.12.1Banana and leaf
“Arbosana”4.92.22.6Mature tomato and banana
“Cobrançosa”5.72.64.9Grass and leaf
“Cornicabra”5.13.54.1Grass and leaf
“Koroneiki”4.52.24.5Grass and dried fruits
“Cacereña”5.23.73.6Banana and dried fruits
“Chiquitita”5.62.42.6Apple, banana, tomato, grass, and dried fruits
Table 3. Oxidative stability and photosynthetic pigment content of the oils extracted from olive cultivars planted in super-high-density orchards.
Oxidative Stability (h)Carotenoids (mg kg−1)Chlorophylls (mg kg−1)
2014
“Arbequina”40 d3.4 c4 d
“Arbosana”55 c7.8 b10.0 c
“Cobrançosa”38 de4.0 c8.0 c
“Cornicabra”117 a7.2 b15.6 b
“Koroneiki”86 b11.4 a23.9 a
“Cacereña”30 f1.7 c1.7 d
“Chiquitita”33 ef11.5 a17.4 b
2015
“Arbequina”56 d13.9 ab17.1 c
“Arbosana”84 bc11.0 bc15.6 c
“Cobrançosa”76 c10.2 bc20.6 bc
“Cornicabra”113 a8.1 c13.5 c
“Koroneiki”79 bc18.7 a34.5 a
“Cacereña”93 b6.7 c9.1 c
“Chiquitita”59 d17.8 a30.0 ab
2016
“Arbequina”77 bc12.4 a17.4 b
“Arbosana”109 ab8.4 b12.7 bc
“Cobrançosa”74 bc5.4 bc8.4 cd
“Cornicabra”144 a8.8 b16.0 b
“Koroneiki”74 bc15.0 a26.4 a
“Cacereña”72 c3.8 c3.5 d
“Chiquitita”66 c14.6 a27.3 a
MEAN
“Arbequina”58 d9.91 b12.9 b
“Arbosana”82 b9.06 b12.8 b
“Cobrançosa”63 d6.53 c12.3 b
“Cornicabra”125 a8.02 bc15.0 b
“Koroneiki”80 bc15.04 a28.2 a
“Cacereña”65 cd4.06 d4.8 c
“Chiquitita”52 d14.62 a24.9 a
201460 b6.7 c11.5 c
201580 a12.3 a20.1 a
201688 a9.8 b17.2 b
Values with the same letter are not significantly different among cultivars within each year by LSD test, p ≤ 0.05. Absence of letter means no effect due to the different cultivars by one-way ANOVA p ≤ 0.05.
Table 4. Fatty acid composition (%) of the oils extracted from 7 olive cultivars planted in super-high-density orchards.
PalmiticPalmitoleicEstearicOleicLinoleic
2014
“Arbequina”16.4 a2.3 a1.3 e63.5 e12.7 a
“Arbosana”14.1 ab1.3 cd2.1 cd73.3 c7.3 c
“Cobrançosa”14.9 a1.5 c4.1 a63.2 e14.3 a
“Cornicabra”11.2 b1.2 d2.7 b79.9 a3.1 d
“Koroneiki”13.2 ab0.9 e2.2 bc75.9 b5.7 c
“Cacereña”14.7 a1.9 b1.9 cd69.0 d10.5 b
“Chiquitita”16.3 a2.0 b1.7 de67.8 d10.5 b
2015
“Arbequina”13.8 a1.12.4 de72.5 c8.6 a
“Arbosana”13.7 a1.13.2 bc75.3 b5.6 d
“Cobrançosa”13.3 ab1.14.3 a73.5 c6.9 c
“Cornicabra”12.1 c1.13.4 b78.3 a3.5 e
“Koroneiki”11.9 c0.72.7 cd77.8 a5.7 d
“Cacereña”12.4 bc1.12.4 de79.0 a3.7 e
“Chiquitita”13.7 a1.22.2 e73.1 c8.2 b
2016
“Arbequina”14.5 a1.1 b2.3 c71.0 c9.7 a
“Arbosana”14.0 a1.0 c3.3 b75.0 b5.2 b
“Cobrançosa”12.6 b0.9 cd4.7 a70.1 c9.8 a
“Cornicabra”11.8 b0.9 cd3.4 b79.0 a3.4 b
“Koroneiki”12.4 b0.7 d2.6 c77.4 ab5.3 b
“Cacereña”12.7 b1.1 b2.6 c76.6 ab5.3 b
“Chiquitita”14.3 a1.4 a1.9 d71.5 c9.0 a
Mean
“Arbequina”14.9 a1.5 a2.0 e69.0 c10.3 a
“Arbosana”14.1 bc1.1 b2.9 c74.5 b6.0 c
“Cobrançosa”13.6 c1.2 b4.4 a68.9 c10.3 a
“Cornicabra”11.7 f1.1 b3.2 b79.1 a3.3 d
“Koroneiki”12.5 e0.8 c2.5 cd77.0 ab5.5 c
“Cacereña”13.3 d1.4 a2.3 d74.9 b6.5 c
“Chiquitita”14.8 a1.5 a1.9 e70.8 c9.2 b
201414.4 a1.6 a2.3 b70.4 c9.2 a
201513.0 b1.1 b2.9 a75.6 a6.0 b
201613.2 b1.0 3.0 a74.4 b6.8 b
Values with the same letter are not significantly different among cultivars within each year by LSD test, p ≤ 0.05. Absence of letter means no effect due to the different cultivars by one-way ANOVA p ≤ 0.05.
Table 5. Fatty acid formulas of the oils extracted from 7 olive cultivars planted in super-high-density orchards. SAFA, MUFA, PUFA, and UNFA (%).
OLRSAFAMUFAPUFAUNFAUNFA/SAFAMUFA/PUFA
2014
“Arbequina”5.0 e18.466.2 d13.1 a79.34.55.1 e
“Arbosana”10.1 c16.975.4 b7.6 c83.04.99.9 c
“Cobrançosa”4.5 e19.965.7 d14.5 a80.24.04.5 e
“Cornicabra”25.5 a14.781.8 a3.5 d85.35.823.4 a
“Koroneiki”13.3 b16.377.5 b6.1 c83.75.112.7 b
“Cacereña”6.7 d17.471.8 c10.8 b82.64.86.7 d
“Chiquitita”6.5 d18.670.6 c10.8 b81.44.46.6 d
2015
“Arbequina”14.0 d16.6 bc77.0 d6.4 a83.45.112.0 c
“Arbosana”13.5 b17.2 ab77.0 c5.7 c82.74.813.5 b
“Cobrançosa”10.7 c17.9 a75.3 d6.9 b82.24.610.9 c
“Cornicabra”22.2 a16.2 c80.1 ab3.7 d83.85.221.6 a
“Koroneiki”13.7 b14.9 d79.3 b5.8 c85.15.713.7 b
“Cacereña”21.4 a15.2 d80.8 a4.1 d84.95.619.7 a
“Chiquitita”9.0 cd16.5 bc75.0 d8.5 a83.55.18.8 c
2016
“Arbequina”7.3 c17.4 ab72.8 d9.9 a82.74.87.4 c
“Arbosana”14.6 b17.9 a76.7 bc5.4 b82.14.614.2 b
“Cobrançosa”7.5 c18.1 a72.0 d10.0 a82.04.57.2 c
“Cornicabra”23.1 a15.9 bc80.6 a3.5 c84.15.323.0 a
“Koroneiki”14.5 b15.5 c78.8 ab5.7 b84.55.413.8 b
“Cacereña”15.8 b15.9 bc78.5 ab5.6 b84.15.314.0 b
“Chiquitita”8.0 c16.8 abc73.8 cd9.4 a83.25.07.9 c
MEAN
“Arbequina”8.8 c17.5 b72.0 c9.8 a81.84.88.2 c
“Arbosana”12.7 b17.3 b76,4 b6.2 b82.64.812.5 b
“Cobrançosa”7.5 c18.6 a71.0 c10.5 a81.54.47.5 c
“Cornicabra”23.6 a15.6 c80.8 a3.6 d84.25.422.7 a
“Koroneiki”13.8 b15.6 c78.2 ab5.9 c84.45.413.4 b
“Cacereña”14.6 b16.2 c77.0 ab6.8 b83.95.213.5 b
“Chiquitita”7.8 c17.3 b73.1 bc9.6 a82.74.87.8 c
201410.2 b17.5 a72.7 b9.582.24.89.8 b
201514.9 a16.4 c77.8 a5.983.75.214.3 a
201613.0 ab16.8 bc76.6 ab7.183.25.012.5 ab
Values with the same letter are not significantly different among cultivars within each year by LSD test, p ≤ 0.05. Absence of letter means no effect due to the different cultivars by one-way ANOVA p ≤ 0.05.
Table 6. Concentration of phenolic compounds (mg kg−1 oil) in virgin olive oils obtained from 7 olive cultivars grown in super-high-density orchards in three different olive seasons.
2014“Arbequina”“Arbosana”“Cobrançosa”“Cornicabra”“Koroneiki”“Cacereña”“Chiquitita”
Hydroxytyrosol3.8 bc2.9 bc6.2 bc8.2 b8.5 b18.2 a1.7 c
Tyrosol4.7 c4.0 c5.8 bc11.2 a10.7 ab14.2 a4.9 c
Vanillic acid0.5 d0.8 b0.4 de0.2 f0.6 c0.3 ef0.9 a
Vainillin0.2 b0.4 a0.1 c0.1 c0.1 c0.1 c0.3 a
p-coumaric acid0.8 a0.2 d0.3 cd0.7 b0.3 cd0.3 cd0.5 c
Hydroxytyrosol ac.32.6 a6.3 c0.1 c0.0 c4.4 c4.4 c20.0 b
3.4-DHPEA-EDA a136.9 b108.9 bc150.5 b214.6 a208.7 a126.0 bc83.7 c
p-HPEA-EDA b77.5 c87.9 c93.5 c322.9 a193.3 b10.1 d81.1 c
Pinoresinol3.6 c3.6 c2.6 cd11.1 a5.8 b1.5 d1.9 d
Cinnamic acid0.0 c0.0 c0.0 c2.3 a1.7 ab0.2 bc0.2 bc
Acetoxypinoresinol29.8 c36.6 b9.6 de49.3 a30.3 bc4.2 e12.1 d
3.4-DHPEA-EA c18.1 d52.5 cd69.8 c264.2 a208.2 b23.4 d20.7 d
p-HPEA-EA d16.7 c17.0 c18.1 c163.8 a100.2 b15.9 c24.5 c
Ferulic acid0.70.30.10.00.10.00.5
Luteolin14.7 a7.6 bcd8.5 bcd5.1 d6.0 cd10.1 bc10.9 ab
Apigenin2.6 bcd8.8 a2.2 cd1.1 d2.7 bcd3.7 bc4.1 b
2015“Arbequina”“Arbosana”“Cobrançosa”“Cornicabra”“Koroneiki”“Cacereña”“Chiquitita”
Hydroxytyrosol1.1 b4.1 b2.7 b2.4 b44.4 a2.9 b2.7 b
Tyrosol1.4 b3.0 b4.9 b3.3 b61.3 a7.2 b3.5 b
Vanillic acid0.7 ab1.1 a0.7 ab0.3 c0.7 abc0.4 bc1.0 a
Vainillin0.00.00.00.00.10.00.0
p-coumaric acid0.10.20.20.10.10.10.2
Hydroxytyrosol ac.29.0 a1.7 b3.2 b3.1 b1.7 b6.8 b6.9 b
3.4-DHPEA-EDA a124.8 cd184.1 abc224.3 ab255.3 a86.0 d179.2 abcd171.5 bcd
p-HPEA-EDA b57.4 d87.7 cd142.5 bc314.1 a114.8 bcd151.3 b113.6 bcd
Pinoresinol1.2 d1.8 b0.7 e2.2 a0.7 ef1.4 c0.5 f
Cinnamic acid0.00.00.00.10.00.00.0
Acetoxypinoresinol18.1 b26.1 a6.6 d18.9 b12.3 c13.1 c15.6 bc
3.4-DHPEA-EA c33.7 b47.9 b147.1 a173.9 a59.7 b186.7 a55.8 b
p-HPEA-EA d8.14 d15.7 cd39.6 b80.8 a39.5 bc48.6 b13.5 cd
Ferulic acid0.00.00.10.10.00.00.1
Luteolin10.311.912.36.26.614.614.3
Apigenin3.3 bc11.4 a5.9 b1.6 c4.7 bc4.9 bc6.9 b
2016“Arbequina”“Arbosana”“Cobrançosa”“Cornicabra”“Koroneiki”“Cacereña”“Chiquitita”
Hydroxytyrosol0.91.62.32.41.92.82.3
Tyrosol1.21.64.31.92.41.62.8
Vanillic acid0.6 bc0.8 ab0.8 ab0.4 c1.0 a0.5 c0.9 a
Vainillin0.2 b0.5 a0.4 ab0.2 b0.4 ab0.3 b0.5 a
p-coumaric acid1.1 a0.3 e0.5 cd0.6 bc0.5 de0.8 b0.4 de
Hydroxytyrosol ac.15.4 b8.6 bc1.3 c1.5 c4.4 c5.2 c30.4 a
3.4-DHPEA-EDA a406.9 a291.9 bc223.3 bc316.0 ab172.3 c179.6 c252.1 bc
p-HPEA-EDA b178.5 b166.6 b221.3 b330.6 a207 b151.2 b170.2 b
Pinoresinol3.2 cd3.9 bc4.7 b6.2 a3.5 bcd4.9 ab2.0 d
Cinnamic acid0.2 c0.3 c1.0 a1.2 a1.1 a0.9 ab0.3 c
Acetoxypinoresinol33.533.247.052.140.953.321.4
3.4-DHPEA-EA c78.5 cd112.0 cd306.1 ab331.8 ab212.2 bc386.3 a54.0 d
p-HPEA-EA d34.0 c35.4 c94.3 ab136.2 a77.4 bc106.0 ab28.4 c
Ferulic acid0.10.20.10.10.10.10.1
Luteolin7.89.59.74.14.68.316.4
Apigenin2.8 c11.8 a6.0 bc1.6 c3.9 bc4.5 bc9.9 b
Values with the same letter are not significantly different among cultivars within each year by LSD test, p ≤ 0.05. Absence of letter means no effect due to the different cultivars by one-way ANOVA p ≤ 0.05. a Dialdehydic form of the decarboxymethyl oleuropein aglycone. b Dialdehydic form of the decarboxymethyl ligstroside aglycone. c Hydroxytyrosyl elenolate. d Tyrosyl elenolate.
Table 7. Mean phenolic contents of phenolic compounds (mg kg−1 oil) in virgin olive oils obtained from 7 olive cultivars grown in super-high-density orchards.
Mean Values“Arbequina”“Arbosana”“Cobrançosa”“Cornicabra”“Koroneiki”“Cacereña”“Chiquitita”201420152016
Hydroxytyrosol1.9 b2.9 b3.7 b4.3 b18.3 a8.0 b2.2 b7.1 a8.6 a2.0 b
Tyrosol2.4 b2.9 b5.0 b5.5 b24.8 a7.7 b3.7 b7.9 a12 a2.3 b
Vanillic acid0.6 c0.9 ab0.6 c0.3 d0.8 bc0.4 d1.0 a0.6 b0.7 a0.7 a
Vainillin0.1 c0.3 a0.2 b0.1 c0.2 b0.1 c0.3 a0.2 b0.0 c0.4 a
p-coumaric acid0.7 a0.2 d0.4 c0.5 b0.3 cd0.4 c0.4 c0.6 b0.1 c0.7 a
Hydroxytyrosol ac.25.7 a5.6 c1.5 c1.5 c3.5 c5.3 c19.1 b9.77.5 9.5
3.4-DHPEA-EDA a222.9 ab194.9 bc199.4 bc262.0 a155.6 c161.6 c169.1 c147 b184 b263 a
p-HPEA-EDA b104.5 d114.1 d152.4 bc322.6 a171.7 b104.2 d121.6 cd124 c166 b204 a
Pinoresinol2.7 c3.1 bc2.7 c6.5 a3.3 b2.6 c1.5 d4.6 a1.2 b4.3 a
Cinnamic acid0.1 c0.1 c0.4 bc1.2 a1.0 ab0.4 bc0.2 c0.6 a0.0 b0.7 a
Acetoxypinoresinol27.2 bc32.0 ab21.1 cd40.1 a27.8 bc23.6 cd16.4 d27 b16 c40 a
3.4-DHPEA-EA c43.4 c70.8 c174.3 b256.6 a160.0 b198.8 b43.5 c101 b101 b258 a
p-HPEA-EA d19.62 d22.66 d50.65 c126.9 a72.34 b56.5 bc22.1 d51 b43 c73 a
Ferulic acid0.30.20.10.10.10.00.20.20.00.1
Luteolin10.9 ab9.7 b10.2 b5.1 c5.7 c11.0 ab13.9 a10.210.98.6
Apigenin2.9 cd10.7 a4.7 c1.4 d3.8 c4.4 c6.9 b4.4 b5.5 a5.8 a
Values with the same letter are not significantly different by LSD test, p ≤ 0.05. Absence of letter means no effect due to the different cultivars by one-way ANOVA p ≤ 0.05. a Dialdehydic form of the decarboxymethyl oleuropein aglycone. b Dialdehydic form of the decarboxymethyl ligstroside aglycone. c Hydroxytyrosyl elenolate. d Tyrosyl elenolate.
Table 8. Pearson’s correlation coefficients among the main parameters associated with the oxidative stability (Rancimat h) of the oils analyzed over three consecutive harvest seasons (n = 58).
Peroxide IndexK232K270CarotenesChlorophyllsOxidative Stability (h)Oleic AcidLinoleic AcidOleic/LinoleicMUFA/PUFA3,4-DHPEA-EDAp-HPEA-EDAAcetoxypinoresinol3,4-DHPEA-EAp-HPEA-EATotal Phenolicso-diphenolsTotal Secoiridoids
Peroxide index1.000
K2320.1941.000
K2700.2030.505 *1.000
Carotenes−0.109−0.356 *−0.0261.000
Chlorophylls−0.039−0.2370.1440.931 *1.000
Oxidative stability (h)−0.054−0.0170.605 *0.1210.1981.000
Oleic acid−0.189−0.0720.432 *0.328 *0.353 *0.793 *1.000
Linoleic acid0.1810.029−0.465 *−0.241−0.278−0.824 *−0.972 *1.000
oleic/linoleic0.213−0.0070.2020.0890.1250.381 *0.511 *−0.517 *1.000
MUFA/PUFA−0.2310.1160.561 *0.0250.1060.871 *0.840 *−0.880 *0.344 *1.000
3,4-DHPEA-EDA0.217−0.1010.394 *0.0660.0900.588 *0.359 *−0.367 *0.0850.3021.000
p-HPEA-EDA0.2080.1890.700 *0.0300.1450.802 *0.614 *−0.626 *0.418 *0.722 *0.590 *1.000
Acetoxypinores0.348 *0.2220.499 *−0.105−0.1040.514 *0.379 *−0.389 *0.2490.364 *0.326 *0.609 *1.000
3,4-DHPEA-EA0.1960.1720.570 *−0.169−0.0640.652 *0.521 *−0.517 *0.3000.548 *0.379 *0.706 *0.669 *1.000
p-HPEA-EA0.2000.3800.717 *−0.1330.0100.702 *0.579 *−0.578 *0.388 *0.667 *0.355 *0.842 *0.681 *0.862 *1.000
Total phenolics0.460 *0.2260.676 *−0.0690.0520.797 *0.554 *−0.564 *0.329*0.638 *0.670 *0.912 *0.717 *0.875 *0.900 *1.000
o-diphenols0.2400.0590.562 *−0.0080.0760.760 *0.483 *−0.487 *0.2390.521 *0.774 *0.797 *0.639 *0.859 *0.755 *0.946 *1.000
Total secoiridoids0.2400.1550.673 *−0.0240.0800.816 *0.578 *−0.583 *0.343 *0.648 *0.697 *0.923 *0.679 *0.872 *0.873 *0.988 *0.960 *1.000
(*) marked correlations are significant at p ≤ 0.05.
Disclaimer/Publisher’s Note: The statements, opinions and data contained in all publications are solely those of the individual author(s) and contributor(s) and not of MDPI and/or the editor(s). MDPI and/or the editor(s) disclaim responsibility for any injury to people or property resulting from any ideas, methods, instructions or products referred to in the content.

