Article

Genome-Wide Association Mapping of Oil Content and Seed-Related Traits in Shea Tree (Vitellaria paradoxa subsp. nilotica) Populations

by
Juventine Boaz Odoi
1,2,3,4,5,*,
Emmanuel Amponsah Adjei
2,3,6,
Michael Teye Barnor
4,
Richard Edema
2,3,
Samson Gwali
1,
Agyemang Danquah
5,
Thomas Lapaka Odong
2 and
Prasad Hendre
7
1
National Forestry Resources Research Institute (NaFORRI), Agricultural Research Organization (NARO), Kampala P.O. Box 1752, Uganda
2
School of Agricultural Sciences (SAS), College of Agricultural and Environmental Sciences (CAES), Makerere University, Kampala P.O. Box 7062, Uganda
3
Makerere Regional Center for Crop Improvement (MaRCCI), College of Agricultural and Environmental Sciences (CAES), Makerere University, Kampala P.O. Box 7062, Uganda
4
Cocoa Research Institute of Ghana (CRIG), Bole P.O. Box BL 41, Ghana
5
West Africa Center for Crop Improvement (WACCI), College of Basic and Applied Sciences, University of Ghana, Accra P.O. Box LG 25, Ghana
6
Council for Scientific and Industrial Research, Savannah Agricultural Research Institute, Tamale P.O. Box TL 52, Ghana
7
Center for International Research in Forestry—International Center for Research in Agroforestry (CIFOR—ICRAF), United Nations Avenue, Girigiri, P.O. Box 30677, Nairobi 00100, Kenya
*
Author to whom correspondence should be addressed.
Horticulturae 2023, 9(7), 811; https://doi.org/10.3390/horticulturae9070811
Submission received: 29 May 2023 / Revised: 23 June 2023 / Accepted: 27 June 2023 / Published: 14 July 2023
(This article belongs to the Special Issue Genetics and Molecular Breeding of Fruit Tree Species)

Abstract

:
Shea tree (Vitellaria paradoxa) is an important fruit tree crop because of its oil used for cooking and the industrial manufacture of cosmetics. Despite its essential benefits, quantitative trait loci linked to the economic traits have not yet been studied. In this study, we performed association mapping on a panel of 374 shea tree accessions using 7530 Single-Nucleotide Polymorphisms (SNPs) markers for oil yield and seed-related traits. Twenty-three SNP markers significantly (−log10 (p) = 4.87) associated with kernel oil content, kernel length, width, and weight were identified. The kernel oil content and kernel width had the most significant marker–trait associations (MTAs) on chromosomes 1 and 8, respectively. Sixteen candidate genes identified were linked to early induction of flower buds and somatic embryos, seed growth and development, substrate binding, transport, lipid biosynthesis, metabolic processes during seed germination, and disease resistance and abiotic stress adaptation. The presence of these genes suggests their role in promoting bioactive functions that condition high oil synthesis in shea seeds. This study provides insights into the important marker-linked seed traits and the genes controlling them, useful for molecular breeding for improving oil yield in the species.

1. Introduction

The shea tree (Vitellaria paradoxa C. F. Gaertn.) is an important economic tree crop known for its oil used to produce valuable products in the food and cosmetic industries [1]. The tree is endemic to Sudano-Sahelian Africa, covering 21 countries [2], where it adds to the sustainability of sociocultural and economic wellbeing of the communities. The shea tree: Vitellaria paradoxa C. F. Gaertn., has two described subspecies: V. paradoxa subsp. paradoxa and V. paradoxa subsp. nilotica. The two subspecies vary for their morphological characteristics [3]. The subspecies nilotica has larger flowers and a dense “woolly” appearance that remains on young leaves and persists on leaf veins and midribs. It is characterized by dense ferruginous indumentum on pedicels and outer sepals, with the constituent hairs being longer, spreading and imparting a woolly appearance to the parts during the bud stage. The hermaphroditic and actinomorphic flowers are always in dense clusters on the twigs that have not formed leaves [4]. In the subspecies paradoxa, the flowers have longer styles measuring 12–15 cm [5].
The tree is a diploid (2n = 24), highly outcrossing that has undergone domestication in the savannah parklands of Africa for over 1000 years [6]. A molecular marker study by Allal et al. [7] placed the centre of origin of V. paradoxa in West Africa, where three genetic groups corresponding to West, Central, and East African types were found. The shea genome size is up to 658.7 Mbp, consisting of 38,505 coding genes [8]. There is an observable variation in stand densities within the shea parklands, due to the differences in land use, localities, soils, rainfall, temperature, daylight length, and ecological conditions [9], forming seven different morphological and structural forms [10].
The shea tree is recognized as the second-highest oil-producing plant, after the oil palm [8]. The global market for shea products was reported to be USD 30 billion in 2020 [11]. This high demand is owed to its use in the confectionary and cosmetic industries. The demand for these natural and organic cosmetics in the European market reached EUR 3.90 billion in 2019 [12]. The cosmetic sector alone exceeded USD 530 in 2020 and is expected to rise to USD 1025 million in 2027. Among this, the US market alone is projected to rise from USD 240 million in 2020 to USD 390 in 2027 and expected to grow at a compound annual growth rate (CAGR) of 7%, due to the increasing demand in the cosmetics industry [13]. The total export of oils from different plants to Europe in 2020 was estimated at 300,000 tonnes, with the Netherlands and France being the leading importers. However, both processed and unprocessed products are sold in national and international markets, contributing to national income through foreign exchange in the shea-producing countries. The leading producers of shea in Africa are Nigeria (361,017 tons/year), Mali (49,640 tons/year), Burkina Faso (45,183 tons/year), and Ghana (33,878 tons/year) [11]. There is a huge and untenable supply deficit due to heightened international demand, necessitating breeding interventions to boost production across its range.
The first recognizable shea tree improvement efforts were through a participatory selection trial of plus trees from three countries in West Africa [14]. A larger collection (from Burkina Faso, Benin, Nigeria, Ghana, Cameroun, Niger, and Mali) of carefully selected plus shea trees raised from clonal materials was also established in Mali by the World Agroforestry (CIFOR-ICRAF) [14]. Over time, there has been increasing interest in improving shea tree productivity to meet the looming domestic and international demand for shea products [15]. Some concerted efforts have been made in shea tree breeding at the University of Peleforo Gon Coulibaly (UPGC) in Korhogo, Côte d’Ivoire, where some elite trees were selected and propagated [16] by grafting to reduce the juvenile maturity period [17]. Other innovative approaches have been used in participatory plant breeding (PPB), using local knowledge to identify and select preferred traits by the communities. Such traditional and contemporary breeding and selection processes are important for tree species like shea trees, to generate new varieties with various desired properties [18].
Recent advances in shea tree genomic studies by Hale et al. [8] and Wei et al. [1] have provided insights on the new opportunities in genome-assisted breeding. Despite these advancements, the genomic resources remain underused for boosting production and improving oil yield and quality. Genome-wide association studies (GWAS) provide opportunities to identify genomic regions of an organism that are putatively associated with the traits of interest to plant breeders [8]. With the availability of affordable and economic modifications of genome sequencing approaches like genotyping by sequencing (GBS), discovering and using SNP markers has become a preferred way of genotyping. One of these technologies is the Diversity Arrays Technology Sequencing (DArTseq), where a genome is partially sequenced using a specific combination of restriction enzymes and the restriction tags are used for assembling and discovering the SNP markers [19]. The discovered SNPs are generally spread all over the genome and can be used in GWAS for the study of a wide range of tree crop traits of economic importance [20]. This study was carried out to identify genomic loci associated with seed oil content, seed weight, seed length and width of the shea tree in Uganda. Determining the marker trait association shall enhance shea tree breeding by reducing on the time required to complete the breeding cycle.

2. Materials and Methods

2.1. Plant Materials and Leaf Sampling for DNA Extraction

A total of 374 shea genotypes from the germplasm collection (Breeding Seedling Orchard) Uganda were used in this study. A total of 3600 shea fruits/seeds were collected from 180 families (Supplementary Table S1) in the districts of Amuru, Arua, Katakwi, Moyo and Otuke. The seeds were then divided into two portions: for sowing and for oil extraction. A minimum of 10 seeds were randomly picked from each family for sowing to generate seedlings used in DNA extraction. Fifteen seeds from the remaining lot were processed and used for oil extraction.
The shea seeds were sown in a tree nursery at Ngetta Zonal Agricultural Research Development Institute (NgeZARDI), Lira—Uganda in the month of June 2018. The seedlings were managed in the tree nursery for 12 months until they developed between 4–6 leaves before sampling the leaf tissues for DNA extraction. Leaf samples of 374 seedlings were randomly picked for DNA extraction and analysis at Biosciences Eastern and Central Africa- International Livestock Research Institute (BeCA-ILRI). Only healthy and recently flushed leaves from the previous season were sampled and placed in DNA extraction kit and dried using Silica gel before shipping to BeCA-ILRI.
After leaf tissue sampling, the genotypes were further managed in the nursery for another 6 months to allow them to heal and later planted in a multi-locational trial (breeding seed orchard) located in Lira (NgettaZARDI) and Serere (National Semi Arid Resources Research Institute (NASARRI), using Random Complete Block Design (RCBD) in the month of October 2019. The trials were maintained as germplasm collection for future breeding programme in Uganda.

2.1.1. Shea Oil Extraction Procedure

Oil content was determined using Soxhlet extraction [21], the American Official Agricultural Chemists’ method for determination of oil content in plant materials in the months of September and October 2020. Oil was extracted with continuous reflux of petroleum ether over crushed dried Shea nut powder in a Soxhlet extractor. The oil contents of each seed lot were extracted in triplicates and presented in percentage of its dry matter content.

2.1.2. DNA Extraction and SNP Discovery by DArTseq™ Technology

Total genomic DNA from silica dried leaf samples were extracted at BeCA-ILRI following the CetylTrimethylAmmonium Bromide (CTAB)/chloroform/isoamyl alcohol method [22]. DNA samples were processed in digestion/ligation reactions as described by Hale et al. [8]. The DNA was quality checked using standard processes involving 0.8% agarose gel electrophoresis, optical measurements for 260 and 280 nm using a NanoDrop 2000 spectrophotometer (ND-2000 V3.5, NanoDrop Technologies, Inc., Wilmington, DE, USA) and quantification using a Qubit™ 3.0 Fluorometer (Thermo Fisher Scientific, Grand Island, NY, USA). The libraries were prepared for 752 individuals using the PstI-SphI complexity reduction method [23] and partial-genome sequenced using proprietary DArTseq (1.0) methodology [19] on a HiSeq2500 Sequencer (Illumina Inc., San Diego, CA, USA) with 72 bases read length [24,25].
Sequences generated from each lane were processed using proprietary DArT analytical pipelines. DArT-Seq™ technology relies on a complexity reduction method using restriction enzymes that are sensitive to DNA methylated sites and repetitive DNA [24]. In the primary pipeline, the FASTQ files were first processed to filter poor-quality sequences, applying more selection criteria to the barcode region compared to the rest of the sequence. Approximately 2,500,000 (±7%) sequences per barcode/sample were used in marker calling. Finally, identical sequences were collapsed into “fastqcall files.” These files were used in the secondary pipeline for DArT P/L’s proprietary SNP and SilicoDArT (Presence/Absence Markers in genomic representations) (present = 1 vs. absent = 0) calling algorithms (DArTsoft14). The analytical pipeline processed the sequence data. The reads were then aligned to the shea_V1 reference genome publicly available from the ORCAE database (https://bioinformatics.psb.ugent.be/orcae) (accessed on 30 December 2021), using BWA-MEM/VarDict mapper for mapping of reads against the reference genome [8].

2.2. Data Analysis

2.2.1. Seed Trait Data Analysis

The seed trait data were analysed using “agricolae” package in R software v 4.0 [26]. Analysis of variance (ANOVA) was performed to determine the variations within and among the genotypes. The “corr” function in R software v.4.0 (R Core Team, 2022) was used to calculate correlation coefficients between the studied traits and presented in graphical form.

2.2.2. Genome-Wide Association Analysis and Gene Annotation Identification

A multi-locus random-SNP-effect mixed linear model (mrMLM) [26] was implemented in R statistical software using the mixed model equation for GWAS presented in Equation (1), in accordance to Yu et al. [27], using additive, general; dominant alternative and dominant reference gene action models for trait association study [28]. This current study selected mrMLM method to avoid bottlenecks in stringent correction using other control measures (false discovery rate (FDR) and Bonferroni correction) against false positive rate [29]. The mrMLM uses a less stringent significance threshold considering a critical probability value or log of odds (LOD) making it possible to identify any possible loci of importance.
Y = Xb + Zu + e
where:
  • Y = the vector of the phenotypic observations estimated for the traits studied;
  • X = the SNP markers (fixed effect) matrix;
  • Z = the random kinship (co-ancestry) matrix;
  • b = a vector representing the estimated SNP effects;
  • u = a vector representing random additive genetic effects, and
  • e = the vector for random residual errors.
The phenotypic variation explained by the model for a trait and a particular SNP was determined using stepwise regression implemented in the “lme4” R package. The SNP loci in significant association with traits were determined by adjusted p-value using Bonferroni correction [30]. Quantile–quantile (QQ) plots were generated by plotting the negative logarithms (−log10) of the p-values against their expected p-values to test the appropriateness of the GWAS model with the null hypothesis of no association and to determine how well the models accounted for the population structure.
To account for the putative genes linked to traits, a window range of 5 kb (upstream and downstream) was defined [31]; and genes were searched from the V. paradoxa Whole Genome v2.0 Assembly and Annotation v2.1 [32] in the ORCAE database (https://bioinformatics.psb.ugent.be/orcae, accessed on the 30 November 2022) [3], with a search for candidate genes associated with oil yield traits. The gene name, description, and AGPv4 coordinates with their protein, were then retrieved from the Vitellaria paradoxa reference genome database. The putative functional candidate genes linked to the associated SNPs were then annotated in line with any initially annotated genes from other species.
A Linkage disequilibrium (LD) heat map was generated for the entire genome, with heterozygous calls ignored and a default sliding window of 50 used in tassel software. LD decay rate was then evaluated on a chromosome-by-chromosome basis. A measure of LD (r2) and pairwise distance between SNPs were generated in TASSEL and exported to R version 4.3, where scripts were written to generate LD decay plots for significant LD pairs. Mean LD per chromosome was calculated after every 20 kb interval, and the average genome-wide decay rate estimated by averaging LD in each interval across all chromosomes. A line graph was used to clearly display an overlay of chromosome-specific and the mean genome-wide LD decay rates.

3. Results

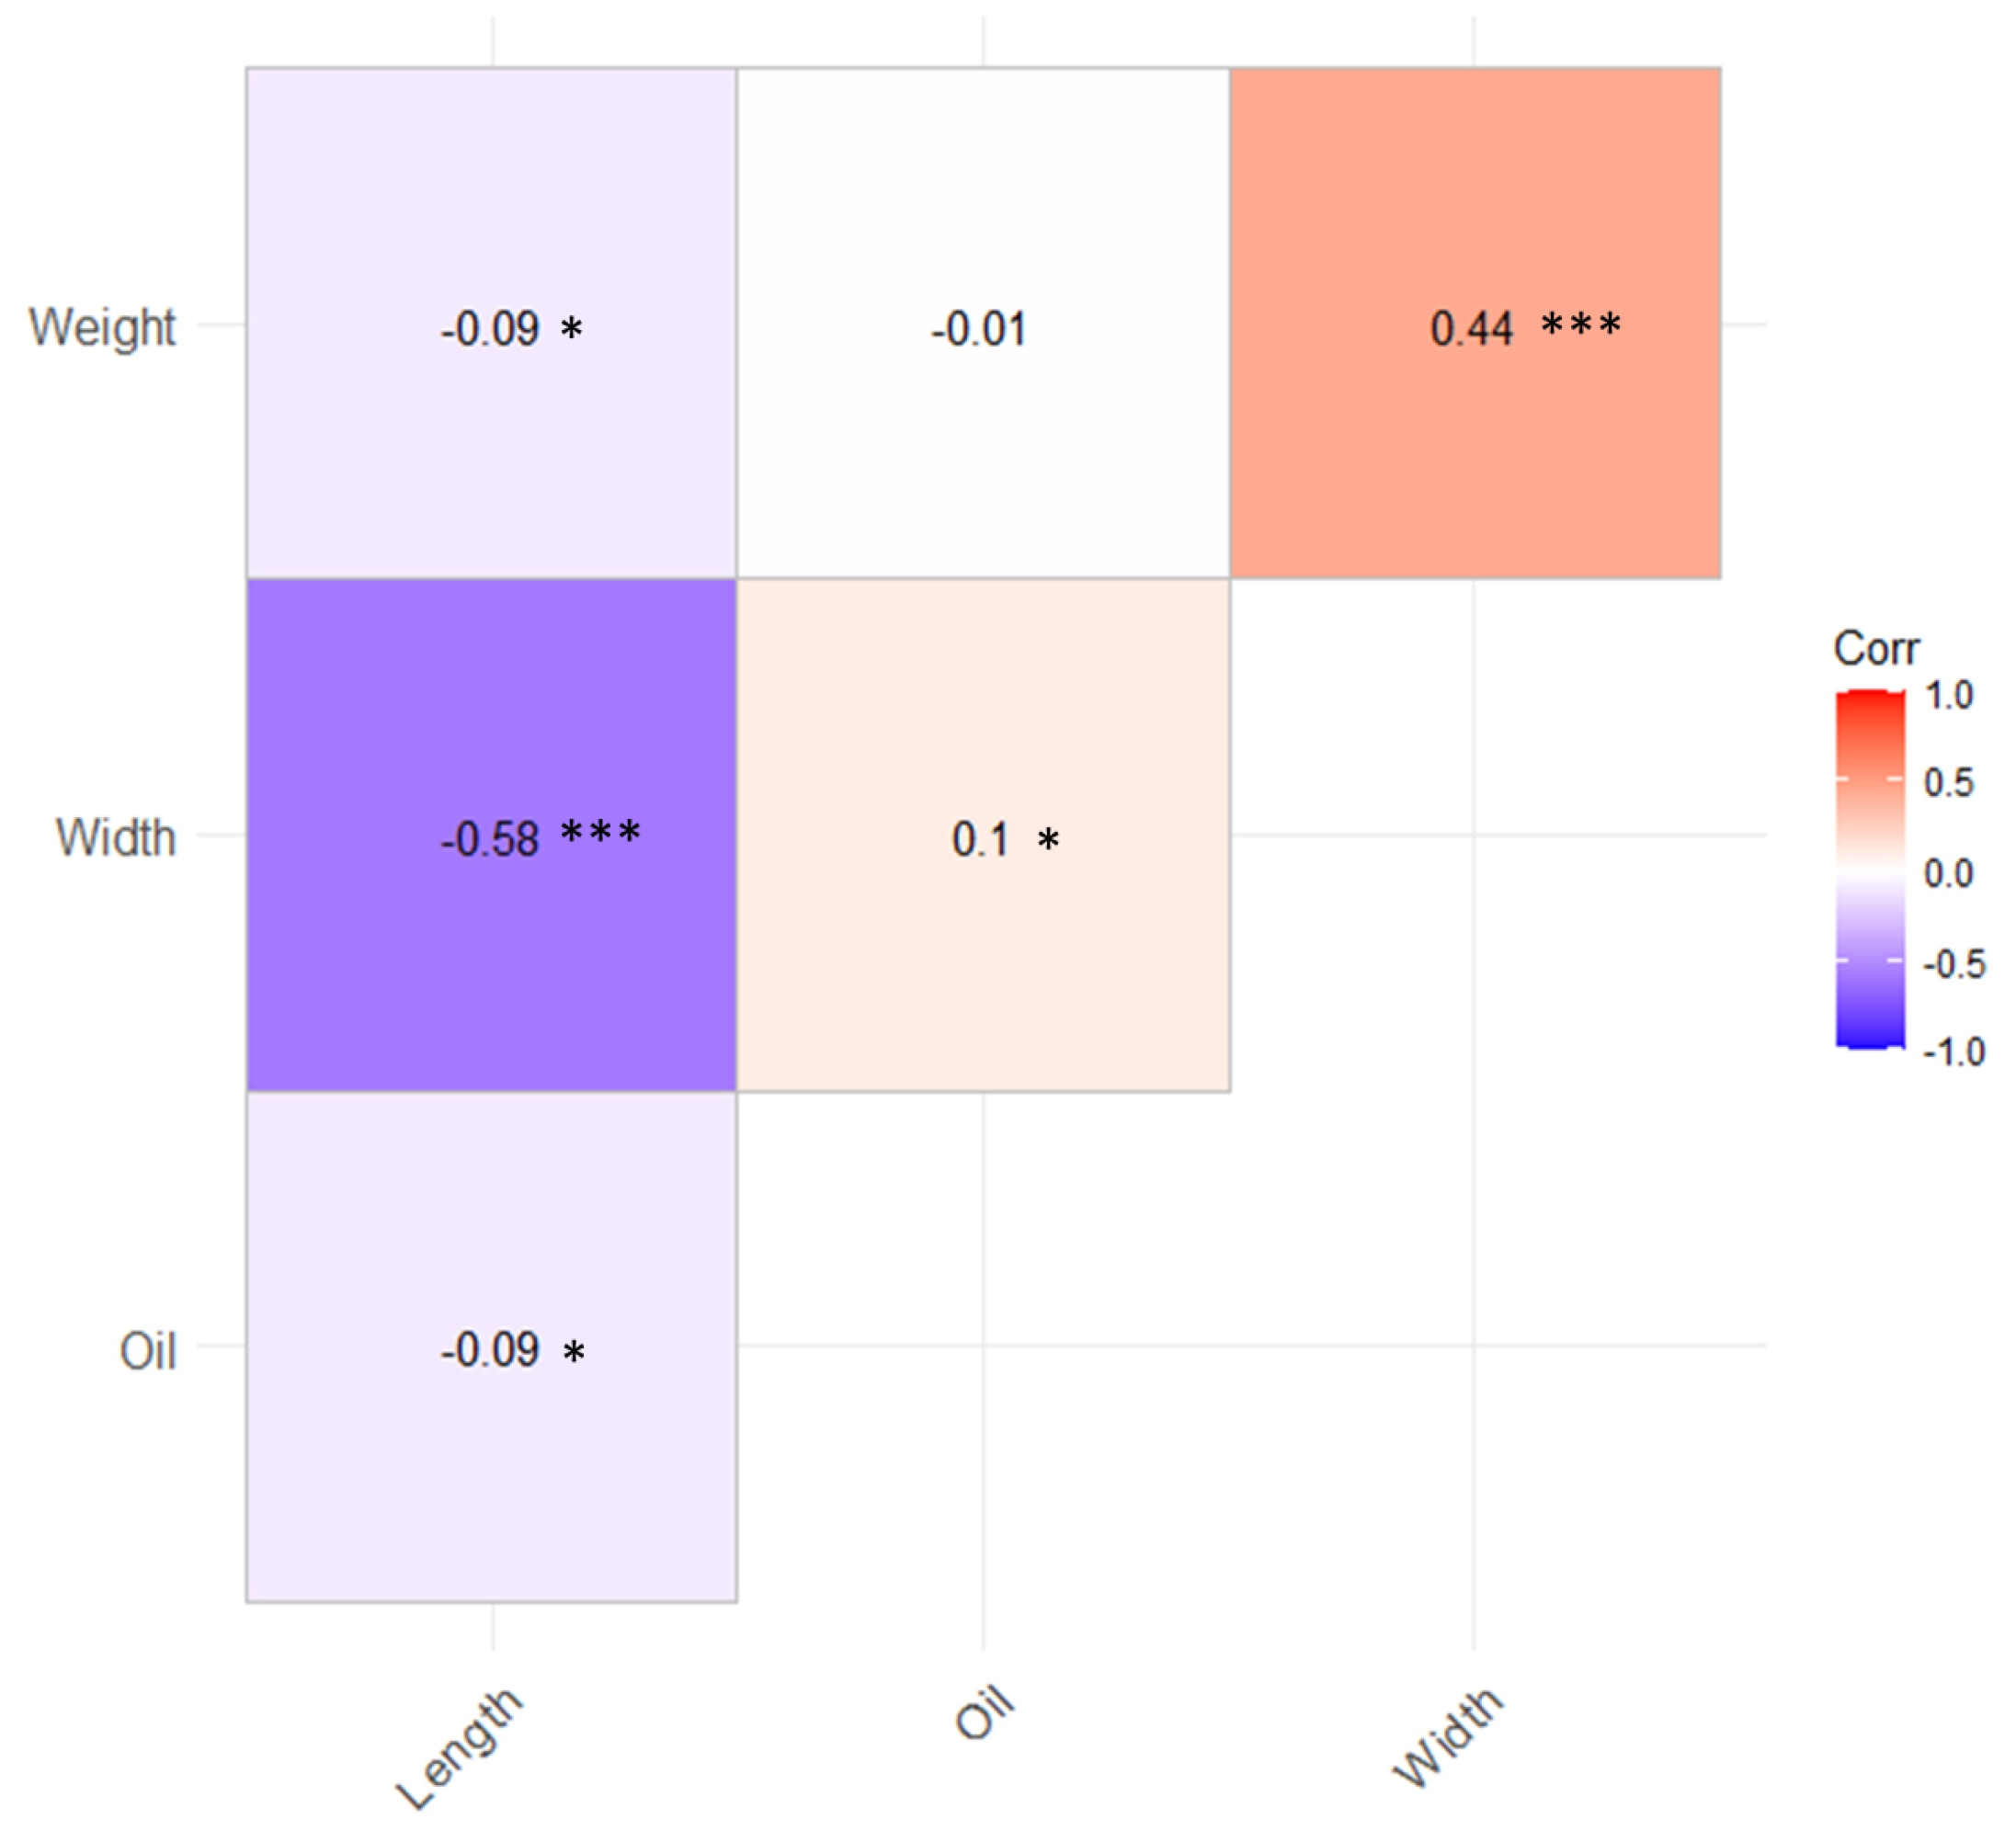
3.1. Phenotypic Variation for the Shea Tree Traits

The traits mean values, standard deviations and the phenotypic data range of a collection of 374 open pollinated seeds from 180 shea trees from Uganda’s parklands are presented in Table 1.
The mean seed oil content of 180 shea genotypes was 53.53% with a range of 39.05–69.77%. A relatively heavy kernels (18.81) and very low weight genotypes were also observed (Table 1).
Analysis of variance showed that genotype, environment, and their interaction (genotype-environment) were highly significant for kernel oil content (Table 2). Variation in kernel weight and its axial dimensions were significantly influenced by genotype and the environment. However, the interaction of genotype and environment had no significant effect on kernel weight and its axial dimension (Table 2).
Seed oil content showed a significant positive correlation with kernel width (r = 0.1, p ≤ 0.001). However, it negatively correlated with kernel weight (−0.01) and kernel length (−0.09) (Figure 1). The result further revealed a moderate (0.44) correlations between kernel width and kernel weight, and kernel width and kernel oil content (0.1), whereas oil content is negatively correlated with kernel weight (−0.1) and kernel length (−0.9) (Figure 1).

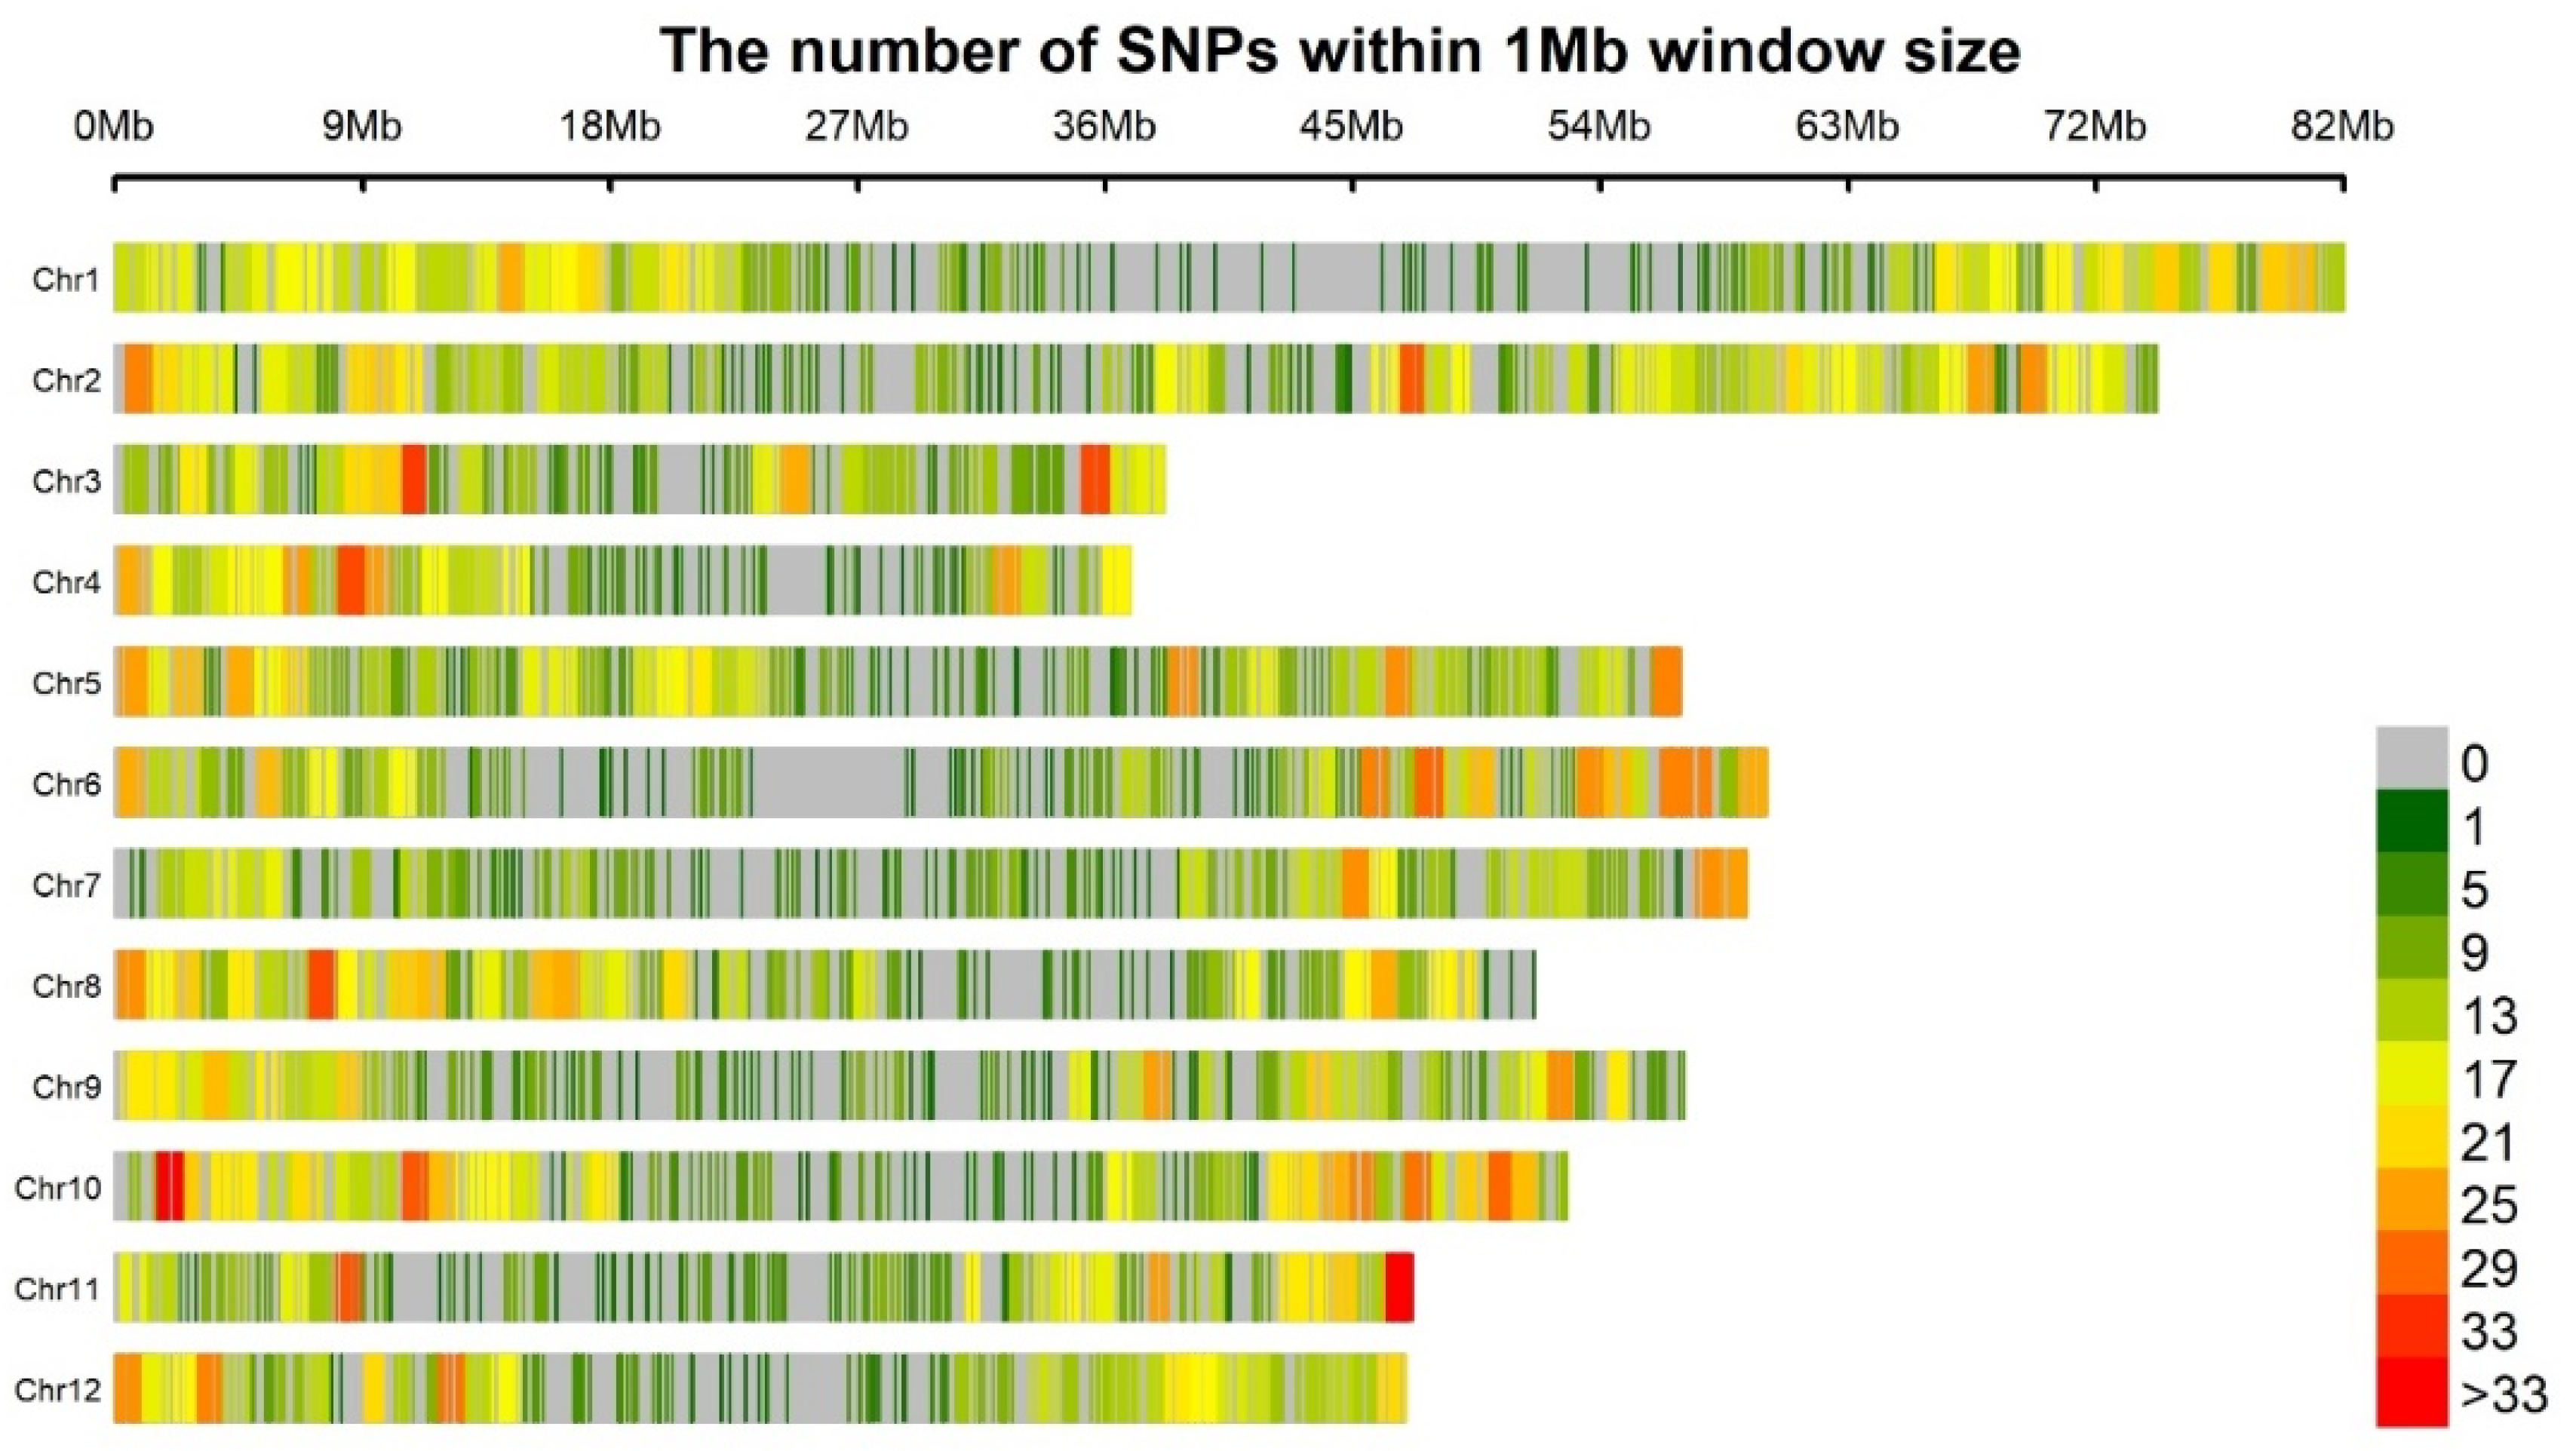
3.2. Marker Coverage and SNP Distribution

The SNP calling pipeline generated 30,733 highly polymorphic SNP markers, of which 27,063 (88.1%) remained unmapped on the 12 Vitellaria paradoxa chromosomes. Only 7530 SNP markers (27.8%) of the mapped SNP markers were retained after filtering with >20% of missing data, <0.05 minor allele frequency (MAF) and utilized as input for the GWAS analysis.
Chromosome two had the highest number of markers (960 SNPs; Chr size = 74.5 Mb, ~13 SNPs/Mb) followed by chromosomes one (805 SNPs; Chr size = 82 Mb; ~10 SNPs/Mb), chromosome ten (780 SNPs; Chr size = 50 Mb; 10 SNPs/Mb), five and eight (650 SNPs; Chr size = 56.5 Mb; ~11 SNPs/Mb, and 645 SNPs; Chr size = 58 Mb; ~12 SNPs/Mb respectively). Meanwhile, chromosomes four (425 Chr size = 37 Mb; ~ 12 SNPs/Mb) and chromosome three (430 SNPs; Chr size = 38.6 Mb; 11 SNPs/Mb) had the lowest number of markers (Figure 2 and Table 3). This indicates a non-random distribution of SNPs with varying SNP frequencies on the 12 chromosomes of shea tree genome in Uganda. Further population structure and SNP data (Table 3) information are available in Odoi et al. [33].
Minor allele frequency (MAF) among the 7530 SNP markers varied from 0.03 to 0.50. The study further revealed a high level of heterozygosity within individuals (0.26) and markers (0.32) indicating a high non-random association of alleles at different loci that offer opportunity for association studies and allele transfer through marker-assisted selection of the population. The filtered markers were similar in their Polymorphic Information Content (PIC), ranging from 0.258 (chromosome 4) to 0.269 (chromosome 12) with a mean PIC of 0.26 across the chromosomes (Table 3).
There was a general high gene diversity (0.32) across the chromosomes with chromosome 12 being the highest (0.33) and chromosomes 4, 1 and 6 being the lowest (0.31 respectively). Structure analysis revealed that shea tree populations in Uganda are genetically grouped into two clusters of Eastern group and West Nile/Northern Uganda group. The Eastern cluster contributed the highest (57%) proportion of individuals and West Nile/Northern Uganda cluster (43%).
Out of the 12 chromosomes in the shea genome (Figure 2), only two (Chromosome 1 and 8) revealed significant loci. The result of Linkage disequilibrium (LD) indicated that 187,487 loci pairs in a physical distance of 605,450 bp. Of the total loci, 3.62% (6795) of them were in significant (p < 0.01) LD. The results further revealed that 87 (1.28%) loci pairs had r2 = 1 (were in complete LD).

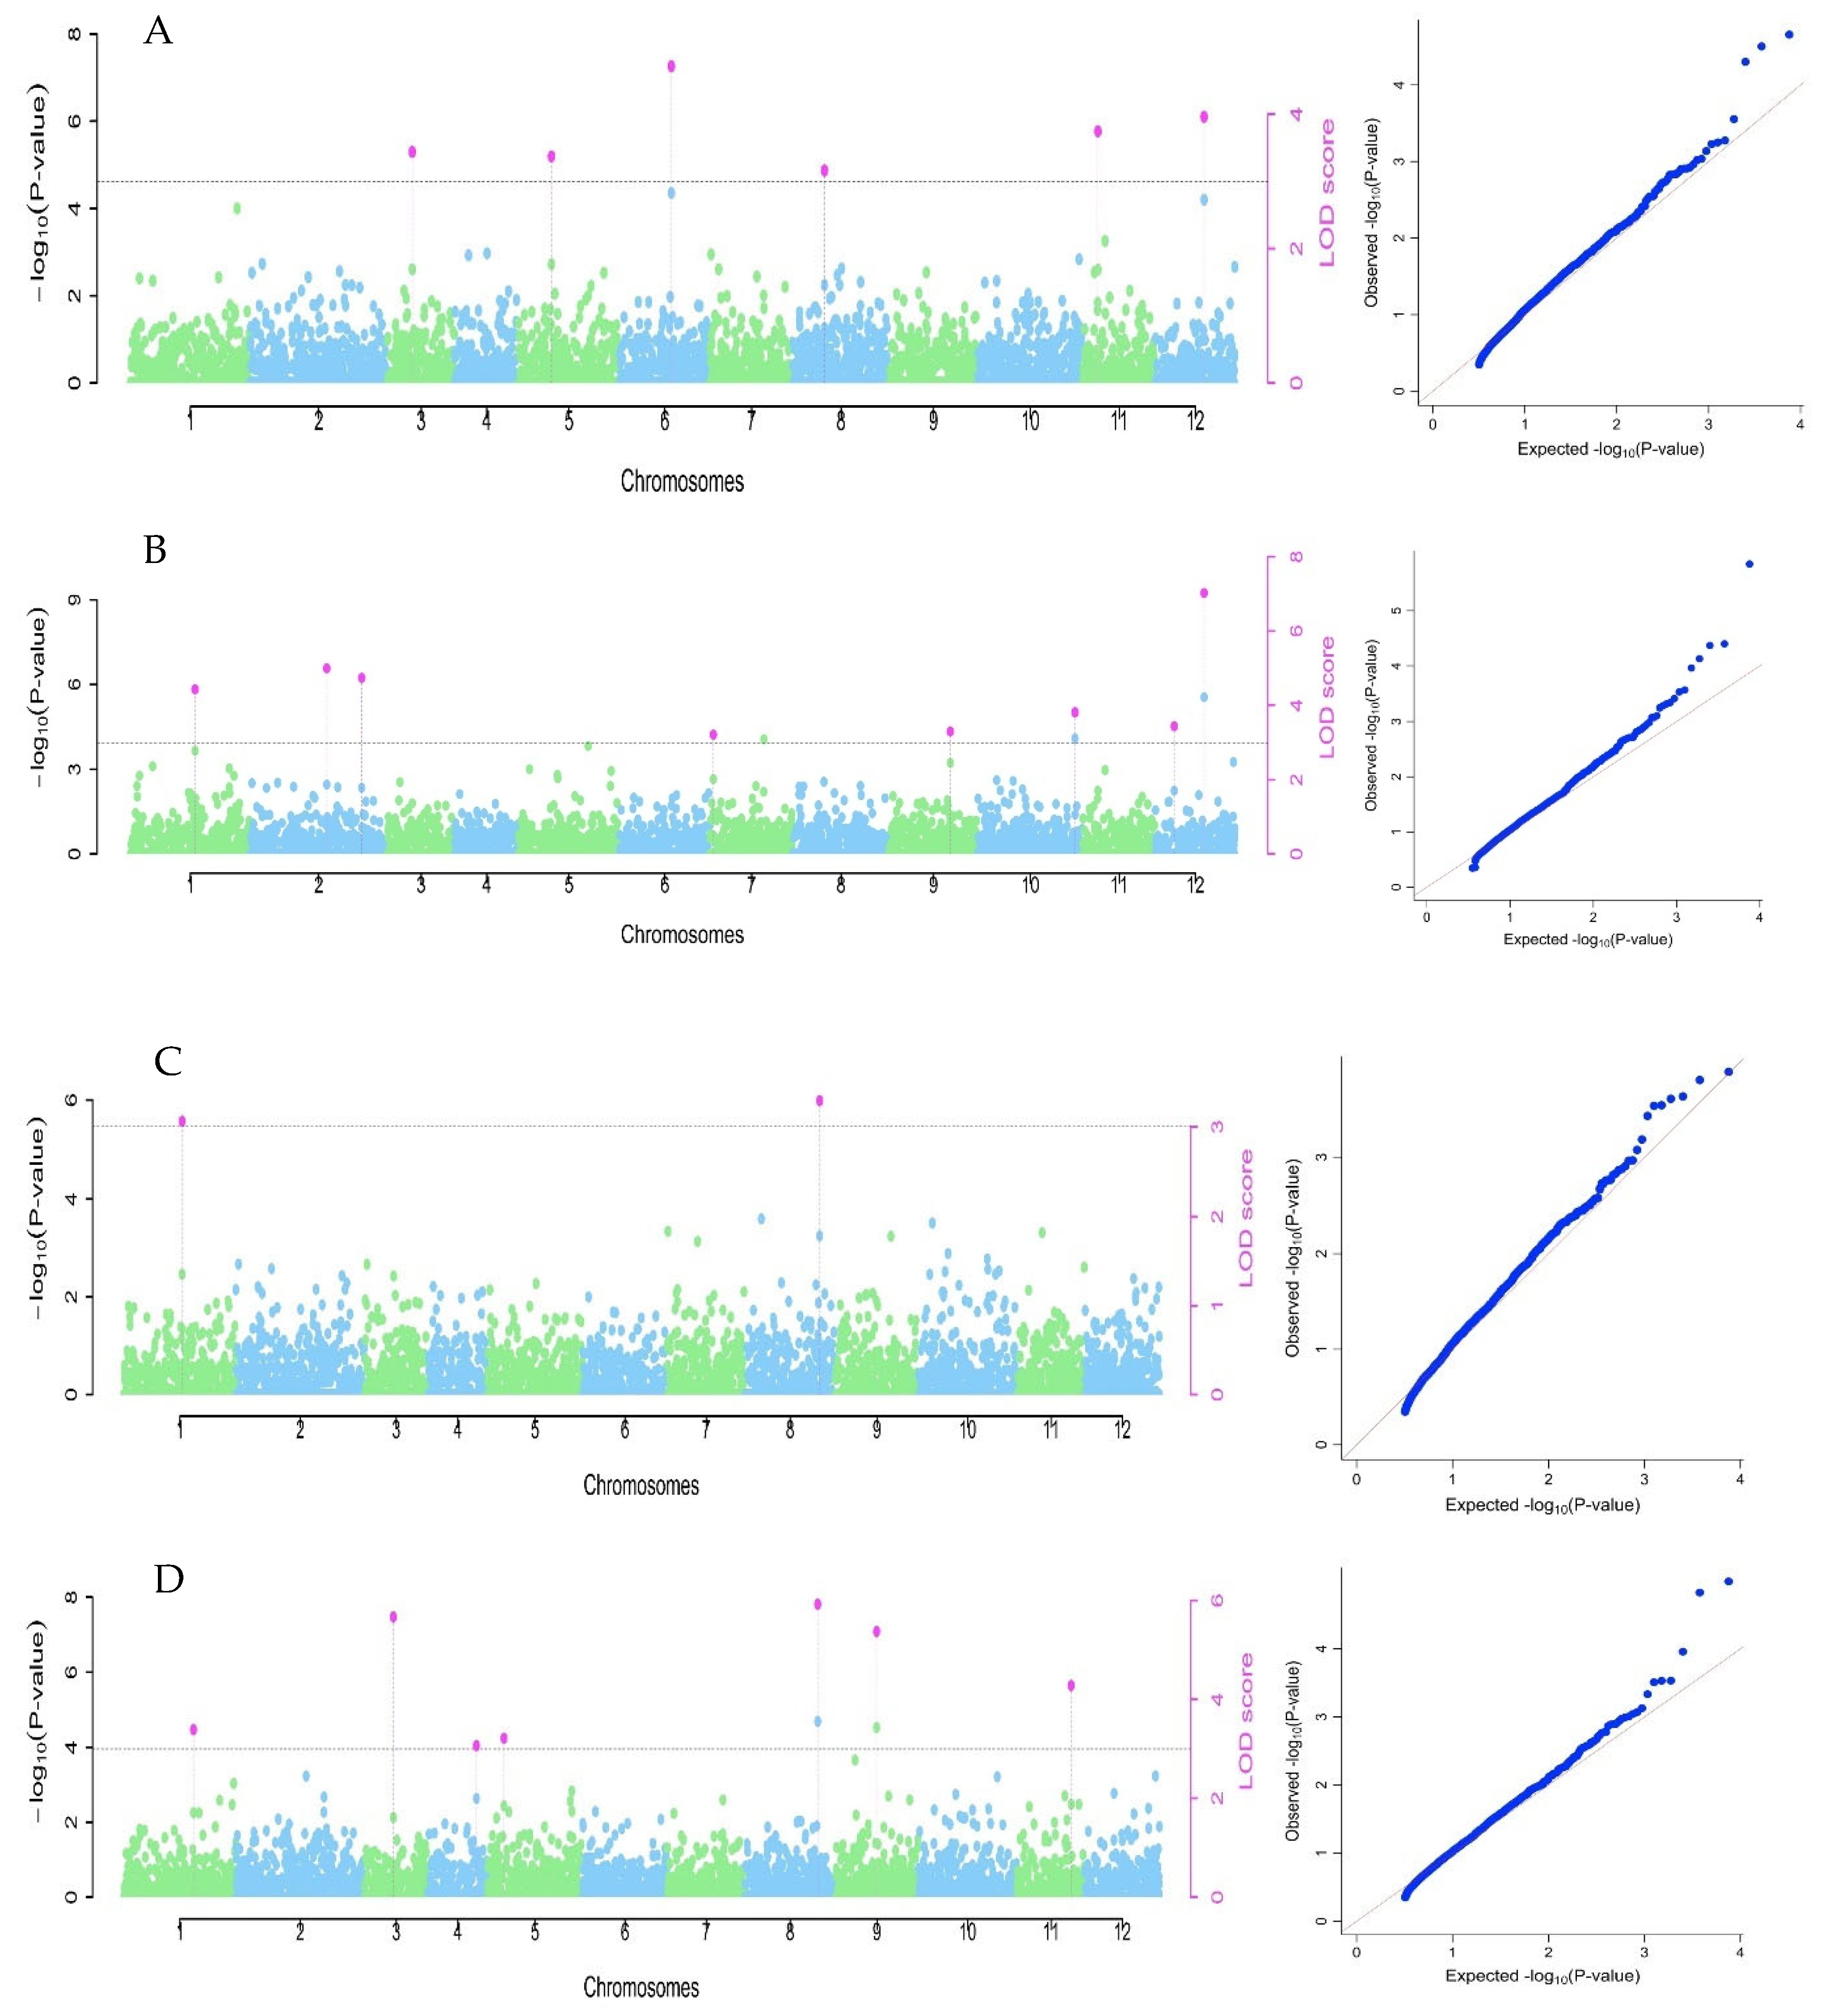
3.3. Marker Association for the Studied Traits

The association analysis was performed on shea seed-related traits and 16 significant markers were identified on chromosomes 1, 2, 3, 5, 6, 7, 8, 9, 10, 11 and 12 (Table 4 and Figure 3). Quantile-Quantile plots produced by displaying −log10 p-values against individual p-values revealed suitability of GWAS for the trait’s connection in the shea tree genotypes. The association analysis was performed for percent oil content of each shea tree line in a location using the V. paradoxa reference genome (https://bioinformatics.psb.ugent.be/orcae) (accessed on 8 March 2022). There were differences between the observed and expected values of the target traits, indicating a link between the phenotypic and SNP markers as indicated in Quantile-Quantile plots.
The seven SNP markers linked to shea nut oil yield (S1_60237300, S3_14843482, S4_32032310, S5_6275145, S8_41696703, S9_32689981 and S11_43126044) were located on chromosomes 1, 3, 4, 5, 8, 9 and 11 (Table 4) and were associated with high nut percent oil content estimated on dry matter basis. These seven loci explained an overall phenotypic variance of 12.4%, however, makers S8_41696703 and S9_32689981 had negative effects on seed oil content, although they explained the most (13.31% and 11.52% respectively) of phenotypic variation.
This current study revealed six significant SNP markers linked with shea kernel length (S3_11153087, S5_15524578, S6_46530240, S8_11121701, S11_8320549 and S12_32853547) located on chromosomes 3, 5, 6, 8, 11 and 12 (Table 4; Figure 3). The proportion of phenotypic variance explained by significant QTNs ranged from 6.5% in marker S5_15524578 to 14.6% in S6_46530240. The total phenotypic variance expressed by the trait was 0.095.
The GWAS revealed 8 genomic regions that were significant associated with kernel width. The 8 significant SNP markers linked to shea kernel width (S1_32402910, S2_47786838, S2_64059706, S7_3025298, S9_43700743, S10_50604452, S12_32853547 and S12_7613999) were located on chromosomes 1, 2, 7, 9, 10 and 12 (Table 4). Marker S12_32853547 contributed most (13.14%) of the phenotypic variation compared to the rest (ranging from 4.5%to 9.75%) (Table 4). The total phenotypic variation explained by the trait was 0.17.
In two significant SNPs (S1_30720144 and S8_43605016) located on chromosomes 1 and 8. Marker S8_43605016 contributed most (15.79%) of the phenotypic variation compared to S1_30720144 (9.21%) (Table 4). The total phenotypic variance in this trait was 0.061 Table 4: Figure 3).
Variations in the seed traits explained by the individual SNP markers (r2) varied from 4.47% in kernel width to 15.79% in kernel weight for the significant SNPs, indicating that they represent major QTLs associated with oil yield and kernel physical parameters Alleles ‘A’ of marker S1_60237300; ‘T’ of marker S11_43126044; ‘A’ of markers S4_32032310 and S5_6275145 in oil yield, had the highest positive QTN effect (0.8255, 0.8098, 0.737 and 0.683 respectively) revealing higher association with increasing oil yield. Although most of the seed related traits indicated negative QTN effects, the allele which had the highest (0.2942) positive QTN effect was allele ‘C’ in marker S12_32853547.

3.4. Potential Candidate Genes

A total of 23 candidate genes were identified by linking the significant SNP regions with the V. paradoxa genome (Table 5). The annotation result revealed six putative genes associated with seed length traits. Among these were: Protein metabolism and gluconeogenesis on chromosome 12 and Protein translocation on chromosome 11. The proteins are well known to play important role in mediating plant seed oil biosynthesis [34] and early seedling morphogenesis and development.
From the kernel width, eight putative genes were discovered, of which three (Zinc Finger Transcription Factor located in chromosome 3, protein binding located on chromosome 9 and Protein metabolism and gluconeogenesis located on chromosome 12) had linkage with shea seed oil biosynthesis pathways. Zinc Finger has been associated with playing a key role in plant seed oil biosynthesis and accumulation [35]. All the two identified genes (ATP hydrolase located on chromosome 1 and Protein Kinase on chromosome 8) in kernel weight trait are important in the biochemical pathways of plant seed oil synthesis (Table 5). The hydrolysis process is performed by the FATB acyl-ACP thioesterase or by 3-ketoacyl-ACP synthase II (KASII).
This study further identified seven gene/protein families associated with the percent dry matter oil content in shea nuts: Acyl-ACP Thioesterase Fat B (FATB); Acyl-CoA-binding protein (ACBP); Long Chain Acyl-CoA Synthetase (LACS); Fatty acid exporter (FAX2); (3-ketoacyl-ACP synthase II (KASII) and Fatty acid desaturases (FADs) on chromosomes 1, 3, 8, 9, and 11 (Table 6).
Acyl-CoA-binding protein (ACBP) was identified on chromosomes 3 at loci S3_14843482 and chromosome 5 at loci S5_6275145 that govern plant seed oil accumulation (Table 6). The genes are 1 Mbs from their respective SNPs. Candidate Gene (CG) selection for shea nut oil accumulation is presented (Supplementary Table S2). The genes were annotated with protein-coding genes, using GO.OBO v2.1. The functions of these genes in enhancing shea oil content are explained in Table 6.

3.5. Linkage Disequilibrium (LD)

The distance of the first part of the LD decay before correlation coefficient, r2 values reach zero was 2,312,772 bp, comprising of 375,037 marker pairs (Table 7). The r2, decayed within 1–2 Mbps to a value ˂ 0.01.
Chromosome 2 had the highest (46,764 marker pairs) LD followed by chromosome 1 (39,461 marker pairs), while chromosome 4 had the lowest (21,698 marker pairs). The total number of significant marker pairs was 11,940, with chromosome 2 having the most (1330) marker pairs and chromosome 4 (626) having the list.
The association analysis of the 374 highly heterozygous shea trees and the 7530 quality SNPs resulted in two most significant SNPs. Variations in the seed traits explained by the individual SNP markers (r2) varied from 4.47 to 15% for the significant SNPs. Allele ‘A’ of S1_60237300 marker had the highest allele effect (0.83) revealing higher association with increasing oil yield in shea tree, followed (0.81) by allele C in marker S11_43126044 and allele A (0.68) in S5_6275145 marker. Furthermore, for kernel width, allele ‘C’ in S12_32853547 also had a moderate effect (0.29). None the less, allele ‘T’ in marker S6_46530240 revealed the highest (−0.25) negative effect for the studied traits. The LD of significant SNP loci revealed six loci, three each on chromosomes 1 and 8, indicate that the markers had higher LD (r2 > 0.8). The markers in the rest of the chromosomes had a considerably low LD (r2 < 0.5).

4. Discussion

4.1. Phenotypic Data

Shortening juvenile maturity period for early fruiting and increasing oil yield per acre and quality aspects in shea oil are the major concerns in the shea industry. This study aimed at selecting shea parent materials for future breeding programme and bring about farmer solutions by establishing Multi-location Breeding Seed Orchards as a short-term remedy to quality source of shea tree planting materials.
There was variation in the seed trait characteristics in the shea accessions. The results for seed traits indicated a significant variation within the populations and a non-significant variation among the populations. Such non-significant variation observed among the populations is important in breeding for varieties that can easily be adapt across all the geographical range in Uganda. Furthermore, any newly bred variety shall be acceptable by all the communities within the shea parkland in Uganda. With the reliable heritability, selecting traits with marker association for high oil yield in shea tree will result in good genetic progress of the species. Earlier studies by Gwali et al. [36] and Okullo et al. [37] reported similar oil content (52.26%) in the species with this study (53.5%). The results of this study were slightly higher due to the participatory selection which suggests a potential genetic gain from selection given several genotypes with known higher yield (69.77%). Such results can be important in assessing the G × E interactions for some traits.

4.2. Candidate Gene Scan in the Oil Content Traits

The shea genome revealed associated SNP markers, important for identification of QTL regions controlling the variations of the quantitative traits [1]. Most important of this was the identification of the seven significant SNPs located close to genes that encode different proteins related to plant metabolic mechanisms and transport of biosynthetic products and materials.
GWAS can increase detectability of genomic association in plants [38]. In fact, GWAS has gained increasing popularity as a tool for analysing complex traits in plants [39]. It has been used to reveal the genes controlling polygenic traits including the genetic loci associated with the trait of interest in fruit trees [20]. Kumar et al. [40] used Mixed Linear Model statistical model for GWAS to study six commercial fruit traits in apple seedlings suggesting the potential of the tool in shortening the breeding cycle of tree species like shea.
The advances in omics technologies have enabled researchers to identify candidate genes that promote improvement of associated traits of commercial importance in plants. Earlier very few studies were conducted in determining these functional genes in shea tree [6,41,42]. However, recent sequencing of shea reference genome [8] and identification of genes in shea tree [1], has paved new avenues of genomic studies in the species. Studies for biochemical pathways of oil synthesis in plant seeds have been advanced [43] and several gene expression and enzyme activities in plant seed oil accumulation fronted [44]. Interestingly, 45 seed oil biosynthesis genes were reported in shea tree genome [8]. This study discovered 23 such genes that are potentially associated with shea nut oil biosynthesis pathways (Table 5 and Table 6). Of all, acetyl-CoA carboxylase (ACC) is notably the major enzyme catalyst in shea oil biosynthesis [1]. Earlier studies revealed 9 gene copies of Ketoacyl-ACP synthase (KAS) in shea, 6 of these were also reported in Theobroma cacao, suggesting their contribution to the increased lipid content in shea than in cocoa. Other genes with higher number of copies in shea include: FAD2, FAD3, and LACS genes [34]. The biological effect of LACs genes discovered on chromosome 4 includes modification of fatty acids chain lengths along the plant oil biosynthesis pathways [45].
The validity of the interrelations among the traits of study was assessed using correlation matrix. It was observed that oil content in V. paradoxa was only moderately correlated with kernel width. As observed in the biochemical functions of the genes conditioning the seed related traits that condition seed development and seedling germination. In concordance with this study, Jasinski et al. [46] reported that plant seed oils in angiosperms act as an important reserve of carbon and energy soon after seedling germination until it starts photosynthesis. The presence of proteins suggests their role in promoting shea bioactive functions that condition high oil yield in the species. Previous studies in shea by Lovett and Haq [3] revealed similar proteins that play a major role in oil biosynthesis pathways in oil plant seeds. In fact, Wei et al. [1] predicted presence of more genes associated with oil metabolism in the shea tree genome. Another study Hale, et al. [8] predicted expansion of gene families involved in stearic acid biosynthesis in shea tree which agrees with this current study.
The significant candidate gene for oil content in this study, Acyl-CoA-binding protein (ACBP) was located on chromosome 3 and 5 associated to markers S3_14843482 and S5_6275145 with annotated transcriptional regulation of oil biosynthesis in seed plants. The enzyme plays a role during early fruit formation and play multiple functions such as: tissue growth, cellular trafficking, and physiological processes [47]. The enzymes are usually in the nucleus, are expressed predominantly in developing seeds during maturation. Similar findings were also reported in Arabidopsis thaliana seeds [35]. Moreover, the strong association with annotated function and Acyl-CoA-binding protein (ACBP) genes could be taken advantage of to breed for high oil yield shea tree varieties in Uganda. The biological effect of ACBP includes lipid metabolism, cellular signalling for stress management and disease resistance in plants [48]. This gene encodes metal ion binding enzyme, mostly carbonic anhydrase and alcohol dehydrogenase enzymes that contain zinc as part of their molecule. This zinc finger gene family has been reported to play a major role in oil biosynthesis pathways in the oil palm [48].
The third significant candidate gene was Ketoacyl-ACP synthase (KAS) gene. The gene plays a major role in lipid biosynthesis pathways in shea nuts, thereby increasing oil content in the species [8]. Similar findings on Chinese seed oil shrub, Paeonia lactiflora have been advanced [49]. KAS II for example is key in the biosynthesis pathways of fatty acids in plant seeds [50] and early nudling. The Fatty acid exporter (FAX2) genes play a major role in biosynthesis transportation and significantly increases oil content in shea tree. In another study, Janik et al. [51] reported the involvement of FAX in Chlamydomonas reinhardtii oil synthesis, similar to this current study. On the other hand, Acyl-ACP Thioesterase Fat B (FATB) was also discovered in other plants like Koelreuteria paniculata known to be involved in the synthesis of saturated fatty acids in the species [52], which is in line with this current study. Further still, FADS genes reported in this study, is responsible for the synthesis of unsaturated fatty acids and important for plant development and response to biotic and abiotic stresses [53]. The report therefore confirms the findings in this current study for the role played by the genes in significantly controlling high oil yield in V. paradoxa Subsp. nilotica.

4.3. Candidate Gene Scan within the Seed Related Traits

The seed related traits with significant SNPs under this study were having linkage with oil yield in shea nuts. The proteins responsible for oil biosynthesis identified in kernel length trait was associated to marker S8_11121701 in chromosome 8. In kernel width trait, S1_32402910 marker discovered on chromosomes 1 had proteins which are linked with processes involved in plant seed oil biosynthesis pathways [24]. For kernel weight trait, S1_30720144 and S8_43605016 markers in chromosomes 1 and 8 were associated with the proteins responsible for oil biosynthesis. In fact, Wei et al. [1] reported similar results with QTLs identified at different locations of shea tree genome. The proteins play a major role in ATP hydrolysis and prediction of protein residues as disordered, during plant seed oil biosynthesis processes. The first evidence was reported by Botha et al [54] linking the functions of the genes to seed development and early seedling growth in Ricinus communis oil seeds. The genes reportedly play a major role during seed drying by concentrating inorganic phosphate while de-concentrating the extracellular pyrophosphate which inhibits formation of minerals [55].

4.4. Linkage Disequilibrium (LD)

The LD reveals the evolutionary and demographic events of a population and in mapping genes that are associated with quantitative traits. The implication of this association is that the marker loci contain a causal variant in LD with the identified marker by GWAS. This is further revealed by the small blocks in heat map where the causal variant(s) can be sought. Therefore, it is important to increase our understanding of co-evolution of linked sets of genes. A wide range of LD (r2 > 0.2) in the shea tree population used in this study, was also found in citrus [56]. Such a range of LD is expected in heterozygous outcrossing species like shea tree [56]. The mean r2 (0.2) in the shea tree population indicated that the markers in the shea tree population is sufficient for genomic selection as LD is maintained by selection. This study describes the potential candidate genes associated with oil yield in shea tree. It further describes the locations of these significant genes in the chromosomes for any further verification. The significant association was discovered on chromosome 1 and 8 for seed related and oil yield traits, explaining 58% of the phenotypic variation.
Inbreeding creates LD owing to the recent common ancestry by increasing the covariance between alleles at different loci. This, therefore, offers opportunities to design association studies and allele transfer using marker-assisted selection [57,58]. LD therefore presents an opportunity in this study in that if an upper positive selection of preferred traits in shea tree is conducted, it will accelerate the frequency of alleles conferring the preferred trait during breeding. This is because as the linked loci strongly remain in LD with that allele.

4.5. Marker Assisted Selection in Shea Tree

The oil content candidate genes identified in this present study will be cross validated in the established multi-locational trials in NgetaZARDI and NASARRI to determine the ideal molecular markers for enhanced shea tree oil content breeding programs in the country. This is possible by stacking the novel genes into the shea tree genotypes with high oil content using marker-assisted selection. A combination of novel QTLs can further enhance oil content in the shea tree. Furthermore, determination of the allelic status at the markers with significant alleles for oil content will enable the selection of those significant markers for shea oil yield improvement in Uganda. The variations observed in the traits within the location but not across confirms that the species is highly outcrossing [42] or segregating population. The Analysis of variance (ANOVA) in Table 3 indicates a significant variation within the population and this further re-affirms the level of variation in the species. The result of this study points to potential QTNs that explain the genetic variations in the population. In this study, the putative major QTN for oil content explains up to 58% of the phenotypic variance in the species.
Developing MAS options that use the identified molecular markers linked to traits of interest is of importance for speeding the selection process in shea tree with high oil content [59]. The use of significant SNP markers identified through GWAS analysis are important for performing MAS for shea tree breeding. In fact, the application of MAS in shea tree breeding is now made easy with the availability of genomic information on the species [8] coupled with sequencing transcriptome that now makes it possible to align them with the identified markers of interest [1,8]. The six identified markers (S1_30720144, S1_32402910, S1_60237300, S8_11121701, S8_41696703 and S8_43605016) in this study could be applied in MAS for enhanced oil content in V. paradoxa Subsp. niltica. The MAS can play a very important role in this kind of trait useful for early nursery selection of late expressing traits in the species, and therefore, by performing MAS at seedling stage (far earlier than the juvenile maturity) will greatly reduce the breeding circle.
In this current study, the application of MAS will enable the selection of S1_30720144, S1_32402910, S1_60237300, S8_11121701, S8_41696703 and S8_43605016 markers linked with high oil content genes in the shea nuts. Selection of genotypes with a combination of preferred traits accumulated in one accession would therefore augment the process of shea tree improvement. More value to the communities as an upstream selection would also require prioritizing the genotypes with significant SNPs but from sweet pulped ethnovariety to meet the community’s food and nutrition requirement [60,61]. The availability of markers linked to the identified genes will even make it possible to take the advantage of MAS in identifying heterozygous genotypes and therefore apply positive MAS selection for the alleles resulting in a very informative phenotypic traits selected for. On the other hand, MAS could also be applied in negative selection in order to introgress the target trait.

5. Conclusions

The study of marker trait association presents an important step towards identifying the genomic regions associated with the traits of interest to further marker-assisted breeding in shea tree. The current study identified 23 putative markers associated with oil accumulation in shea nut. Candidate genes located on chromosomes 1 and 8 were the most important genes in oil biosynthesis and accumulation in V. paradoxa. It is important to note in this study that the position of the seed traits related candidate genes were in agreement with the locations of the oil yield hotspots on chromosomes 1 and 8. This is in support of the need for application of MAS in shea tree and presents the first ever breakthrough in identification of chromosomes 1 and 8 hotspots in the improvement and breeding of shea tree in Uganda for increased oil yield. This study therefore presents the first ever genomic information on associated genes responsible for V. paradoxa Subspecies nilotica nut oil biosynthesis. The results therefore establish the foundation for explaining the molecular mechanisms of oil biosynthesis for V. paradoxa Subspecies nilotica. The markers and their linked genes provide a significant resource for improving oil content in the species. The study therefore sets pace for genomic assisted breeding in V. paradoxa Subsp. nilotica and also broadens our understanding in the role of genomic approaches in advancing yield component traits. The findings of this study will contribute to the initiation of shea breeding for increased oil yield in Uganda. This information could also be used for future gene pyramiding, increasing genetic gain, trait introgression, marker-assisted selection, and selection of parental lines for multiplication and generation of putative genotypes for shea tree breeding programs in Uganda. The study further presents gaps for future validation of the hot spot regions identified on chromosomes 1 and 8.

Supplementary Materials

The following supporting information can be downloaded at: https://www.mdpi.com/article/10.3390/horticulturae9070811/s1, Table S1: Passport data for the selected shea tree families used in this study, with details of their location, tree identification number, geographical coordinated and the details of the farmer on whose farm the tree is located. Table S2: Candidate genes at QTL region searched within approximately ± 20 Kb region of significant SNP markers. The identified genes is believed to be playing an important part in oil yield variation in shea tree.

Author Contributions

J.B.O. and S.G. conceived and designed the study. J.B.O., E.A.A., S.G. and T.L.O. wrote the original manuscript. J.B.O. and E.A.A. analysed the data. P.H., R.E., M.T.B. and A.D. helped to edit the manuscript. All authors have read and agreed to the published version of the manuscript.

Funding

The authors would like to extend their sincere thanks to the following institutions/organizations for funding this study: The World Agroforestry (CIFOR-ICRAF) provided funding under the Genebank Platform, for field data and sample collection under Grant/Award Number: GCDT-1213; Makerere Regional Centre for Crop Improvement (MaRCCI) provided the student research grant for genetic analysis under World Bank fund through ACE II, the Integrated Genotyping Support and Service (IGSS) offered waiver to laboratory analysis expenses and the Intra-Africa Academic Mobility Project for Training Scientists in Crop Improvement for Food Security in Africa (SCIFSA) offered fund type; TG1 PhD Credit Seeking mobility as part of Intra-Africa Academic Mobility Scheme of the European Union that facilitated data analysis, completion of article write up and online publication of this article.

Data Availability Statement

The data presented in this study are available on request from the corresponding author. The data are not publicly available because it will still be used in another ongoing study as part of the whole Ph.D. study.

Acknowledgments

The authors would wish to thank the management and administration of the Cocoa Research Institute of Ghana (CRIG) for their moral support and hosting the principal author of this paper during it write up and submission. The University of Ghana, West African Centre for Crop Improvement (WACCI) is here by also greatly acknowledged for coordination of the principal authors’ stay in Ghana to finalize this paper. Finally, great thanks go to the National Agricultural Research Organization (NARO), through the Director of Research (Hillary Agaba), National Forestry Resources Research Institute (NaFORRI) for the immense support rendered that made data collection, analysis and write up of this paper be a success.

Conflicts of Interest

The authors declare that the research was conducted in the absence of any commercial or financial relationships that could be construed as a potential conflict of interest.

References

  1. Wei, Y.; Ji, B.; Siewers, V.; Xu, D.; Halkier, B.A.; Nielsen, J. Identification of genes involved in shea butter biosynthesis from Vitellaria paradoxa fruits through transcriptomics and functional heterologous expression. Appl. Microbiol. Biotechnol. 2019, 103, 3727–3736. [Google Scholar] [CrossRef] [PubMed] [Green Version]
  2. Naughton, C.C.; Lovett, P.N.; Mihelcic, J. Land suitability modeling of shea (Vitellaria paradoxa) distribution across sub-Saharan Africa. Appl. Geogr. 2015, 58, 217–227. [Google Scholar] [CrossRef]
  3. Lovett, P.; Haq, N. Evidence for anthropic selection of the Sheanut tree (Vitellaria paradoxa). Agrofor. Syst. 2000, 48, 273–288. [Google Scholar] [CrossRef]
  4. Choungo Nguekeng, P.B.; Hendre, P.; Tchoundjeu, Z.; Kalousová, M.; TchanouTchapda, A.V.; Kyereh, D.; Masters, E.; Lojka, B. The Current State of Knowledge of Shea Butter Tree (Vitellaria paradoxa C.F. Gaertner.) for Nutritional Value and Tree Improvement in West and CentralAfrica. Forests 2021, 12, 1740. [Google Scholar] [CrossRef]
  5. Hemsley, J.H. Sapotaceae. In Flora of Tropical East Africa; Milne, E., Polhill, R.M., Eds.; Crown Agents for Overseas Governments and Administrations: London, UK, 1968; pp. 47–50. [Google Scholar]
  6. Issaka, A.; Konstantin, V.K.; Reiner, F. Morphological and genetic diversity of shea tree (Vitellaria paradoxa) in the savannah regions of Ghana. Genet. Resour. Crop Evol. 2017, 64, 1253–1268. [Google Scholar]
  7. Allal, F.; Piombo, G.; Kelly, B.A.; Okullo, J.B.L.; Thiam, M.; Diallo, O.B.; Nyarko, G.; Davrieux, F.; Lovett, P.N.; Bouvet, J.-M. Fatty acid and tocopherol patterns of variation within the natural range of the shea tree (Vitellaria paradoxa). Agrofor. Syst. 2013, 87, 1065–1082. [Google Scholar] [CrossRef]
  8. Hale, I.; Ma, X.; Melo, A.T.O.; Padi, F.K.; Hendre, P.S.; Kingan, S.B.; Sullivan, S.T.; Chen, S.; Boffa, J.-M.; Muchugi, A.; et al. Genomic Resources to Guide Improvement of the Shea Tree. Front. Plant Sci. 2021, 12, 720670. [Google Scholar] [CrossRef]
  9. Cardi, C.; Vaillant, A.; Sanou, H.; Bokary Kelly, A.; Bouvet, J.-M. Characterization of microsatellite markers in the shea tree (Vitellaria paradoxa C. F Gaertn) in Mali. Mol. Resour. 2005, 5, 524–526. [Google Scholar] [CrossRef]
  10. Odoi, J.B.; Odong, T.L.; Okia, C.A.; Edema, R.; Muchugi, A.; Gwali, S. Variation in phenotypic traits of high oil yielding and early maturing shea trees (Vitellaria paradoxa) selected using local knowledge. J. Agric. Nat. Resour. Sci. 2020, 7, 34–42. [Google Scholar]
  11. Global Market Insight. Market Research Report 2021; TechNavio | PRODUCT CODE: 1044351; Global Market Insight: Elmhurst, IL, USA, 2021. [Google Scholar]
  12. Abdul-Mumeen, I.; Beauty, D.; Adam, A. Shea butter extraction technologies: Current status and future perspective. Afr. J. Biochem. Res. 2019, 13, 9–22. [Google Scholar]
  13. Global Shea Alliance. Shea Production and Market; Global Shea Alliance: Accra, Ghana, 2021. [Google Scholar]
  14. Boffa, J.-M. Opportunities and Challenges in the Improvement of the Shea (Vitellaria paradoxa) Resource and Its Management; Occasional Paper 24; World Agroforestry Centre: Nairobi, Kenya, 2015. [Google Scholar]
  15. Aleza, K.; Villamor, G.B.; Nyarko, B.K.; Wala, K.; Akpagana, K. Shea (Vitellaria paradoxa Gaertn C. F.) fruit yield assessment and management by farm households in the Atacora district of Benin. PLoS ONE 2018, 13, e0190234. [Google Scholar] [CrossRef]
  16. Yao, S.D.M.; Diarrassouba, N.; Diallo, R.; Koffi, E.-B.Z.; Dago, D.N.; Fofana, I.J. Effects of Sowing Depth and Seed Orientation on the Germination and Seedling Growth in Shea Tree (Vitellaria paradoxa C.F. Gaertn.) for Rootstock Production in Nursery. Res. Plant Sci. 2021, 9, 13–22. [Google Scholar] [CrossRef]
  17. Chimsah, F.A. Shea Sapling Management and Grafting. In The Way forward to Shea Domestication A Case Research from the University for Development Studies; Tamale: Ghana, West Africa, 2012. [Google Scholar]
  18. Pilipović, A.; Orlović, S.; Kovačević, B.; Galović, V.; Stojnić, S. Selection and Breeding of Fast-Growing Trees for Multiple Purposes in Serbia. In Forests of Southeast Europe Under a Changing Climate; Advances in Global Change Research; Šijačić-Nikolić, M., Milovanović, J., Nonić, M., Eds.; Springer: Cham, Switzerland, 2019; Volume 65. [Google Scholar] [CrossRef]
  19. Kilian, A.; Wenzl, P.; Huttner, E.; Carling, J.; Xia, L.; Blois, H.; Caig, V.; Heller-Uszynska, K.; Jaccoud, D.; Hopper, C.; et al. Diversity Arrays Technology: A Generic Genome Profiling Technology on Open Platforms. In Data Production and Analysis in Population Genomics; Methods in Molecular Biology (Methods and Protocols); Pompanon, F., Bonin, A., Eds.; Humana Press: Totowa, NJ, USA, 2012; pp. 67–89. [Google Scholar]
  20. Zahid, G.; Aka Kaçar, Y.; Dönmez, D.; Küden, A.; Giordani, T. Perspectives and recent progress of genome-wide association studies (GWAS) in fruits. Mol. Biol. Rep. 2022, 49, 5341–5352. [Google Scholar] [CrossRef] [PubMed]
  21. AOAC. Association of Official Analytical Chemist, Official Methods of Analysis, 19th ed.; AOAC: Washington, DC, USA, 2012; 130p. [Google Scholar]
  22. Doyle, J.J.; Doyle, J.L. A rapid DNA isolation procedure for small quantities of fresh leaf tissue. Phytochem. Bull. 1987, 19, 1–15. [Google Scholar]
  23. Sansaloni, C.; Petroli, C.; Jaccoud, D.; Carling, J.; Detering, F.; Grattapaglia, D.; Kilian, A. Diversity Arrays Technology (DArT) and next-generation sequencing combined: Genome-wide, high throughput, highly informative genotyping for molecular breeding of Eucalyptus. BMC Proc. 2011, 5, P54. [Google Scholar] [CrossRef]
  24. Elshire, R.J.; Glaubitz, J.C.; Sun, Q.; Poland, J.A.; Kawamoto, K.; Buckler, E.S.; Mitchell, S.E. A Robust, Simple Genotyping-by-Sequencing (GBS) Approach for High Diversity Species. PLoS ONE 2011, 6, e19379. [Google Scholar] [CrossRef] [PubMed] [Green Version]
  25. Raman, H.; Raman, R.; Kilian, A.; Detering, F.; Carling, J.; Coombes, N.; Diffey, S.; Kadkol, G.; Edwards, D.; McCully, M.; et al. Genome-wide delineation of natural variation for pod shatter resistance in Brassica napus. PLoS ONE 2014, 9, e101673. [Google Scholar] [CrossRef] [PubMed] [Green Version]
  26. R Core Team. R: A Language and Environment for Statistical Computing; R Foundation for Statistical Computing: Vienna, Austria, 2020; Available online: https://www.R-project.org/ (accessed on 22 March 2022).
  27. Yu, J.; Pressoir, G.; Briggs, W.H.; Vroh Bi, I.; Yamasaki, M.; Doebley, J.F.; Buckler, E.S.A. Unified mixed-model method for association mapping that accounts for multiple levels of relatedness. Nat. Genet. 2006, 38, 203–208. [Google Scholar] [CrossRef]
  28. Rosyara, U.R.; De Jong, W.S.; Douches, D.S.; Endelman, J.B. Software for genome-wide association studies in autopolyploids and its application to potato. Plant Genome 2016, 9, 1–10. [Google Scholar] [CrossRef] [Green Version]
  29. Zhang, Y.W.; Lwaka Tamba, C.; Wen, Y.J.; Li, P.; Ren, W.L.; Ni, Y.L.; Gao, J.; Zhang, Y.M. mrMLM v4.0: An R platform for multi-locus genome-wide association studies. Genom. Proteom. Bioinform. 2020, 18, 481–487. [Google Scholar] [CrossRef]
  30. Benjamini, Y.; Hochberg, Y. Controlling the false discovery Rate: A practical and powerful approach to multiple testing. J. R. Stat. Soc. Ser. B (Methodol.) 1995, 57, 289–300. [Google Scholar] [CrossRef]
  31. Gatarira, C.; Agre, P.; Matsumoto, R.; Edemodu, A.; Adetimirin, V.; Bhattacharjee, R.; Asiedu, R.; Asfaw, A. Genome-Wide Association Analysis for Tuber Dry Matter and Oxidative Browning in Water Yam (Dioscorea alata L.). Plants 2020, 9, 969. [Google Scholar] [CrossRef] [PubMed]
  32. Verde, I.; Jenkins, J.; Dondini, L.; Micali, S.; Pagliarani, G.; Vendramin, E.; Paris, R.; Aramini, V.; Gazza, L.; Rossini, L.; et al. The peach v2.0 release: High-resolution linkage mapping and deep resequencing improve chromosome-scale assembly and contiguity. BMC Genom. 2017, 18, 225. [Google Scholar] [CrossRef] [PubMed] [Green Version]
  33. Odoi, J.B.; Adjei, E.A.; Hendre, P.; Nantongo, J.S.; Ozimati, A.A.; Badji, A.; Nakabonge, G.; Edema, R.; Gwali, S.; Odong, T.L. Genetic diversity and population structure among Ugandan shea tree (Vitellariaparadoxa subsp. nilotica) accessions based on DarTSeq markers. Crop Sci. 2023, 1–13. [Google Scholar] [CrossRef]
  34. Ma, W.; Kong, Q.; Mantyla, J.J.; Yang, Y.; Ohlrogge, J.B.; Benning, C. 14-3-3 protein mediates plant seed oil biosynthesis through interaction with AtWRI1. Plant J. 2016, 88, 228–235. [Google Scholar] [CrossRef] [PubMed] [Green Version]
  35. Yang, Y.; Kong, Q.; Lim, A.R.Q.; Lu, S.; Zhao, H.; Guo, L.; Yuan, L.; Ma, W. Transcriptional regulation of oil biosynthesis in seed plants: Current understanding, applications, and perspectives. Plant Commun. 2022, 3, 100328. [Google Scholar] [CrossRef]
  36. Gwali, S.; Nakabonge, G.; Okullo, J.B.L.; Eilu, G.; Forestier-Chironc, N.; Piombod, G.; Davrieux, F. Fat content and fatty acid profiles of shea tree (Vitellaria paradoxa subspecies nilotica) ethno-varieties in Uganda. For. Trees Livelihoods 2012, 21, 267–278. [Google Scholar] [CrossRef]
  37. Okullo, J.B.L.; Omujai, F.; Agea, J.G.; Vuzi, P.C.; Namutebi, A.; Okello, J.B.; Nyanzi, S.A. Physico-chemical characteristics of Shea butter (Vitellaria Paradoxa C. F. Gaertu) oil from the shea districts of Uganda. AJFAND Afr. J. Food Agric. Nutr. Dev. 2010, 10, 2070–2084. [Google Scholar]
  38. Mattia, M.R.; Du, D.; Yu, Q.; Kahn, T.; Roose, M.; Hiraoka, Y.; Wang, Y.; Munoz, P.; Gmitter, F.G., Jr. Genome-Wide Association Study of Healthful Flavonoids among Diverse Mandarin Accessions. Plants 2022, 11, 317. [Google Scholar] [CrossRef]
  39. Hall, D.; Tegstrom, C.; Ingvarsson, P.K. Using association mapping to dissect the genetic basis of complex traits in plants. Brief. Funct. Genom. Proteom. 2010, 9, 157–165. [Google Scholar] [CrossRef] [Green Version]
  40. Kumar, S.; Chagne, D.; Bink, M.C.A.M.; Volz, R.K.; Whitworth, C.; Carlisle, C. Genomic selection for fruit quality traits in apple (Malus 3 domestica Borkh.). PLoS ONE 2012, 7, e36674. [Google Scholar] [CrossRef] [Green Version]
  41. Gwali, S.; Vaillant, A.; Nakabonge, G.; Okullo, J.B.L.; Eilu, G.; Muchugi, A.; Jean-Marc Bouvet, J.-M. Genetic diversity in shea tree (Vitellaria paradoxa subspecies nilotica) ethno-varieties in Uganda assessed with microsatellite markers. For. Trees Livelihoods 2014, 24, 163–175. [Google Scholar] [CrossRef]
  42. Fontaine, C.; Lovett, P.N.; Sanou, H.; Maley, J.; Bouvet, J.-M. Genetic diversity of the shea tree (Vitellaria paradoxa C.F. Gaertn), detected by RAPD and chloroplast microsatellite markers. Heredity 2004, 93, 639–648. [Google Scholar] [CrossRef] [PubMed] [Green Version]
  43. Bates, P.D.; Stymne, S.; Ohlrogge, J. Biochemical pathways in seed oil synthesis. Curr. Opin. Plant Biol. 2013, 16, 358–364. [Google Scholar] [CrossRef] [Green Version]
  44. Xianghan, L.; Tianxiang, T.; Chao, S.; Libo, S.; Hui, Z.; Chuanli, Z.; Liping, L.; Liangbin, L. Several Key Enzymes in Oil Synthesis of the Brassica napus. J. Chin. Cereals Oils Assoc. 2017, 12, 100–104. [Google Scholar]
  45. Zhao, H.; Kosma, D.K.; Lü, S. Functional Role of Long-Chain Acyl-CoA Synthetases in Plant Development and Stress Responses. Front. Plant Sci. 2021, 12, 640996. [Google Scholar] [CrossRef]
  46. Jasinski, S.; Chardon, F.; Nesi, N.; Lécureuil, A.; Guerche, P. Improving seed oil and protein content in Brassicaceae: Some new genetic insights from Arabidopsis thaliana. OCL 2018, 25, D603. [Google Scholar] [CrossRef] [Green Version]
  47. Osorio-Guarín, J.A.; Garzón-Martínez, G.A.; Delgadillo-Duran, P.; Bastidas, S.; Moreno, L.P.; Enciso-Rodríguez, F.E.; Cornejo, O.E.; Barrero, L.S. Genome-wide association study (GWAS) for morphological and yield-related traits in an oil palm hybrid (Elaeis oleifera x Elaeis guineensis) population. BMC Plant Biol. 2019, 19, 533. [Google Scholar] [CrossRef] [Green Version]
  48. Raboanatahiry, N.; Wang, B.; Yu, L.; Li, M. Functional and Structural Diversity of Acyl-coA Binding Proteins in Oil Crops. Front. Genet. 2018, 9, 182. [Google Scholar] [CrossRef] [PubMed] [Green Version]
  49. Meng, J.-S.; Tang, Y.-H.; Sun, J.; Zhao, D.-Q.; Zhang, K.-L.; Tao, J. Identification of genes associated with the biosynthesis of unsaturated fatty acid and oil accumulation in herbaceous peony ‘Hangshao’ (Paeonia lactiflora ‘Hangshao’) seeds based on transcriptome analysis. BMC Genom. 2021, 22, 94. [Google Scholar] [CrossRef] [PubMed]
  50. Wu, G.-Z.; Xue, H.-W. Arabidopsis b-Ketoacyl-[Acyl Carrier Protein] Synthase I Is Crucial for Fatty Acid Synthesis and Plays a Role in Chloroplast Division and Embryo Development. Plant Cell 2010, 22, 3726–3744. [Google Scholar] [CrossRef] [PubMed] [Green Version]
  51. Janick, P.; Huleux, M.; Spaniol, B.; Sommer, F.; Neunzig, J.; Schroda, M.; Li-Beisson, Y.; Philippar, K. Fatty acid export (FAX) proteins contribute to oil production in the green microalga Chlamydomonas reinhardtii. Front. Mol. Biosci. 2022, 9, 939834. [Google Scholar] [CrossRef]
  52. Martins-Noguerol, R.; DeAndres-Gil, C.; Garces, R.; Salas, J.J.; Martínez-Force, E.; Moreno-Perez, A.J. Characterization of the acyl-ACP thioesterases from Koelreuteria paniculata reveals a new type of FatB thioesterase. Heliyon 2020, 6, e05237. [Google Scholar] [CrossRef] [PubMed]
  53. Hajiahmadi, Z.; Abedi, A.; Wei, H.; Sun, W.; Ruan, H.; Zhuge, Q.; Movahedi, A. Identification, evolution, expression, and docking studies of fatty acid desaturase genes in wheat (Triticum aestivum L.). BMC Genom. 2020, 21, 778. [Google Scholar] [CrossRef] [PubMed]
  54. Botha, F.; Dennis, D. Phosphoglyceromutase activity and concentration in the endosperm of developing and germinating Ricinus communis seeds. Biol. Chem. 1987. [Google Scholar] [CrossRef]
  55. Golub, E.E.; Boesze-Battaglia, K. The role of alkaline phosphatase in mineralization. Curr. Opin. Orthop. 2007, 18, 444–448. [Google Scholar] [CrossRef]
  56. Minamikawa, M.F.; Nonaka, K.; Kaminuma, E.; Kajiya-Kanegae, H.; Onogi, A.; Goto, S.; Yoshioka, T.; Imai, A.; Hamada, H.; Hayashi, T.; et al. Genome-wide association study and genomic prediction in citrus: Potential of genomics-assisted breeding for fruit quality traits. Sci. Rep. 2017, 7, 4721. [Google Scholar] [CrossRef]
  57. Kim, S.; Plagnol, V.; Hu, T.T.; Toomajian, C.; Clark, R.M.; Ossowski, S.; Ecker, J.R.; Weigel, D.; Nordborg, M. Recombination and linkage disequilibrium in Arabidopsis thaliana. Nat. Genet. 2007, 39, 1151–1155. [Google Scholar] [CrossRef]
  58. Thomson, M.J.; Ismail, A.M.; McCouch, S.R.; Mackill, D.J. Abiotic Stress Adaptation in Plants; Pareek, A., Sopory, S.K., Bohnert, H.J., Eds.; Springer: Dordrecht, The Netherlands, 2009; pp. 451–469. [Google Scholar]
  59. Tartarini, S.; Sansavini, S. Advances in the use of molecular markers in Pome fruit breeding. In Proceedings of the XXVIth International Horticultural Conference and Exhibition, Toronto, ON, Canada, 11–17 August 2002; p. 622. [Google Scholar]
  60. Odoi, J.B.; Muchugi, A.; Okia, C.A.; Gwali, S.; Odong, T.L. Local knowledge, identification and selection of shea tree (Vitellaria paradoxa) ethnovarieties for pre-breeding in Uganda. J. Agric. Nat. Resour. Sci. 2020, 7, 22–33. [Google Scholar]
  61. Agúndez, D.; Nouhoheflin, T.; Coulibaly, O.; Soliño, M.; Alía, R. Local Preferences for Shea Nut and Butter Production in Northern Benin: Preliminary Results. Forests 2020, 11, 13. [Google Scholar] [CrossRef] [Green Version]
Figure 1. Correlation among four traits (Length = Kernel length, Width = Kernel width and Weight = Kernel Weight and Oil = Kernel oil content) of the 374 Shea tree lines. Colour in the boxes indicate proportion of correlations. * p < 0.05; ** p < 0.01; *** p < 0.001.
Horticulturae 09 00811 g001
Figure 2. The number and size of SNPs within 1 Mb window size of V. paradoxa Subsp. nilotica genome.
Horticulturae 09 00811 g002
Figure 3. Genome-wide association of Kernel dry matter oil content in a panel of 374 Vitellaria paradoxa genotypes with 7530 SNP markers for kernel length (A); kernel width (B); kernel weight (C), and kernel dry matter oil content (D). The y-axis representing the p-value of the marker-trait association on a −log10 scale and the x-axis relates to the 12 shea tree chromosomes. The dots above the horizontal 5% Bonferroni threshold light dotted line indicates SNPs associated with QTL that condition the kernel traits.
Horticulturae 09 00811 g003
Table 1. Summary statistics for the studied traits.
TraitsMean ± (SD a)MinimumMaximum
Kernel dry matter oil content (% b)53.53 ± 2.2839.0569.77
Kernel length (cm c)3.19 ± 0.341.908.43
Kernel width (cm)3.61 ± 0.432.234.97
Kernel weight (mg d)10.30 ± 0.302.0018.8
a Standard Deviation; b Percentage; c Centimetre; d Milligram.
Table 2. Summary analysis of variance for the studied traits.
Source of VariationDf aKOC bKL cKW dKWt e
Replications24.810.013070.02490.08108
Environment41840.82 ***0.694 ***0.82403 ***0.90574 ***
Genotypes37360.42 ***1.45026 ***2.54701 ***0.9112 ***
Genotype x Environment149235.9 **0.0152420.690.01666
Residuals37388.610.01590.015530.02156
a Degrees of freedom; b Kernel dry matter oil content (%); c kernel length (cm); d kernel width (cm); e Kernel weight (mg) and levels of significance ‘***’ 0.001 ‘**’ 0.01 ‘*’ 0.05.
Table 3. Number of SNPs for each chromosome before and after filtration and the average polymorphism information content for V. paradoxa subsp. nilotica.
ChromosomesAll SNPs aFiltered SNPsChr b Size (Mbs)PIC cGene Div d
12893805820.2620.32
2345096074.50.2600.32
3154543038.60.2610.32
41527425370.2580.31
5233665056.50.2610.32
62210615580.2590.31
7208858157.30.2620.32
82318645480.2600.32
9212459156.50.2620.32
102803780500.2650.32
11179149847.10.2650.32
12197855046.90.2690.33
Total/Mean27,0637530652.40.2600.32
a Single Nucluotide Polymorphism; b Chromosome; c Polymorphic information content and d gene diversity.
Table 4. List of significant markers in a panel of 374 Vitellaria paradoxa genotypes indicating the genomic regions associated with studied traits.
TraitaMarkerChr bPosition (bp)AllelesQTN EffectLOD Score−log10 cr2 dMAF e
Oil content S1_60237300160237300AA0.833.394.116.610.12
S3_14843482314843482AA−1.065.676.4911.800.14
S4_32032310432032310AA0.743.073.776.760.19
4.03S5_627514556275145AA0.683.213.925.110.15
S8_41696703841696703TT−1.065.936.7613.310.17
S9_32689981932689981CC−1.225.386.1911.520.09
S11_431260441143126044CC0.814.285.058.180.31
kernel length S3_11153087311153087TT−0.133.444.168.190.12
S5_15524578515524578AA0.103.374.096.510.32
S6_46530240646530240TT−0.254.715.4914.550.05
0.095S8_11121701811121701GG−0.143.163.879.080.10
S11_8320549118320549CC−0.133.744.487.280.10
S12_328535471232853547CC−0.183.964.719.310.06
kernel width S1_32402910132402910CC−0.194.425.209.750.12
0.169S2_47786838247786838CC0.164.995.799.010.26
S2_64059706264059706AA0.174.735.528.280.13
S7_302529873025298CC0.153.223.925.290.10
S9_43700743943700743AA−0.183.304.017.770.11
S10_506044521050604452GG0.193.814.558.690.10
S12_328535471232853547CC0.297.027.8913.140.06
S12_7613999127613999TT0.123.444.174.470.20
kernel weight S1_30720144130720144CC−0.083.063.769.200.22
0.061S8_43605016843605016CC−0.113.294.0015.700.18
a Phenotypic variance b Chromosome, c the negative logarithms (−log10) of the p-values d squared correlation coefficient e minimum allele frequency.
Table 5. Gene annotation for the significant SNPs for shea seed related traits.
TraitsMarkerChr aPos bGene IDGO. cFunction
Kernel lengthS3_11153087311153087Vitpa03g07900IPR006968UVB-sensing and in early seedling morphogenesis and development
S5_15524578515524578Vitpa05g09840GO:0005515ion transportation and signal transduction
S6_46530240646530240Vitpa06g28930PTHR23155Disease resistance (R)
S8_11121701811121701Vitpa08g10570GO:0004017Predicts residues in protein biosythesis
S11_8320549118320549Vitpa11g07160PTHR33052Protein translocation
S12_328535471232853547Vitpa12g19540GO:0003824Protein metabolism and gluconeogenesis
Kernel widthS1_32402910132402910Vitpa01g21080GO:0005515Consensus disorder prediction
S2_47786838247786838Vitpa02g27300GO:0043190Glutathione synthetase ATP-binding
S2_64059706264059706Vitpa02g39460 Zinc finger
S7_302529873025298Vitpa07g02460GO:0005515Calcium signaling
S9_43700743943700743Vitpa09g19440PTHR14859Protein binding
S10_506044521050604452Vitpa10g25960GO:0003677Chromosome cohesion
S12_328535471232853547Vitpa12g19540GO:0003824Protein metabolism and gluconeogenesis
S12_7613999127613999Vitpa12g07520GO:0055114Catalyze the oxidation of alcohols to aldehydes and ketones
Kernel weightS1_30720144130720144Vitpa01g20620GO:0003676Hydrolyze ATP
S8_43605016843605016Vitpa08g25310GO:0004672Predict protein residues as disordered
a Chromosome, b Marker chromosome position and c Gene ontology.
Table 6. Gene annotation for the significant SNPs for oil content traits.
TraitsMarkerChr aPos bGene ID cGO. dFunction
Oil contentS1_60237300162536299Vitpa01g27780
(Acyl-ACP Thioesterase Fat B (FATB))
GO:0004553Consensus disorder prediction
S3_14843482314843482Vitpa03g10720
(Acyl-CoA-binding protein
(ACBP))
GO:0005515Protein binding
S4_32032310432032310Vitpa04g14070
Long Chain Acyl-CoA Synthetase (LACS))
G3DSAOxidoreductase activity
S5_627514556275145Vitpa05g04280
(Acyl-CoA-binding protein
(ACBP))
GO:0000160Transcriptional regulation of oil biosynthesis in seed plants
S8_41696703841696703Vitpa08g23790
(Fatty acid exporter
(FAX2))
GO:0008168methyltransferase activity
S9_32689981932689981Vitpa09g14250
(3-ketoacyl-ACP synthase II (KASII))
GO:0004672Early noduling
S11_431260441143126044Vitpa11g24760 (Fatty acid desaturases (FADs)) abiotic stress reduction
a Chromosome, b Chromosome position, c Gene identification and d Gene Ontology.
Table 7. Distribution of LD marker pairs according to chromosomes.
ChromosomeChr1Chr2Chr3Chr4Chr5Chr6Chr7Chr8Chr9Chr10Chr11Chr12
# marker pairs39,46146,76422,99021,69834,48230,83428,18732,78630,23235,78424,73627,091
“#” in Table 7 represents the word “number”.
Disclaimer/Publisher’s Note: The statements, opinions and data contained in all publications are solely those of the individual author(s) and contributor(s) and not of MDPI and/or the editor(s). MDPI and/or the editor(s) disclaim responsibility for any injury to people or property resulting from any ideas, methods, instructions or products referred to in the content.

