Article

Selection of a Proper Maturity Index for the Mechanical Harvesting of ‘Mihong’ Peach Fruit

by
L. Sugandhi Hirushika Jayasooriya
1,†,
Mi Hee Shin
2,†,
W. M. Upeksha Darshani Wijethunga
1,
Seul Ki Lee
3,
Jung Gun Cho
3,
Si Hyeong Jang
3 and
Jin Gook Kim
1,2,*
1
Division of Applied Life Science, Graduate School of Gyeongsang National University, Jinju 52828, Republic of Korea
2
Institute of Agriculture and Life Sciences, Gyeongsang National University, Jinju 52828, Republic of Korea
3
Fruit Research Division, National Institute of Horticultural and Herbal Science, Wanju 55365, Republic of Korea
*
Author to whom correspondence should be addressed.
These authors contributed equally to this work.
Horticulturae 2023, 9(7), 730; https://doi.org/10.3390/horticulturae9070730
Submission received: 12 May 2023 / Revised: 19 June 2023 / Accepted: 19 June 2023 / Published: 21 June 2023
(This article belongs to the Section Fruit Production Systems)

Abstract

:
Peaches are one of the most popular fruits around the globe. Selecting the optimum harvesting maturity for peaches is crucial in assuring high-quality fruits. This study is a model for determining the ideal harvest time for a robot harvester. Our study was carried out over two years on ‘Mihong’ peaches during days after full bloom (DAFB) 71 to 90 in 2021 and DAFB 64 to 84 in 2022 to select the optimal maturity index through a quality survey. The fruit size, soluble solids content (SSC), titratable acidity (TA), firmness, peel color (L*, a*, b*, chroma, and hue), and ethylene production were investigated. Fruit size showed the regular double sigmoid curve, and SSC increased while firmness and TA decreased with time. The samples left in storage conditions in 2022 showed a massive change in SSC and firmness after DAFB 74, implying the optimum harvesting stage. Interestingly, color values manifest the same consequence with a*, b*, and hue by reaching a plateau with apex side color values after DAFB 74, indicating the desired maturity. Overall, the results show that color values are an outstanding non-destructive alternative to typical destructive measurements for determining the exact time to harvest ‘Mihong’ peaches.

1. Introduction

Peaches (Prunus persica L.) are one of the most economically important, healthy, and delicious summer fruits. They are the world’s third most economically important temperate tree fruit, after apples and pears, and more than 90% of their production is for the fresh market [1]. According to the FAOSTAT corporate statistical database, 1.49 million ha of land was used to produce 24.57 million Mt of peaches and nectarines in 2020, with 189,058 Mt going to the Republic of Korea [1].
Ideal harvesting maturity has become a key factor in peach fruit production to better satisfy consumer preference in the marketplace as it determines the fruit quality and storage time [2]. Peach fruit maturity has a great influence on flavor components, ripening potential, physiological deterioration issues, resistance to moisture loss, susceptibility to mechanical damage, and invasion by pathogens [3]. Peaches harvested too early (immature) cannot reach market quality standards since they typically soften slowly and never reach the desired melting texture and taste. They usually have lower soluble solids content (SSC) and higher acids. As this is a climacteric fruit, if over-matured fruits are harvested, their post-harvest life may be shortened due to rapid softening as they are already approaching the senescence stage at harvest [3,4,5]. Thus, determining the optimum maturity stage for harvesting peaches is critical for obtaining acceptable quality for consumers [6]. Consequently, several maturity indices such as size and shape, SSC, firmness, skin and flesh color, TA, ethylene production, and respiration rate are used to determine whether a particular fruit has reached its optimal maturity stage [2,3,5].
The simplest and most basic measurements are the visual appearance of a particular fruit, such as size and shape. Since fruit size may vary depending on crop load, climacteric conditions, genetic factors, and other cultural practices [3,4,7], these indices cannot be used alone to measure the optimum maturity stage. The ripening of peach fruit involves many biochemical and physiological processes, such as the degradation of chlorophyll and starch, the biosynthesis of pigments and volatile compounds, the accumulation of sugars and organic acids as well as the modifications of the structure and composition of cell wall polysaccharides [8]. Accordingly, SSC elevations with maturity and ripening have also become a commonly used quality parameter for determining the maturity stage of fruit. However, the sugar content and SSC of peaches might be influenced by the position of the fruit in the canopy, crop load, pruning practices, and yearly climate [9]. Stone fruits also lose acidity during maturity, which is affected by cultivar and seasonal variability. The ratio of SSC:TA has been found to be more closely related to quality than acid content or SSC alone [3].
Fruit firmness decreases with maturation. Fruit softening is a developmental process that can create modifications in the structure of cell walls, particularly by the degradation of cell wall polymers. The mechanical strength and the texture of cell walls change dramatically during the fruit softening process. In addition, ripe fruit contains a large number of hydrolases that are involved in the degradation of cell wall polymers [10]. Thus, firmness is also used as a key factor to determine maturity in most fruits.
Fruit color is determined by various pigments present in skin and flesh tissues [3]. Anthocyanin is the principal color compound in many red, purple, and blue fruits, including apples, red pears, strawberries, grapes, blueberries, and peaches, and plays an essential role in determining consumer acceptance [11]. Measuring the color value a*, which is closely related to the anthocyanin content of a particular fruit, is more convenient than measuring the actual anthocyanin content using destructive methods. In addition, fruit color values L*, b*, hue, and chroma are also commonly used for determining the maturity stage of the fruit.
In the worldwide horticulture sector, many fruit growers are moving towards automating orchard management using artificial intelligence and robotics due to labor shortages. Labor is also becoming more expensive, contributing to the reduced profitability of fruit growing. Using robots and artificial intelligence can ensure a standardized cost for a steady flow of orchard data to assist orchard management decisions and the consistently high-quality production of fruits [12]. Particularly in machine harvesting, it is important to select the optimal maturity stage; otherwise, it may lead to a vast loss of fruit during the handling process since they become more delicate with ripening.
This research focuses on selecting an appropriate maturity index for ‘Mihong’ peaches in order to incorporate into a robot harvester via a developed algorithm program. Here, we analyze a series of quality parameters to determine the most suitable index among them to harvest the peaches, providing the best consumer acceptance and longest storage length with minimal handling damage.

2. Materials and Methods

2.1. Sample Preparation

The ‘Mihong’ peaches used for this experiment were harvested from an orchard (N 35°08′15.954′′, E 128°11′16.1304′′) located in Munsan-Myeon, Jinju-si, Republic of Korea, in 2021 and 2022 throughout the month of June, starting from the 10th to the 30th, during the peach growing season. Harvesting dates were selected essentially based on the maturity, considering the color on the apex side and other common parameters such as the fruit size.
In 2021, a total of 216 fruits (36 fruits each day) were harvested from four ‘Mihong’ trees over six consecutive days (10, 15, 17, 22, 24, and 29 June) with differing maturity stages and number of days after full bloom (DAFB 71, DAFB 76, DAFB 78, DAFB 83, DAFB 85 and DAFB 90). In 2022, a total of 140 fruits (20 fruits each day; there were variations in fruiting capacity because of the weather and environmental factors; therefore, the sample size had to be lowered) were harvested from four ‘Mihong’ trees over seven consecutive days (10, 13, 16, 20, 23, 27, and 30 June) considering the DAFB (DAFB 64, DAFB 67, DAFB 70, DAFB 74, DAFB 77, DAFB 81 and DAFB 84). Figure 1 shows the different maturity stages in both years. In 2022, there was a seven-day delay in the full bloom because of the weather and environmental conditions.
These harvested peaches were transferred in less than an hour to the Laboratory of Fruit Science at Gyeongsang National University in Jinju, Korea, and several quality parameters were measured.

2.2. Measurement of Physicochemical Properties

2.2.1. Fruit Size

For each fruit, its weight was measured using a digital scale (Electric indicator scale-Bas 610, Chiba, Japan), and its length and width were measured using a digital Vernier caliper (Mitutoyo Digimatic Caliper CD-15APX, Kawasaki, Japan).

2.2.2. Color Measurements

Color measurements of peach fruits were taken using a portable colorimeter (Chroma meter CR-400—KONICA MINOLTA, INC., Osaka, Japan). After the completion of white calibration, the L*, a*, and b* values on different sides of each sample were measured. In the 2021 samples, only the right and left sides of the fruit were measured. The apex side color values were added as an additional measurement for the 2022 samples. Figure 2 shows the selection criteria for different sides of the fruit.
Thereafter, chroma (C) and hue (h°) values were calculated using Equations (1) and (2):
C = (a*2 + b*2)1/2
h° = tan−1 1 (b*/a*)

2.2.3. Firmness

Peach fruit firmness was measured using a rheometer (CR-100, Sun Scientific Inc., Tokyo, Japan) fitted with an 8 mm round flat probe that compressed the fruit to a depth of 3 mm at a loading rate of 2 mm∙s−1 [13]. The maximum force generated during the penetration was expressed as the firmness in newtons (N). In the 2022 samples, further measurements were taken after two days of storage at room temperature (RT) (DAFB 74+2, DAFB 77+2, and DAFB 81+2) to analyze the effect considering distribution time to the local market.

2.2.4. Soluble Solids Content

The soluble solids content (SSC) for all peach fruits was measured using a hand refractometer (Pocket Refractometer, PAL-1, Atago Co., Ltd., Tokyo, Japan). Peeled peach flesh was wrapped in a four-layer cheesecloth, squeezed using a manual stainless-steel squeezer, and the absorbance was read using the refractometer calibrated in °Brix, expressed as a percentage at RT. The refractometer used had a refractive index accuracy of ±0.2, and the °Brix (%) range was 0 to 53% with a 0.1% Brix resolution at RT. SSC measurements were also taken two days after storage in selected DAFB in the 2022 samples (DAFB 74+2, DAFB 77+2, and DAFB 81+2).

2.2.5. Titratable Acidity

The titratable acidity (TA) of the fruit was measured using a pH meter (BP3001, Trans Instruments, Jalan Kilang Barat, Singapore). Titration was accomplished using 1 mL of fruit juice (the liquid was obtained as the same way as SSC, and 1 mL was extracted using a 1000 µL pipet) diluted into 80 mL of distilled water. Then, NaOH (0.1 mol∙L−1) was added at a rate of 1 mL∙min−1 to reach to an end point of pH of 8.3 [14].

2.3. Determination of Ethylene Production

The ethylene evolution of the peaches was only measured in the 2022 samples. As soon as they were transferred to the laboratory, the samples were kept in sealed 2.1 L air-tight containers for 2 h, and 1 mL of headspace gas was evaluated for ethylene. Ethylene production was measured by using a gas chromatograph with a Porapak Q column and TCD detector (GC-8A, Shimadzu Co., Ltd., Kyoto, Japan) and expressed in µL·kg−1·hr−1.

2.4. Statistical Analysis

All data were statistically analyzed by JMP Pro (Version 16.1, SAS Institute Inc., Cary, NC, USA) using ANOVA, and a mean comparison was performed according to Tukey’s test (p < 0.05). All values are denoted as mean ±SE (Standard Error).

3. Results and Discussion

3.1. Changes in Fruit Size Measurements in ‘Mihong’ Peaches

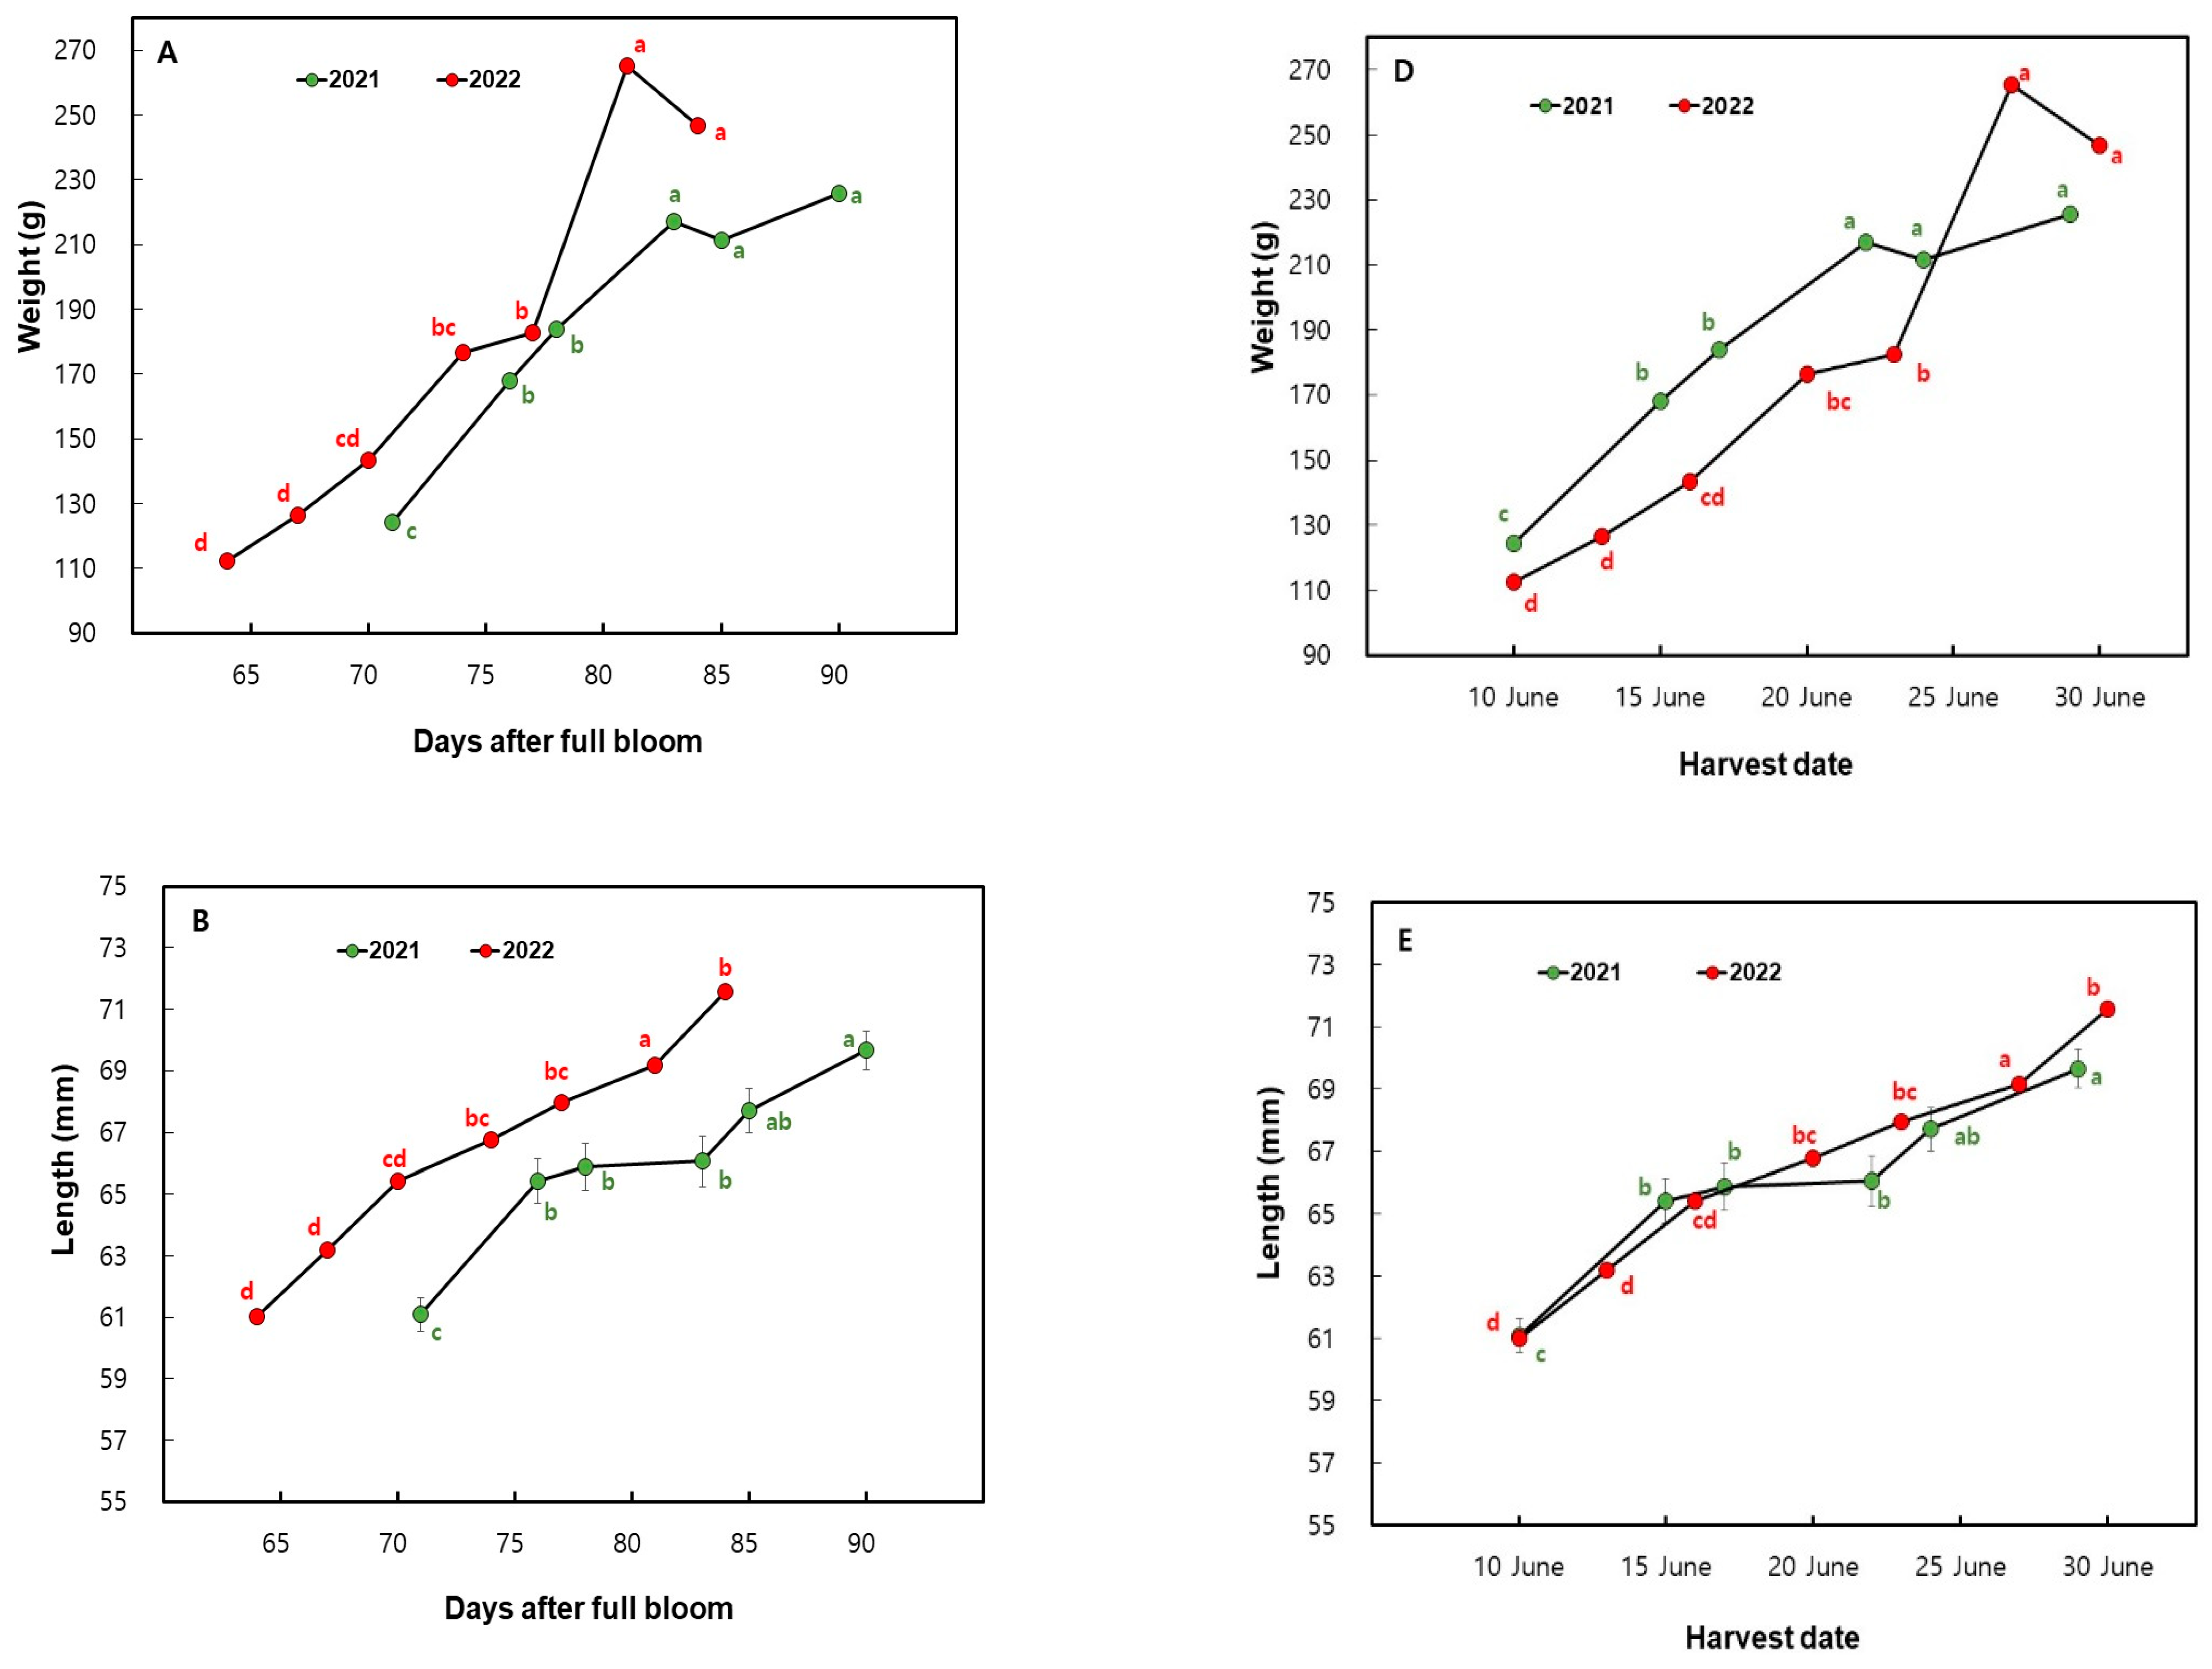
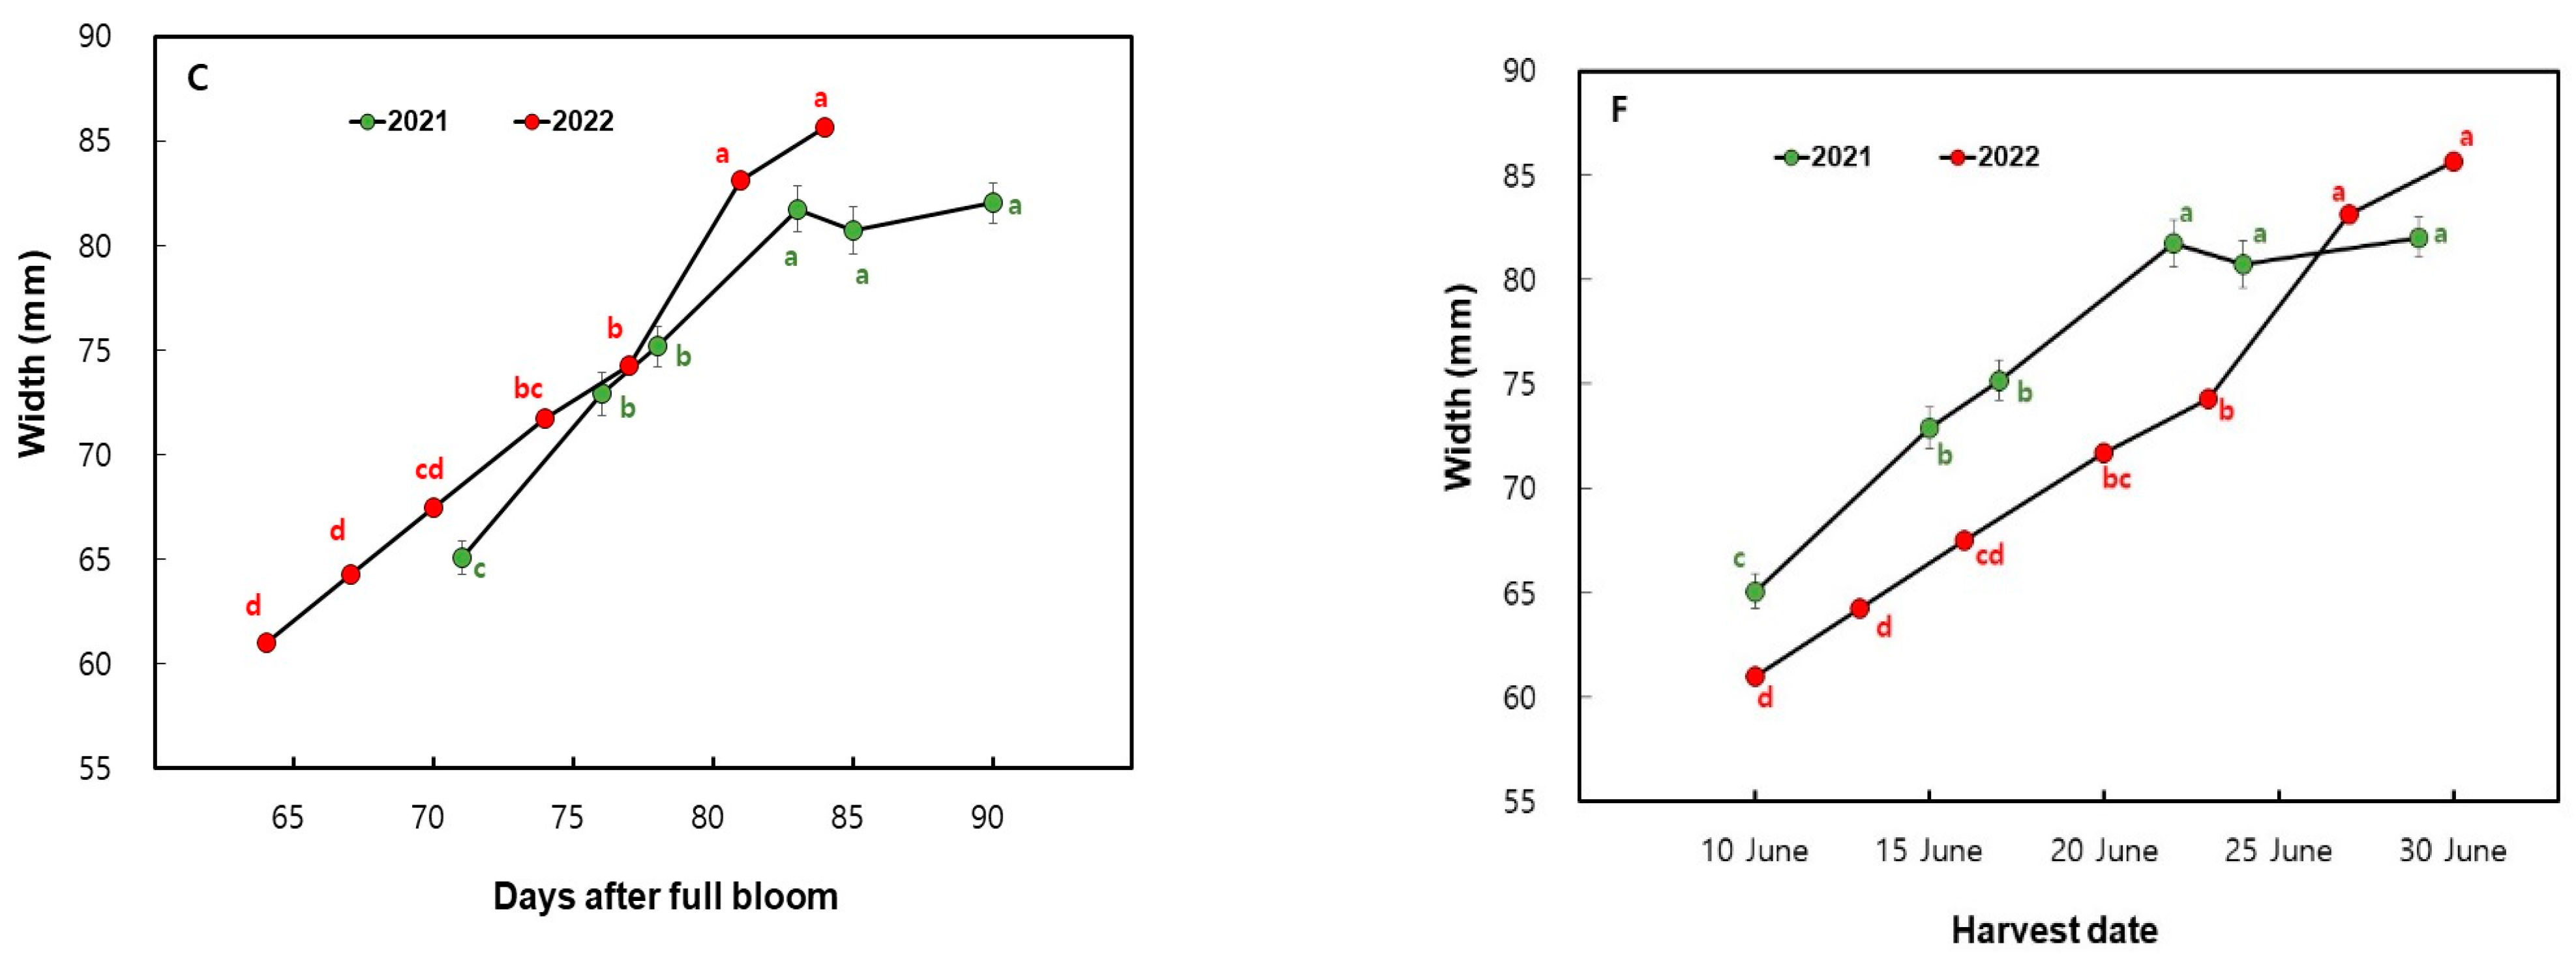
The weights of the fruits used in this study varied between 110 g and 250 g during the fruit developmental period. The weights gradually increased with the DAFB and the harvest date, and by the end of the experiment, the fruit weight reached a constant stage after passing DAFB 78 (17 June) in 2021 and DAFB 81 (27 June) in 2022 (Figure 3A,D).
As depicted in Figure 3B,E and Figure 3C,F, respectively, the length and width of peach fruit dramatically increased with time. However, the increment rate decreased from the beginning to the end.
Usually, peach fruit development follows a double sigmoid curve in which four phases can be defined [15], with growth occurring only during three of the stages, with one interval stage for stone formation [16]. The typical features at the first stage are rapid growth (exponential) and a high rate of cell division and elongation. During the second phase, the endocarp becomes hardened to form the stone [17]. There is a much smaller net increase in fruit size at this stage [18]. In the next step, the exponential growth of the pericarp occurs again due to an increase in cell division. In the last stage, the fruit reaches its final size, and ripening begins [19]. Our results also showed typical variation with the harvest time, especially in the length variation curve.

3.2. Changes in the Fruit SSC, Firmness, and TA in ‘Mihong’ Peaches

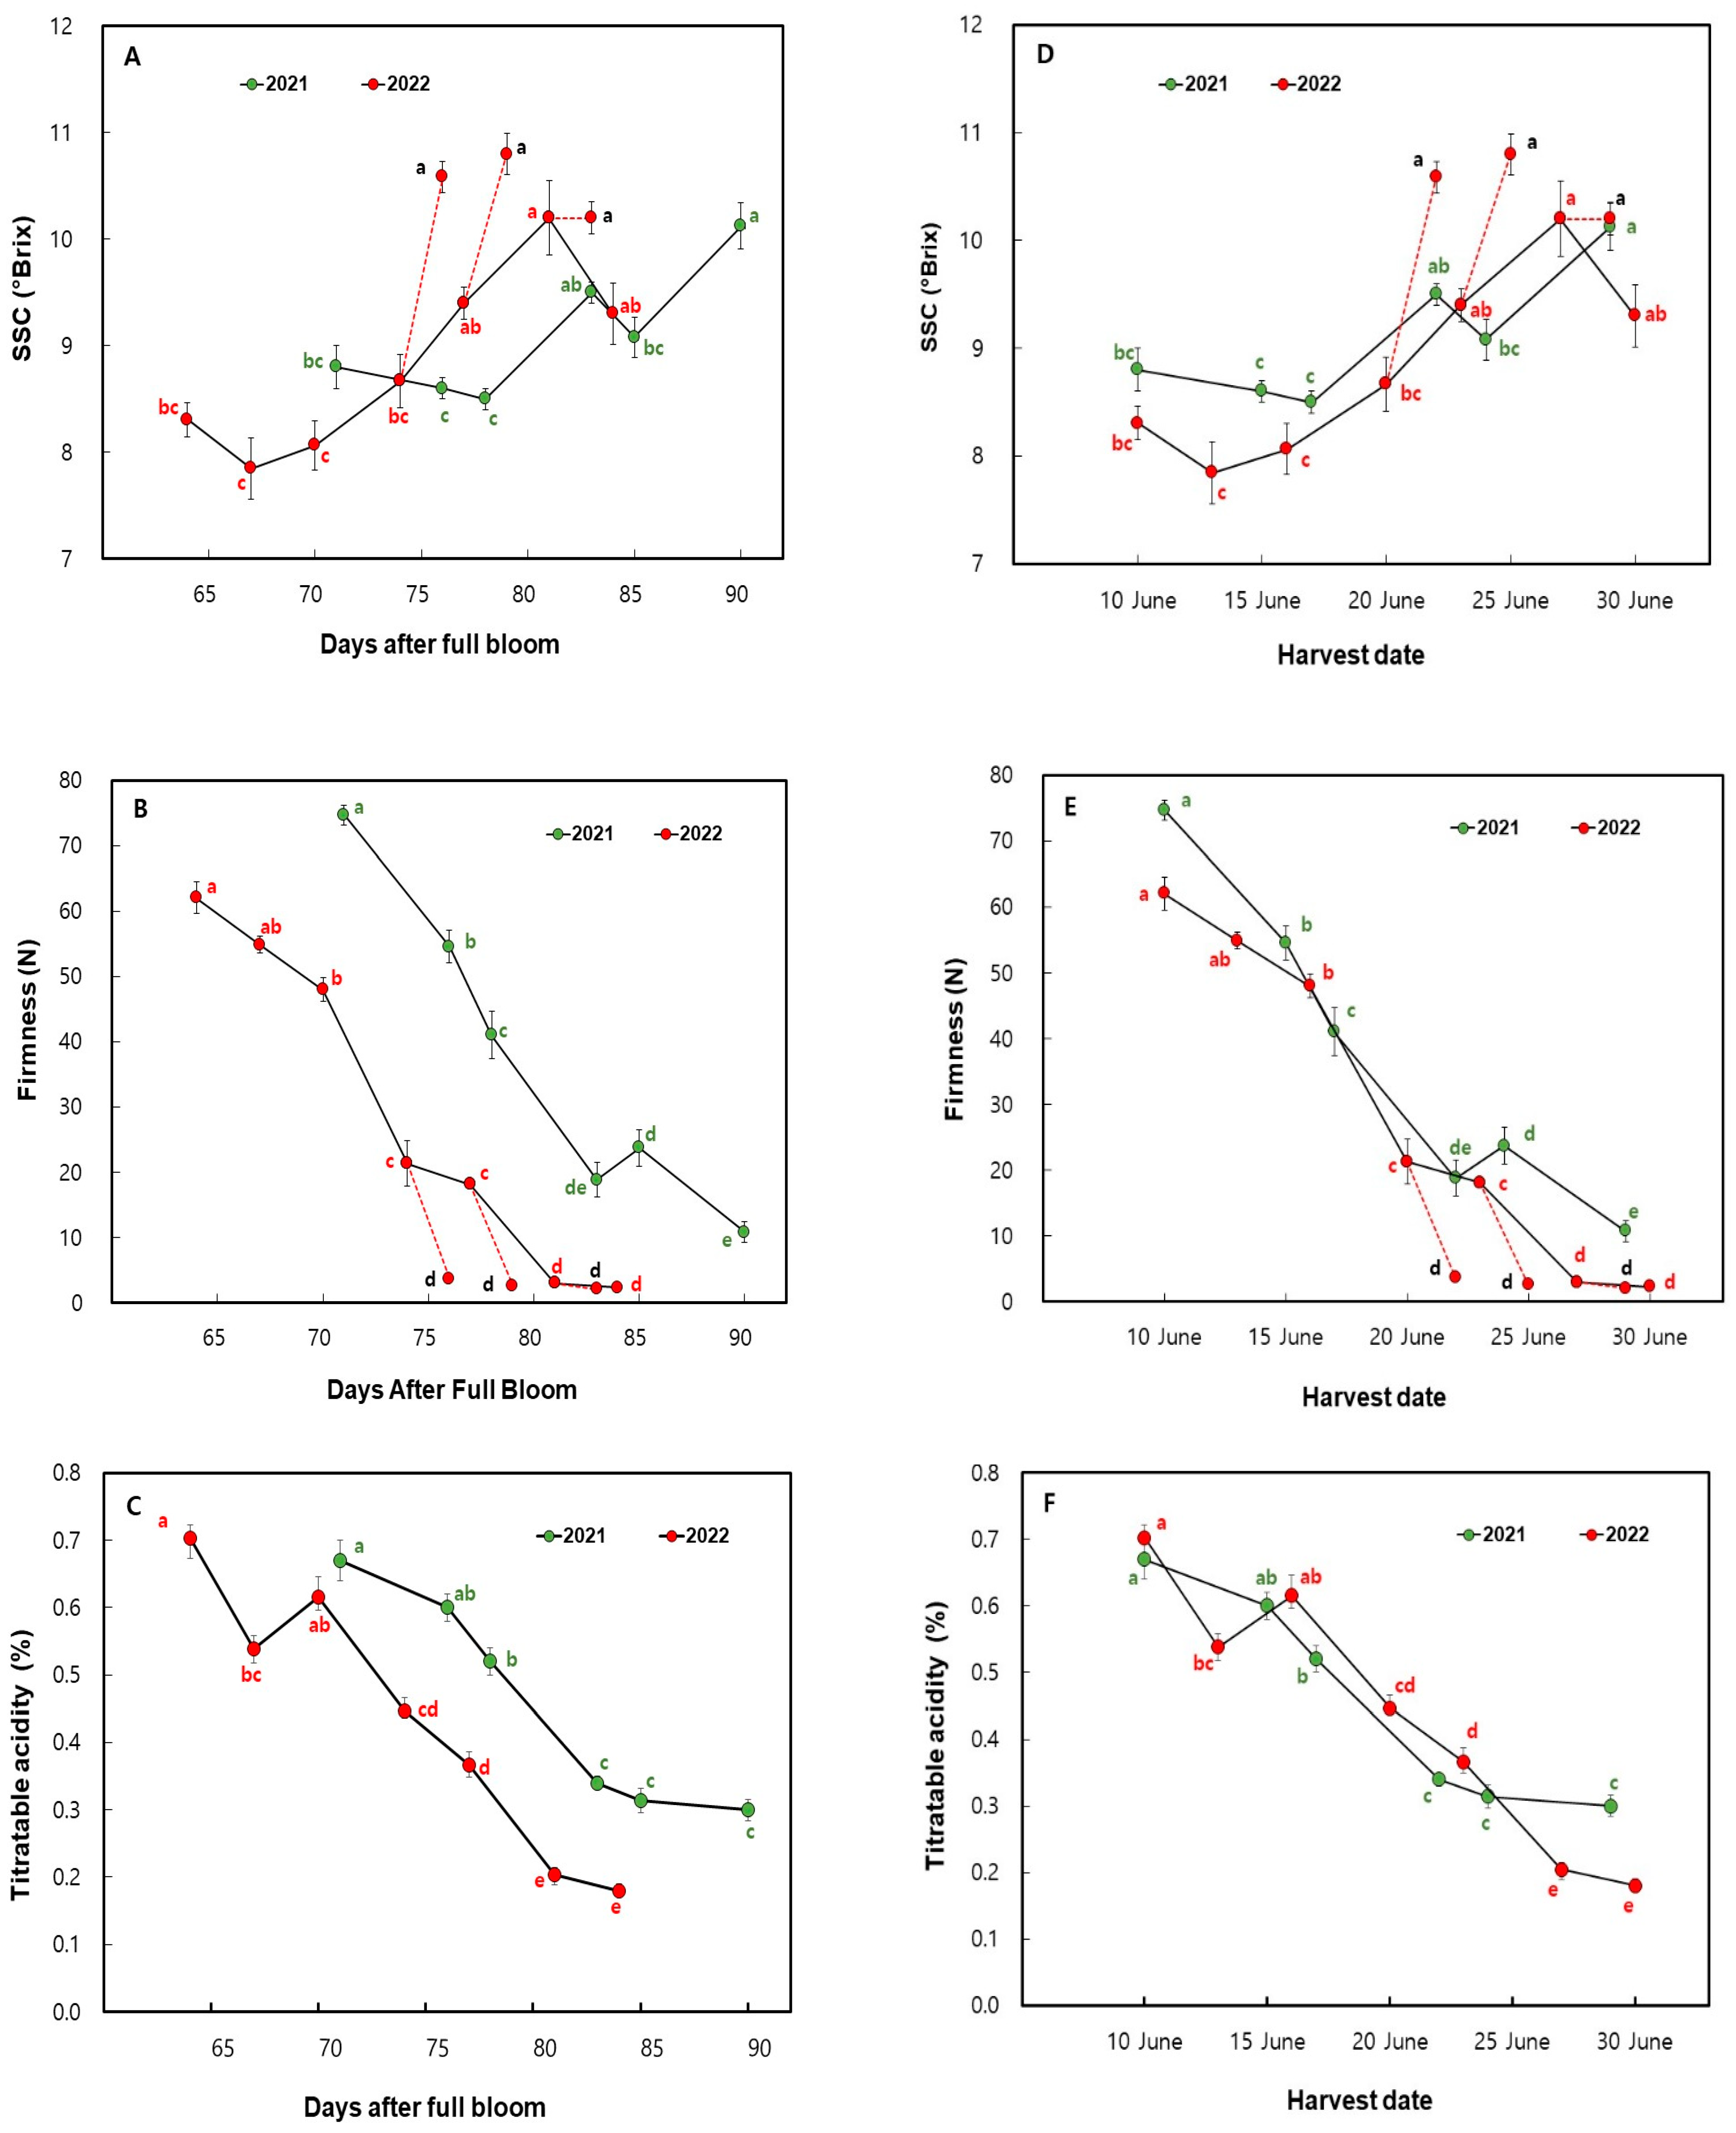
SSC values have increased, whereas the firmness and TA values decreased over harvesting time.
As shown in Figure 4A,D, in the 2022 samples, SSC and firmness were also measured after two days in storage after harvesting for DAFB 74+2, DAFB 77+2, and DAFB 81+2 (22, 25, 29 June). In these samples, SSC measurements showed a greater increase compared to the harvest day except for DAFB 81+2 (29 June). Here, only three stages were selected for the storage condition due to the fact that, based on the visual measures, they are in the best range to be harvested. Anyway, on the final day of storage (DAFB 81+2; 29 June), the SSC value remained the same as the harvesting date showing the over-maturation.
Sweetness is the most important factor, influencing consumer acceptance of peach fruit, with sucrose, glucose, and fructose being their main sugars [20]. Peaches with high eating quality are considered to have high fructose content and lower glucose and sorbitol content. Sugars make up more than 60% of the SSC in peach fruits [9]. The sugar levels in different peach cultivars are significantly influenced by fruit ripening and storage periods. Usually, early-maturing peach cultivars show a higher SSC content than late-maturity cultivars, as supported by the findings by Khan et al. [21]. In their study, the ‘Florida Gold’ peach cultivar showed the maximum total sugars followed by ‘Peach Selecl. No. 3′ (PS-3)’ and ‘Florida King’, while late-maturing cultivars exhibited the least SSC content. However, peaches and nectarines with an 11 °Brix or higher SSC are widely accepted by consumers [22]. This value may be dependent on the cultivar, and according to some of the literature, in yellow peaches, the SSC value at commercial harvest showed an average value of 12.1 °Brix, with the average between 13.86 °Brix (‘Rome Star’) and 9.38 °Brix (‘Vistarich’). White peaches had an average value of 11.6 °Brix; the lowest content was in ‘Rosa delWest’ (9.53 °Brix) and the highest in ‘Greta’ (13.23 °Brix). Percoche showed values between 9.90 and 13.27 °Brix in ‘Babygold 7′ and ‘Cotogna del Poggio’, respectively [23,24,25]. According to our findings in 2022, the SSC amount showed a massive boost after two days of storage, coming close to the optimal range. This indicates that DAFB 74 to DAFB 77 (during 20–23 June harvest date) were ideal to harvest peach fruit in 2022 since they could reach acceptable quality for the consumer when considering transportation time. This conclusion is verified by the curve because the SSC did not significantly change after this stage.
As depicted in Figure 4B,E, the firmness of the ‘Mihong’ fruit exhibited a significant reduction in both the 2021 and 2022 samples. As previously mentioned, the firmness measurements taken after two days of storage (DAFB 74+2, DAFB 77+2, and DAFB 81+2) showed a greater reduction than the harvesting date in the 2022 samples. After DAFB 74 (20 June), the firmness reduced by more than half when compared to the previous date within a very small time gap. In addition, after DAFB 77 (23 June), the firmness was reduced to a very small amount, limiting most handling practices; most importantly, machine harvesting could not be performed. However, the data gathered in 2021 show a greater reduction after DAFB 83 (22 June), likely due to varying environmental factors during the ripening process.
Fruit softness is an important physiological process associated with fruit quality. It involves various structural and compositional changes in cell wall components as a result of fruit-softening enzymes. Higher fruit firmness in peaches might be due to the presence of insoluble protopectins and comparatively fewer amounts of soluble protopectins. Fruits with higher softening resulted in the conversion of insoluble protopectins to more soluble pectic acid and pectin. Softening of fruits occurs due to damage to cellular membrane integrity, which is associated with the activity of polygalacturonase enzymes. During fruit ripening, an increase in polygalacturonase and pectin esterase enzyme activity causes the depolymerization of pectin. Delayed and modified depolymerization and solubilization may lead to a partial reduction in the higher activities of major cell wall hydrolysis enzymes [21]. Thus, at the optimal maturity stage, firmness should be at a desirable range that is not too high or too low.
According to the findings of our 2022 experiment, DAFB 74 to 77 (during the 20 June–23 June harvest date) is the most convenient period for machine harvesting when considering the firmness data. This is also suggested by the variations in the SSC data, because if the peaches will be harvested during this period, they can reach acceptable flavor quality with minimum mechanical damage due to identical firmness.
The overall TA changes (Figure 4C,F) can be expressed as an amount reduction with time. In both years, the TA continuously decreased except for one day. According to the 2021 data, the TA begins with a steady reduction before dropping suddenly after DAFB 78 (17 June) and finally reaches a plateau. For the 2022 data, the TA shows a gradual reduction until passing 81 DAFB (27 June), when it also becomes constant. At this point, the peach fruit has obtained its maturity stage of consumer acceptance.
Malic, citric, and quinic acids are the major ones found in stone fruits, which greatly contribute to the total acidity of peaches and nectarines. Wang et al. reported that the taste of malic acid is stronger and more persistent than that of citric acid [25]. Quinic acid imparts a slightly sour and bitter taste and is reported to have antibacterial properties beneficial to health. However, a lower extent of acid content seems to be favorable for fruit quality evaluated by consumers. The literature has reported TA values of 0.13–0.31% in white-fleshed peaches and 0.45–0.87% in yellow-fleshed peaches, or a range from 0.15 to 0.34% in white peaches and from 0.53 to 0.97% in yellow-fleshed peaches, or 0.31–0.47% in white peaches and from 0.53 to 0.86% in yellow peaches as having optimum eating quality [24,26,27,28,29]. The reduction in acidity in mature peaches may be due to the rapid rate of oxidative processes. Higher respiration may result in the degradation of organic acid, which confirms earlier studies reporting that organic acids act as substrates for enzymatic reactions of respiration resulting in acidity reduction [21]. Our findings also align with this, verifying that acid content is reduced at later harvest dates. Zhuang et al. have also shown identical results with ‘Yulu’ and ‘ZhaoYang’ peach cultivars [30]. Our TA data also suggest that after DAFB 78, acid content slightly varies, confirming it is suitable to harvest peach fruit before that point as our SSC and firmness results also prove that peaches have reached the desired flavor by this stage.
The SSC, firmness, and TA results from the 2022 samples suggest that DAFB 74 to 77 (during the 20 June–23 June harvest date) is the ideal period to harvest peach fruit if the grower must use a machine harvester with minimal damage to the fruits.

3.3. Changes in the Color Values of Fruit Skin in ‘Mihong’ Peaches

The mean values for the colors are shown in Table 1 and Table 2 for both 2021 and 2022. Here, nearly the same alteration pattern is displayed by the right and left sides of the fruit in both years. However, in addition to the two sides, the apex side color values were also measured in the 2022 samples. The apex side revealed interesting identical patterns which deviate to some degree from the other two sides. While the overall L*, b*, and hue color values of the left and right side reduced with harvest dates, the a* value gradually increased with the time in both the 2021 and 2022 samples. The chroma value showed a slight reduction at the end of the experiment in 2021, even though it did not manifest a significant change throughout the experimental time in 2022, except for the last day.
When considering the L* value, it reduced from the initial to the last experiment day. The right and the left side of the fruit samples from 2021 and 2022 showed a relatively similar pattern and, during the initial period, underwent slight alterations and finally reduced. On the apex side, the L* value changes have deviated from the other sides, but it did not show an identical pattern and only exhibited an overall reduction. The L* value indicates the brightness of an object, which varies from 0 (black) to 100 (white) [31]. With ripening, the brightness of the peach fruit skin reduced, showing an L* value reduction in both cultivars on each side.
The a* value of the right and left sides of the fruits in both years showed the same pattern. It increased during maturity in three different phases: rising slightly, accelerating quickly, then again a slight increment. However, for the color of the apex side, the a* value plateaued after the DAFB 74 (20 June) harvest date and only increased again on the last day. By the end of the experimental day, the fruits are fully matured and showed some deviations, and they are unsuitable for machine harvesting. Therefore, when considering the a* value, ‘Mihong’ peaches should be harvested after DAFB 74 (20 June) since it has obtained their desired color by this stage.
Usually, the a* value represents the red–green color of the object: a positive value represents red, and a negative value represents green. Here, most of the values began in the negative and grew to positive values at later ripening stages as the green color changed to red. The closest results for the apex side changes were exhibited by Arias R. et al. and Zhang et al. for six different peach cultivars [2,32]. According to the data gathered by Scalisi et al., yellow peach cultivars also exhibit an increment of the a* value with maturity [33].
Anthocyanin is an important determinant of the color, specially related to the a* value in many fruits, flowers, seeds, and roots [34,35]. Anthocyanin is water-soluble and the colors it produces may vary between red, purple, and blue depending on the molecule and pH of the vacuole [36,37]. According to the data analyzed by Tsuda et al., anthocyanin concentrations of peach fruit skins in three different cultivars showed parallel results with the a* values in all cultivars [38]. Therefore, observing color variations in our study suggests that anthocyanin biosynthesis may begin from the apex side and then eventually spread to the middle part of the fruit, as a higher a* value is shown on the apex side than on the right and left sides of the fruit from the beginning (Table 2).
The b* value followed the same pattern as the a* value but in the opposite direction; as the harvesting date increased, the b* value decreased in both the 2021 and 2022 samples, except for a small deviation on the last date of the 2022 experiment. The apex side reached a constant b* value after DAFB 74 (harvest date of 20 June).
The b* value represents the yellow–blue color of the object; a positive value represents yellow, and a negative value represents blue. Because fruits become more yellow with time, the b* value increases past the initial point. The same results for the right and left sides were shown by Zhang et al. [2]. However, the results observed on the apex side suggest that after DAFB 74 or 20 June, the peaches were appropriate for harvesting as they had obtained the desired color.
The chroma values in the 2021 samples did not show a significant rhythm to the fluctuation. However, in the 2022 experiment, the right, left, and apex sides remained constant throughout the harvesting time except for the final day. On the final day, almost all the values finally reached the same point. Usually, color saturation or intensity is measured by chroma (C), and it is the purity of a color (a high chroma has no added black, white, or gray) [39]. In this study, the chroma value varies within 20–40, which has a significant purity in the color without any abnormalities and defects on the skin.
The hue value reduced with the harvest date on the right and left side of the peach samples from both years. The hue also has the same pattern as the b* value, which reduced according to the three speed phases. In addition, the hue showed a similar pattern to the b* value on the apex side, which is completely different from the right and left sides of the same fruit. After DAFB 74 (20 June), the hue value plateaued and deviated slightly only on the last date.
The hue angle (h°) describes the relative amounts of redness and yellowness. Red/magenta is defined as 0°/360°, yellow as 90°, green as 180°, and blue as 270°, or intermediate colors between adjacent pairs of these basic colors. A product is redder if the hue value is lower [39]. Considering our results, Scalisi et al. have also reported the same results for the right and left sides of peach fruit [33]. Tadesse et al. studied the effect of harvesting sweet peppers at different maturity stages and found that the hue value declined with the ripening [40]. This also suggests that after DAFB 74 (20 June) is a satisfactory time to harvest peaches depending on the color development.

3.4. Changes of Ethylene Production in ‘Mihong’ Peaches by Harvest Date

As expressed in Figure 5, ethylene production increased with time (DAFB/Harvesting date). It also displayed a significant pattern: increasing slowly at the beginning, accelerating abruptly in the middle, and then slowing down in increments towards the end of the experiment day.
Since peaches and nectarines are climacteric fruit, ethylene plays a key role by regulating the expression of genes involved in a wide range of ripening-related reactions, including autocatalytic ethylene production, flesh softening, chlorophyll loss, and changes in sugar and acid content [41,42]. The ethylene production levels may affect fruit firmness and TA but might not significantly affect SSC. This indicates that SSC might be ethylene-independent, while fruit firmness and TA are ethylene-dependent. The involvement of ethylene in peach fruit softening has recently been proven [43]; it has also been observed that the rapid drop of fruit firmness during ripening (melting stage) begins when significant ethylene production has already occurred [44].

4. Conclusions

In this study, ‘Mihong’ peach samples from 2021 and 2022 were analyzed based on various quality parameters. According to our results, fruit size revealed a double sigmoid curve, typical for peach fruit development, and the SSC increased while firmness and TA declined with time. The SSC and firmness varied by a large ratio in two days of storage conditions compared to the harvest date, in the 2022 samples, suggesting the optimal harvesting time for ‘Mihong’ peaches as the stage of DAFB 74 (20 June harvest date). The L*, b*, and hue color values decreased, whereas a* increased and chroma remained constant in the right and left side of the fruit measurements. The ethylene production also increased, showing the maturity with time. Interestingly, the a*, b*, and hue values reached a plateau with apex side color values after DAFB 74 (20 June harvest date) based on the 2022 data, exhibiting the desired color development and manifesting the same results. Conclusively, these results imply that color values, particularly the a* values on the apex side, are a more acceptable method that can provide a clear sense of when to harvest ‘Mihong’ peaches with desired fruit attributes. These a* value fluctuations can be further evinced by studying the anthocyanin content of the fruit and will be able to be used as a non-destructive measurement for future studies.

Author Contributions

L.S.H.J.: formal analysis, writing—original draft. M.H.S.: formal analysis, investigation, writing—review and editing. W.M.U.D.W.: formal analysis, investigation. S.K.L.: project administration. J.G.C.: funding acquisition. S.H.J.: formal analysis. J.G.K.: conceptualization, funding acquisition, methodology, project administration, supervision, writing—review and editing. All authors have read and agreed to the published version of the manuscript.

Funding

This work was carried out with the support of “The Cooperative Research Program for Agriculture Science and Technology Development (Project No. PJ0156462023)” Rural Development Administration, Republic of Korea.

Data Availability Statement

All data are included in the manuscript.

Conflicts of Interest

The authors declare that there are no conflict of interest.

References

  1. Tilahun, S.; Jeong, M.J.; Choi, H.R.; Baek, M.W.; Hong, J.S.; Jeong, C.S. Prestorage high CO2 and 1-MCP treatment reduce chilling injury, prolong storability, and maintain sensory qualities and antioxidant activities of “Madoka” peach fruit. Front. Nutr. 2022, 9, 903352. [Google Scholar] [CrossRef]
  2. Zhang, P.; Wei, Y.; Xu, F.; Wang, H.; Chen, M.; Shao, X. Changes in the chlorophyll absorbance index (I AD) are related to peach fruit maturity. N. Z. J. Crop Hortic. Sci. 2020, 48, 34–46. [Google Scholar] [CrossRef]
  3. Crisosto, C.H. Stone fruit maturity indices: A descriptive. Postharvest News Inf. 1994, 5, 65N–68N. [Google Scholar]
  4. Minas, I.S.; Blanco-Cipollone, F.; Sterle. Accurate non-destructive prediction of peach fruit internal quality and physiological maturity with a single scan using near-infrared spectroscopy. Food Chem. 2021, 335, 127626. [Google Scholar] [CrossRef]
  5. Zhang, B.; Peng, B.; Zhang, C.; Song, Z.; Ma, R. Determination of fruit maturity and its prediction model based on the pericarp index of absorbance difference (IAD) for peaches. PLoS ONE 2017, 12, e0177511. [Google Scholar] [CrossRef]
  6. Pinto, C.; Reginato, G.; Shinya, P.; Mesa, K.; Díaz, M.; Atenas, C.; Infante, R. Skin color and chlorophyll absorbance: Indices for establishing a harvest date on non-melting peach. Sci. Hortic. 2015, 192, 231–236. [Google Scholar] [CrossRef]
  7. Lechaudel, M.; Urban, L.; Joas, J. Chlorophyll fluorescence, a nondestructive method to assess maturity of mango fruits (Cv.‘Cogshall’) without growth conditions bias. J. Agric. Food Chem. 2010, 58, 7532–7538. [Google Scholar] [CrossRef]
  8. Prinsi, B.; Negri, A.S.; Fedeli, C.; Morgutti, S.; Negrini, N.; Cocucci, M.; Espen, L. Peach fruit ripening: A proteomic comparative analysis of the mesocarp of two cultivars with different flesh firmness at two ripening stages. Phytochemistry 2011, 72, 1251–1262. [Google Scholar] [CrossRef] [PubMed]
  9. Brooks, S.J.; Moore, J.N.; Murphy, J.B. Quantitative and qualitative changes in sugar content of peach genotypes [Prunus persica (L.) Batsch.]. J. Am. Soc. Hortic. Sci. 1993, 118, 97–100. [Google Scholar] [CrossRef] [Green Version]
  10. Wakabayashi, K. Changes in cell wall polysaccharides during fruit ripening. J. Plant Res. 2000, 113, 231. [Google Scholar] [CrossRef]
  11. Liu, T.; Song, S.; Yuan, Y.; Wu, D.; Chen, M.; Sun, Q.; Zhang, B.; Xu, C.; Chen, K. Improved peach peel color development by fruit bagging. Enhanced expression of anthocyanin biosynthetic and regulatory genes using white non-woven polypropylene as replacement for yellow paper. Sci. Hortic. 2015, 184, 142–148. [Google Scholar] [CrossRef]
  12. Scalisi, A.; O’Connell, M.G.; Islam, M.S.; Goodwin, I. A fruit colour development index (CDI) to support harvest time decisions in peach and nectarine orchards. Horticulturae 2022, 8, 459. [Google Scholar] [CrossRef]
  13. Kumarihami, H.P.C.; Kim, J.G.; Kim, Y.H.; Lee, M.; Lee, Y.S.; Kwack, Y.B.; Kim, J. Preharvest application of chitosan improves the postharvest life of ‘Garmrok’ kiwifruit through the modulation of genes related to ethylene biosynthesis, cell wall modification and lignin metabolism. Foods 2021, 10, 373. [Google Scholar] [CrossRef]
  14. Kumarihami, H.P.C.; Cha, G.H.; Kim, J.G.; Kim, H.L.; Lee, M.; Kwack, Y.B.; Cho, J.G.; Kim, J. Effect of preharvest Ca-Chitosan application on postharvest quality of ‘Garmrok’ kiwifruit during cold storage. Hortic. Sci. Technol. 2020, 38, 239–248. [Google Scholar]
  15. Tonutti, P.; Casson, P.; Ramina, A. Ethylene biosynthesis during peach fruit development. J. Am. Soc. Hortic. Sci. 1991, 116, 274–279. [Google Scholar] [CrossRef] [Green Version]
  16. Callahan, A.M.; Dardick, C.; Scorza, R. Characterization of ‘Stoneless’: A naturally occurring, partially stoneless plum cultivar. J. Am. Soc. Hortic. Sci. 2009, 134, 120–125. [Google Scholar] [CrossRef] [Green Version]
  17. Dardick, C.D.; Callahan, A.M.; Chiozzotto, R.; Schaffer, R.J.; Piagnani, M.C.; Scorza, R. Stone formation in peach fruit exhibits spatial coordination of the lignin and flavonoid pathways and similarity to Arabidopsisdehiscence. BMC Boil. 2010, 8, 13. [Google Scholar] [CrossRef] [Green Version]
  18. Bonghi, C.; Trainotti, L.; Botton, A.; Tadiello, A.; Rasori, A.; Ziliotto, F.; Zaffalon, V.; Casadoro, G.; Ramina, A. A microarray approach to identify genes involved in seed-pericarp cross-talk and development in peach. BMC Plant Biol. 2011, 11, 107. [Google Scholar] [CrossRef] [Green Version]
  19. Lara, M.V.; Borsani, J.; Budde, C.O.; Lauxmann, M.A.; Lombardo, V.A.; Murray, R.; Andreo, C.S.; Drincovich, M.F. Biochemical and proteomic analysis of ‘Dixiland’peach fruit (Prunus persica) upon heat treatment. J. Exp. Bot. 2009, 60, 4315–4333. [Google Scholar] [CrossRef] [PubMed] [Green Version]
  20. Génard, M.; Lescourret, F.; Gomez, L.; Habib, R. Changes in fruit sugar concentrations in response to assimilate supply, metabolism and dilution: A modeling approach applied to peach fruit (Prunus persica). Tree Physiol. 2003, 23, 373–385. [Google Scholar] [CrossRef] [PubMed] [Green Version]
  21. Khan, A.S.; Hussain, K.; Shah, H.M.S.; Malik, A.U.; Anwar, R.; Rehman, R.N.U.; Bakhsh, A. Cold storage influences postharvest chilling injury and quality of peach fruits. J. Hortic. Sci. Technol. 2018, 1, 28–34. [Google Scholar] [CrossRef]
  22. Layne, D.R.; Bassi, D. The Peach: Botany, Production and Uses; Cabi: Wallingford, UK, 2008. [Google Scholar]
  23. Tomás-Barberán, F.A.; Gil, M.I.; Cremin, P.; Waterhouse, A.L.; Hess-Pierce, B.; Kader, A.A. HPLC−DAD−ESIMS analysis of phenolic compounds in nectarines, peaches, and plums. J. Agric. Food Chem. 2001, 49, 4748–4760. [Google Scholar] [CrossRef]
  24. Petruccelli, R.; Bonetti, A.; Ciaccheri, L.; Ieri, F.; Ganino, T.; Faraloni, C. Evaluation of the fruit quality and phytochemical compounds in peach and nectarine cultivars. Plants 2023, 12, 1618. [Google Scholar] [CrossRef] [PubMed]
  25. Wang, L. Heritable pleiotropy of glabrous and saucer shape gene loci from peach and their breeding value. J. Fruit Sci. 2009, 26, 692–698. [Google Scholar]
  26. Gil, M.I.; Tomás-Barberán, F.A.; Hess-Pierce, B.; Kader, A.A. Antioxidant capacities, phenolic compounds, carotenoids, and vitamin C contents of nectarine, peach, and plum cultivars from California. J. Agric. Food Chem. 2002, 50, 4976–4982. [Google Scholar] [CrossRef]
  27. Drogoudi, P.; Pantelidis, G.E.; Goulas, V.; Manganaris, G.A.; Ziogas, V.; Manganaris, A. The appraisal of qualitative parameters and antioxidant contents during postharvest peach fruit ripening underlines the genotype significance. Postharvest Biol. Technol. 2016, 115, 142–150. [Google Scholar] [CrossRef]
  28. Reig, G.; Iglesias, I.; Gatius, F.; Alegre, S. Antioxidant capacity, quality, and anthocyanin and nutrient contents of several peach cultivars [Prunus persica (L.) Batsch] grown in Spain. J. Agric. Food Chem. 2013, 61, 6344–6357. [Google Scholar] [CrossRef]
  29. Baccichet, I.; Chiozzotto, R.; Bassi, D.; Gardana, C.; Cirilli, M.; Spinardi, A. Characterization of fruit quality traits for organic acids content and profile in a large peach germplasm collection. Sci. Hortic. 2021, 278, 109865. [Google Scholar]
  30. Zhuang, J.; Hou, C.; Tang, Y.; He, Y.; Guo, Q.; Miao, A.; Zhong, Z.; Luo, S. Assessment of external properties for identifying banana fruit maturity stages using optical imaging techniques. Sensors 2019, 19, 2910. [Google Scholar] [CrossRef] [Green Version]
  31. Urbonaviciene, D.; Viskelis, P.; Viskelis, J.; Jankauskiene, J.; Bobinas, C. Lycopene and β-carotene in non-blanched and blanched tomatoes. J. Food Agric. Environ. 2012, 10, 142–146. [Google Scholar]
  32. Arias, R.; Lee, T.C.; Logendra, L.; Janes, H. Correlation of lycopene measured by HPLC with the L*, a*, b* color readings of a hydroponic tomato and the relationship of maturity with color and lycopene content. J. Agric. Food Chem. 2000, 48, 1697–1702. [Google Scholar] [CrossRef]
  33. Scalisi, A.; Pelliccia, D.; O’Connell, M.G. Maturity prediction in yellow peach (Prunus persica L.) cultivars using a fluorescence spectrometer. Sensors 2020, 20, 6555. [Google Scholar] [CrossRef]
  34. Kim, C.Y.; Ahn, Y.O.; Kim, S.H.; Kim, Y.H.; Lee, H.S.; Catanach, A.S.; Jacobs, J.M.; Conner, A.J.; Kwak, S.S. The sweet potato IbMYB1 gene as a potential visible marker for sweet potato intragenic vector system. Physiol. Plant. 2010, 139, 229–240. [Google Scholar]
  35. Lin-Wang, K.; Bolitho, K.; Grafton, K.; Kortstee, A.; Karunairetnam, S.; McGhie, T.K.; Espley, R.V.; Hellens, R.P.; Allan, A.C. An R2R3 MYB transcription factor associated with regulation of the anthocyanin biosynthetic pathway in Rosaceae. BMC Plant Biol. 2010, 10, 50. [Google Scholar] [CrossRef] [Green Version]
  36. Singh, M.; Arseneault, M.; Sanderson, T.; Murthy, V.; Ramassamy, C. Challenges for research on polyphenols from foods in Alzheimer’s disease: Bioavailability, metabolism, and cellular and molecular mechanisms. J. Agric. Food Chem. 2008, 56, 4855–4873. [Google Scholar] [CrossRef]
  37. Khan, I.A.; Rahman, M.U.; Sakhi, S.; Nawaz, G.; Khan, A.A.; Ahmad, T.; Adnan, M.; Khan, S.M. PpMYB39 activates PpDFR to modulate anthocyanin biosynthesis during peach fruit maturation. Horticulturae 2022, 8, 332. [Google Scholar] [CrossRef]
  38. Tsuda, T.; Yamaguchi, M.; Honda, C.; Moriguchi, T. Expression of anthocyanin biosynthesis genes in the skin of peach and nectarine fruit. J. Am. Soc. Hortic. Sci. 2004, 129, 857–862. [Google Scholar] [CrossRef] [Green Version]
  39. Kortei, N.K.; Akonor, P.T. Correlation between hue-angle and colour lightness of gamma irradiated mushrooms. Ann. Food Sci. Technol. 2015, 16, 98–103. [Google Scholar]
  40. Tadesse, T.; Hewett, E.W.; Nichols, M.A.; Fisher, K.J. Changes in physicochemical attributes of sweet pepper cv. Domino during fruit growth and development. Sci. Hortic. 2002, 93, 91–103. [Google Scholar] [CrossRef]
  41. Alba, R.; Payton, P.; Fei, Z.; McQuinn, R.; Debbie, P.; Martin, G.B.; Tanksley, S.D.; Giovannoni, J.J. Transcriptome and selected metabolite analyses reveal multiple points of ethylene control during tomato fruit development. Plant Cell 2005, 17, 2954–2965. [Google Scholar] [CrossRef] [Green Version]
  42. Giovannoni, J.J. Genetic regulation of fruit development and ripening. Plant Cell 2004, 16 (Suppl. 1), S170–S180. [Google Scholar] [CrossRef] [PubMed] [Green Version]
  43. Hayama, H.; Shimada, T.; Fujii, H.; Ito, A.; Kashimura, Y. Ethylene-regulation of fruit softening and softening-related genes in peach. J. Exp. Bot. 2006, 57, 4071–4077. [Google Scholar] [CrossRef] [PubMed]
  44. Brummell, D.A.; Dal Cin, V.; Crisosto, C.H.; Labavitch, J.M. Cell wall metabolism during maturation, ripening and senescence of peach fruit. J. Exp. Bot. 2004, 55, 2029–2039. [Google Scholar] [CrossRef] [PubMed] [Green Version]
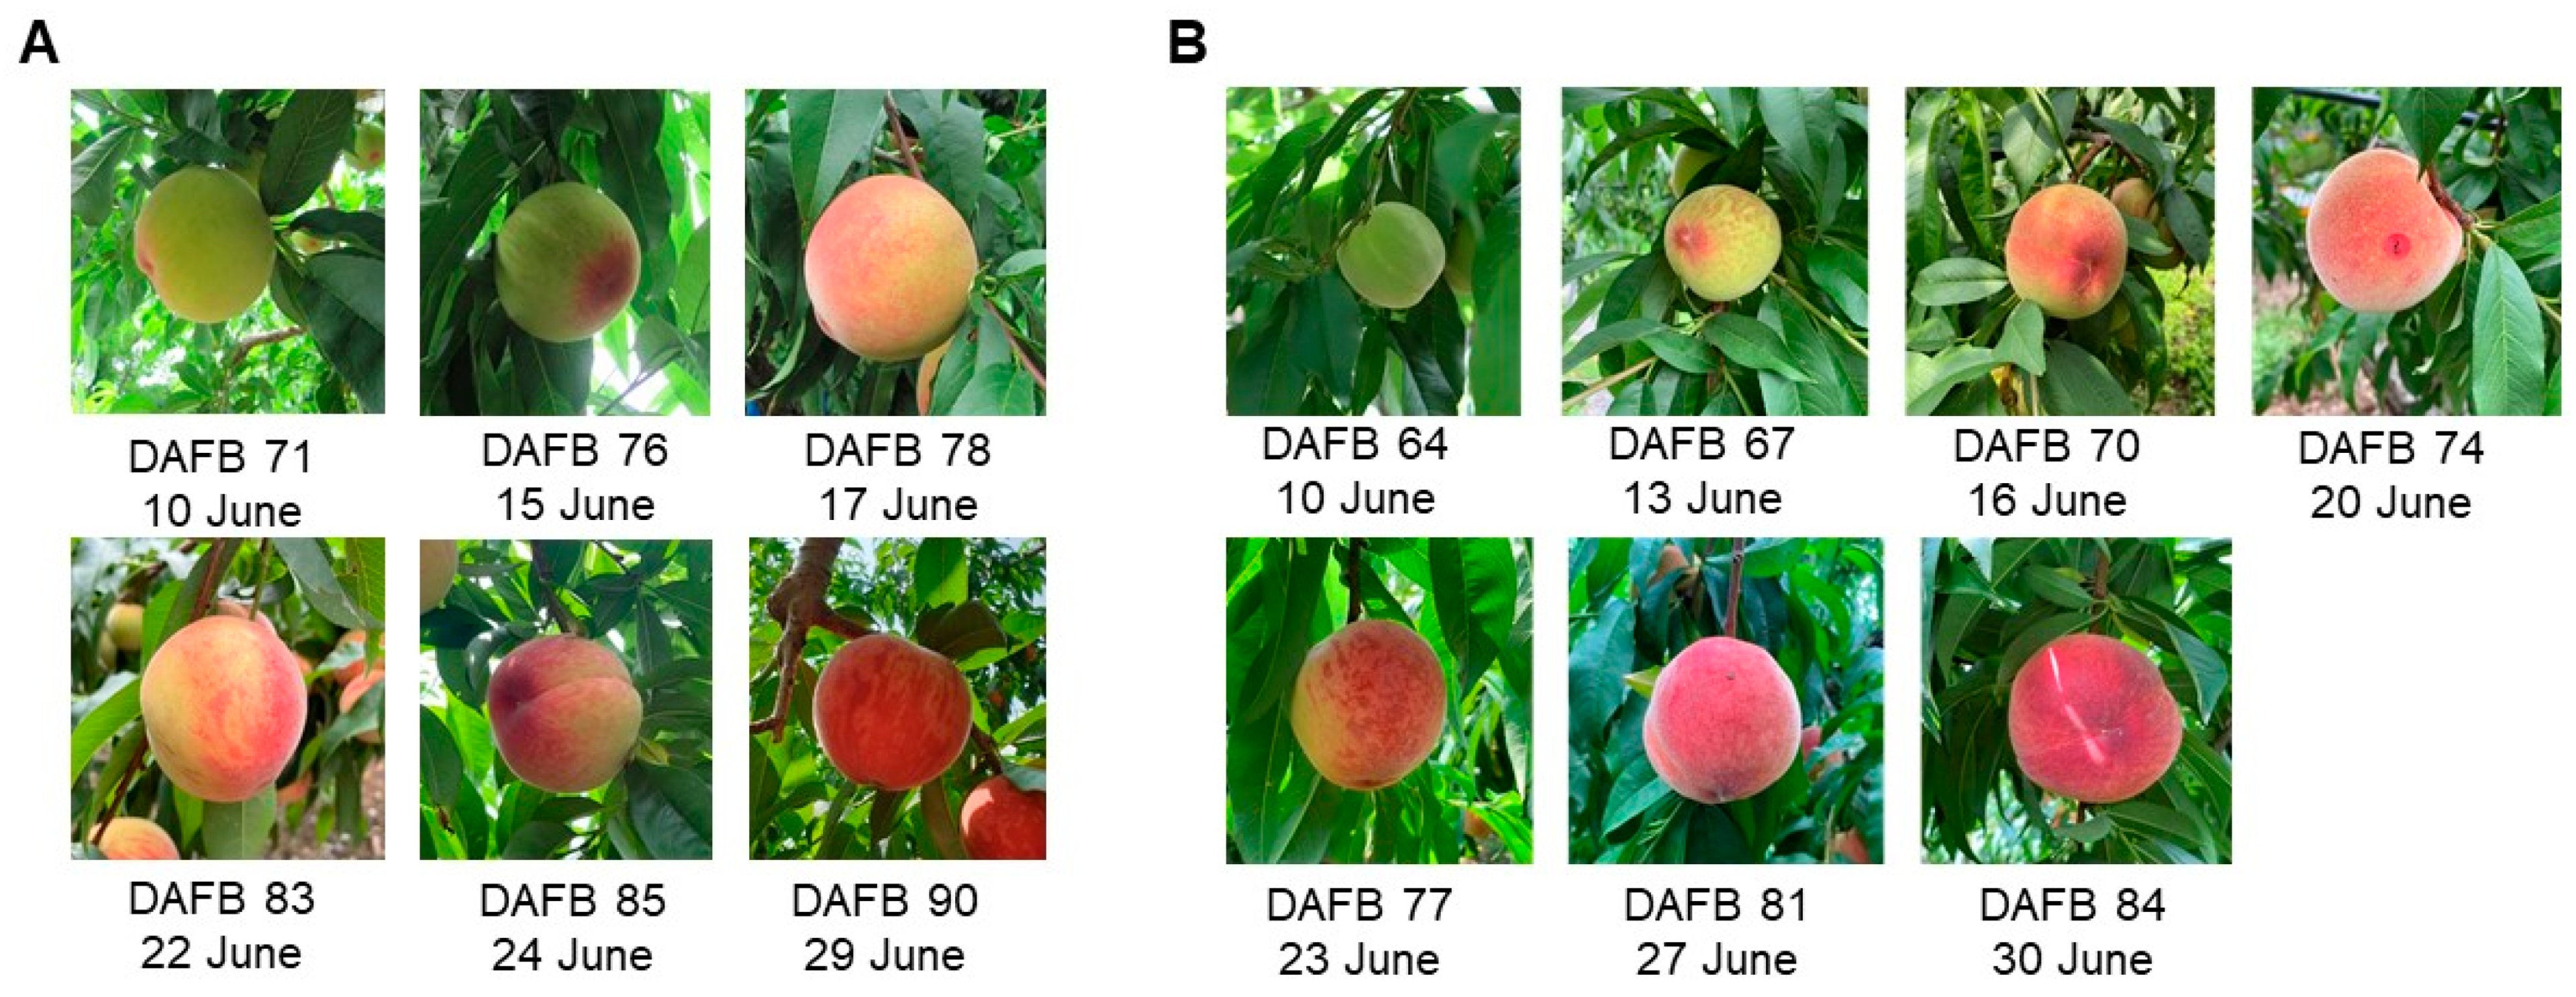
Figure 1. Different maturity stages of ‘Mihong’ peaches in each harvest day, at field conditions in 2021 (A) and 2022 (B).
Horticulturae 09 00730 g001
Figure 2. Side selection for color measurements.
Horticulturae 09 00730 g002
Figure 3. (A) Changes in the fruit weight, (B) length, and (C) width based on DAFB and (D) changes in the fruit weight, (E) length, and (F) width based on harvest date in ‘Mihong’ peach samples from 2021 and 2022. Vertical bars indicate ±SE (n = 36, 2021 and n = 20, 2022). Means with different letters (a–d) indicate significant difference during the DAFB and harvesting time in both years separately (p < 0.05) according to the Tukey’s test.
Horticulturae 09 00730 g003aHorticulturae 09 00730 g003b
Figure 4. (A) Changes in soluble solids content (SSC), (B) firmness, and (C) titratable acidity (TA) based on DAFB and (D) changes of soluble solids content (SSC), (E) firmness, and (F) titratable acidity (TA) based on harvest date for both 2021 and 2022 samples. Vertical bars indicate ±SE (n = 36, 2021 and n = 20, 2022). Means with different letters (a–e) indicate significant difference during the DAFB and harvesting time in both years separately (p < 0.05) according to the Tukey’s test.
Horticulturae 09 00730 g004
Figure 5. Changes in ethylene production of the 2022 ‘Mihong’ peach samples based on harvest date and DAFB. Means with different letters (a–c) indicate significant difference during the DAFB/ harvesting time (p < 0.05) according to the Tukey’s test.
Horticulturae 09 00730 g005
Table 1. Changes in the L*, a*, and b* color values and chroma and hue values with Harvest time/DAFB in ‘Mihong’ peaches from 2021.
Harvest Date
/DAFB
L* Valuea* Valueb* ValueChromaHue
RightLeftRightLeftRightLeftRightLeftRightLeft
10 June (DAFB 71)66.4 ± 0.8 ab66.0 ± 0.8 a−11.8 ± 0.6 c−11.4 ± 0.7 c37.3 ± 0.5 a37.2 ± 0.4 a39.3 ± 0.5 a39.1 ± 0.5 a107.3 ± 1.0 a106.8 ± 1.0 a
15 June (DAFB 76)69.2 ± 0.9 a68.8 ± 1.0 a−8.3 ± 1.3 c−7.8 ± 1.4 c37.1 ± 0.6 a36.9 ± 0.7 a38.8 ± 0.6 ab38.8 ± 0.5 a101.4 ± 2.1 a100.8 ± 2.5 a
17 June (DAFB 78)70.7 ± 1.0 a69.8 ± 1.2 a−7.3 ± 1.4 c−4.8 ± 1.9 c37.9 ± 0.6 a36.5 ± 0.7 a39.5 ± 0.5 a38.6 ± 0.6 ab100.1 ± 2.2 a96.0 ± 3.1 a
22 June (DAFB 83)66.2 ± 1.7 ab65.4 ± 1.7 a11.6 ± 0.1 b10.8 ± 2.15 b31.9 ± 0.9 b32.1 ± 1.2 b37.1 ± 0.4 bc36.7 ± 0.5 bc70.3 ± 4.0 b70.6 ± 3.8 b
24 June (DAFB 85)62.8 ± 1.7 bc66.1 ± 1.7 a18.1 ± 2.0 b13.5 ± 2.0 b27.9 ± 0.7 c29.4 ± 1.0 b35.4 ± 0.6 c34.9 ± 0.5 c58.5 ± 3.4 c65.4 ± 3.7 b
29 June (DAFB 90)57.8 ± 1.4 c57.1 ± 1.3 b27.7 ± 1.3 a29.2 ± 1.0 a26.1 ± 0.7 c25.4 ± 0.8 c39.1 ± 0.5 ab39.3 ± 0.5 a43.9 ± 2.2 d41.2 ± 1.7 c
Means with different letters (a–d) within a column are significantly different (p < 0.05) according to the Tukey’s test.
Table 2. Changes in the L*, a*, and b* color values and chroma and hue values with Harvest time/DAFB in ‘Mihong’ peaches from 2022.
Harvest Date
/DAFB
L* Valuea* Valueb* ValueChromaHue
RightLeftApexRightLeftApexRightLeftApexRightLeftApexRightLeftApex
10 June (DAFB 64)67.8 ± 0.8 a67.0 ± 0.9 a59.6 ± 1.0 a−10.3 ± 0.6 e−8.5 ± 1.4 d4.7 ± 1.6 d27.3 ± 0.5 a26.8 ± 0.6 ab18.9 ± 1.2 a29.2 ± 0.7 b28.7 ± 0.7 b21.0 ± 0.9 b110.4 ± 1.0 a106.9 ± 2.7 a72.4 ± 5.0 a
13 June (DAFB 67)69.0 ± 0.9 a66.4 ± 1.1 ab54.9 ± 1.1 b−10.2 ± 0.8 e−8.0 ± 1.0 d14.3 ± 1.0 bc28.3 ± 0.7 a26.5 ± 0.8 ab14.1 ± 1.0 bc30.2 ± 0.8 b27.9 ± 0.9 b20.7 ± 0.8 b109.3 ± 1.3 a105.6 ± 1.9 a44.3 ± 3.2 b
16 June (DAFB 70)69.5 ± 1.0 a70.1 ± 1.0 a62.2 ± 1.2 a−8.8 ± 1.0 e−7.6 ± 1.1 d8.9 ± 1.8 cd28.2 ± 0.7 a28.2 ± 0.5 a19.3 ± 1.1 a29.7 ± 0.8 b29.6 ± 0.7 b23.0 ± 0.6 b106.5 ± 1.7 a104.3 ± 2.0 a64.3 ± 5.0 a
20 June (DAFB 74)68.1 ± 1.7 a68.2 ± 1.3 a51.2 ± 0.7 bc1.9 ± 2.1 d1.9 ± 1.9 c18.8 ± 0.8 b26.1 ± 1.3 a26.6 ± 1.2 ab10.4 ± 0.5 c28.0 ± 0.8 b28.1 ± 0.9 b21.5 ± 1.0 b83.2 ± 5.0 b83.8 ± 4.4 b28.9 ± 0.6 c
23 June (DAFB 77)68.5 ± 1.6 a66.7 ± 1.2 a49.4 ± 1.0 cd6.8 ± 2.8 c9.6 ± 1.9 b19.3 ± 1.0 b24.9 ± 1.5 ab24.0 ± 0.9 b10.9 ± 0.9 c28.9 ± 0.9 b27.4 ± 0.5 b22.5 ± 1.1 b72.1 ± 6.1 b67.7 ± 4.3 c29.4 ± 2.0 c
27 June (DAFB 81)65.4 ± 1.8 a60.8 ± 1.5 bc53.9 ± 1.3 bc17.7 ± 1.6 b20.6 ± 1.0 a17.9 ± 1.0 b20.3 ± 1.3 b17.5 ± 1.2 c10.9 ± 1.3 c28.2 ± 0.6 b27.6 ± 0.8 b21.2 ± 1.4 b48.7 ± 4.0 c47.9 ± 2.9 d29.9 ± 1.8 c
30 June (DAFB 84)57.6 ± 2.1 b60.3 ± 2.2 c45.4 ± 1.2 d24.5 ± 1.6 a22.8 ± 1.4 a28.5 ± 2.6 a23.7 ± 1.6 ab25.3 ± 1.3 ab18.2 ± 1.1 ab35.0 ± 1.4 a34.8 ± 0.9 a34.1 ± 2.7 a43.6 ± 3.2 c39.9 ± 2.8 d33.3 ± 1.2 bc
Means with different letters (a–e) within a column are significantly different (p < 0.05) according to the Tukey’s test.
Disclaimer/Publisher’s Note: The statements, opinions and data contained in all publications are solely those of the individual author(s) and contributor(s) and not of MDPI and/or the editor(s). MDPI and/or the editor(s) disclaim responsibility for any injury to people or property resulting from any ideas, methods, instructions or products referred to in the content.