Abstract
The main strawberry cultivars grown in tropical regions originated from breeding programs developed in temperate countries, which limit the expression of their maximum productive potential when grown in warm climates. Additionally, strawberry cultivation in these regions depends almost entirely on imported strawberry young plants, increasing production costs. Obtaining adapted cultivars with a lower requirement for the accumulation of chilling hours is the main objective of breeding programs in the southern hemisphere. Thus, the objective of this study was to evaluate short-day strawberry genotypes, pre-selected based on yield and fruit quality components through multivariate analysis, for cultivation in tropical conditions. Two experiments were performed. In the first one, 36 pre-selected genotypes and their parents were assessed based on productive traits (total fruit mass, commercial fruit mass, and mean mass of commercial fruits), soluble solids content, and fruit firmness. For selection, multivariate analysis was applied using the genotype (ideotype) selection index and principal component analysis. In the second experiment, the fruit of the best-ranked genotypes, the parents, and the Camarosa and Dover cultivars were assessed for soluble solids (SS), titratable acidity (TA), SS/TA ratio, ascorbic acid, phenolic compounds, and total anthocyanins. To identify the most promising genotypes, the data were analyzed using principal component analysis. The RVFS06CR-105, RVDA11CR-61, RVDA11CR-125, and RVCS44CR-130 were the most promising genotypes for cultivation in tropical conditions, based on yield and fruit quality components. The means found for these genotypes were higher than the commercial cultivars Dover, Camino Real, and Camarosa. The use of multivariate analysis was efficient in selecting the genotypes, with repeatability of information between the methods guaranteeing consistency in the information. The selected genotypes had higher yields than those used as the control, which is a promising result considering the independence in relation to genetic material, mainly in the expansion of the cultivation area in the tropical regions of the southern hemisphere. In addition, these genotypes are being evaluated in different tropical climate regions with the aim of validating them for submission to the registration and release process for farmers. Additionally, they are being used as a source of genes for crossings and new selections.
1. Introduction
Strawberry is a small fruit widely cultivated around the world with high economic and nutritional properties [1,2]. Strawberries have a unique flavor and aroma, as well as high fiber, micronutrients, and ascorbic acid content. Furthermore, strawberries are a well-known source of antioxidants, a growing consumer trend due to their known health benefits [3,4].
Strawberry cultivation around the world, especially in tropical regions, has been impacted by global warming because it is a species of a temperate climate. The Fragaria × ananassa Duch. species is strongly influenced by climate, mainly temperature and photoperiod [5,6,7]. Due to climate change, a strong impact on strawberry yield and quality is expected, with reductions of up to 10% by the middle of this century and 43% by the end of this century, mainly because of the extreme temperatures and droughts [8]. In addition, it is also expected that global warming will alter the development of plants, flowers, and fruits, with smaller and less sweet berries at higher temperatures [9,10].
The main strawberry cultivars produced in South America are better adapted to temperate and subtropical climates. However, when grown in tropical climates at high altitudes, they have good production potential [11]. Thus, strawberry cultivation is limited to specific microclimates, making production geographically restricted to microregions. Expanding the crop to tropical climates is the main task of genetic improvement programs in countries in the southern hemisphere. Currently, strawberry cultivation in these countries uses imported young plants, which often have problems adapting to tropical climates and do not reach their maximum productive potential [12,13]. These young plants come from Chilean and Argentine nurseries, where the climate is favorable for floral induction [14,15]. The logistics of acquiring young plants contribute to an increase in production costs, which has limited the expansion of the strawberry cultivation area.
Fruit quality is also an important target for improvement, as it is crucial for consumer acceptance [1]. Breeding programs have intensified selection due to interest in the role of various bioactive compounds in human health, which has led researchers to seek genotypes with more nutritious fruits [16,17]. Considering that superior strawberry genotypes require several quality traits and high productivity, the strawberry breeder faces the challenge of simultaneously selecting for these traits, which can present unfavorable genetic correlations [18,19]. This is made even more difficult by the complex genetic nature of this plant. Strawberry is an octaploid species, which allows different combinations of genes with greater vigor and relevant agronomic characteristics [20]. However, high heterozygosity impairs the separation of phenotypic expressions that result from additive components and from dominant and epistatic effects, in addition to their interaction with the environment [18,19].
In this context, an accurate evaluation of multivariate and precise selection indices should be able to assist in the selection of the genotype with greater precision. These allow combining information about the phenotypic variations that occur in the genotypes simultaneously, classifying them according to the characteristics of interest. Studies with multivariate analysis have been shown to be efficient in selecting the strawberry crop [5,19,21].
The objective of this study was to evaluate short-day strawberry genotypes, pre-selected based on yield and fruit quality components through multivariate analysis, for cultivation in tropical environments.
2. Materials and Methods
2.1. First Experiment: Evaluation and Selection of Strawberry Genotypes
2.1.1. Plant Material
Thirty-six short-day pre-selected strawberry genotypes (Fragaria × ananassa) of the second generation were used in this study (Table 1). The Breeding Program started in 2011 and is a partnership between the State University of Londrina (UEL, located in Londrina, Paraná, Brazil), the Federal University of Lavras (UFLA, located in Lavras, Minas Gerais, Brazil), and Auburn University (located in Auburn, AL, USA).

Table 1.
List of the 36 pre-selected strawberry genotypes from 15 segregating populations obtained from intervarietal crosses (Fragaria × ananassa Duch.) and their respective male parents.
The first crosses were carried out at UFLA by using the following commercially available cultivars: Dover, Sweet Charlie, Aromas, Camarosa, Festival Florida, Oso Grande, and Camino Real. Fifteen populations were obtained and subjected to selection in two locations, Lavras and Guarapuava, which have very different climates. The first selection was based on agronomic and phytosanitary characteristics, for which 194 genotypes were selected. These genotypes were cloned and evaluated regarding productive, phytosanitary, morphological, and post-harvest aspects. After two selection cycles in the field, the genotypes RVDA-11 (‘Dover × Aromas’), RVCA-16 (‘Camarosa × Aromas’), RVCS-44 (‘Camarosa × Sweet Charlie’), RVFS-06 (‘Festival × Sweet Charlie’), RVFS-07 (‘Festival × Sweet Charlie’), RVFC 07 (‘Festival × Camarosa’), and RVFOS 07 (‘Festival × Oso Grande’) were selected [5,22,23].
These genotypes were crossed with the cultivar Camino Real (short-day), and five segregating populations were obtained. Approximately 2000 nurseries from these crosses were evaluated in the field in a low tunnel system. Based on agronomic traits (fruit yield per plant, average fruit mass, internal and external color, pulp firmness, soluble solids content, plant size, and summit projection, among other characteristics), phytosanitary (Botrytis cinerea, Colletotrichum acutatum, Colletotrichum fragariae, and Diplocarpon earlianum) 36 s-generation genotypes (triple hybrids) were selected and further evaluated in the present study (Table 1). Seedling production was carried out from December 2018 to January 2019. A matrix of each genotype was maintained in a pot filled with commercial substrate and soil in a 1:1 ratio. The matrices plants were kept in a controlled-environment greenhouse at an average temperature of 28 ± 3 °C, a relative humidity (RH) of 80 ± 2%, and a photophase of 14 h. The pots were drip-irrigated daily. After emission, stolons were removed from each matrix plant and transplanted to 50-cell polyethylene trays with a substrate. The trays were kept in a controlled environment under the same conditions as the parent plants for 30 days until the root system was established. These plants were subsequently stored in a cold chamber for ten days at a temperature of 4 ± 1 °C, to induce slight latency, an RH of 83 ± 3%, and a photoperiod of 14/10 h (light/dark), accumulating about 240 h of chilling.
2.1.2. Field Test
The nursery bed preparation was done before planting by properly plowing the soil, correcting acidity, and applying fertilizers according to the results of the soil analysis. The lifting of the nursery beds with dimensions of 0.20 m in height and 1.20 m in width was carried out by using a roto-embanking machine. In each nursery bed, three drip tubes were installed, placed 30 cm apart for irrigation. Subsequently, they were covered with mulch under low tunnels. The young plants were transplanted with a plant spacing of 0.30 m × 0.30 m, forming three lines, arranged close to the irrigation drip points. The plants were arranged in a randomized block design with three repetitions and ten plants per plot.
Nutrition was carried out twice a week by fertigation, as specified for the strawberry crop under tropical conditions [24]. At the beginning of flowering, plants were supplied with boron, zinc, and calcium via fertigation. In the fruit production stage, calcium chloride was applied every 15 days.
Pest control was performed with the following products: Tiamethoxam (Actara®, Syngeta, Basel, Switzerland), abamectin (Vertimec 18CE®, Syngeta, Basel, Switzerland) and fipronil (Nortox®, Arapongas, Brazil). For the control of fungal and bacterial diseases, azoxystrobin + difenoconazole (Amistar Top®, Syngeta, Basel, Switzerland), fluazinam (Frowncide 500 SC®, Ishihara-Cho, Yokkaichi-City, Mie, Japan.), tebuconazole (Folicur WP®, Bayer CropScience, KS, USA), and alternative management with Bordeaux mixture, raw milk, and sodium bicarbonate were applied alternately.
2.1.3. Agronomic Characterization
The characterization of the genotypes in terms of yield and fruit aspects took place during the fruiting phase of the plants (May to October). Harvests took place twice a week. For the measurements, the fruits were harvested fully ripe. To obtain the production components, the fruits were weighed on a semi-analytical scale and classified as non-commercial (<9.99 g) or commercial (>10.00 g). After this classification, the total fruit mass (TFM) was determined. Marketable fruit mass (CFM) was calculated only for fruits considered suitable for commercialization. The average marketable fruit mass (AMCF) was obtained by dividing the marketable fruit mass by the number of marketable fruits.
To determine pulp firmness (FIR), two commercial fruits from each harvest, relative to each genotype, were punctured with a manual penetrometer (In-strutherm, model PTR-300) with a 3 mm diameter tip at two different points on the fruit. Harvest averages were calculated, and results were expressed in Newtons (N). The soluble solids (SS) content expressed in °Brix was determined weekly from the pulp juice of two commercial fruits with a completely red surface. First, the pulp juice was homogenized and filtered at room temperature. Then, the direct reading was performed in a digital refractometer (HANNA®, HI 96801, Woonsocket, RI, USA).
2.1.4. Experimental Design and Statistical Analysis
The experiment was conducted in a randomized complete block design, with three repetitions and ten plants per plot. The cultivars Camarosa, Camino Real, and Dover were used as controls, and treatments consisted of 36 pre-selected experimental genotypes.
Data were subjected to analysis of variance (ANOVA) and treatments were grouped using the Scott–Knott test. The grouping of genotypes was also performed using principal component analysis (PCA). The analysis was performed using the software R v.3.6.3 (R CORE TEAM, 2020, (http://www.r-project.org/ accessed on 22 February 2020) using Agricolae v.1.3-1 [25], KMggplot2 [26] and FactoMineR packages [27].
The most representative and relevant traits for strawberry genetic improvement [23,28] were considered to select the best genotypes: total fruit mass (TMF), commercial fruit mass (CFM), firmness (FIR), and soluble solids content (SS). Next, a genotype (ideotype) selection index was applied, ranking the genotypes for each trait, with the highest ranks reflecting the best values. After obtaining the classification numbers for each genotype, the indices were calculated using the formula: Ij = ∑nij (2), where Ij = index for genotype j; nij = classification number of trait i for genotype j. The genotypes with the lowest Ijs were considered the best. The selection intensity was determined at 28%, and 10 superior genotypes were selected.
2.2. Second Experiment: Post-Harvest Characterization of Selected Genotypes
2.2.1. Fruit Quality Characters of the Selected Genotypes
The ten best genotypes based on the genotype ideotype selection index were further evaluated for fruit quality traits: soluble solids (SS), titratable acidity (TA), ratio SS/TA, phenolic compounds, ascorbic acid, and total anthocyanins. The fruits were harvested at full ripeness with uniform color and size and stored in a freezer (−2 °C). For the analysis, the frozen strawberries were crushed and homogenized. The juice was homogenized and filtered at room temperature, and the soluble solids (SS) content (expressed as °Brix) was determined using a digital refractometer (HANNA®, HI 96801, Woonsocket, RI, USA).
The TA was determined by diluting 10 g of fresh strawberries in 100 mL of distilled water and titrating the solution to pH 8.2 with NaOH 0.1 mol L−1. Results were expressed in g of citric acid per 100 g of pulp [29]. The ratio SS/TA was obtained by dividing the soluble solids (SS) readings with the percentages of titratable acidity (TA).
Phenolic compounds (PC) were determined according to the Folin–Ciocalteu spectrophotometric method [30]. A 5 mL sample of strawberry pulp was mixed with 50 mL of ethanol (50%) and centrifuged for 5 min. Then, 0.2 mL of this extract was mixed to 1.8 mL of distilled water, 10 mL of Folin–Ciocalteu solution (10%), and 8 mL of sodium carbonate solution (7.5%) in a test tube wrapped with aluminum foil. Finally, the tube was shaken and left in the dark for 2 h. The readings were performed in a spectrophotometer at 765 nm (Agilent Technologies® Cary 60 UV, Santa Clara, CA, USA). All reagents and distilled water were used as negative controls, without the centrifuged sample aliquot. Gallic acid was used as a standard. Results were expressed in mg of gallic acid equivalent (GAE) 100 g−1 of pulp.
Ascorbic acid (AC) was determined using the standard AOAC titration method [31] modified by Benassi et al. [32]. A 25 mL aliquot of the strawberry pulp was homogenized with 50 mL of oxalic acid (2%). 20 mL of this solution was transferred to a 50 mL volumetric flask, and the volume was completed with oxalic acid (2%). The solution was filtered through a filter paper, and a 10 mL aliquot was separated for titration with standardized DCFI (2,6-dichlorophenol-indophenol). The results were expressed in mg ascorbic acid per 100 g of pulp.
Anthocyanins (ANT) were determined based on AOAC [33], with adaptations for strawberry fruits. The ANT was determined by diluting 2 g of fresh strawberries in 10 mL of ethanolic solution using a vortex tube shaker (Kasvi® K40-1020). One mL of this compound was added to 10 mL of the ethanolic solution. The reading was performed in a spectrophotometer at 535 nm, using the ethanolic solution as a negative control.
The concentration of total anthocyanins was calculated by using the equation:
where:
C (mg/100 g) = A_ʎmax/(E_1cm^(1%)
C = concentration in mg 100 mL−1;
A = absorbance at ʎ = 535 nm;
Specific absorbance E_1 cm^(1%) = 98.2.
Results were expressed as mg of total anthocyanins 100 g−1.
2.2.2. Statistical Analysis of Fruit Quality Data
The assumptions of normality of errors and homogeneity of variances were analyzed by applying the Shapiro–Wilk and Bartlett tests. The data were subjected to analysis of variance, and the means obtained were grouped by the Scott–Knott test (p > 0.05) using Sisvar software [34]. Means were analyzed using principal component multivariate analysis (PCA) using Rsoftware. 3.6.3 [35] and the Agricolae v.1.3-1 package [25], KMggplot2 plugins [26], and FactoMineR [27].
3. Results and Discussion
3.1. First Experiment: Evaluation and Selection of Strawberry Genotypes
Highly significant differences were found among the genotypes for all traits evaluated. Seven groups were formed for fruit yield, showing higher yields for the genotypes RVCS44CR-130 (1410.2 g/plant), followed by RVDA11CR-125 (1166.7 g/plant) (Figure 1A). For commercial production, wherein only fruits over 10 g were considered, the genotypes were arranged in six different groups, and RVCS44CR-130 (1278.8 g/plant), followed by RVDA11CR-125 (1035.1 g/plant), were also the most productive. The means found for these genotypes were higher than the commercial cultivars Dover (359.3 g), Camino Real (529.8 g), and Camarosa (538.5 g) (Figure 1B).
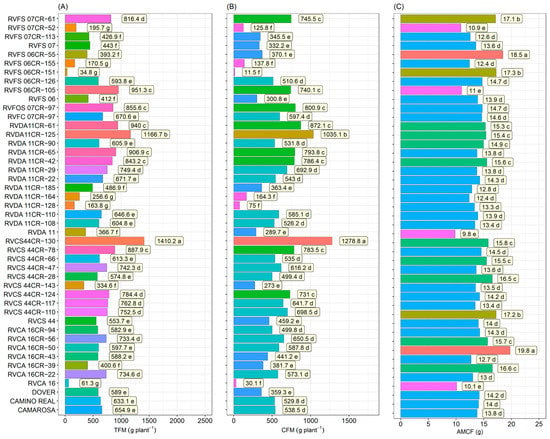
Figure 1.
Total fruit mass (TFM)—(A), commercial fruit mass (CFM)—(B) and mean mass of commercial fruits (AMCF)—(C), in 36 strawberry genotypes (Fragaria × ananassa Duch.) and controls (‘Camarosa’, ‘Camino Real’, and ‘Dover’). Means followed by the same letter and the same color in the projection bars do not differ by the Scott–Knott test (p < 0.01).
Large fruit size is also a desirable characteristic since it affects fruit appearance and price. Thus, it is included among the objectives of breeders for the development of cultivars. Five groups were formed for commercial fruit mass (AMFC), wherein the genotypes RVCA16CR-50 (19.8 g) and RVFS06CR-55 (18.5 g) had the highest AMFC. The means found for these genotypes were also higher than the commercial cultivars Dover (14.2 g), Camino Real (14.0 g), and Camarosa (13.8 g) (Figure 1C).
The genotypes had significant differences for soluble solid contents (SS) and pulp firmness (FIR) traits (Figure 2), which are traditionally considered traits for the characterization of strawberry maturation and quality. Four groups were formed for SS contents, wherein the genotypes RVFS07CR-61 (9.9 °Brix), RVDA06CR-185 (9.6 °Brix), and RVCS44CR-28 (9.2 °Brix) showed the highest levels, even from commercial cultivars Dover (8.2 g), Camino Real (8.1 g), and Camarosa (8.8 g) (Figure 2A).
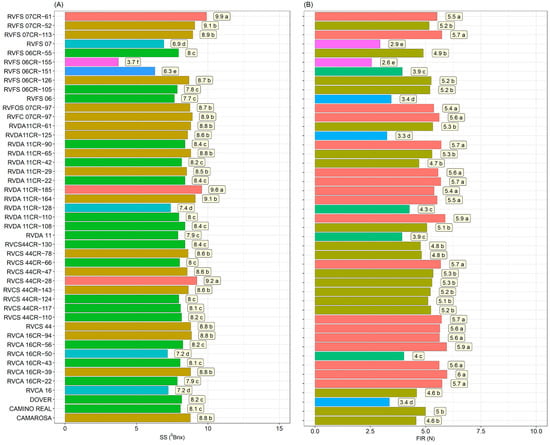
Figure 2.
Soluble solids (SS)—(A) and pulp firmness (FIR)—(B) in 36 strawberry genotypes (Fragaria × ananassa Duch.) and controls (‘Camarosa’, ‘Camino Real’, and ‘Dover’). Means followed by the same letter and the same color in the projection bars do not differ by the Scott–Knott test (p < 0.01).
Five groups were formed for firmness, showing higher values for the group composed of the genotypes RVCA 16CR-39 (6.0 N), RVCA 16CR-50 (5.9 N), RVDA 11CR-110 (5.9 N), RVCA 16CR-22 (5.7 N), RVCS 44CR-110 (5.7 N), RVCS 44CR-66 (5.7 N), RVDA 11CR-22 (5.7N), RVDA 11CR-90 (5.7N), RVFS 07CR-113 (5.7N), RVCA 16CR-94 (5.6N), RVCA 16CR-43 (5.6 N), RVDA 11CR-29 (5.6 N), RVFC 07 CR-97 (5.6 N), RVFS 07CR-61 (5.5 N), RVDA 11CR-164 (5.5 N), RVDA 11CR-185 (5.4 N), and RVFOS 07CR-97 (5.4 N) (Figure 2B). These genotypes were considered better than the commercial cultivars Dover (3.4 N), Camino Real (5 N), and Camarosa (4.6 N) (Figure 2B).
The objective of our breeding program is to obtain superior genotypes with suitable production and fruit quality, which can often be laborious. In this regard, selection indices have been recommended at this stage, since they allow accurate prediction for multiple traits at the same time. Figure 3 represents the analysis of the genotype-ideotype selection index, based on six representative and important variables for the fresh strawberry market (TFM, CFM, AMCF, FIR, and SS), considering consumer and producer preference. The genotypes RVCS 44CR-130, RVDA 11CR-125, RVFS 07CR-61, RVDA 11CR-61, RVCS 44CR-124, RVDA 11CR-42, RVFOS 07CR-97, RVCS 44CR-78, RVDA 44CR-28, RVCS 44CR-110, and RVDA 11CR-29 were selected as the most promising (Figure 3).
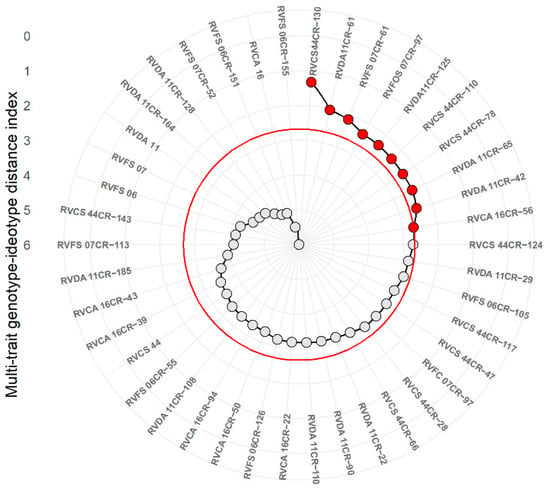
Figure 3.
Multi-trait distance index plot of selected and unselected strawberry genotypes (Fragaria × ananassa Duch.) by using the genotype-ideotype selection index.
Boxplot analysis (Figure 4) was performed on the population evaluated and pointed out the outliers, which make it possible to visualize the existence of superior genotypes based on the estimated median and standard deviation. For total fruit mass (TFM), only two genotypes were selected, with values lower than those observed in the initial population (Figure 4A). In the initial population, the median showed a smaller distance from the first quartile, demonstrating positive data asymmetry. The median is the most indicated measure of central tendency when the data have an asymmetric distribution, since the arithmetic mean is influenced by the extreme values. For the second population, the centralization of the median characterizes symmetrical data, but it is worth noting the presence of outliers, which are above the detection limit. For commercial fruit mass (CFM), the first population is characterized by positive asymmetry of values, with the second population showing more asymmetric data, with the median situated in the second quartile. Two outliers were above the detection limit (Figure 4B).
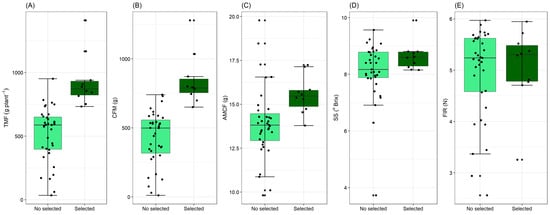
Figure 4.
Boxplot analysis for selected strawberry genotypes (Fragaria × ananassa Duch.) compared with unselected genotypes showing outliers. Total mass of fruits (TMF)—(A), commercial fruit mass (CFM)—(B), Average mass of commercial fruits (AMCF)—(C), soluble solids (SS)—(D) and fruit firmness (FFIRM)—(E).
Regarding the mass of commercial fruit (AMCF), the data dispersion characterizes a smaller interquartile range, indicating less variation between the genotypes. However, this symmetry is mischaracterized in the second population, as the median moved towards the first quartile, showing a greater positive asymmetry of the data. The outliers are very close to the detection limit, which allows us to assume that for this character in the final population, the variation between genotypes was smaller (Figure 4C). In regards to SS content, it was observed that the data are negative and asymmetrical since the median is closer to the last quartile. In the original population, the outliers are concentrated below the detection limit, while in the selected population, there are outliers above the limit, and the data are characterized by a positive asymmetry (Figure 4D). For the pulp firmness (FIR) character in the original population, it is possible to observe greater data dispersion, with the largest interquartile range. The outliers are situated below the detection limit as well as observed in the final population (Figure 4E).
Principal component analysis (PCA) allows us to extract important information from a data set containing multiple inter-correlated quantitative variables. This is possible since it reshapes data along principal component axes, reducing their dimensionality in an interpretable way [1,36]. The PCA showed that most of the variance (76.53%) was explained by the two first components. All selected genotypes belong to clusters 2 (six genotypes) and 4 (two genotypes). Among these, seven genotypes were selected, with the productive traits as the main component and the others based on SS content and pulp firmness (FIR) (Figure 5).
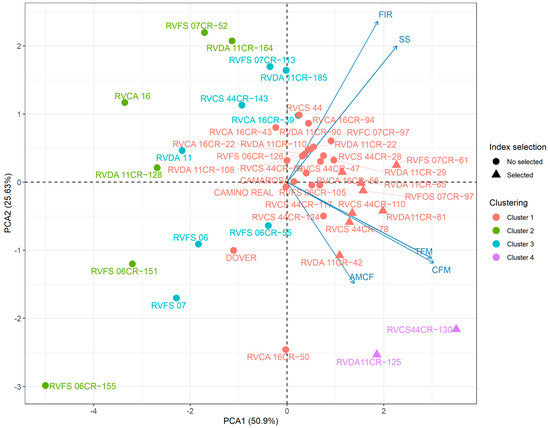
Figure 5.
Main component analysis for agronomic traits of short-day strawberry genotypes (Fragaria × ananassa Duch.) showing the selected genotypes and their correlators with the evaluated characters.
Positive and significant correlations were found between total fruit mass (TFM), commercial fruit mass (CFM), and the mean mass of commercial fruits (AMCF), which are positioned in the same graph quadrant. With the projection of the vectors referring to SS and FIR, it is not possible to affirm the existence of a correlation with the production characters. Principal component 1 explained 51.3% of the total variance, and the variables with higher weight on this component were TFM, CFM, and AMCF. The principal component 2 explained 26.2% of the total variance, represented mainly by SS and FIR.
In the present study, PCA played a crucial and highly significant role in establishing relationships between the evaluated variables and the analyzed genotypes (Figure 5). Dealing with the multitude of characteristics has been a widely encountered challenge in studies aimed at assessing the performance of strawberry genotypes, as numerous components are meticulously analyzed. This inherent complexity calls for the application of robust statistical techniques like PCA to assist in interpreting the results and identifying underlying patterns and trends within the obtained data.
3.2. Second Experiment: Post-Harvest Characterization of Selected Genotypes
The 10 most promising genotypes based on the genotype ideotype selection index were further evaluated for fruit quality traits, compared to commercial cultivars and male parents.
For the soluble solids content, the genotypes presented values between 10.29 and 6.94 °Brix. RVCA 16 (10.29), ‘Camarosa’ (9.85), and RVFS 07CR-61 (9.83) genotypes had the highest values, and the cultivar Dover (6.94) had the lowest (Figure 6A). The titratable acidity (TA) ranged from 0.566 to 0.937 g 100−1. The genotypes RVFS 07CR-61 (0.937 g 100−1) followed by RVCS 44 (0.899 g 100−1), RVCS 44 CR-28 (0.890 g 100−1), RVCS 44CR-78 (0.875 g 100−1), RVCA 16 (0.863 g 100−1), and RVDA 11 CR-29 (0.844 g 100−1) had the highest values. The cultivar Camino Real (0.566 g 100−1), RVFOS 07CR-97 (0.581 g 100−1), and RVCS 44CR-130 (0.566 g 100−1) genotypes had the lowest values (Figure 6B). The ratio SS/AT is an important attribute because it reveals the balance between sweetness and acidity and is an important variable for the evaluation of fruit flavor. The higher the ratio, the sweeter the fruit. The highest ratio values were for genotypes RVFOS 07CR-97 (14.83), RVCS 44CR-130 (14.71), and ‘Camino Real’ (14.65). The lowest value was for genotype RVCS 44CR-78 (9.84) (Figure 6C).
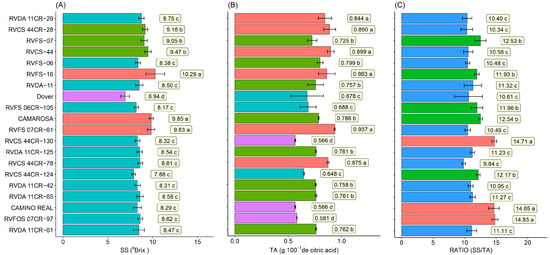
Figure 6.
Soluble solids (SS)—(A), titratable acidity (TA)—(B), and ratio (SS/TA)—(C) of 10 selected strawberry genotypes (Fragaria × ananassa Duch.). Means followed by the same letter and the same color in the projection bars do not differ by the Scott–Knott test (p < 0.01).
A great variation was observed for ascorbic acid (AC), phenolic compounds (PC), and anthocyanins (ANT) content. For ascorbic acid (AC), the levels ranged from 39.6 to 86.9 mg.100 g−1. The highest values were for genotypes RVFS 06 (86.9 mg.100 g−1) and RVCA 16 (80.0 mg.100 g−1) (first-generation genotypes), cultivar Dover (81.3 mg.100 g−1) and RVCS 44 CR-28 (83.9 mg.100 g−1), and RVDA 11 CR-29 (82.2 mg.100 g−1) (second-generation genotypes). The lowest value was for the commercial cultivar Camino Real (39.0 mg.100 g−1) (Figure 7A). For phenolic compounds (PC), the levels ranged from 469 to 171 mg.100 g−1. The highest value was for genotype RVCS 44 (469 mg.100 g−1), isolated in the first group, followed by RVCS 44CR-124 (434 mg.100 g−1), RVFOS 07CR-97 (433 mg.100 g−1), and RVFS 07CR-61 (428 mg.100 g−1) in the second group (Figure 7B). Anthocyanin (ANT) levels ranged from 74.3 to 29.4 mg.100 g−1. The genotypes with the highest values were RVCS 44CR-124 (74.3 mg.100 g−1) and ‘Camarosa’ (71.1 mg.100 g−1). The lowest values were for genotypes RVCA 16 (35.6 mg.100 g−1) and RVDA 11CR-42 (29.4 mg.100 g−1) (Figure 7C).
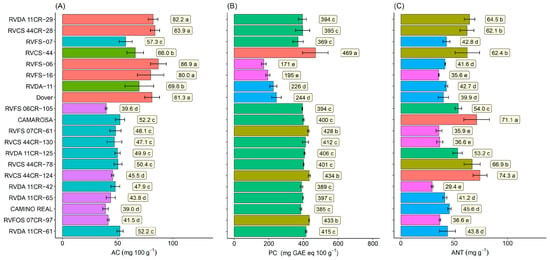
Figure 7.
Ascorbic acid (AC)—(A), phenolic compounds (PC)—(B), and total anthocyanins (ANT)—(C) in the fruits of 10 selected strawberry genotypes (Fragaria × ananassa Duch.). Means followed by the same letter and the same color in the projection bars do not differ by the Scott–Knott cluster test (p < 0.01).
The principal component analysis explained 69.6% of the variation observed among the genotypes evaluated regarding the chemical traits. The genotypes were divided into 4 clusters, in which the first grouped 8 out of 11 selected genotypes in the first experiment, in addition to the cultivars Camino Real (male parent) and RVFS07 (female parent). This cluster was formed according to the ratio SS/TA and the phenolic compounds (PC) means. The second cluster grouped the other selected genotypes and the cultivar Camarosa. The characters that contributed to the formation of this cluster were anthocyanin (ANT) content, SS, and TA. The third cluster was formed by the cultivar Dover and the female parents RVDA11 and RVFS06. The last cluster was formed only by the female parent, RVFS16. In these two clusters, the ascorbic acid (AC) content was the main variable for the grouping (Figure 8).
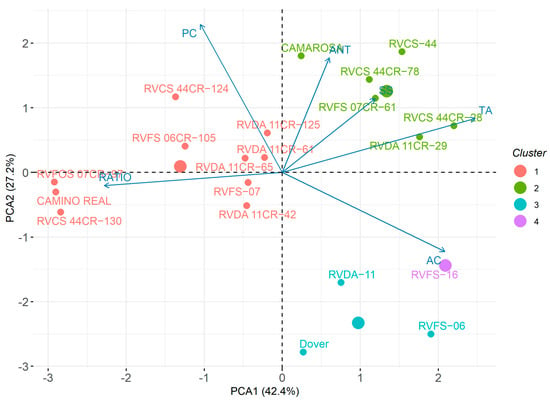
Figure 8.
Principal component analysis graph for strawberry genotypes (Fragaria × ananassa Duch.) based on fruit chemical traits.
From the PCA it was possible to establish correlations between characters, in which the vectors related to the content of SS, TA and ANT are projected in parallel in the quadrant, characterizing a positive correlation among them. In contrast, these characters are negatively correlated with the ratio SS/TA.
Among the characteristics desired by strawberry growers, commercial yield is the most important, as it directly reflects profitability. The adoption of cultivars that require the accumulation of cold hours for floral induction prevents the southern hemisphere from reaching the productive levels of the northern hemisphere [37]. The mean production per plant of the same cultivar in the northern hemisphere can reach up to 200% higher than in the southern hemisphere. When evaluating the yield of short-day strawberry cultivars, Camarosa and Camino Real in tropical climates [38] presented values from 600 to 700 g/plant. Antunes et al. [16] reported yields of 877.51, 773.37, and 771.09 g/plant for the cultivars Camarosa, Galexia, and Florida Festival in subtropical climates, respectively, while for the cultivars Camarosa, Ventana, Palomar, and Mojave grown in the northern hemisphere, the means were 2137, 2616, 2667, and 2271 g/plant, respectively [7]. In our research, the selected genotypes showed yields equivalent to or superior to the control cultivars Dover (589 g/plant), Camarosa (654.9 g/plant), and Camino Real (633.1 g/plant), with yields of 951.3, 940.0, 1166.7, and 1410.12 g/plant for RVFS06CR-105, RVDA11CR-61, RVDA11CR-125, and RVCS44CR-130, respectively (Figure 1). Considering these findings, it is evident that, under tropical conditions, the genotypes selected in our breeding program are superior to the cultivars currently adopted by Brazilian strawberry growers. From these results, it is also important to highlight the importance of selection being carried out in environments similar to commercial cultivation, in view of the genotype-environment interaction. Figure 9 shows the fruit production from the genotype RVCS44CR-130, with a mean yield of 1410.12 g/plant. In addition, fruits that serve the consumer market in terms of visual quality, that is, good size, shape, and external color.
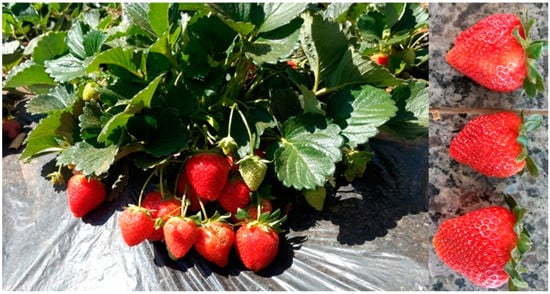
Figure 9.
Strawberry fruit production from the genotype RVCS44CR-130.
Although influenced by the environment and agricultural practices, the chemical characteristics of the fruit are prominently delineated by the genotype, which often outweighs the impact of external factors [39]. In our study, the SS content of the selected genotypes was higher than that of the commercial cultivars used as controls, except for ‘Camarosa’ in the second experiment (Figure 2 and Figure 6). Selection in the tropical/subtropical environment brings some physiological advantages that allow greater accumulation of soluble solids, such as higher light intensity conditions and consequently a higher photosynthetic rate [10]. However, this condition is intrinsically associated with the genotypic constitution of the cultivar [40,41,42].
Fruit firmness decreased sharply on the first days of ripening and has been associated with increased enzymatic activity and loss of turgor in fruit cells [43]. Firmness is considered one of the main characteristics for the consumption of fresh fruits, enabling better handling and transport conditions and, thus, increasing the shelf life [44]. The selection of genotypes in environments similar to those of cultivation allows for interesting strategies, especially when considering the logistics of storage and distribution. Thus, this character was carefully studied during the research in order to obtain firmer and more durable fruit. In our study, it was possible to obtain fruit with higher firmness for selected genotypes compared to commercial cultivars (Figure 2). Cervantes et al. [45] observed a very strong and negative relationship between temperature and the firmness of strawberry fruit, which was not confirmed in our research. It is noteworthy that, despite the relationship between firmness and the environment, considerable variations were not observed throughout the harvest period, which reinforces the use of this character as a selection criterion in strawberry breeding programs.
The objective of our breeding program is to obtain superior genotypes with adequate production and fruit quality, which can often be difficult. In this sense, selection indices have been recommended at this stage, as they allow an accurate prediction for multiple characteristics at the same time. In our study, the five most representative and important variables for the fresh fruit market (TFM, CFM, AMCF, FIRM, and SS) were chosen for the application of the multi-trait index based on the genotype-ideotype distance index [46].
The boxplot analysis (Figure 4) highlights the differences between the original and selected populations, allowing the identification of outliers that represent superior individuals for each analyzed character within the populations. The graphic dispersion and interquartile distance allow us to establish inferences about the variation within and between populations. In general, the interquartile distances in the improved (selected) populations were smaller, indicating less variation and greater stability and homogeneity of the genotypes, which was already expected. These conditions did not interfere with the emergence of outliers. These results were expected, considering the number of individuals evaluated and the specificity of the selection standards established in the program.
With the reduction of the population, the outliers that allow the visualization of the existence of superior genotypes were identified, based on the estimated median and standard deviation. It is important to note that the outliers dispersed along the standard deviation projection shown in Figure 4 mostly confirm the genotypes that stood out in the mean test and in the ranking by the applied selection index. For the total fruit mass (TFM) and commercial fruit mass (CFM) (Figure 4A,B), for example, RVCS 44CR-130 and RVDA 11CR-125 stood out among the 10 selected genotypes, which is in agreement with the cluster analysis in Figure 1. The outliers in Figure 4D are the genotypes RVFS 07CR-61, RVDA 11CR-185, and RVCS 44CR-28, which presented the highest levels of soluble solids. Two of them (RVFS 07CR-61 and RVCS 44CR-28) are among the 10 genotypes selected as the most promising. It is also noteworthy that among the ten selected genotypes, some showed outliers below the median values estimated in the boxplots but higher than most of the unselected genotypes of the respective crossbred populations.
The graphic dispersion generated in the PCA representation formed four groups. Groups 2 and 4 showed consistency with the genotype-ideotype selection index and the clustering of the Scott–Knott test. The RVCS 44CR-130 and RVDA 11CR-125 genotypes were placed in the same group (group 4) in the lower quadrant of the Y axis due to their higher variables correlated with yield (PTF and PCF). The other genotypes selected are in cluster 2, positioned in the center of the graphs, which means that they present mean values for all traits, thus making it difficult to identify the most influential traits. Clusters 1 and 3 were not highlighted for any of the variables. Furthermore, none of these genotypes was selected by the selection index. The selection index was able to weight the genotypes that combined adequate values for each trait. This consistency between index selection and PCA analysis is important for the reliability and robustness of the selection process (Figure 5).
The second PCA, referring to the postharvest characters for a smaller number of genotypes, also presented similarity with some results observed in the other analyses. For example, cluster 2, which grouped the genotypes by considering the ANT, SS, and TA contents, includes the genotypes RVCS 44CR-61 and ‘Camarosa’ (Figure 6 and Figure 8).
The comparison of the two PCAs (Figure 5 and Figure 8) allows us to observe the presence of genotypes in the same quadrant of vector projection for SS, demonstrating that, even at different times of analysis, these genotypes maintained the initial parameters of fruit quality for which they were selected. The correspondence of information between the different forms of data analysis evidences the efficiency of the selection process; that is, several times, the same genotypes were grouped in all methods based on production, quality, and post-harvest traits.
4. Conclusions
Genetic variability among the evaluated genotypes was assessed and confirmed based on productive traits (total fruit mass, commercial fruit mass, and mean mass of commercial fruits), soluble solids content, and fruit firmness. Multivariate analysis using the genotype (ideotype) selection index and principal components allowed the identification of genotypes that present attractive traits for new cultivars. These selected genotypes were further evaluated for fruit quality traits. The RVFS06CR-105, RVDA11CR-61, RVDA11CR-125, and RVCS44CR-130 were the most promising strawberry genotypes, showing higher yields and quality traits than the commercial varieties used as controls. The multivariate analysis used in the data analysis showed repeatability of the information, ensuring consistency in the selection of genotypes. These genotypes showed potential for cultivation and are also a source of variability in crosses for new selections.
Author Contributions
I.F.L.d.S., A.R.Z. and J.T.V.d.R. conceived and designed the experiments. I.F.L.d.S. and E.L.d.S. performed the experiments. G.D.S. analyzed the data. L.E.-D.C., J.T.V.d.R. and S.R.R. wrote the manuscript. All authors have read and agreed to the published version of the manuscript.
Funding
This research received no external funding.
Data Availability Statement
Data are contained within the article.
Acknowledgments
To the State University of Londrina, UEL for the availability of the infrastructure, State University of the Midwest, Unicentro for the partnership in biochemical analyses, the National Council for Scientific and Technological Development, CNPq, Araucária Foundation and Secretariat of Science, Technology and Higher Education of the Paraná, SETI, for promoting research. The Coordination for the Improvement of Higher Education Personnel for granting research grants.
Conflicts of Interest
The authors declare no conflict of interest.
References
- Šamec, D.; Maretić, M.; Lugarić, I.; Mešić, A.; Salopek-Sondi, B.; Duralija, B. Assessment of the differences in the physical, chemical and phytochemical properties of four strawberry cultivars using principal component analysis. Food Chem. 2016, 194, 828–834. [Google Scholar] [CrossRef]
- López-Valencia, D.; Sánchez-Gómez, M.; Acuña-Caita, J.F.; Fischer, G. Physicochemical properties of seven outstanding straberry (Fragaria × ananassa Duch.) varieties cultivated in Cundinamarca (Colombia) during maturation. Corpoica Cienc. Tecnol. Agropecu. 2018, 19, 147–162. [Google Scholar] [CrossRef]
- Basu, A.; Nguyen, A.; Betts, N.M.; Lyons, T.J. Strawberry as a functional food: An evidence-based review. Crit. Rev. Food Sci. Nutr. 2014, 54, 790–806. [Google Scholar] [CrossRef] [PubMed]
- Michalska, A.; Carlen, C.; Heritier, J.; Andlauer, W. Profiles of bioactive compounds in fruits and leaves of strawberry cultivars. J. Berry Res. 2017, 7, 71–84. [Google Scholar] [CrossRef]
- Barth, E.; Resende, J.T.V.; Moreira, A.F.P.; Mariguele, K.H.; Zeist, A.R.; Silva, M.B.; Stulzer, G.C.G.; Mafra, J.C.M.; Gonçalves, L.S.A.; Roberto, S.R.; et al. Selection of Experimental Hybrids of Strawberry Using Multivariate Analysis. Agronomy 2020, 10, 598. [Google Scholar] [CrossRef]
- Perrotte, J.; Gaston, A.; Potier, A.; Petit, A.; Rothan, C.; Denoyes, B. Narrowing down the single homoeologous Fa PFRU locus controlling flowering in cultivated octoploid strawberry using a selective mapping strategy. Plant Biotechnol. J. 2016, 14, 2176–2189. [Google Scholar] [CrossRef]
- Ruan, J.; Yang, C.; Wang, G.; Wu, L.; Li, S.; Tao, P.; Wang, J. Segregation ratio in selfed and crossed progenies demonstrates single dominant gene inheritance of day-neutrality in strawberry. Hortic. Environ. Biotechnol. 2017, 58, 585–590. [Google Scholar] [CrossRef]
- Lobell, D.B.; Field, C.B. California perennial crops in a changing climate. Clim. Chang. 2011, 109, 317–333. [Google Scholar] [CrossRef]
- Cui, M.; Pham, M.D.; Hwang, H.; Chun, C. Flower development and fruit malformation in strawberries after short-term exposure to high or low temperature. Sci. Hortic. 2021, 288, 110308. [Google Scholar] [CrossRef]
- Mackenzie, S.J.; Chandler, C.K.; Hasing, T.; Whitaker, V. The role of temperature in the late-season decline in soluble solids content of strawberry fruit in a subtropical production system. HortScience 2011, 46, 1562–1566. [Google Scholar] [CrossRef]
- Moreira, A.F.P.; de Resende, J.T.V.; Shimizu, G.D.; Hata, F.T.; do Nascimento, D.; Oliveira, L.V.B.; Zanin, D.S.; Mariguele, K.H. Characterization of strawberry genotypes with low chilling requirement for cultivation in tropical regions. Sci. Hortic. 2022, 292, 110629. [Google Scholar] [CrossRef]
- Resende, J.T.V.; Gabriel, A.; Moreira, A.F.P.; Gonçalves, L.S.A.; Resende, N.; Goes, C.D.M.; Zanin, D.S. Application of mixed models in the study of the adaptability and stability of short-day and neutral-day strawberry cultivars. Res. Soc. Dev. 2020, 9, 110953104. [Google Scholar] [CrossRef]
- Corrêa, J.V.W.; Weber, G.G.; Zeist, A.R.; Resende, J.T.V.; Silva, P.R. ISSR Analysis Reveals High Genetic Variation in Strawberry Three-Way Hybrids Developed for Tropical Regions. Plant Mol. Biol. Rep. 2021, 39, 566–576. [Google Scholar] [CrossRef]
- Sønsteby, A.; Hytonen, T. Manipulating Flower Induction Through Temperature and Photoperiod Fluctuations. Int. J. Fruit Sci. 2005, 5, 17–27. [Google Scholar] [CrossRef]
- Van Delm, T.; Melis, P.; Stoffels, K.; Baets, W. The Effect of Long-Day Treatment on Runners and Inflorescences on Everbearing Strawberry Cultivar ‘Capri’. In XXIX International Horticultural Congress on Horticulture: Sustaining Lives, Livelihoods and Landscapes (IHC2014); ISHS: Leuven, Belgium, 2014; Volume II 1117, pp. 285–290. [Google Scholar] [CrossRef]
- Antunes, L.E.C.; Ristow, N.C.; Krolow, A.C.R.; Carpenedo, S.; Reisser Júnior, C. Yield and quality of strawberry cultivars. Hortic. Bras. 2010, 28, 222–226. [Google Scholar] [CrossRef]
- Camargo, L.K.P.; Pilati, L.; Zchonski, F.L.; de Resende, J.T.V.; Silva, P.R. Genetic diversity of Brazilian farmers-made strawberry genotypes and their relationship with commercial cultivars. Genet. Resour. Crop Evol. 2022, 69, 1879–1888. [Google Scholar] [CrossRef]
- Cockerton, H.M.; Karlström, A.; Johnson, A.W.; Li, B.; Stavridou, E.; Hopson, K.J.; Li, B.; Stavridou, E.; Hopson, K.J.; Whitehouse, A.B.; et al. Genomic informed breeding strategies for strawberry yield and fruit quality traits. Front. Plant Sci. 2021, 12, 2102. [Google Scholar] [CrossRef]
- Vieira, S.D.; Souza, D.C.; Martins, I.A.; Ribeiro, G.H.M.R.; Resende, L.V.; Ferraz, A.K.L.; Galvão, A.G.; Resende, J.T.V. Selection of experimental strawberry (Fragaria × ananassa) hybrids based on selection índices. Genet. Mol. Res. 2017, 16, gmr16019052. [Google Scholar] [CrossRef]
- Kaczmarska, E.; Gawroński, J. Agronomic performance and heterosis of strawberry inbred hybrids obtained by top-cross mating system. Acta Sci. Pol. Hortorum Cultus 2019, 18, 85–97. [Google Scholar] [CrossRef]
- Sieczko, L.; Masny, A.; Pruski, K.; Żurawicz, E.; Mądry, W. Multivariate assessment of cultivars’ biodiversity among the Polish strawberry core collection. Hortic. Sci. 2015, 42, 83–93. [Google Scholar] [CrossRef]
- Galvão, A.G.; Resende, L.V.; Maluf, W.R.; Resende, J.T.V.; Ferraz, A.K.L.; Marodin, J.C. Breeding new improved clones for strawberry production in Brazil. Acta Sci. Agron. 2017, 39, 149–155. [Google Scholar] [CrossRef]
- Barth, E.; de Resende, J.T.V.; Mariguele, K.H.; de Resende, M.D.V.; da Silva, A.L.B.R.; Ru, S. Multivariate Analysis Methods Improve the Selection of Strawberry Genotypes with Low Cold Requirement. Sci. Rep. 2022, 12, e11458. [Google Scholar] [CrossRef] [PubMed]
- Furlani, P.R.; Fernandez Júnior, F. Cultivo Hidropônico de Morango em Ambiente Protegido. In Simpósio Nacional do Morango & Encontro de Pequenas Frutas e Frutas Nativas do Mercosul; Embrapa: Pelotas, Brazil, 2004; Volume 2, pp. 102–115. [Google Scholar]
- Mendiburu, F. Agricolae: Statistical procedures for agricultural research. R Package Version 2014, 1, 1–4. [Google Scholar]
- Sou, T.; Nagashima, A.R. KMggplot2: R Commander Plug-in for Data Visualization with ‘ggplot2′; R Project: Vienna, Austria, 2018. [Google Scholar]
- Husson, F.; Josse, J.; Le, S.; Mazet, J. FactoMineR: Multivariate Exploratory Data Analysis and Data Mining with R; Version 1.42; R Project: Vienna, Austria, 2019. [Google Scholar]
- Zeist, A.R.; Resende, J.T.V. Strawberry breeding in Brazil: Current momentum and perspectives. Hortic. Bras. 2019, 37, 7–16. [Google Scholar] [CrossRef]
- Instituto Adolfo Lutz. Normas Analíticas do Instituto Adolfo Lutz. Métodos Físico-Químicos para Análises de Alimentos, 4th ed. (1st Digital ed.); Instituto Adolfo Lutz: São Paulo, Brazil, 2008. [Google Scholar]
- Bucić-Kojić, A.; Planinić, M.; Tomas, S.; Bilić, M.; Velić, D. Study of solid–liquid extraction kinetics of total polyphenols from grape seeds. J. Food Eng. 2007, 81, 236–242. [Google Scholar] [CrossRef]
- AOAC. Official Methods of Analysis of the Association of Official Analytical Chemists, 40th ed.; AOAC: Washington, DC, USA, 1984. [Google Scholar]
- Benassi, M.T.; Antunes, A.J. A comparison of metaphosphoric and oxalic acids as extractants solutions for the determination of vitamin C in selected vegetables. Arq. Biol. Tecnol. 1988, 31, 507–513. [Google Scholar]
- AOAC. Official Methods of Analysis of the Association of Official Analytical Chemists, 16th ed.; AOAC: Arlington, TX, USA, 1995; Volume 1. [Google Scholar]
- Ferreira, D.F. Programa Sisvar; Versão 5.1; Universidade Federal de Lavras: Lavras, Brazil, 2016. [Google Scholar]
- R Core Team. R: A Language and Environment for Statistical Computing; R Foundation for Statistical Computing: Vienna, Austria, 2022; Available online: https://www.R-project.org/ (accessed on 3 February 2020).
- Pinheiro, D.F.; Resende, J.T.V.D.; Constantino, L.V.; Hata, F.T.; Hata, N.N.Y.; Lustosa, S.B.C. Physical, biochemical, and sensory properties of strawberries grown in high-altitude tropical climate. Ciência Agrotecnologia 2021, 45, e008221. [Google Scholar] [CrossRef]
- Park, S.W.; Kim, S.K.; Kwack, Y.; Chun, C. Simulation of the number of strawberry transplants produced by an autotrophic transplant production method in a plant factory with artificial lighting. Horticulturae 2020, 6, 63. [Google Scholar] [CrossRef]
- Gabriel, A.; Resende, J.T.V.; Zeist, A.R.; Resende, L.V.; Resende, N.C.V.; Galvão, A.G.; Zeist, R.A.; Lima Filho, R.B.; Corrêa, J.V.W.; Camargo, C.K. Phenotypic stability of strawberry cultvars assessed in three environments. Genet. Mol. Res. 2018, 33, 3. [Google Scholar] [CrossRef]
- Kyriacou, M.C.; Rouphael, Y. Towards a new definition of quality for fresh fruits and vegetables. Sci. Hortic. 2018, 234, 463–469. [Google Scholar] [CrossRef]
- Sone, K.; Mochizuki, T.; Noguchi, Y. Relationship between stability of eating quality of strawberry cultivars and their sugar and organic acid contents. J. Jpn. Soc. Hortic. Sci. 2000, 69, 736–743. [Google Scholar] [CrossRef]
- Dusenge, M.E.; Duarte, A.G.; Way, D.A. Plant carbon metabolism and climate change: Elevated CO2 and temperature impacts on photosynthesis, photorespiration and respiration. New Phytol. 2019, 221, 32–49. [Google Scholar] [CrossRef] [PubMed]
- Osatuke, A.; Pritts, M. Strawberry flavor is influenced by the air temperature differential during fruit development but not management practices. Agronomy 2021, 11, 606. [Google Scholar] [CrossRef]
- Pyrotis, S.; Abayomi, L.; Rees, D.; Orchard, J. Effect of temperature and humidity on strawberry firmness at two different sites in the Huelva Region of Spain. Acta Hortic. 2012, 26, 567–570. [Google Scholar] [CrossRef]
- Nasrin, T.A.A.; Rahman, M.A.; Hossain, M.A.; Islam, M.N.; Arfin, M.S. Postharvest quality response of strawberries with aloe vera coating during refrigerated storage. J. Hortic. Sci. Biotechnol. 2017, 92, 598–605. [Google Scholar] [CrossRef]
- Cervantes, L.; Ariza, M.T.; Miranda, L.; Lozano, D.; Medina, J.J.; Soria, C.; Martínez-Ferri, E. Stability of fruit quality traits of different strawberry varieties under variable environmental conditions. Agronomy 2020, 10, 1242. [Google Scholar] [CrossRef]
- Barth, E.; Resende, J.T.V.; Zeist, A.R.; Mariguele, K.H.; Zeist, R.A.; Gabriel, A.; Camargo, C.K.; Piran, F. Yield and quality of strawberry hybrids under subtropical conditions. Genet. Mol. Res. 2019, 18, e18156. [Google Scholar] [CrossRef]
Disclaimer/Publisher’s Note: The statements, opinions and data contained in all publications are solely those of the individual author(s) and contributor(s) and not of MDPI and/or the editor(s). MDPI and/or the editor(s) disclaim responsibility for any injury to people or property resulting from any ideas, methods, instructions or products referred to in the content. |
© 2023 by the authors. Licensee MDPI, Basel, Switzerland. This article is an open access article distributed under the terms and conditions of the Creative Commons Attribution (CC BY) license (https://creativecommons.org/licenses/by/4.0/).