Article

Morphological and Molecular Characterization of Micromeria croatica (Lamiaceae), an Endemic and Potentially Valuable Horticultural Species of the Dinaric Alps

1
Faculty of Science, University of Zagreb, Marulićev trg 9A, 10000 Zagreb, Croatia
2
Centre of Excellence for Biodiversity and Molecular Plant Breeding, Svetošimunska Cesta 25, 10000 Zagreb, Croatia
3
Faculty of Agriculture, University of Zagreb, Svetošimunska Cesta 25, 10000 Zagreb, Croatia
4
Croatian Paying Agency for Agriculture, Fisheries and Rural Development, Ulica Grada Vukovara 269d, 10000 Zagreb, Croatia
5
Faculty of Forestry, University of Sarajevo, Zagrebačka 20, 71000 Sarajevo, Bosnia and Herzegovina
6
Slovenian Forestry Institute, Večna Pot 2, 1000 Ljubljana, Slovenia
7
Academy of sciences and arts of Bosnia and Herzegovina, Bistrik 7, 71000 Sarajevo, Bosnia and Herzegovina
8
Faculty of Natural Sciences and Mathematics, University of Montenegro, Džordža Vašingtona bb, 81 000 Podgorica, Montenegro
9
Faculty of Pharmacy and Biochemistry, University of Zagreb, A. Kovačića 1, 10000 Zagreb, Croatia
*
Author to whom correspondence should be addressed.
Horticulturae 2023, 9(4), 418; https://doi.org/10.3390/horticulturae9040418
Submission received: 28 February 2023 / Revised: 8 March 2023 / Accepted: 21 March 2023 / Published: 23 March 2023
(This article belongs to the Collection Prospects of Using Wild Plant Species in Horticulture)

Abstract

:
Due to climate extremes and limited natural resources, especially water, we can expect increased demand in the future for species that can better tolerate climate extremes such as drought. One potentially valuable horticultural species is the endemic species of the Dinaride Mountains Micromeria croatica (Pers.) Schott (family Lamiaceae). It grows in the crevices of carbonate rocks, extending from an altitude of 150 m to more than 2000 m. This study aims to provide additional insight into the genetic and morphological diversity of this endemic species, focusing on valuable horticultural traits. To achieve this goal, morphological and molecular analyses were performed on ten natural populations. Through STRUCTURE and PCoA analyses, ten M. croatica populations were placed into western and eastern genetic groups, with several individuals from western populations assigned to the eastern group and vice versa. These atypical individuals assigned to the new genetic group by BAPS analysis indicate gene flow between western and eastern populations. Similarly, an analysis of molecular variance revealed fewer genetic differences than within studied populations. Both PCA and CANDISC analysis based on eleven morphological traits largely confirmed the existence of two slightly different genetic groups. Two populations containing plants with the most flowers per shoot, one with white-flowered individuals, one with the roundest leaves, and one with the narrowest leaves proved to be the most horticulturally valuable. The genetic and morphological variability found should be a sufficient basis for the potential selection of M. croatica populations and individuals for horticultural purposes.

1. Introduction

Bearing in mind climate changes and the limitation of natural resources, the need for more rational management of natural resources arises. Among such limited natural resources, we can include water, whose availability for horticultural needs will probably decrease. On the other hand, humans will always try to make the environment in which they live more attractive by planting decorative species. The possible compromise between these two facts is the planting of smaller and more drought-tolerant species. One such tiny, drought-tolerant species is Micromeria croatica (Pers.) Schott (family Lamiaceae), an endemic species of the Dinaric Mountains. It belongs to genus Micromeria Benth. (section Micromeria) which includes 54 annual and perennial herbs, sub-shrubs, and shrubs distributed from the Mediterranean to South Africa and Madagascar and from China to the Macaronesian Archipelago [1,2,3]. Twenty-one Micromeria species were described for Europe, with more than half of these species occurring in the Balkan Peninsula [4].
M. croatica is a perennial plant with numerous, 5–30 cm long, simple, or slightly branched, erect or sometimes ascending stems which are mostly densely patent-pubescent.
Opposite leaves are stalkless, 5–8 mm long, with an entire and slightly revolute margin, more or less hairy. Leaves are orbicular, elliptic, or ovate. Hermaphroditic flowers are arranged from four to eight (rarely up to 14) in lax verticillasters, exceeding the subtending leaves. The tubular calyx is 5–6 mm long, with 15 veins, pubescent. The corolla is sympetalous, two-lipped, with a straight tube, pink–purple, or rarely white [4,5]. Flowers are appearing from (June) July till August (September). M. croatica grows in the crevices of carbonate rocks, on open or semi-shady places, extending from the altitude of 150 m to more than 2000 m a.s.l [5,6]. It is also promising as a horticultural species for which two varieties and four forms were listed by Bräuchler et al. [1]. As a decorative, little, non-invasive species adapted to shallow, nutrient-poor soils and dry habitats M. croatica is suitable for planting in rock gardens. Use of M. croatica as an ornamental plant suitable for small rocky gardens was discussed by Karlović et al. [7] while the protocol for micropropagation and rooting of M. croatica was designed by Kereša et al. [8]. Additionally, Tošić et al. [9] investigated differences in phytochemical composition and biological activity between wild-growing and in vitro-propagated M. croatica plants. Some investigations also suggest that M. croatica could be useful in the treatment or even prevention of human diseases in which free radicals and other reactive oxygen species have been implicated [10,11]. Several Micromeria Benth. and closely related Clinopodium L. species have already entered the repertoire of medicinal and ornamental plants (Table 1).
This study aims to obtain additional knowledge about endemic species M. croatica with emphasis on horticultural valuable traits. To achieve this goal, morphological and molecular studies were performed at the population level on ten M. croatica populations.

2. Materials and Methods

2.1. Plant Material

Collection of plant material of Micromeria croatica was performed during the blooming period from June to August 2018 at ten randomly selected populations within the natural distribution area in Croatia, Bosnia and Herzegovina, and Montenegro (Table 2, Figure 1 and Figure 2). Voucher specimens of herbal material were deposited in the “Fran Kušan” Herbarium (HFK-HR), Faculty of Pharmacy and Biochemistry, University of Zagreb, Zagreb, Croatia. For morphological investigations, two shoots per each of the ten plants per population (locality) were collected and herbarized. For molecular analysis, several young leaves from four to five plants per population were collected and dried in plastic bags containing silica gel and stored for further use in DNA analysis.

2.2. Molecular Analysis

2.2.1. DNA Isolation

Genomic DNA was isolated using a commercial DNA isolation kit (GenElute™ Plant Genomic DNA Miniprep Kit, Sigma-Aldrich®, Darmstadt, Germany). Concentrations and quality of DNA were measured using a nanophotometer P330 (Implen®, München, Germany). Amplified fragment length polymorphism (AFLP) technique developed by Vos et al. [20] was carried out according to the modified protocol described by Carović-Stanko et al. [21]. Four primer combinations were used for selective amplification: VIC-EcoRI-ACG + Tru1I-CGA, NED-EcoRI-AGA + Tru1I-CGA, FAM-EcoRI-ACA + Tru1I-CGA, and PET-EcoRI-ACC + Tru1I-CGA.

2.2.2. AFLP Data Analysis

Within Population Diversity

The obtained AFLP fragments were scored as present (1) or absent (0). The R package AFLPdat (Ehrich, D., Department of Arctic and Marine Biology, UiT The Arctic University of Norway, Tromsø, Norway) [22] was used to calculate the proportion of polymorphic markers (%P) and the frequency of down-weighted marker values (DW) [23].
The Shannon information index [24,25] was calculated as I = −Σ (pi log2 pi), where pi is the phenotypic frequency. AFLP-Surv. v. 1.085 (Vekemans, X., Laboratoire de Génétique et Ecologie Végétale, Université Libre de Bruxelles, Bruxelles, Belgium) [26] was used to calculate genetic diversity (HE) following a Bayesian approach [27] assuming Hardy–Weinberg equilibrium (FIS = 0).

Population Differentiation and Structure

The principal coordinate analysis (PCoA) based on Dice’s distance matrix [28] between the individual plants was carried out with PAST v. 4.03 (Hammer, Ø., Paleontological Museum, University of Oslo, Oslo, Norway) [29]. Partitioning of total genetic variance among and within populations, as well as between genetic clusters obtained by both STRUCTURE and BAPS (see below), among populations within clusters and within populations, was performed using analysis of molecular variance (AMOVA) [30]. Ten thousand permutations were used to test the variance components in Arlequin v. 3.5.2.2 (Excoffier, L., Lischer, H., Institute of Ecology and Evolution, University of Berne, Bern, Switzerland) [30]. Population differentiation was analyzed by calculating pairwise FST values using a Bayesian approach [27] assuming Hardy–Weinberg equilibrium in AFLP-Surv. v. 1.085 [26].
Genetic structure was determined by a model-based clustering method using STRUCTURE v. 2.3.3 (Pritchard, J.K., Stephens, M., Donnelly, P., Department of Statistics, University of Oxford, Oxford, UK) [31] with 30 runs for each cluster (K) from one to 11 assuming an admixture model and correlated allele frequencies. The runs consisted of a burn-in period of 20,000 steps followed by 10,000,000 Monte Carlo Markov Chain (MCMC) replicates. The computations were performed on the Isabella computer cluster at the University of Zagreb, University Computing Centre (SRCE). The most likely number of clusters (K) was selected by calculating an ad hoc ΔK statistic [32] in STRUCTURE HARVESTER v. 0.6.92 (Earl., D.A., vanHoldt, B.M., Centre for Biomolecular Science and Engineering, Biomolecular Engineering Department, University of California, Santa Cruz, CA, USA) [33]. Runs were clustered and averaged using CLUMPAK (Kopelman, N. M., Mayzel, J., Jakobsson, M., Rosenberg, N. A., Mayrose, I., Department of Molecular Biology and Ecology of Plants, Tel Aviv University, Ramat Aviv, Israel) [34]. Genetic structure was also assessed using BAPS v. 6.0 (Corander, J., Cheng, L., Marttinen, P.; Sirén, J.; Tang, J., Department of Mathematics and Statistics, University of Helsinki, Helsinki, Finland) [35]. BAPS was run with a maximum number of clusters (K) of 10 and each run was repeated 30 times. Population admixture analysis [36] was performed with default settings.

2.3. Isolation by Distance and Assessment of Environmental Dissimilarity

The presence of isolation by distance (IBD) [37] was determined by calculating the linear correlation between the matrix of the natural logarithm of geographic distances (in km) between population pairs and the matrix of pairwise FST/(1 − FST) ratios. The significance of the correlation was determined by performing a Mantel test after 10,000 permutations using NTSYS-pc v. 2.21L (Rohlf, F.J., Applied Biostatistics Inc., New York, NY, USA) [38]. Assessment of environmental dissimilarity (IBED) between populations was based on climate data on temperature and precipitation conditions at each sampling site taken from the WorldClim database at a spatial resolution of approximately 1 km2 available at www.worldclim.org (accessed on 5 November 2022) [39]. The correlation among 19 bioclimatic variables derived from monthly temperature (eleven variables) and precipitation (eight variables) values were calculated with the Pearson coefficient using the CORR procedure in SAS v. 9.3 (SAS Institute Inc., Cary, NC, USA) [40]. Principal component analysis (PCA) was performed using the PRINCOMP procedure in SAS v. 9.3 [40], and the biplot was constructed with the first two principal components showing the populations and bioclimatic variables (as vectors). The pairwise Euclidean distances between population scores on the first two principal components were used as measures of environmental dissimilarity between populations. First, we correlated the matrix of environmental dissimilarity and genetic [FST/(1 − FST)] distances, followed by a three-way Mantel test between the same distance matrices considering the geographic distances [ln (km)] among populations. Environmental dissimilarity (IBED) was assessed by correlating the residual environmental and genetic distances among the analyzed populations. The significance of the correlation was determined by performing a Mantel test as described above.

2.4. Morphological Analysis

In total, 200 shoots from 10 populations (20 shoots per population) were herbarized and measured to obtain insight into morphological traits of M. croatica. Only undamaged leaves, flowers, and bracts were measured. The following traits were measured or counted: number of leaves (nL) and flowers (nF) per shoot, length (LL) and width (LW) of leaves, pedicel length (PL), bracts length (BL), calyx length (CL), calyx teeth length (TL), and calyx tube length (TuL). The length/width ratio (LL/LW) was calculated for leaves to obtain insight into leaf shape. A higher ratio indicates narrower, more elongated leaves, while a smaller ratio indicates more rotund leaves. The ratio between calyx and teeth length (CL/TL) was also calculated.
Pearson correlation coefficients were calculated between 11 morphological traits including all studied individuals using the CORR procedure in SAS v.9.3 [40]. Analysis of variance was performed using the GLM procedure. The model included the effect of the cluster and the effect of the population within the cluster, followed by Tukey’s HSD test among populations. The PRINCOMP procedure in SAS v.9.3 [40] was used to perform the principal components analysis (PCA). The first two principal components were used to create a biplot showing the individuals and morphological traits (as vectors). Discriminant analysis (DA) was performed using STEPDISC, DISCRIM, and CANDISC in SAS v.9.3 [40] to determine which of the 11 morphological traits were most useful in maximizing discrimination between clusters.

3. Results

3.1. Molecular Variability

AFLP analysis revealed contrasts in population–genetic parameters among ten studied populations of M. croatica. The percentage of polymorphic fragments and Shannon’s index varied among the studied populations (Table 2), with the lowest values observed in the Cr5 population (33.87%; 0.278) and the highest in the BH2 population (49.85%; 0.405). The total gene diversity (Ht) was 0.215, while the average gene diversity within populations (Hw) was 0.203. Wright’s FST statistics was 0.057 and significant (p < 0.001). Of the 682 polymorphic markers in 49 individuals, 42 were unique to a specific population (private polymorphic markers). They were detected across all investigated populations, most belonging to the Cr2 population (15 private alleles) and the BH4 population (9 private alleles). The expected heterozygosity levels ranged from 0.184 (Cr1 population) to 0.220 (BH4 population). Frequency down-weighted marker values (DW) ranged from 751.43 (Cr4 population) to 1262.15 (Cr2 population).
Of the total variability, 13.42% refers to variability between and 86.58% within populations, indicating small genetic differences between the studied populations of M. croatica (Table 3). AMOVA analysis also showed that 10.90% refers to variability between two genetic groups revealed by STRUCTURE analysis. On the other hand, 82.38% refers to variability within genetic groups.
The genetic structure was assessed using the model-based clustering approach implemented by the software STRUCTURE, BAPS, and PCo analysis (Figure 3 and Figure 4). In the STRUCTURE analysis, the highest K value was observed for K = 2 (ΔK = 160.65), indicating the presence of two genetic groups. Figure 3A shows two genetic groups revealed by STRUCTURE analysis. The first group included the Croatian populations (shown in red), while the second included the populations from Bosnia and Herzegovina and Montenegro (shown in blue). Some exception in the western (Croatian) group is the Cr2 population which is closer to the eastern (Bosnian and Montenegrin) group. On the other hand, BAPS analysis (Figure 3B) revealed a congruent assignment of the studied M. croatica populations to three clusters. The best partitions received log-likelihoods of −14125.35 at p = 1 (without using geographic coordinates as informative priors) and −14161.80 at p = 1 (with spatial clustering). The first group of the BAPS analysis was mostly formed by individuals from Croatian populations, while the second group included mostly individuals from Bosnian and Montenegrin populations. The individuals from Croatian populations Cr2 and individuals from Bosnian and Montenegrin populations formed the third genetic group. PCo1 and PCo2 for the molecular traits explained 27.55% of the variance (Figure 4). The western group of populations was mainly located in the positive region of PCo1, while the eastern group was positioned in the negative region of the same axis.
To obtain insight into bioclimatic variation nineteen bioclimatic variables were analyzed (Table S1). In general, bioclimatic variables were highly correlated. A strong positive correlation (r > 0.70) was found in 39 cases, while a strong negative correlation (r < −0.70) was also noticed in 39 cases, out of 171 pairs examined, respectively (Table S2). The first (PC1) and the second (PC2) principal components explained 91.01% of the variance for the analyzed traits (Figure 5). Pearson’s correlation coefficients between 19 bioclimatic variables and scores of the first two PC are shown in Table 4. A strong positive correlation (r > 0.70) with the PC1 was found for all environmental variables except for the minimum temperature of the coldest month, while a strong negative correlation (r < −0.70) was noticed for all environmental variables except for precipitation of driest month and precipitation seasonality. A strong positive correlation (r > 0.70) with the PC2 was found only for the minimum temperature of the coldest month, while a strong negative correlation (r < −0.70) was noticed only for precipitation seasonality. The PC1 separated the western group of populations which grow in cooler and wetter habitats from the eastern group of populations which grow in warmer and drier habitats.
The IBD analysis showed a significant correlation between the geographical and genetic distances (r = 0.560; pMantel = 0.001), suggesting that 31.4% of the genetic differentiation between M. croatica populations could be explained by geographical distances (Figure 6A). On the other hand, IBED analysis (Figure 6B) showed even higher correlation between the environmental and genetic distances (r = 0.581; pMantel = 0.001). Although the correlation between the residual environmental and residual genetic distances was not significant (r = 0.335; pMantel = 0.089), the IBED explains 11.3% of the observed genetic pattern (Figure 6C).

3.2. Morphological Variability

Descriptive statistics of analyzed morphological traits in ten Micromeria croatica populations and correlation matrix among eleven morphological traits are represented in Table 5 and Table 6. The largest number of flowers per shoot (75.9), the longest leaves (8.52 mm), the longest pedicels (3.61 mm), and the longest bracts (2.75 mm) were recorded in the BH3 population. The Cr4 population had the largest number of leaves per shoot (34.0), the longest calyx tube (3.78 mm), and the largest ratio between calyx length and calyx teeth length (4.85). The widest leaves (4.90 mm) and the longest calyx (5.66 mm) were recorded in the Mn population. The BH1 population had the longest teeth (2.37 mm). The BH4 population had the narrowest leaves with a length/width ratio of 2.94, while the Cr2 population had the most rotund leaves with a ratio of 1.61.
The highest variability among populations for the number of leaves per shoot, leaf length, calyx length, calyx tube length, and the ratio between calyx length and calyx tube length was recorded within the Cr4 population. The traits’ leaf width and the ratio between leaf length and leaf width were the most variable within the BH4 population. The highest variability for the trait number of flowers per shoot was recorded within population Cr2. On the other hand, the highest variability for pedicel length, bracts length, and calyx teeth length was recorded within the Cr3 population. One of the most interesting traits from a horticultural point of view is the number of flowers per shoot. Among analyzed traits, this characteristic was the most variable and the variability ranged from 30.1% (Cr3 population) to 104.0% (Cr2 population). A high degree of variability was also observed for pedicel length, and it ranged from 18.3% (BH3 population) to 70.8% (Cr3 population). The least variable trait was calyx length, and it ranged from 8.0% in the BH1 population to 18.7% in the Cr4 population (Table 5). The highest positive (0.715) and significant correlation was recorded between the calyx length/calyx teeth ratio and the calyx tube length, while the highest negative (−0.851) correlation was recorded between the calyx length/calyx teeth ratio and the calyx teeth length (Table 6).
PCA analysis (Figure 7) was performed on the 11 measured and calculated morphological traits. The PC1 and the PC2 explained 52.12% of the variance for the analyzed traits. Pearson’s correlation coefficients between 11 traits and scores of the first two PC are shown in Table 7. The bracts length, leaf length, and length of calyx teeth were higher positively correlated, while the calyx length/calyx teeth ratio was highly negatively correlated with the first PC axis. On the other hand, the length of the calyx tube and leaf width were highly positively correlated, while the length/width ratio of leaves was highly negatively correlated with the second PC axis.
DA analysis (Figure 8) showed that four traits: length/width ratio of leaves (partial R2 = 0.194; Wilks’s ƛ = 0.806), number of flowers per shoot (partial R2 = 0.131; Wilks’s ƛ = 0.700), calyx tube length (partial R2 = 0.096; Wilks’s ƛ = 0.633), and pedicel length (partial R2 = 0.037; Wilks’s ƛ = 0.610) best distinguish the western from the eastern morphological group. The significance of Wilks’s ƛ for all these properties was p < 0.0001. The canonical discriminant analysis (CANDISC) based on four morphological traits showed that the first canonical discriminant variate explained 100% of the variation between the western and eastern groups of populations. After the cross-validation, the discriminant function correctly classified 80.00% of plants into their respective clusters. Most of the misclassified individuals belong to Mn, Cr2, and BH2 populations.

4. Discussion

4.1. Molecular Variability

Identification of genetic diversity patterns is of significant importance for effective management and species conservation especially of endemic and threatened taxa [41,42,43,44]. There are no larger differences in the level of gene diversity, private alleles, and DW among the Micromeria croatica populations included in this study (
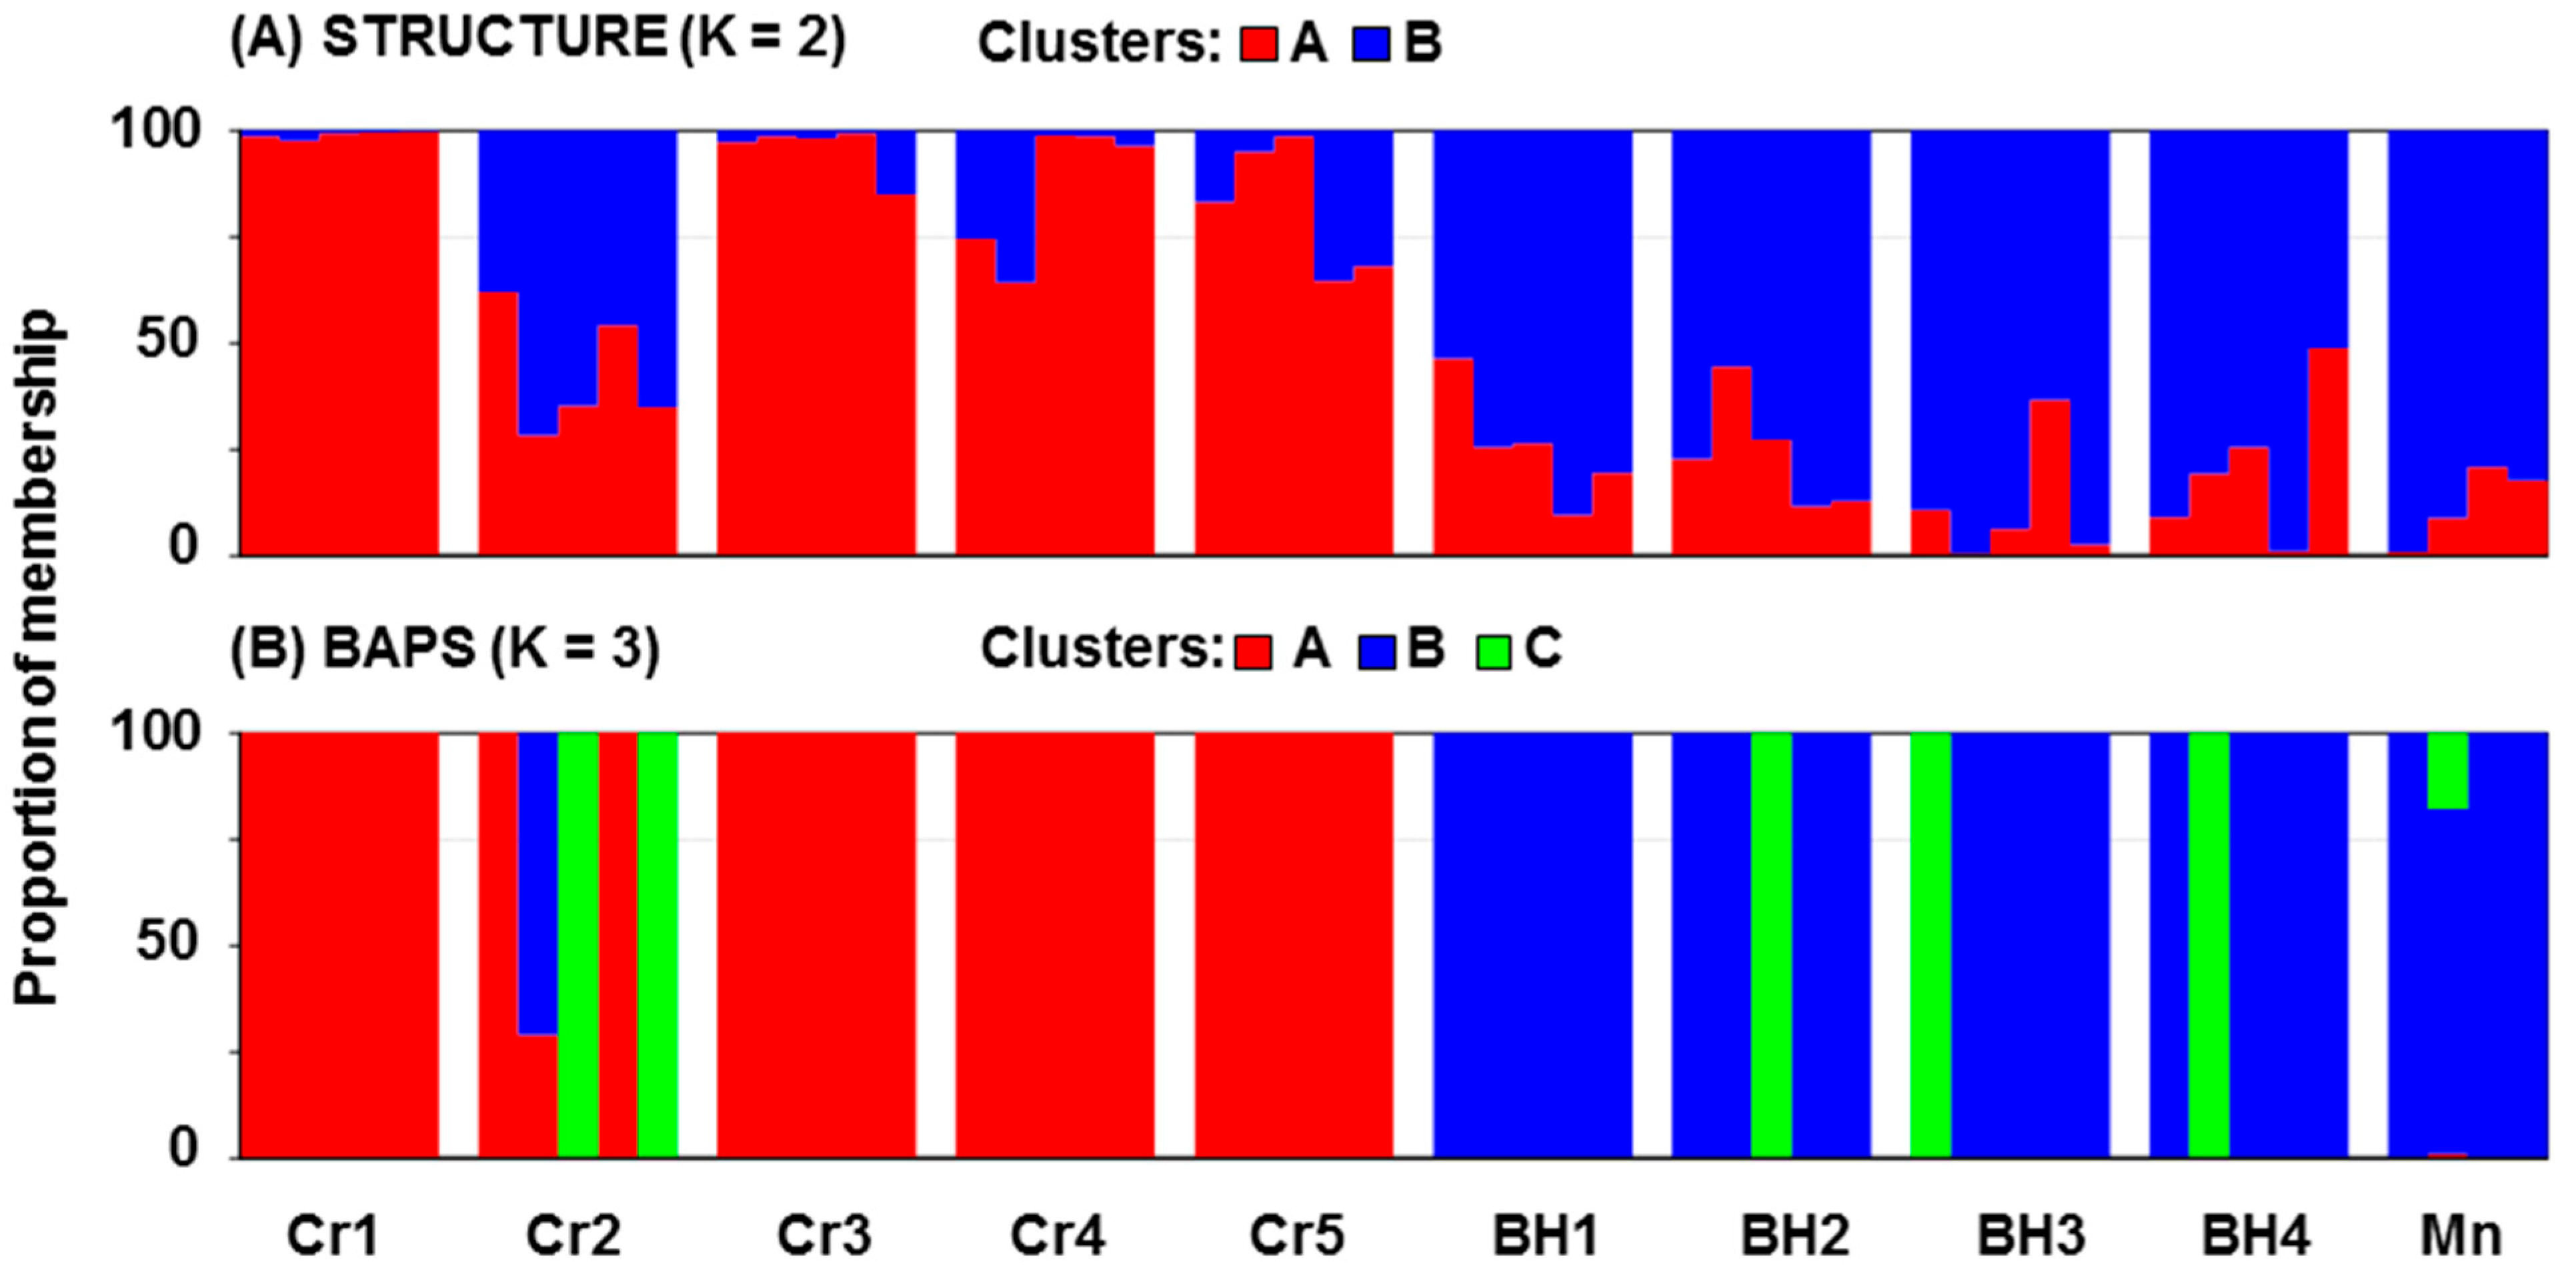
Table 2). The most diverse population is Cr2 which possesses the most private bands (15) but also contains individuals that belong to the eastern genetic group revealed by STRUCTURE (Figure 3A). It is possible that it is caused by gene flow from some other nearby populations (not included in this study) which maybe belong to a third genetic group revealed by BAPS (Figure 3B). Two spatially close western populations have relatively different DW values, which are 1262.15 (Cr2) and 887.47 (Cr3). Stronger genetic differentiation at short distances can indicate a much reduced power of seed dispersal and limited pollination over large distances. A similar result has been observed in some other endemic species [45,46,47].
The results of STRUCTURE and BAPS analysis show the genetic differentiation of ten M. croatica populations into two and three genetic groups, respectively. It is consistent with the known west–east separation in the range of this species and the presence of many isolated populations between and around these two groups [5]. The STRUCTURE analysis reveals the existence of west–east split (Figure 2 and Figure 3A). This split is relative because some individuals from western populations were grouped into the eastern group and vice versa. Most of these ‘’transitional’’ individuals were grouped by BAPS in the third group (Figure 3B). Such results suggest the presence of weak gene flow barriers among the western and eastern groups of M. croatica populations. It is known that the differentiation of populations may have been fostered by natural habitat fragmentation. Hilpold et al. 2011 [48] found that sandy beaches and river estuaries have probably acted as barriers for members of the Sicily group of Centaurea cineraria L. group (family Asteraceae), which are restricted to rock faces close to the sea. The disjunction seen in Centaurea aeolica Guss. ex Lojac. between Lipari and Ventotene islands (Italy) was best explained by long-distance (over about 250 km) for seed dispersal [48]. According to Bittkau and Comes [49], speciation within Nigella L. s. lat. (Ranunculaceae) predominantly took place in allopatry. No significant effect on diversification rate was found regarding the establishment of a Mediterranean-type climate or the onset of the Quaternary climatic oscillations. The accelerated rate of speciation in the Nigella arvensis L. complex is rather plausibly related to increased opportunities for allopatric speciation afforded by the (palaeo)geographical complexity of the Aegean archipelago combined with Late Pleistocene changes in climate and sea level [49]. Our results suggested that 31.4% of the genetic differentiation between M. croatica populations could be explained by geographical distances. Similarly, 26% of the genetic differentiation between the populations of Helichrysum italicum (Roth) G. Don (Asteraceae) can be explained by their spatial distance [50]. Even 66.61% of the genetic differentiation between Degenia velebitica Hayek (Brassicaceae) populations was explained by geographical distance [47]. On the other hand, only 5.6% of the genetic differentiation between Tanacetum cinerariifolium (Trevir.) Sch. Bip. (Asteraceae) populations could be explained by geographical distance [51]. It suggests that in addition to the factor of geographical isolation, other types of factors (height of growth above sea level, exposure, type and illumination of the slope, and biological features of the species) play a significant role in determining taxonomic diversity. The universal sets of adaptive markers include lipid composition [52], which was previously shown [53]. Hilpold et al. [48] also mentioned the influence of the geological substratum and soil on the taxonomic diversity of Centaurea aeolica. They found that C. aeolica grows on volcanic soil, while the rocks along the coast south of Naples (Italy) are almost exclusively calcareous or granitic, rendering dispersal across the mainland difficult. According to Rešetnik et al. [54], Campanula fenestrellata Feer subsp. istriaca (Feer) Damboldt (Campanulaceae) occupies narrower environmental space occurring in warmer and drier sites compared to C. fenestrellata subsp. fenestrellata which has a broader niche, tolerating a wider temperature range and generally occurring in colder and more humid sites. Local patterns of adaptation linked with altitude have been identified within Arabidopsis halleri (L.) O’Kane et Al-Shehbaz, A. thaliana (L.) Heynh., and A. arenosa (L.) Lawalrée, suggests that altitude may be an important driver of genetic differentiation and adaptation in the entire genus [55,56,57].
It is also possible that the partial isolation of M. croatica populations by river valleys and mountain ranges led to genetic differentiation among populations over a long period of time. Although it is speculative to conclude this from such a limited data set, we can assume inter-population contacts happened periodically during the last glaciation cycles. Since M. croatica is mountainous species, and bearing in mind habitats for such species became limited during the glaciation cycles [58], they could only survive by altitudinal range shifts and descent to lower altitudes during the glaciation maximums [41,59]. In colder climate periods, especially during repeated glaciations in the Pleistocene, populations of this species probably occupied larger and less fragmented areas at lower altitudes. Once the climate got warmer again, they reclaimed their pre-glaciation habitats. Nonetheless, these migrations also served as opportunities for inter-population gene flow, as fragmented and geographically isolated populations came into direct contact. The fingerprints of these contacts can still be observed today as a reduced level of differentiation among seemingly isolated populations and the lack of clear genetic structure. The positive and significant correlations revealed by the IBD could be the result of successive postglacial colonization from the refugia [60]. The two populations characterized by somewhat higher levels of DW markers likely experienced prolonged isolation that enabled them to accumulate more private alleles if compared to other ones. Phylogeographical patterns were analyzed in some plant and animal species from Balkan Peninsula. A deep phylogeographic split within Edraianthus tenuifolius (Waldst. et Kit.) A. DC. (Campanulaceae), indicated by AFLP data, separates southeastern from northwestern populations. The noticed split coincides with the lowermost Neretva Valley (Croatia) [61]. Kučera et al. [62] found a phylogeographic and taxonomic split within the Cardamine maritima Port. ex DC. agg. (Brassicaceae) in the Neretva Valley (Croatia, and Bosnia and Herzegovina), a genetic pattern on which they based, along with morphological data, the segregation of Cardamine maritima and C. fialae Fritsch. A similar split was found between the allopatric northwestern Adriatic group of Campanula pyramidalis L. s. str. (Campanulaceae) and the southeastern Adriatic group of C. austroadriatica D. Lakušić et Kovačić populations of the C. pyramidalis complex along the lower Neretva Valley [63]. The canyons in Dinaric karst were also shown to limit gene flow in Tanacetum cinerariifolium (Trevir.) Sch. Bip. [51] and Campanula secundiflora Vis. et Panč. s. l. [64]. The separation often coincides with isolated mountain ranges as also seen in some Western Balkan mountain animals [65,66]. Surina et al. [61] also noticed that the lower Neretva River valley does not coincide with any major phylogeographic split indicating that the Edraianthus serpyllifolius gene flow has occurred across this deep but narrow valley. In some populations of E. serpyllifolius gene exchange is also evident between mountain ranges [61]. It is probable that gene exchange also exists between eastern populations of M. croatica where four of five are located around the Neretva River Valley. Obtained results also show that mountain ranges are not strong enough barriers to prevent the gene exchange between nearby both western and eastern M. croatica populations. Although weak, present gene flow barriers among populations maybe have led to further differentiation among populations. Investigations of some other Eastern Adriatic plant species also showed clustering of their populations in two or three genetic groups [51,61,67,68]. This coincides with Médail et Diadema’s (2009) [69] view of the existence of a northern and more southern local glacial refugia along the Eastern Adriatic coast. Finally, Kremer et al. [53] investigated Micromeria and Clinopodium species and concluded that no single refugial area can be identified within the Balkan Peninsula. Instead, there appear to have been numerous microrefugia scattered over large areas. Such a refugia-within-refugia model was first developed by Gómes and Lunt [70] for the Iberian Peninsula.

4.2. Morphological Variability

Comparison of morphological with genetic traits showed that western populations have something longer, wider, and more orbicular leaves (
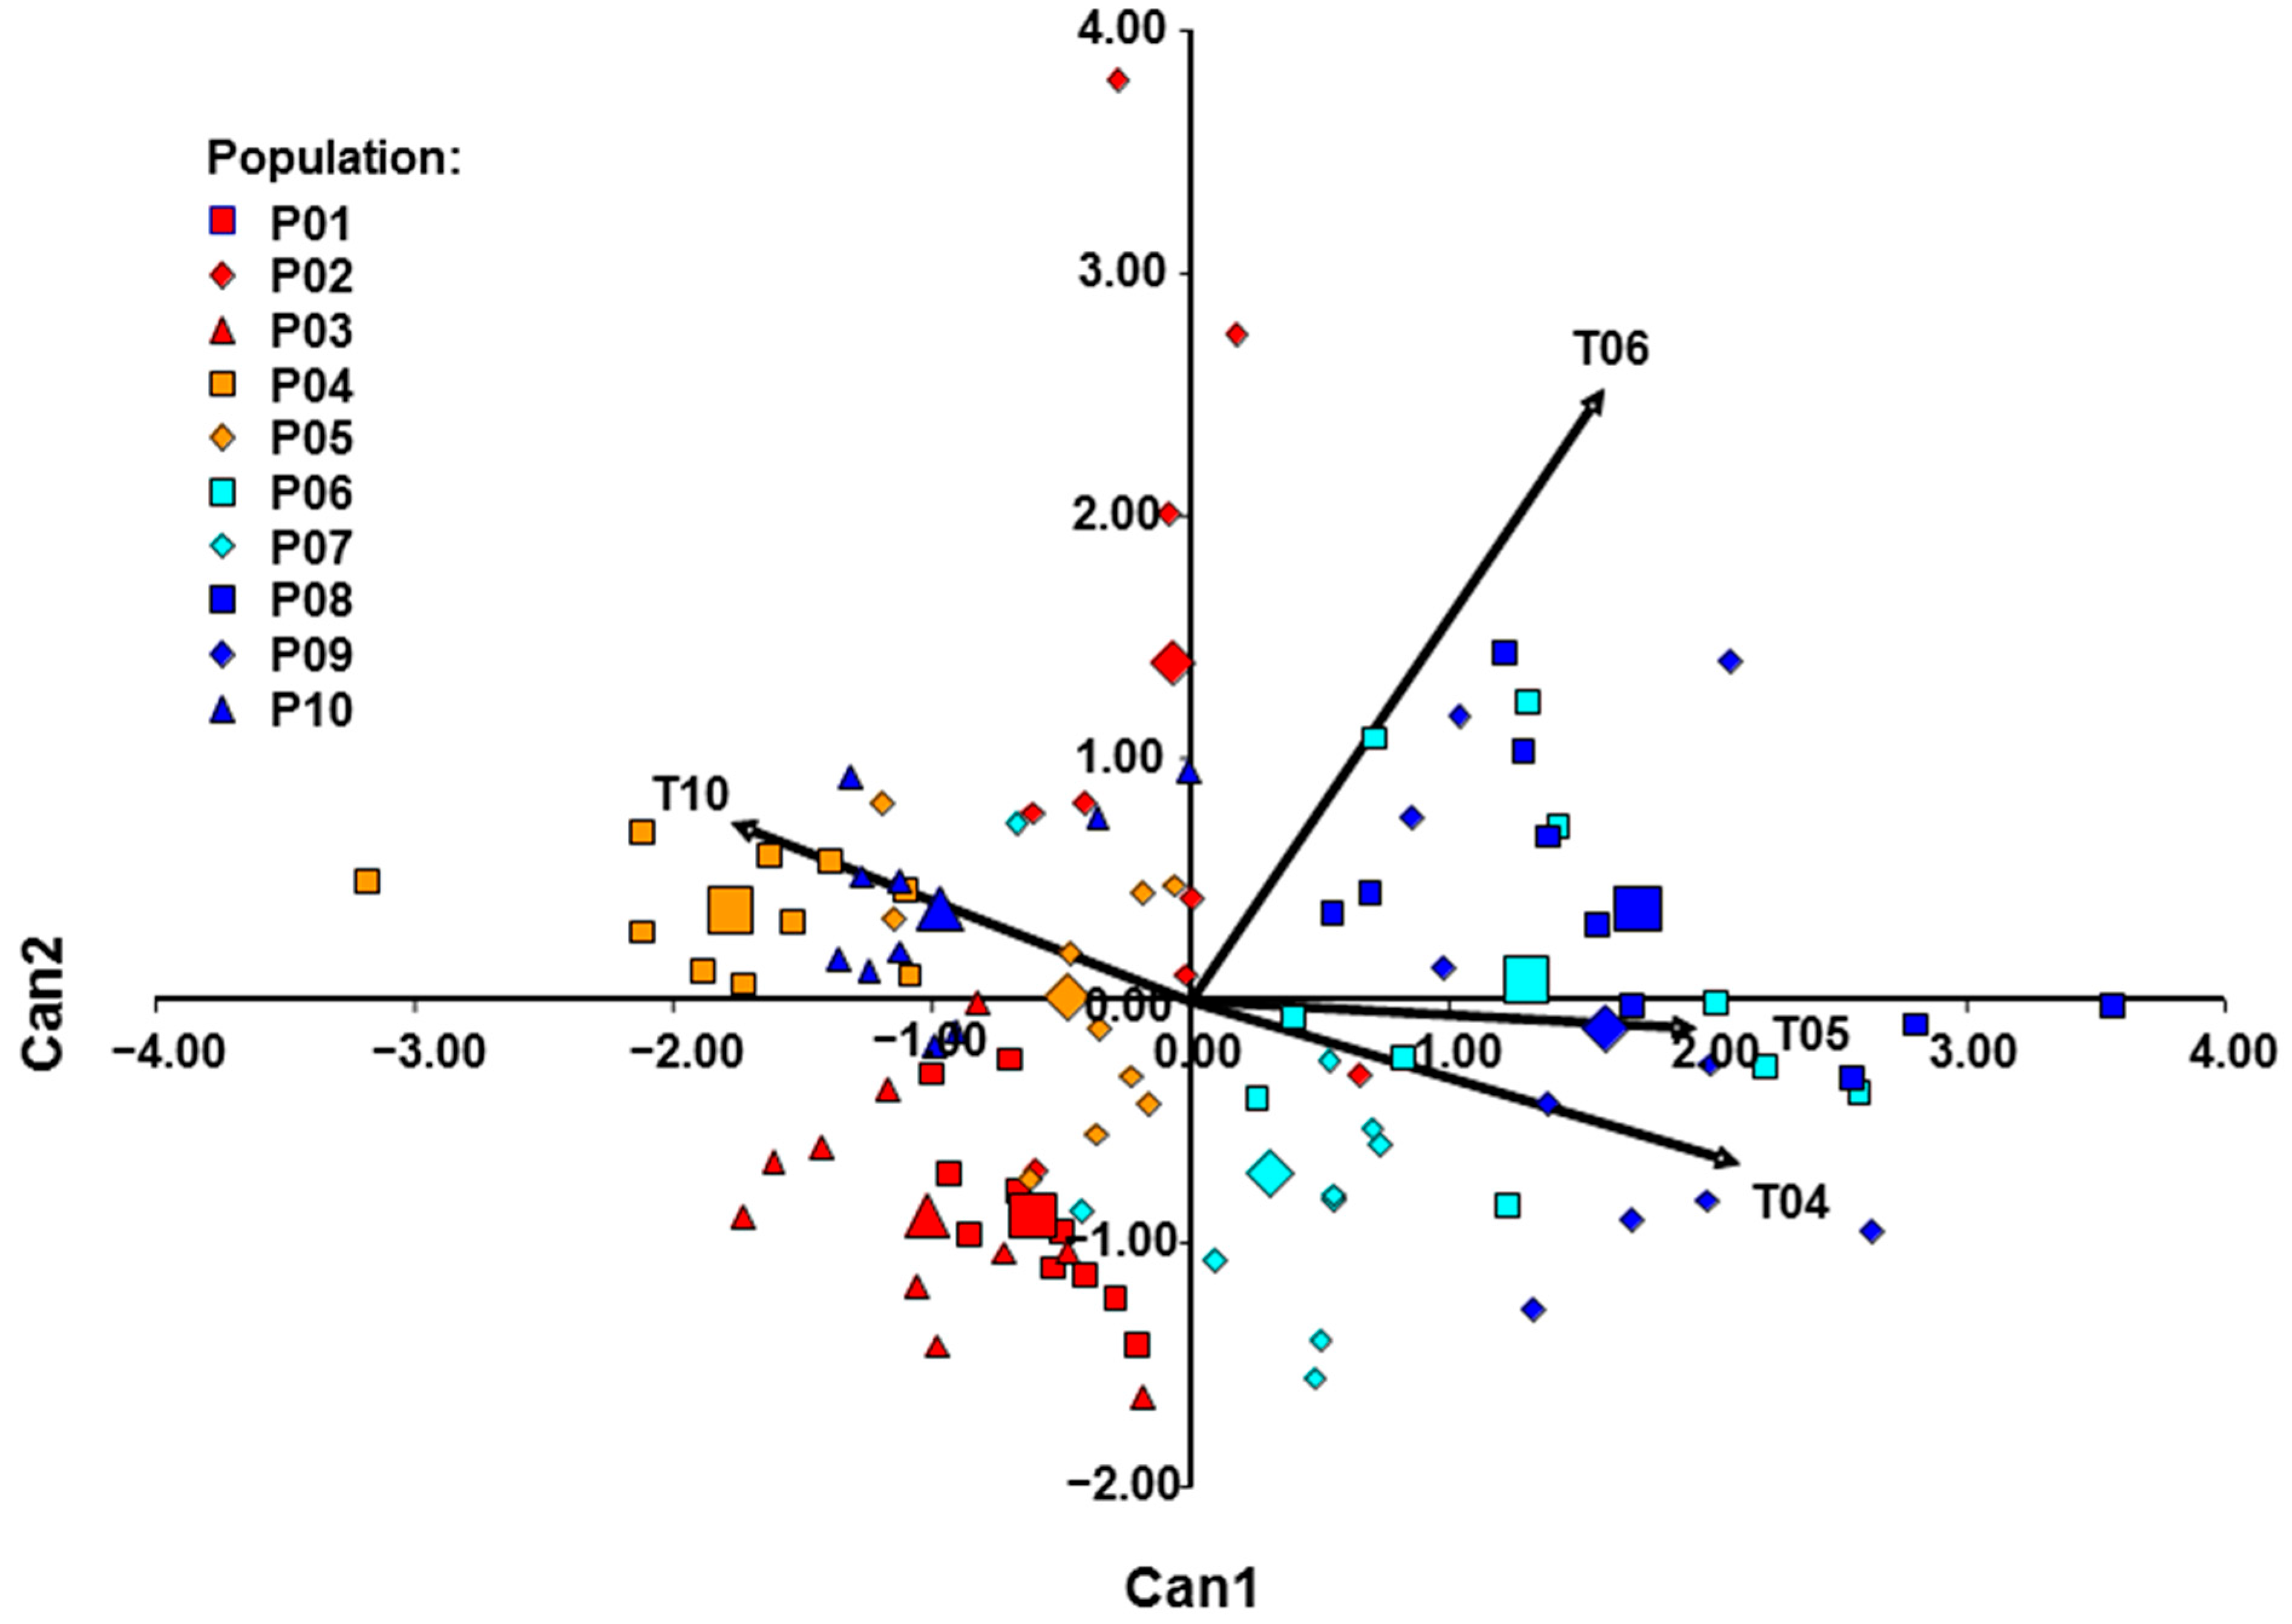
Table 5). The average number of flowers per shoot was 19.71 in the western and 40.98 in the eastern group. This indicates a more vigorous growth of the eastern group, which results in a higher number of flowers per shoot. The calyx length was approximately equal in both groups. On the other hand, calyx teeth were significantly longer in the eastern group. The discriminant function correctly classified 80.00% of plants into their respective clusters (Figure 8). Most of the misclassified individuals belong to Mn, Cr2, and BH2 populations. It is evident that all plants from the Mn population were classified inside the western group. Similar to the results of STRUCTURE analysis (Figure 3A), CANDISC analysis (Figure 8) based on morphological traits showed that the Cr2 population is closer to the Bosnian population. This distinguishes the Cr2 population as a transitional population between the western and eastern groups of populations.
The genetic structuring of M. croatica populations for horticultural purposes should be observed together with its morphological and ecological features. The introduction of new crops into cultivation includes many research stages that begin with the initial search and screening of germplasm [71]. Initial screening of wild plants should include populations from climatologically different habitats. When studying different populations, one may well come across populations that have genetically adapted to survival in colder environments, to drought, or to other environmental constraints [72]. M. croatica is a tiny plant adapted to the unfavorable water balance due to the consistent drying effect of strong wind and shallow, poorly developed soils that fill the crevices of carbonate rocks. M. croatica stands are very distinct from the surrounding vegetation and limited to crevices and terraces of rocks, the foot of the rocks, and rocky slopes. It grows in open habitats with intense sun radiation and wide temperature fluctuations. Such stands are inhabited by a smaller number of plants and have low coverage of co-occurring taxa. Low above-ground competition in habitats of M. croatica is in accordance with the ecological preferences of narrow endemics in the Mediterranean described by Lavergne et al. [73]. It suggests the azonal occurrence of M. croatica and restriction to nowadays spatially limited and fragmented microsites. Investigations of morphological traits showed that the most variable trait in M. croatica was the number of flowers per shoot and the coefficient of variability ranged from 30.1% to 104.0% (Table 5). Abundant flowering is one of the most common criteria for selecting plants for horticultural purposes. The great variability of this trait enables the potential selection of populations and individuals of M. croatica with a larger number of flowers. With regard to the abundance of flowering, the populations BH1 with an average of 69.8, and BH3 with 75.9 flowers per shoot are the most promising populations. Considerable variability was also observed for the ratio between leaf length and leaf width as another feature of horticultural interest. This ratio gives insight into the leaf shape and the coefficient of variability for this trait ranged from 23.5% to 51% (Table 5). A higher ratio between leaf length and width indicates more elongated, narrower leaves. On the other hand, a smaller ratio indicates more orbicular leaves. With regard to leaf shape, the Cr2 population with the most rotund leaves and the BH4 population with the narrowest leaves are the most promising. Finally, it should be mentioned that when we consider the cultivation of rare plants it should be kept in mind that commercial production of endemic and endangered species can prevent the collection from the wild and reduce the danger of a species becoming extinct [74,75].
Such as other Micromeria and closely related Clinopodium species which are grown as ornamental plants (Table 1), M. croatica can be planted in stony, dry soils in gardens. According to available bioclimatic data, precipitation of the driest month in investigated M. croatica populations ranged from 53 to 89 mm, while the precipitation of the driest quarter ranged from 207 to 359 mm (Table S1). Of course, there are some Mediterranean species that are more drought-tolerant than M. croatica. Yet, unlike typical Mediterranean Micromeria or Clinopodium species, such as Micromeria graeca or M. juliana, M. croatica is more resistant to low temperatures and can be cultivated in areas with a continental climate. The annual mean temperature in investigated M. croatica populations ranged from 4.02 to 11.66 C, while the minimum temperature of the coldest month ranged from −3.40 to −7.00 C. Several plants of M. croatica are cultivated from 2009 in Pharmaceutical Botanical Garden ‘’Fran Kušan’’ (Faculty of Pharmacy and Biochemistry, University of Zagreb, Croatia) in the continental part of Croatia. They bloom and fructify regularly, and young plants are ordinarily developing from the seeds. Planted plants do not require special attention in terms of watering and they were never fertilized from 2009. The only potential problem is that M. croatica plants are sensitive to the overgrowth of weed species with which they are unable to compete for habitat. That is why the best place for their planting is garden rockeries. So, it can be said that the advantage of M. croatica compared to Mediterranean Micromeria species is that it not only tolerates drought but even better tolerates low temperatures. Under the framework of climate change, this makes it particularly suitable for planting in continental climate conditions.

5. Conclusions

The STRUCTURE and PCo analysis based on AFLP genetic data grouped the studied ten M. croatica populations in western and eastern genetic groups whereby there are several individuals from western populations were grouped into the eastern group and vice versa. These individuals were grouped by BAPS in the third group. Such results suggest the presence of weak gene flow barriers among the western and eastern groups of M. croatica populations. The PCA and CANDISC analysis based on 11 analyzed morphological traits largely confirmed the existence of two slightly different groups. Plants with white flowers were observed only in one (Cr3) population. Populations with 69.8 (BH1) and 75.9 (BH3) flowers per shoot are the most promising with regard to the abundance of flowering. The Cr2 population with the most rotund leaves and the BH4 population with the narrowest leaves are the most promising populations with regard to the shape of leaves. The obtained data represent a good basis for the potential selection of populations and individuals of M. croatica for horticultural purposes, especially for planting in continental climate conditions.

Supplementary Materials

The following supporting information can be downloaded at: https://www.mdpi.com/article/10.3390/horticulturae9040418/s1. Table S1. Values of 19 bioclimatic variables of ten Micromeria croatica populations from Croatia (Cr1–Cr5), Bosnia and Herzegovina (BH1–BH4), and Montenegro (Mn) obtained from the WorldClim database [39]. Table S2. Correlations among 19 bioclimatic variables at ten Micromeria croatica populations. Lower diagonal matrix: correlation coefficients (r). Upper diagonal matrix: corresponding p-values.

Author Contributions

Conceptualization, D.K.; methodology, Z.L., I.R. and V.Ž.; software, Z.Š.; validation, Z.L. and I.R.; formal analysis, I.R., M.H., Z.Š. and D.K.; investigation, F.B., D.B., and D.S.; data curation, Z.L., Z.Š., I.R. and D.K.; writing—original draft preparation, D.K.; writing—review and editing, Z.L., I.R. and S.D.J.; visualization, Z.Š. and F.B.; supervision, D.K. and Z.L.; funding acquisition, D.K., Z.L., D.S. and S.D.J. All authors have read and agreed to the published version of the manuscript.

Funding

This research received no external funding.

Data Availability Statement

Not applicable.

Acknowledgments

Authors dedicate this work to our dear colleague, mentor, and friend Ksenija Karlović, who left us before we finished this research.

Conflicts of Interest

The authors declare no conflict of interest.

References

  1. Bräuchler, C.; Meimberg, H.; Abele, T.; Heubl, G. Polyphyly of the genus Micromeria (Lamiaceae)—Evidence from cpDNA sequence data. Taxon 2005, 54, 639–650. [Google Scholar] [CrossRef]
  2. Bräuchler, C.; Ryding, O.; Heubl, G. The genus Micromeria (Lamiaceae), a synoptical update. Willdenowia 2008, 38, 363–410. [Google Scholar] [CrossRef] [Green Version]
  3. Harley, R.M.; Atkins, S.; Budantzev, A.L.; Cantino, P.D.; Conn, B.J.; Grayer, R.; Harley, M.M.; De Kok, R.; Krestovskaja, T.; Morales, R.; et al. Labiatae. In The Families and Genera of Vascular Plants, 1st ed.; Kubitzki, K., Ed.; Springer: Berlin, Germany, 2004; Volume 7, pp. 167–282. [Google Scholar]
  4. Chater, A.O.; Guinea, E. Micromeria Benth. In Flora Europaea; Tutin, T.G., Heywood, V.H., Burges, N.A., Moore, D.M., Valentine, D.H., Walters, S.M., Webb, D.A., Eds.; Cambridge University Press: Cambridge, UK, 1972; Volume 3, pp. 167–170. [Google Scholar]
  5. Šilić, Č. Monography of genera Satureja L. In Flora of Yugoslavia; Zemaljski Muzej BiH: Sarajevo, Bosnia and Herzegovina, 1979; pp. 172–262. (In Bosnian) [Google Scholar]
  6. Šilić, Č. Endemic Plants, 3rd ed.; SP Svjetlost, Zavod za Udžbenike i Nastavna Sredstva: Sarajevo, Bosnia and Herzegovina; Zavod za Udžbenike i Nastavna Sredstva: Belgrade, Serbia, 1984; p. 103. (In Bosnian) [Google Scholar]
  7. Karlović, K.; Hodja, M.; Kremer, D. Introduction of Croatian native species into horticulture—Example of Micromeria croatica (Pers.) Schott. Agron. Glas. 2019, 81, 261–272. [Google Scholar] [CrossRef]
  8. Kereša, S.; Andrijanić, Z.; Kremer, D.; Habuš Jerčić, I.; Barić, M.; Batelja Lodeta, K.; Bolarić, S.; Bošnjak Mihovilović, A. Efficient micropropagation and rooting of Micromeria croatica (Pers.) Schott (Lamiaceae). Poljoprivreda 2018, 24, 27–33. [Google Scholar] [CrossRef]
  9. Tošić, S.; Stojičić, D.; Slavkovska, V.; Mihailov-Krstev, T.; Zlatković, B.; Budimir, S.; Uzelac, B. Phytochemical composition and biological activities of native and in vitro-propagated Micromeria croatica (Pers.) Schott (Lamiaceae). Planta 2019, 249, 1365–1377. [Google Scholar] [CrossRef]
  10. Šamec, D.; Gruz, J.; Durgo, K.; Kremer, D.; Kosalec, I.; Vale Žulj, L.; Martinez, S.; Salopek-Sondi, B.; Piljac-Žegarac, J. Molecular and cellular approach in the study of antioxidant/pro-oxidant properties of Micromeria croatica (Pers.) Schott. Nat. Prod. Res. 2015, 29, 1770–1774. [Google Scholar] [CrossRef]
  11. Vladimir-Kneževic, S.; Cvijanovic, O.; Blažekovic, B.; Kindl, M.; Štefan, B.M.; Domitrovic, R. Hepatoprotective effects of Micromeria croatica ethanolic extract against CCl4-induced liver injury in mice. BMC Complement. Altern. Med. 2015, 15, 233. [Google Scholar] [CrossRef] [Green Version]
  12. Les Arômes du Grès. Available online: https://les-aromes-du-gres.com/plantes/autres-plantes (accessed on 7 March 2023).
  13. Arom’antique. Available online: https://www.plantearomatique.com (accessed on 7 March 2023).
  14. Weiner, G. Pépinière Botanique de Vaugines, Plantes de Terrains Secs. Available online: https://www.gerard-weiner.fr/ (accessed on 7 March 2023).
  15. Promesse de Fleurs. Available online: https://www.promessedefleurs.com/vivaces/vivaces-aromatiques (accessed on 7 March 2023).
  16. Pépinière Filipi. Available online: https://www.jardin-sec.com/jardin-sec_web/fr/ (accessed on 7 March 2023).
  17. Fitoterapia.net. Available online: https://www.fitoterapia.net/vademecum/plantas/poleo-blanco.html (accessed on 7 March 2023).
  18. Redžić, S.S. The ecological aspect of ethnobotany and ethnopharmacology of population in Bosnia and Herzegovina. Coll. Antropol. 2007, 31, 869–890. [Google Scholar]
  19. Mincheva, I.; Jordanova, M.; Benbassat, N.; Aneva, I.; Kozuharova, E. Ethnobotany and exploitation of medicinal plants in the Rhodope Mountains—Is there a hazard for Clinopodium dalmaticum? Pharmacia 2019, 66, 49–52. [Google Scholar] [CrossRef]
  20. Vos, P.; Hogers, R.; Bleeker, M.; Reijans, M.; van de Lee, T.; Hornes, M.; Frijters, A.; Pot, J.; Peleman, J.; Kuiper, M.; et al. AFLP: A new technique for DNA fingerprinting. Nucleic Acids Res. 1995, 23, 4407–4414. [Google Scholar] [CrossRef] [Green Version]
  21. Carović-Stanko, K.; Liber, Z.; Politeo, O.; Strikić, F.; Kolak, I.; Milos, M.; Šatovic, Z. Molecular and chemical characterization of the most widespread Ocimum species. Plant Syst. Evol. 2011, 294, 253–262. [Google Scholar] [CrossRef]
  22. Ehrich, D. AFLPDAT: A collection of R functions for convenient handling of AFLP data. Mol. Ecol. Notes 2006, 6, 603–604. [Google Scholar] [CrossRef]
  23. Schönswetter, P.; Tribsch, A. Vicariance and dispersal in the alpine perennial Bupleurum stellatum L. (Apiaceae). Taxon 2005, 54, 725–732. [Google Scholar] [CrossRef] [Green Version]
  24. Shannon, C.E.; Weaver, W. The Mathematical Theory of Communication, 1st ed.; University of Illinois Press: Urbana, IL, USA, 1949; 117p. [Google Scholar]
  25. Lewontin, R.C. The apportionment of human diversity. In Evolutionary Biology; Dobzhansky, T., Hecht, M.K., Steere, W.C., Eds.; Springer: New York, NY, USA, 1972; pp. 381–398. [Google Scholar] [CrossRef]
  26. Vekemans, X.; Beauwens, T.; Lemaire, M.; Roldán-Ruiz, I. Data from amplified fragment length polymorphism (AFLP) markers show indication of size homoplasy and of a relationship between degree of homoplasy and fragment size. Mol. Ecol. 2002, 11, 139–151. [Google Scholar] [CrossRef] [PubMed]
  27. Zhivotovsky, L.A. Estimating population structure in diploids with multilocus dominant DNA markers. Mol. Ecol. 1999, 8, 907–913. [Google Scholar] [CrossRef] [PubMed]
  28. Dice, L.R. Measures of the amount of ecologic association between species. Ecology 1945, 26, 297–302. [Google Scholar] [CrossRef]
  29. Hammer, Ø.; Harper, D.A.T.; Ryan, P.D. PAST: Paleontological statistics software package for education and data analysis. Palaeontol. Electron. 2001, 4, 9. [Google Scholar]
  30. Excoffier, L.; Smouse, P.E.; Quattro, J.M. Analysis of molecular variance inferred from metric distances among DNA haplotypes: Application to human mitocondrial DNA restriction sites. Genetics 1992, 131, 479–491. [Google Scholar] [CrossRef]
  31. Pritchard, J.K.; Stephens, M.; Donnelly, P. Inference of population structure using multilocus genotype data. Genetics 2000, 155, 945–959. [Google Scholar] [CrossRef]
  32. Evanno, G.; Regnaut, S.; Goudet, J. Detecting the number of clusters of individuals using the software STRUCTURE: A simulation study. Mol. Ecol. 2005, 14, 2611–2620. [Google Scholar] [CrossRef] [Green Version]
  33. Earl, D.A.; von Holdt, B.M. Structure Harvester: A website and program for visualizing STRUCTURE output and implementing the Evanno method. Conserv. Genet. Resour. 2012, 4, 359–361. [Google Scholar] [CrossRef]
  34. Kopelman, N.M.; Mayzel, J.; Jakobsson, M.; Rosenberg, N.A.; Mayrose, I. CLUMPAK: A program for identifying clustering modes and packaging population structure inferences across K. Mol. Ecol. Resour. 2015, 15, 1179–1191. [Google Scholar] [CrossRef] [PubMed] [Green Version]
  35. Corander, J.; Waldmann, P.; Marttinen, P.; Sillanpää, J.M. BAPS 2: Enhanced possibilities for the analysis of genetic population structure. Bioinformatics 2004, 20, 2363–2369. [Google Scholar] [CrossRef] [PubMed] [Green Version]
  36. Corander, J.; Marttinen, P. Bayesian identification of admixture events using multilocus molecular markers. Mol. Ecol. 2006, 15, 2833–2843. [Google Scholar] [CrossRef] [PubMed]
  37. Rousset, F. Genetic differentiation and estimation of gene flow from F-statistics under isolation by distance. Genetics 1997, 145, 1219–1228. [Google Scholar] [CrossRef]
  38. Rohlf, F.J. Exeter Software (Firm) NTSYS-Pc: Numerical Taxonomy and Multivariate Analysis System; Applied Biostatistics, Inc.: Setauket, NY, USA, 2009. [Google Scholar]
  39. Hijmans, R.J.; Cameron, S.E.; Parra, J.L.; Jones, P.G.; Jarvis, A. Very high resolution interpolated climate surfaces for global land areas. Int. J. Climatol. 2005, 25, 1965–1978. [Google Scholar] [CrossRef]
  40. SAS Institute Inc. Base SAS® 9.3 Procedures Guide: Statistical Procedures; SAS Institute, Inc: Cary, NC, USA, 2011. [Google Scholar]
  41. Schmitt, T. Molecular biogeography of Europe: Pleistocene cycles and postglacial trends. Front Zool 2007, 4, 11. [Google Scholar] [CrossRef] [Green Version]
  42. Bezemer, N.; Krauss, S.L.; Roberts, D.G.; Hopper, S.D. Conservation of old individual trees and small populations is integral to maintain species’ genetic diversity of a historically fragmented woody perennial. Mol. Ecol. 2019, 28, 3339–3357. [Google Scholar] [CrossRef]
  43. Holderegger, R.; Balkenhol, N.; Bolliger, J.; Engler, J.O.; Gugerli, F.; Hochkirch, A.; Nowak, C.; Segelbacher, G.; Widmer, A.; Zachos, F.E. Conservation genetics: Linking science with practice. Mol. Ecol. 2019, 28, 3848–3856. [Google Scholar] [CrossRef] [Green Version]
  44. Pacioni, C.; Trocini, S.; Wayne, A.F.; Rafferty, C.; Page, M. Integrating population genetics in an adaptive management framework to inform management strategies. Biodivers. Conserv. 2020, 29, 947–966. [Google Scholar] [CrossRef]
  45. Schmidt, K.; Jensen, K. Genetic structure and AFLP variation of remnant populations in the rare plant Pedicularis palustris (Scrophulariaceae) and its relation to population size and reproductive components. Am. J. Bot. 2000, 87, 678–689. [Google Scholar] [CrossRef] [PubMed]
  46. Vilatersana, R.; Susanna, A.; Brochmann, C. Genetic variation in Femeniasia (Compositae, Cardueae), an endemic and endangered monotypic genus from the Balearic Islands (Spain). Bot. J. Linn. Soc. 2007, 153, 97–107. [Google Scholar] [CrossRef]
  47. Liber, Z.; Surina, B.; Nikolić, T.; Škrtić, D.; Šatović, Z. Spatial distribution, niche ecology and conservation genetics of Degenia velebitica (Brassicaceae), a narrow endemic species of the north-western Dinaric Alps. Plant Syst. Evol. 2020, 64, 19. [Google Scholar] [CrossRef]
  48. Hilpold, A.; Schönswetter, P.; Susanna, A.; Garcia-Jacas, N.; Vilatersana, R. Evolution of the central Mediterranean Centaurea cineraria group (Asteraceae): Evidence for relatively recent, allopatric diversification following transoceanic seed dispersal. Taxon 2011, 60, 528–538. [Google Scholar] [CrossRef]
  49. Bittkau, C.; Comes, H.P. Molecular inference of a Late Pleistocene diversification shift in Nigella s. lat. (Ranunculaceae) resulting from increased speciation in the Aegean archipelago. J. Biogeogr. 2008, 36, 1346–1360. [Google Scholar] [CrossRef]
  50. Ninčević, T.; Jug-Dujaković, M.; Grdiša, M.; Liber, Z.; Varga, F.; Pljevljakušić, D.; Šatović, Z. Population structure and adaptive variation of Helichrysum italicum (Roth) G. Don along eastern Adriatic temperature and precipitation gradient. Sci. Rep. 2021, 11, 24333. [Google Scholar] [CrossRef] [PubMed]
  51. Grdiša, M.; Liber, Z.; Radosavljević, I.; Carović-Stanko, K.; Kolak, I.; Šatović, Z. Genetic diversity and structure of Dalmatian pyrethrum (Tanacetum cinerariifolium Trevir./Sch./Bip., Asteraceae) within the Balkan refugium. PLoS ONE 2014, 9, e105265. [Google Scholar] [CrossRef] [Green Version]
  52. Šavikin, K.P.; Menković, N.R.; Zdunić, G.M.; Tasić, S.R.; Ristić, M.S.; Stević, T.R.; Dajić-Stevanović, Z.P. Chemical composition and antimicrobial activity of essential oils of Micromeria thymifolia (Scop.) Fritsch., M. dalmatica Benth. and Satureja cuneifolia Ten. and its secretory elements. J. Essent. Oil Res. 2010, 22, 91–96. [Google Scholar] [CrossRef]
  53. Kremer, D.; Dunkić, V.; Radosavljević, I.; Bogunić, F.; Ivanova, D.; Ballian, D.; Stešević, D.; Matevski, V.; Ranđelović, V.; Eleftheriadou, E.; et al. Phytochemicals and their correlation with molecular data in Micromeria and Clinopodium (Lamiaceae) taxa. Plants 2022, 11, 3407. [Google Scholar] [CrossRef]
  54. Rešetnik, I.; Temunović, M.; Liber, Z.; Šatovic, Z.; Bogdanović, S. Phylogeography of Campanula fenestrellata s.l. (Campanulaceae) in the northern Adriatic. Plant Syst. Evol. 2020, 306, 42. [Google Scholar] [CrossRef]
  55. Fischer, M.C.; Rellstab, C.; Tedder, A.; Zoller, S.; Gugerli, F.; Shimizu, K.K.; Holderegger, R.; Widmer, A. Population genomic footprints of selection and associations with climate in natural populations of Arabidopsis halleri from the Alps. Mol. Ecol. 2013, 22, 5594–5607. [Google Scholar] [CrossRef] [PubMed] [Green Version]
  56. Méndez-Vigo, B.; Picó, F.X.; Ramiro, M.; Martínez-Zapater, J.M.; Alonso-Blanco, C. Altitudinal and climatic adaptation is mediated by flowering traits and FRI, FLC, and PHYC genes in Arabidopsis. Plant Physiol. 2011, 157, 1942–1955. [Google Scholar] [CrossRef] [PubMed] [Green Version]
  57. Kolář, F.; Fuxová, G.; Záveská, E.; Nagano, A.J.; Hyklová, L.; Lučanová, M.; Kudoh, H.; Marhold, K. Northern glacial refugia and altitudinal niche divergence shape genome-wide differentiation in the emerging plant model Arabidopsis arenosa. Mol. Ecol. 2016, 25, 3929–3949. [Google Scholar] [CrossRef]
  58. Schönswetter, P.; Stehlik, I.; Holderegger, R.; Tribsch, A. Molecular evidence for glacial refugia of mountain plants in the European Alps. Mol. Ecol. 2005, 14, 3547–3555. [Google Scholar] [CrossRef]
  59. Comes, H.P.; Kadereit, J.W. The effect of quaternary climatic changes on plant distribution and evolution. Trends Plant. Sci. 1998, 3, 432–438. [Google Scholar] [CrossRef]
  60. Campillo, S.; Serra, M.; Carmona, M.J.; Gómez, A. Widespread secondary contact and new glacial refugia in the halophilic rotifer Brachionus plicatilis in the Iberian Peninsula. PLoS ONE 2011, 6, e20986. [Google Scholar] [CrossRef] [PubMed] [Green Version]
  61. Surina, B.; Schönswetter, P.; Schneeweiss, G.M. Quaternary range dynamics of ecologically divergent species (Edraianthus serpyllifolius and E. tenuifolius, Campanulaceae) within the Balkan refugium. J. Biogeogr. 2011, 38, 1381–1393. [Google Scholar] [CrossRef]
  62. Kučera, J.; Tremetsberger, K.; Vojta, J.; Marhold, K. Molecular study of the Cardamine maritima group (Brassicaceae) from the Balkan and Apennine Peninsulas based on amplified fragment length polymorphism. Plant Syst. Evol. 2008, 275, 193–207. [Google Scholar] [CrossRef]
  63. Lakušić, D.; Liber, Z.; Nikolić, T.; Surina, B.; Kovačić, S.; Bogdanović, S.; Stefanović, S. Molecular phylogeny of the Campanula pyramidalis species complex (Campanulaceae) inferred from chloroplast and nuclear non-coding sequences and its taxonomic implications. Taxon 2013, 62, 505–524. [Google Scholar] [CrossRef] [Green Version]
  64. Janković, I.; Šatović, Z.; Liber, Z.; Kuzmanović, N.; Radosavljević, I.; Lakušić, D. Genetic diversity and morphological variability in the Balkan endemic Campanula secundiflora s.l. (Campanulaceae). Bot. J. Linn. Soc. 2016, 180, 64–88. [Google Scholar] [CrossRef] [Green Version]
  65. Krystufek, B.; Buzan, E.V.; Hutchinson, W.F.; Hänfling, B. Phylogeography of the rare Balkan endemic Martino’s vole, Dinaromys bogdanovi, reveals strong differentiation within the western Balkan Peninsula. Mol. Ecol. 2007, 16, 1221–1232. [Google Scholar] [CrossRef] [PubMed]
  66. Sotiropoulos, K.; Eleftherakos, K.; Džukić, G.; Kalezić, M.L.; Legakis, A.; Polymeni, R.M. Phylogeny and biogeography of the alpine newt Mesotriton alpestris (Salamandridae, Caudata), inferred from mtDNA sequences. Mol. Phylogenet. Evol. 2007, 45, 211–226. [Google Scholar] [CrossRef] [PubMed]
  67. Mereda, P.; Hodálová, I.; Kučera, J.; Zozomová-Lihová, J.; Letz, D.R.; Slovák, M. Genetic and morphological variation in Viola suavis s.l. (Violaceae) in the western Balkan Peninsula: Two endemic subspecies revealed. Syst. Biodivers. 2011, 9, 211–231. [Google Scholar] [CrossRef]
  68. Rešetnik, I.; Baričevič, D.; Batîr Rusu, D.; Carović-Stanko, K.; Chatzopoulou, P.; Dajić-Stevanović, Z.; Gonceariuc, M.; Grdiša, M.; Greguraš, D.; Ibraliu, A.; et al. Genetic diversity and demographic history of wild and cultivated/naturalised plant populations: Evidence from Dalmatian sage (Salvia officinalis L., Lamiaceae). PLoS ONE 2016, 11, e0159545. [Google Scholar] [CrossRef] [PubMed] [Green Version]
  69. Médail, F.; Diadema, K. Glacial refugia influence plant diversity patterns in the Mediterranean Basin. J. Biogeogr. 2009, 36, 1333–1345. [Google Scholar] [CrossRef]
  70. Gómez, A.; Lunt, D.H. Refugia within refugia: Patterns of phylogeographic concordance in the Iberian Peninsula. In Phylogeography of Southern European Refugia; Weiss, S., Ferrand, N., Eds.; Springer: Berlin, Germany, 2007; pp. 155–188. [Google Scholar]
  71. Helevy, A.H. Exploring Israeli flora for new floriculture crops. Acta. Hortic. 2005, 683, 33–36. [Google Scholar] [CrossRef]
  72. Hennipman, E. Sustainable exploitation in ornamental horticulture, an example: Hippeastrum (Amaryllidaceae). Acta. Hortic. 2000, 541, 67–73. [Google Scholar] [CrossRef]
  73. Lavergne, S.; Thompson, J.D.; Garnier, E.; Debussche, M. The biology and ecology of endemic and widespread plants: A comparative study of trait variation in 20 congeneric pairs. Oikos 2004, 107, 505–518. [Google Scholar] [CrossRef]
  74. Noordegraaf, C.V. An aproach to select new ornamental crops. Acta Hortic. 2000, 541, 75–78. [Google Scholar] [CrossRef]
  75. Stewart, K.M. The African cherry (Prunus africana): Can lessons be learned from an over-exploited medicinal tree? J. Ethnopharmacol. 2003, 89, 3–13. [Google Scholar] [CrossRef]
Figure 1. Habitus (a), shoot with leaves and flowers (b,c), hairy leaves and stem (d), pink–purple (ac,e), and white (f) flowers of Micromeria croatica.
Horticulturae 09 00418 g001
Figure 2. Collection sites of studied Micromeria croatica populations from Croatia (Cr1–Cr5), Bosnia and Herzegovina (BH1–BH4), and Montenegro (Mn).
Horticulturae 09 00418 g002
Figure 3. Genetic structure of the investigated populations of Micromeria croatica from Croatia (Cr1–Cr5), Bosnia and Herzegovina (BH1–BH4), and Montenegro (Mn) based on AFLP markers as resolved by Bayesian clustering. STRUCTURE assumes two clusters (A) while BAPS assumes three clusters (B).
Horticulturae 09 00418 g003
Figure 4. PCoA of the investigated Micromeria croatica populations from Croatia (Cr1–Cr5), Bosnia and Herzegovina (BH1–BH4), and Montenegro (Mn).
Horticulturae 09 00418 g004
Figure 5. PCA of the investigated Micromeria croatica populations from Croatia (Cr1–Cr5), Bosnia and Herzegovina (BH1–BH4), and Montenegro (Mn) based on 19 bioclimatic variables (Bio1–Bio19). Abbreviations of bioclimatic variables are explained in Table 3.
Horticulturae 09 00418 g005
Figure 6. Isolation by distance and isolation by environmental distance. Plots of Mantel’s test showing the relationships between the geographical and genetic distances (A), the environmental and genetic distances (B), and the residual environmental and genetic distances (C) by taking into account the geographical distances among ten Micromeria croatica populations.
Horticulturae 09 00418 g006
Figure 7. PCA of the investigated Micromeria croatica populations from Croatia (Cr1–Cr5), Bosnia and Herzegovina (BH1–BH4), and Montenegro (Mn) based on 11 morphological traits. nL, number of leaves per shoot; LL, leaf length; LW, leaf width; LL/LW, length/width ratio of leaves; nF, number of flowers per shoot; PL, pedicel length; BL, bracts length; CL, calyx length; TL, calyx teeth length; TuL, calyx tube length; CL/TL, calyx length/calyx teeth length ratio. The length of the vector is proportional to the eigenvector of the variable, scaled by the square root of the eigenvalue.
Horticulturae 09 00418 g007
Figure 8. DA of the investigated Micromeria croatica populations from Croatia (Cr1–Cr5), Bosnia and Herzegovina (BH1–BH4), and Montenegro (Mn). LL/LW, length/width ratio of leaves; nF, number of flowers per shoot; PL, pedicel length; TuL, calyx tube length. The length of the vector is proportional to the discriminatory power of the variable.
Horticulturae 09 00418 g008
Table 1. Horticultural value of Micromeria (M.) and closely related Clinopodium (C.) species already introduced into cultivation.
TaxaHorticultural ValueMain UsesReferences
M. graeca (L.) Benth. ex Rchb.Cultivated in stony, dry soils both in gardens and fieldsOrnamental, medicinal, seasoning, food for bees and other pollinators, perfumes the environment[12,13]
M. juliana (L.) Benth. ex Rchb.Cultivated in stony, dry soils both in gardens and fieldsOrnamental, medicinal, extraction of essential oil[14]
M. nervosa (Desf.) Benth.Cultivated in stony, dry soils both in gardens and fieldsOrnamental, medicinal, extraction of essential oil[14]
C. douglasii (Benth.) Kuntze(syn. M. douglasii Benth.)Cultivated in stony, dry soils both in gardens and fields, requires frequent irrigationOrnamental, medicinal, seasoning, food for bees and other pollinators, perfumes the environment[15]
C. serpyllifolium (M. Bieb.) Kuntze subsp. fruticosum (L.) Bräuchler (syn. M. fruticosa (L.) Druce)Cultivated in stony, dry soils both in gardens and fields. It has allelopathic properties inhibiting weedsOrnamental, medicinal, seasoning, food for bees and other pollinators, perfumes the environment. The aerial parts are sold in herbal shops of Western Europe[12,13,16,17]
C. thymifolium (Scop.) Kuntze (syn. M. thymifolia (Scop.) Fritsch)Cultivated in stony, dry soils both in gardens and fieldsOrnamental, medicinal, seasoning, food for bees and other pollinators, perfumes the environment[15,18]
C. dalmaticum (Benth.) Bräuchler et Heubl (syn. M. dalmatica Benth)Cultivated in stony, dry soils in gardens, with very low fertilizer requirementsOrnamental and medicinal[13,19]
Table 2. Details on origin and collection data and molecular diversity revealed by AFLP markers in ten Micromeria croatica populations from. Croatia (Cr1–Cr5), Bosnia and Herzegovina (BH1–BH4), and Montenegro (Mn).
Locality (Code)LatitudeLongitudeVoucher No.Altitude (m)np (%)INprHE (FIS = 0)DW
Rossijev kuk (Cr1)44°45′51.1″14°59′17.1″HFK-HR-510161641533.870.27830.184932.97
Bačić kuk (Cr2)44°34′45.2″15°05′49.5″HFK-HR-510121159548.680.411150.2181262.15
Stupačinovo (Cr3)44°32′37.5″15°10′04.7″HFK-HR-510171058539.150.32420.200887.47
Bojinac (Cr4)44°20′57.7″15°24′50.3″HFK-HR-510131046541.790.34630.196751.43
Prezid (Cr5)44°15′17.8″15°48′58.2″HFK-HR-51010991545.450.37110.204812.91
Diva Grabovica (BH1)43°35′59.0″17°41′04.3″HFK-HR-51007251542.960.35420.200967.42
Dubočani (BH2)43°35′10.1″18°04′44.0″HFK-HR-51020715549.850.40530.2181050.43
Rakitnica (BH3)43°34′10.1″18°05′59.2″HFK-HR-51019943547.650.38520.192762.49
Glavatičevo (BH4)43°30′21.1″18°06′20.3″HFK-HR-51005366548.830.40490.2201066.92
Babji zub (Mn)42°52′28.2″19°23′05.1″HFK-HR-510031438438.560.33320.195902.72
Note: n, sample size for molecular analysis; p (%), proportion of polymorphic bands; Npr, number of private bands; I, Shannon’s information index; DW, frequency down-weighted marker values; HE, expected heterozygosity of population.
Table 3. Results of analysis of molecular variance (AMOVA) for 49 Micromeria croatica genotypes from Croatia (Cr1–Cr5), Bosnia and Herzegovina (BH1–BH4), and Montenegro (Mn).
Source of Variationd.f.Variance ComponentPercentage of Variation (%)Φp (Φ)
Among populations911.2513.420.134<0.0001
Within populations3972.5686.58
Between genetic groups19.6010.900.109<0.0001
Among populations within genetic groups85.926.720.075<0.0001
Within genetic groups3972.5682.380.176<0.0001
Genetic group: Cr1–Cr5
Among populations45.517.380.0740.0004
Within populations2069.1292.62
Genetic group: BH1–BH4, Mn
Among populations46.317.650.0770.0001
Within populations1976.1892.35
Φ, Wright’s FST statistics.
Table 4. Pearson’s correlation coefficients between 19 bioclimatic variables and scores of the first two principal components (PC).
No.Bioclimatic VariablePC1 PC2
Bio1Annual mean temperature0.905***0.317ns
Bio2Mean diurnal range0.873**−0.416ns
Bio3Isothermality0.843**−0.462ns
Bio4Temperature seasonality0.871**−0.322ns
Bio5Max temperature of warmest month0.952***0.037ns
Bio6Min temperature of coldest month0.021ns0.988***
Bio7Temperature annual range0.882***−0.372ns
Bio8Mean temperature of wettest quarter0.849**0.481ns
Bio9Mean temperature of driest quarter0.933***0.246ns
Bio10Mean temperature of warmest quarter0.933***0.246ns
Bio11Mean temperature of coldest quarter0.731*0.660*
Bio12Annual precipitation–0.943***0.135ns
Bio13Precipitation of wettest month–0.909***0.298ns
Bio14Precipitation of driest month–0.679*−0.596ns
Bio15Precipitation seasonality–0.424ns0.863**
Bio16Precipitation of wettest quarter–0.909***0.281ns
Bio17Precipitation of driest quarter–0.940***−0.141ns
Bio18Precipitation of warmest quarter–0.940***−0.141ns
Bio19Precipitation of coldest quarter–0.887***−0.019ns
Eigenvalue13.47 3.82
% of variance70.89 20.12
Note: ns, non-significant; *, significant at p < 0.05; **, significant at p < 0.01; ***, significant at p < 0.001.
Table 5. Descriptive statistics of morphological traits of leaves and flowers of ten Micromeria croatica populations from Croatia (Cr1–Cr5), Bosnia and Herzegovina (BH1–BH4), and Montenegro (Mn).
LocalityStatisticsnLLLLWLL/LWnFPLCLTLBLTuLCL/TL
Cr1n2043843843820520520520520520520
Mean22.4 cd6.76 bcd4.24 abc1.76 cd26.0 b1.42 de5.10 bc2.22 a1.72 c2.88 cd2.33 cd
StDev4.071.441.450.5410.260.840.580.350.630.480.34
Min123.01.40.7170.131.30.711.5
Max2910.07.93.75434.06.23.34.04.64.5
CV18.221.334.130.739.459.311.415.936.816.814.5
Cr2n2043643643620320336336481336336
Mean24.6 bcd7.21 bc4.69 ab1.62 d16.9 b3.00 a4.82 c2.12 a1.79 bc2.72 def2.33 cd
StDev3.841.351.070.4817.571.990.530.370.520.430.39
Min162.01.00.740.11.510.81.41.4
Max349.67.66.0779.063.64.04.34.6
CV15.618.722.829.8104.066.311.017.229.015.816.6
Cr3n2035635635620379379379369379379
Mean18.4 d7.53 ab4.51 ab1.87 cd18.95 b1.22 e4.77 c1.67 b1.90 bc3.10 bc3.03 b
StDev3.151.251.390.7711.880.860.830.520.760.550.72
Min113.01.30.7020.11.20.50.30.71.5
Max2210.07.76.2495.06.43.24.04.36.7
CV17.116.630.941.562.770.817.531.440.117.923.6
Cr4n2068368368320329329329324329329
Mean34.0 ab5.79 d3.53 cd1.70 cd16.85 b2.15 cde4.83 c1.04 c0.89 d3.78 a4.85 a
StDev18.601.941.270.4010.670.800.900.310.270.781.16
Min131.81.00.9570.72.80.50.41.82.7
Max7910.26.43.9414.99.52.92.47.98.3
CV54.733.536.023.563.337.218.729.630.020.724.0
Cr5n2050750750720397397397395397397
Mean25.5 bcd7.57 ab4.08 bcd2.08 bc19.85 b2.50 bcd5.60 ab2.32 a2.36 b3.29 b2.48 c
StDev4.491.541.550.6915.430.910.550.410.710.460.40
Min143.01.10.730.23.21.21.01.21.6
Max3211.28.24.7525.57.23.25.154
CV17.620.438.033.277.736.29.817.830.114.016.0
BH1n2056856856820859859859994859859
Mean31.5 bcd7.52 ab4.24 abcd1.97 cd69.8 a3.11 abc5.12 bc2.37 a1.69 c2.75 de2.19 cd
StDev8.261.921.520.7140.241.160.410.350.460.350.27
Min151.01.00.6260.53.81.20.51.50.9
Max4212.08.451738.773.44.04.44.4
CV26.225.535.836.157.737.28.014.727.512.912.3
BH2n2039939939920384384384384384384
Mean20.1 d6.54 bcd3.57 d2.03 c19.2 b2.28 cde4.12 d1.69 b1.78 bc2.43 f2.49 c
StDev4.551.111.220.6511.050.960.430.300.560.390.40
Min153.01.30.7540.33.01.00.31.51.74
Max338.56.23.85464.15.22.53.33.63.8
CV22.717.034.132.157.542.110.417.631.216.016.2
BH3n2036636636620462462462462462462
Mean18.4 d8.52 a4.3 abcd2.37 b75.9 a3.61 a4.92 c1.76 b2.75 a3.16 bc2.89 b
StDev5.282.091.971.0622.840.660.470.360.580.450.55
Min124.10.80.9482.53.81.01.51.81.9
Max3115.09.26.91325.56.23.04.24.04.8
CV28.724.645.744.930.118.39.620.321.014.119.1
BH4n2055555555520286375375705375375
Mean42.00 a6.19 cd2.68 e2.94 a19.65 b3.42 ab4.79 c2.32 a1.87 bc2.47 ef2.11 d
StDev14.191.571.431.59.821.130.600.440.600.480.31
Min241.90.30.3841.02.00.90.700.91.3
Max8210.07.010.17417.96.03.83.93.73.4
CV33.825.453.451.050.033.012.518.832.319.614.9
Mnn2051151151120417417417324417417
Mean25.6 bcd7.31 bc4.90 a1.68 cd20.85 b2.58 bcd5.66 a2.33 a1.76 c3.32 b2.47 c
StDev5.551.881.750.6510.740.810.420.420.470.390.29
Min162.40.80.653.01.201.401.400.802.001.65
Max3311.508.54.1052.06.403.703.703.204.703.50
CV21.725.835.738.551.531.418.118.126.511.711.7
Cr1–Cr5n10024202420242020194519611961208919611961
Mean24.987.024.23 A1.81 B19.71 B2.21 B5.081.91 B1.74 B3.18 A2.99 A
StDev7.790.920.580.3311.621.240.470.520.520.471.01
Min111.81.00.72.00.11.20.50.30.71.4
Max7911.28.26.2779.09.53.65.17.98.3
CV31.213.113.718.258.056.19.327.229.914.833.8
BH1–n10023992399239920240825512551286925512551
BH4,Mean27.517.273.92 B2.22 A40.98 A2.95 A4.952.13 A1.99 A2.82 B2.40 B
MnStDev11.051.230.920.5532.250.830.610.380.470.420.32
Min121.00.30.383.00.31.40.90.30.90.9
Max8215.09.210.171738.77.03.84.24.74.8
CV40.216.923.524.878.728.112.317.823.614.913.3
Note: nL, number of leaves per shoot; LL, leaf length; LW, leaf width; LL/LW, length/width ratio of leaves; nF, number of flowers per shoot; PL, pedicel length; CL, calyx length; TL, calyx teeth length; BL, bracts length; TuL, calyx tube length; CL/TL, calyx length/calyx teeth length ratio; Mean; StDev, standard deviation; Min, minimum; Max, maximum; CV, coefficient of variability; Mean, StDev, Min, and Max are expressed in mm; CV is expressed in %. a–e denote differences among populations; A and B denote differences between two genetic groups obtained by STRUCTURE. Values with the same lowercase are not significantly different.
Table 6. Pearson’s correlation coefficient of 11 morphological traits from ten Micromeria croatica populations.
CorrelnLLLLWLL/LWnFPLCLTLBLTuLCL/TL
nL ******nsnsnsnsns***nsns
LL−0.430 ***ns**********ns*
LW−0.3630.578 ****ns***ns***ns
LL/LW0.1660.145−0.655 **nsns******
nF−0.0670.5530.2050.199 *nsns***nsns
PL0.1700.2220.0080.2280.243 ns****ns*
CL−0.0150.3190.378−0.122−0.0100.059 ***ns***ns
TL0.0720.2240.1670.1420.0350.2110.559 *********
BL−0.3580.6340.1980.3440.3360.3260.1750.357 ns***
TuL−0.0880.1440.269−0.280−0.046−0.1400.587−0.343−0.152 ***
CL/TL0.058−0.197−0.062−0.236−0.098−0.211−0.102−0.851−0.4720.715
Note: nL, number of leaves per shoot; LL, leaf length; LW, leaf width; LL/LW, length/width ratio of leaves; nF, number of flowers per shoot; PL, pedicel length; CL, calyx length; TL, calyx teeth length; BL, bracts length; TuL, calyx tube length; CL/TL, calyx length/calyx teeth length ratio; ns, non-significant; *, significant at p < 0.05; **, significant at p < 0.01; ***, significant at p < 0.001.
Table 7. Pearson’s correlation coefficients between analyzed morphological traits and scores of the first two principal components (PC).
TraitPC1 PC2
Number of leaves per shoot−0.295**−0.430***
Leaf length0.753***0.423***
Leaf width0.399***0.754***
Length/width ratio of leaves0.258*−0.627***
Number of flowers per shoot0.478***0.090ns
Pedicel length0.420***−0.213*
Bracts length0.801***−0.015ns
Calyx length0.386***0.504***
Calyx teeth length0.716***−0.224*
Calyx tube length−0.263**0.792***
Calyx length/calyx teeth length ratio−0.731***0.481***
Eigenvalue3.191 2.542
% of variance29.01 23.11
Note: ns, non-significant; *, significant at p < 0.05; **, significant at p < 0.01; ***, significant at p < 0.001.
Disclaimer/Publisher’s Note: The statements, opinions and data contained in all publications are solely those of the individual author(s) and contributor(s) and not of MDPI and/or the editor(s). MDPI and/or the editor(s) disclaim responsibility for any injury to people or property resulting from any ideas, methods, instructions or products referred to in the content.

