Article

Influence of the Culture System and Harvest Time on the Specialized Metabolite Composition of Rocket Salad (Eruca sativa) Leaves

by
Ivon Buitrago-Villanueva
*,
Ricardo Barbosa-Cornelio
and
Ericsson Coy-Barrera
*
Bioorganic Chemistry Laboratory, Universidad Militar Nueva Granada, Cajicá 250247, Colombia
*
Authors to whom correspondence should be addressed.
Horticulturae 2023, 9(2), 235; https://doi.org/10.3390/horticulturae9020235
Submission received: 31 December 2022 / Revised: 31 January 2023 / Accepted: 7 February 2023 / Published: 9 February 2023
(This article belongs to the Special Issue New Trends and Innovations in Medicinals, Herbs, and Specialty Crops)

Abstract

:
Eruca sativa is a leafy vegetable widely consumed fresh in salads and recognized for the presence of bioactive compounds, such as glucosinolates (GLS) and flavonols. This plant is traditionally cultivated in soils but adapts well to soilless cultures, such as hydroponics and aquaponics. However, despite the good results in the literature on E. sativa cultivation in soilless systems, the influence of the culture systems and harvest time on the specialized metabolite-based chemical composition of E. sativa leaves is not entirely understood. Based on the above, this study aimed to evaluate the specialized metabolite composition of three different cultivation types, i.e., using soil (SCS), nutrient film technique (NFT)-based hydroponic (HCS), and aquaponic (ACS) culture systems, along three growing cycles, and collected at two commercial harvest times, i.e., 21 days after transplanting (DAT) to get early plant material, namely “baby leaf”, and 42 DAT as the traditional harvest time. The chemical composition was obtained by liquid chromatography coupled with mass spectrometry (LC-MS), and multivariate statistics supported the analysis of the whole dataset. The SCS was characterized to promote an important accumulation of two antioxidant flavonols, i.e., (kaempferol and isorhamnetin diglucopyranosides) in young leaves (21 DAT). The hydroponically-grown plants exhibited a smaller number of various compounds. The ACS-cultivated leaves accumulated indole-containing glucosinolates and a marker associated with harvest time, spirobrassinin, a cruciferous oxindoline phytoalexin. These findings constitute the first report of those compounds relevantly accumulated by the effect of soilless cultures and a starting point for further studies related to the metabolite regulation of E. sativa under hydroponics and aquaponics.

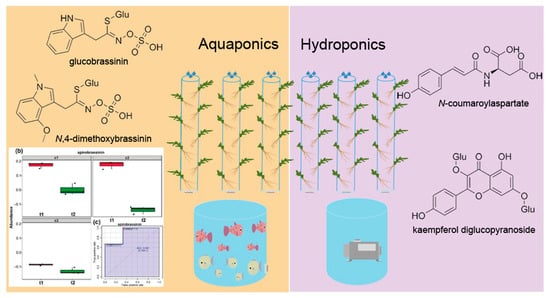
Graphical Abstract

1. Introduction

Eruca sativa Mill. is a cruciferous vegetable commonly known as rocket salad, rocket, true rocket, arugula, roquette, and white pepper. It was initially cultivated in Mediterranean countries, such as Italy, Greece, Turkey, Egypt, Sudan, and Central Europe, yet is currently distributed worldwide, predominantly in Southern Europe to North Africa, Iran, India, Pakistan, the United States, and Brazil [1,2]. The leaves of this plant are destined for human consumption mainly as a low-calorie, cut-fresh food with a pungent, hot taste and various biological attributes [2]. E. sativa is recognized for having astringent, diuretic, digestive, antigenotoxic, and emollient activities [2,3]. These properties are related to the characteristic occurrence of bioactive phytochemicals, particularly glucosinolates (GLS) and flavonoids [4]. In the case of GLS, the methionine-derived aliphatic type, such as 4-mercaptobutyl glucosinolate, glucoerucin, glucoraphanin, and glucoraphanin, identified and quantified in seeds and other plant organs in different varieties, are common GLSs in E. sativa [5]. The second type of typically-occurring GLS is related to the indole-containing GLS, such as glucobrassicin [6], neoglucobrassicin, and 4-hydroxyglucobrassicin [7,8]. The concentration of GLS-type compounds influences the organoleptic properties of E. sativa leaves, such as smell and taste, after chemical or enzymatic hydrolysis, particularly from glucosativin and glucoerucin [9]. Regarding flavonoids, these specialized metabolites are considered relevant phytonutrients in E. sativa due to their biological activity as antioxidants, cytotoxic, and renal protective effects. Additionally, the E. sativa flavonoids increase the activity of nuclear receptor proteins, such as peroxisome proliferator-activated receptor (PPAR), and suppress the expression of inflammation-promoting cytokines [10,11].
E. sativa is a leafy vegetable, so it is commercially harvested from basal leaf sections, typically 42 days after transplant (DAT), although such a harvest time can vary according to the growers [12]. A “baby leaf” rocket is another commercially harvested product of E. sativa, characterized by 5–7 cm leaves to be collected at 21 DAT [8]. It is traditionally cultivated in soils but adapts well to soilless cultures. These types of cultures have been found to be a promising strategy for commercially producing E. sativa. Nicola et al. [13] found that soilless systems afforded marketable E. sativa plants faster than soil-based systems, while Ronzón et al. [14] produced rocket salad by aquaponic systems associated with the semi-intensive tilapia (Oreochromis niloticus) cultivation, reaching 100% survival, 35 cm stems, and 30 DAT harvest time. E. sativa can also be produced under controlled conditions [7,8,15] and hydroponic systems [16] with competitive results regarding the afforded plant material. However, the influence of the culture system and harvest time on the specialized metabolite-based chemical composition of E. sativa leaves is not entirely understood, which is an interesting factor to be explored to determine the impact on those components that could provide added nutritional value.
In this context, due to the importance of perusing emerging production strategies for E. sativa and the relevance as food with reported biological activity, three culture systems were employed and compared in the present study, i.e., an 8:2 silty loam–rice husk mixed soil, a hydroponic system, and an aquaponic system, to examine the influence of these systems on the chemical composition of E. sativa leaves, in three cultivation cycles at different times of the year, and two harvest times (i.e., the baby leaf at 21 DAT and the traditional at 42 DAT), through untargeted metabolomics. The hydroponic system, a plant production system in a soilless environment, required fertilization added in an aqueous solution under the nutrient film technique (NFT). NFT consisted of a thin film of nutrient-rich water from a reservoir tank that flowed through a tube or closed gutter vertically or horizontally. The implemented aquaponics consisted of an integrated multitrophic system, combining elements of recirculation systems for fish production with hydroponic plant production systems [17] to achieve that nitrifying bacteria transform fish waste products into assimilable nutrients for plants. Therefore, the fish tank from the closed recirculation system is coupled with the hydroponic system to comprise the aquaponics system. Our study also aimed to recognize those top-ranked compounds associated with harvest times and culture systems as relevant traits of added value E. sativa fresh products.

2. Materials and Methods

2.1. Plant material, Preparation, and Experimental Design

Certified seeds of E. sativa (Garden Green, Medellín, Colombia) were placed in flowerpots containing commercial peat substrate (Pro-Mix Gtx, Impulsemillas, Tocancipá, Colombia) under greenhouse conditions (i.e., temperature = 16 ± 3.1 °C, relative humidity = 68 ± 6%, altitude = 2562 m.a.s.l., total light transmission = 82 ± 7%, total light diffusion = 53 ± 6%, UV transmission between 290–340 nm = 5%) at Bogotá plateau to afford seedlings. Seeds were germinated and grown until 20-day seedlings (having two true leaves) and then transplanted (n = 180) in the test systems, i.e., soil (SCS), hydroponic (HCS), and aquaponic (ACS) culture systems, under greenhouse conditions. Three growing cycles (GC1, GC2, and GC3) per system were performed to involve cultivation variability, according to slight variations of environmental conditions along the year regarding temperature and relative humidity, i.e., GC1: 16.3 °C and 64% RH, GC2: 16.7 °C and 72%, and GC3: 18.9 °C and 67%. Finally, two harvest times were also considered, including the baby leaf harvest (21 DAT) and the traditional harvest (42 DAT). A completely randomized experimental design was employed, arranged into simple groups comprising the test two factors, i.e., three culture systems and two harvest times, along three growing cycles. The data collection did not include those plants at the edges.

2.2. Growth Conditions in the Three Culture Systems

2.2.1. Hydroponic Culture System

The E. sativa plants were grown hydroponically using the nutritive film technique (NFT) in a vertical arrangement (Figure 1). Each hydroponic system was composed of six 150 cm polyvinyl chloride (PVC) tubes with thirty ½-inch circular pots, distributed side by side to contain a single plant, providing 180 plants. This arrangement was connected to a 200 L sump equipped with a pump (Q = 6000 L/h) that recirculates the nutrient solution through the hydroponic system. The following semi-controlled climatic conditions were recorded during hydroponic cultivation of E. sativa: day/night photoperiod = 12/12 h; radiation, irradiance = 220 μE/m2s; temperature (day/night) = 20/17 °C; relative humidity = 60–70%, pH = 6.1–6.7, and electrical conductivity = 2.1 to 2.1 dS/m. The nutrient solution ‘La Molina’, containing the required macro and micronutrients [18,19], was employed since it was specially developed for NTF-based hydroponic systems [20]. The solution was aerated by pumping, which also guaranteed constant nutrient solution mixing.

2.2.2. Aquaponic Culture System

For the aquaponic culture system, the hydroponic sump was replaced by a 1000 L fish tank (0.80 m height) containing 4-month O. niloticus (n = 25). It was located on a 0.25 m platform above ground level and an adequate water depth (0.50 m). This fish tank was connected to a 200 L filter (made with synthetic grass to retain suspended solids in water, such as fish droppings and uneaten food) and a 200 L biofilter, made with plastic mesh bags containing 2 cm corrugated PVC tubes to increase the colonization area of nitrifying bacteria. The fish tank-containing recirculation system was coupled with the hydroponic system to form the aquaponic culture system (Figure 1) to provide nutrients to the hydroponically-grown plants from fish waste-derived products by nitrifying bacteria action. The E. sativa plants were identically incorporated into the ACS, as performed for the HCS.

2.2.3. Soil Culture System

Twenty-day E. sativa plants (n = 180) were sown in a raised bed using a mixture of silty loam soil and rice husk (8:2 ratio) as the culture soil, with an automatic 2 min drip water irrigation per hour. Monthly fertilization with the commercial product Triple 15® complex, whose composition comprises nitrate (NO3), phosphorus (P2O43−), and potassium (K2O2−) at 15% w/w, was also employed. Three growing cycles were also carried out and maintained under the above-mentioned greenhouse conditions.

2.3. Metabolite Extraction

For the metabolite profiling-based analysis, E. sativa leaves were sampled at two harvest times (21 and 42 DAT) and quickly quenched by freezing in liquid nitrogen. Frozen plant materials were milled in a mortar under liquid nitrogen and freeze–dried by lyophilization. Then, the dried samples were extracted with cold 95% ethanol and filtered. The resulting mixture was concentrated with a rotary evaporator (IKA® RV10) at 35 °C, 90 rpm, and 110 psi to remove the solvent and afford the raw extract.

2.4. Liquid Chromatography Coupled with Mass Spectrometry Analyses

The ethanolic raw extracts were reconstituted with HPLC-grade absolute ethanol (Emsure®, Merck, Darmstadt, Germany) at 2.5 mg/mL, homogenized, and filtered through a polytetrafluoroethylene (PTFE) membrane filter (0.22-µm pore size and 13-mm diameter, MS®PTFE syringe filter, Membrane Solutions). Chromatographic analysis of ethanolic extracts was performed using a liquid chromatographic system (Prominence, Shimadzu, Columbia, MA, USA) coupled with a diode array detector (DAD) SPD-M20A and a mass spectrometry detector (MSD), LCMS-2020, with an electrospray (ESI) interface and a single quadrupole analyzer. The Premier C18 column (150 × 4.6 mm, 5 μm) and a binary mobile phase consisting of 0.05% formic acid (HCOOH) in water (solvent A), and 0.05% HCOOH in acetonitrile (ACN, solvent B), in gradient mode, were used for separations. The gradient program started with 5% of B from 0, then B was gradually raised to 95% at 55 min and kept at this value for 5 min, and finally, the B concentration was decreased to 5% and kept at this composition until 65 min. Flux was 0.5 mL/min, and the injection volume was 20 μL. Separation was monitored at 270 nm. The ESI was operated in positive and negative ion mode (scan 100–1500 m/z), with the desolvation line temperature at 250 °C, nitrogen as nebulizer gas at 1.5 L/min, drying gas at 15 L/min, and detector voltage at 1.4 kV. This detection was combined by LC–HRMS using an Agilent Technologies 1260 liquid chromatography system coupled to a quadrupole-time-of-flight (Q-ToF) mass analyzer with dual Agilent jet stream electrospray ionization (AJS ESI) (Agilent, Santa Clara, CA, USA). Chromatographic parameters were identical to those mentioned above using a C18 column (4.6 mm × 150 mm, 5 µm). The AJS ESI source parameters comprised capillary voltage (3500 V), drying gas (8 L/min), gas temperature (325 °C), nebulizer pressure (50 psi), sheath gas temperature (350 °C), and sheath gas glow (11 L/min). The Q-ToF parameters involved fragmentor voltage (175 V), skimmer voltage (65 V), and octapole radiofrequency peak-to-peak voltage (OCT RF Vpp) (750 V).

2.5. Statistical Analyses

The LC–MS-derived data was used to retrieve the m/z features (i.e., variables) per plant sample (i.e., observations) and employed to create the feature intensity table (FIT) (variables × observations) using MZmine 2.0 through the previously-used preprocessing parameters (peak alignment, normalization by sum, and autoscaling) [21]. This preprocessed FIT was analyzed using the statistical tools in the web-based server Metaboanalyst V5.0 to examine the metabolite variations by multivariate statistics using the default parameters [22]. Hence, sparse partial least-square discriminant analysis (sPLS-DA), analysis of variance (ANOVA) simultaneous component analysis (ASCA), and receiver operating characteristic (ROC) [23] analysis were performed to identify those dataset patterns along culture systems and harvest times.

2.6. Annotation of Statistically Selected, Top-Ranked Metabolites by Culture System and Harvest Time Effect

Those features exhibiting a statistically significant enhancement due to the effects of culture system and harvest times, obtained by variable importance in the projection (VIP) scores (>1), were annotated using the accurate mass data. The metabolite annotation was then achieved using the proposed confidence levels to communicate metabolite identity by high-resolution mass spectrometry (HRMS) [24]. The molecular formula of the selected feature was deduced from the accurate mass measurements related to the quasimolecular ion [M-H] using the online tool ChemCalc [25] (error ≤ 5.0 ppm). Subsequently, the feature annotation was generated after the combined analysis of HRMS-derived data (i.e., accurate mass, molecular formula, and MS fragments), supported by phylogenetic filtering, chromatographic behavior (if possible) and data comparison with literature and different databases, such as the natural products dictionary [26], KNApSAcK [27], and PubChem [28].

3. Results and Discussion

In the present study, the metabolite profile variations of E. sativa leaves by the effect of different culture types, i.e., soil culture system (SCS), hydroponic culture system (HCS), and aquaponic culture system (ACS) along three growing cycles, i.e., GC1, GC2, and GC3, were assessed. Additionally, two harvest times were evaluated, such as the baby leaf harvest (21 DAT) and the traditional harvest (42 DAT).

3.1. Extraction and Chemical Composition of Eruca Sativa Leaves

The effect of the culture system on the specialized metabolite composition of E. sativa leaves along the selected harvest times were investigated after cold ethanolic extraction of the collected leaves from the test culture systems. These extraction conditions provided polar compounds from the collected plant material, such as phenolics and GLSs [9], which required careful handling during extraction to avoid decomposition or hydrolysis, especially GLS and phenolics-containing glucosides. Resulting extracts were analyzed by LC-ESI–MS to obtain the respective metabolite profiles using leaves since they comprise the commercial food product and involve the relevant naturally-occurring compounds in E. sativa [7,8].
The pretreatment of raw LC–MS-derived data resulted in the detected m/z features per prepared extract and was gathered into a dataset to build the FIT. After this compilation, 256 features were retrieved from the entire set of observations, including the three factors (culture systems, harvest times, and growing cycles) employed in the present study. In this regard, various features were found to be shared among extracts of the same plant group and different treatments but varying their intensity and involving notable chemical variations. However, the discrimination was challenging to perform by directly comparing the profiles. Therefore, the resulting FIT (256 × 54) was examined through multivariate statistics over the whole normalized, autoscaled metabolite dataset to recognize metabolite patterns and identify those metabolites influenced by the test factors.

3.2. Multivariate Statistical Analysis on Chemical Data of E. sativa Leaves

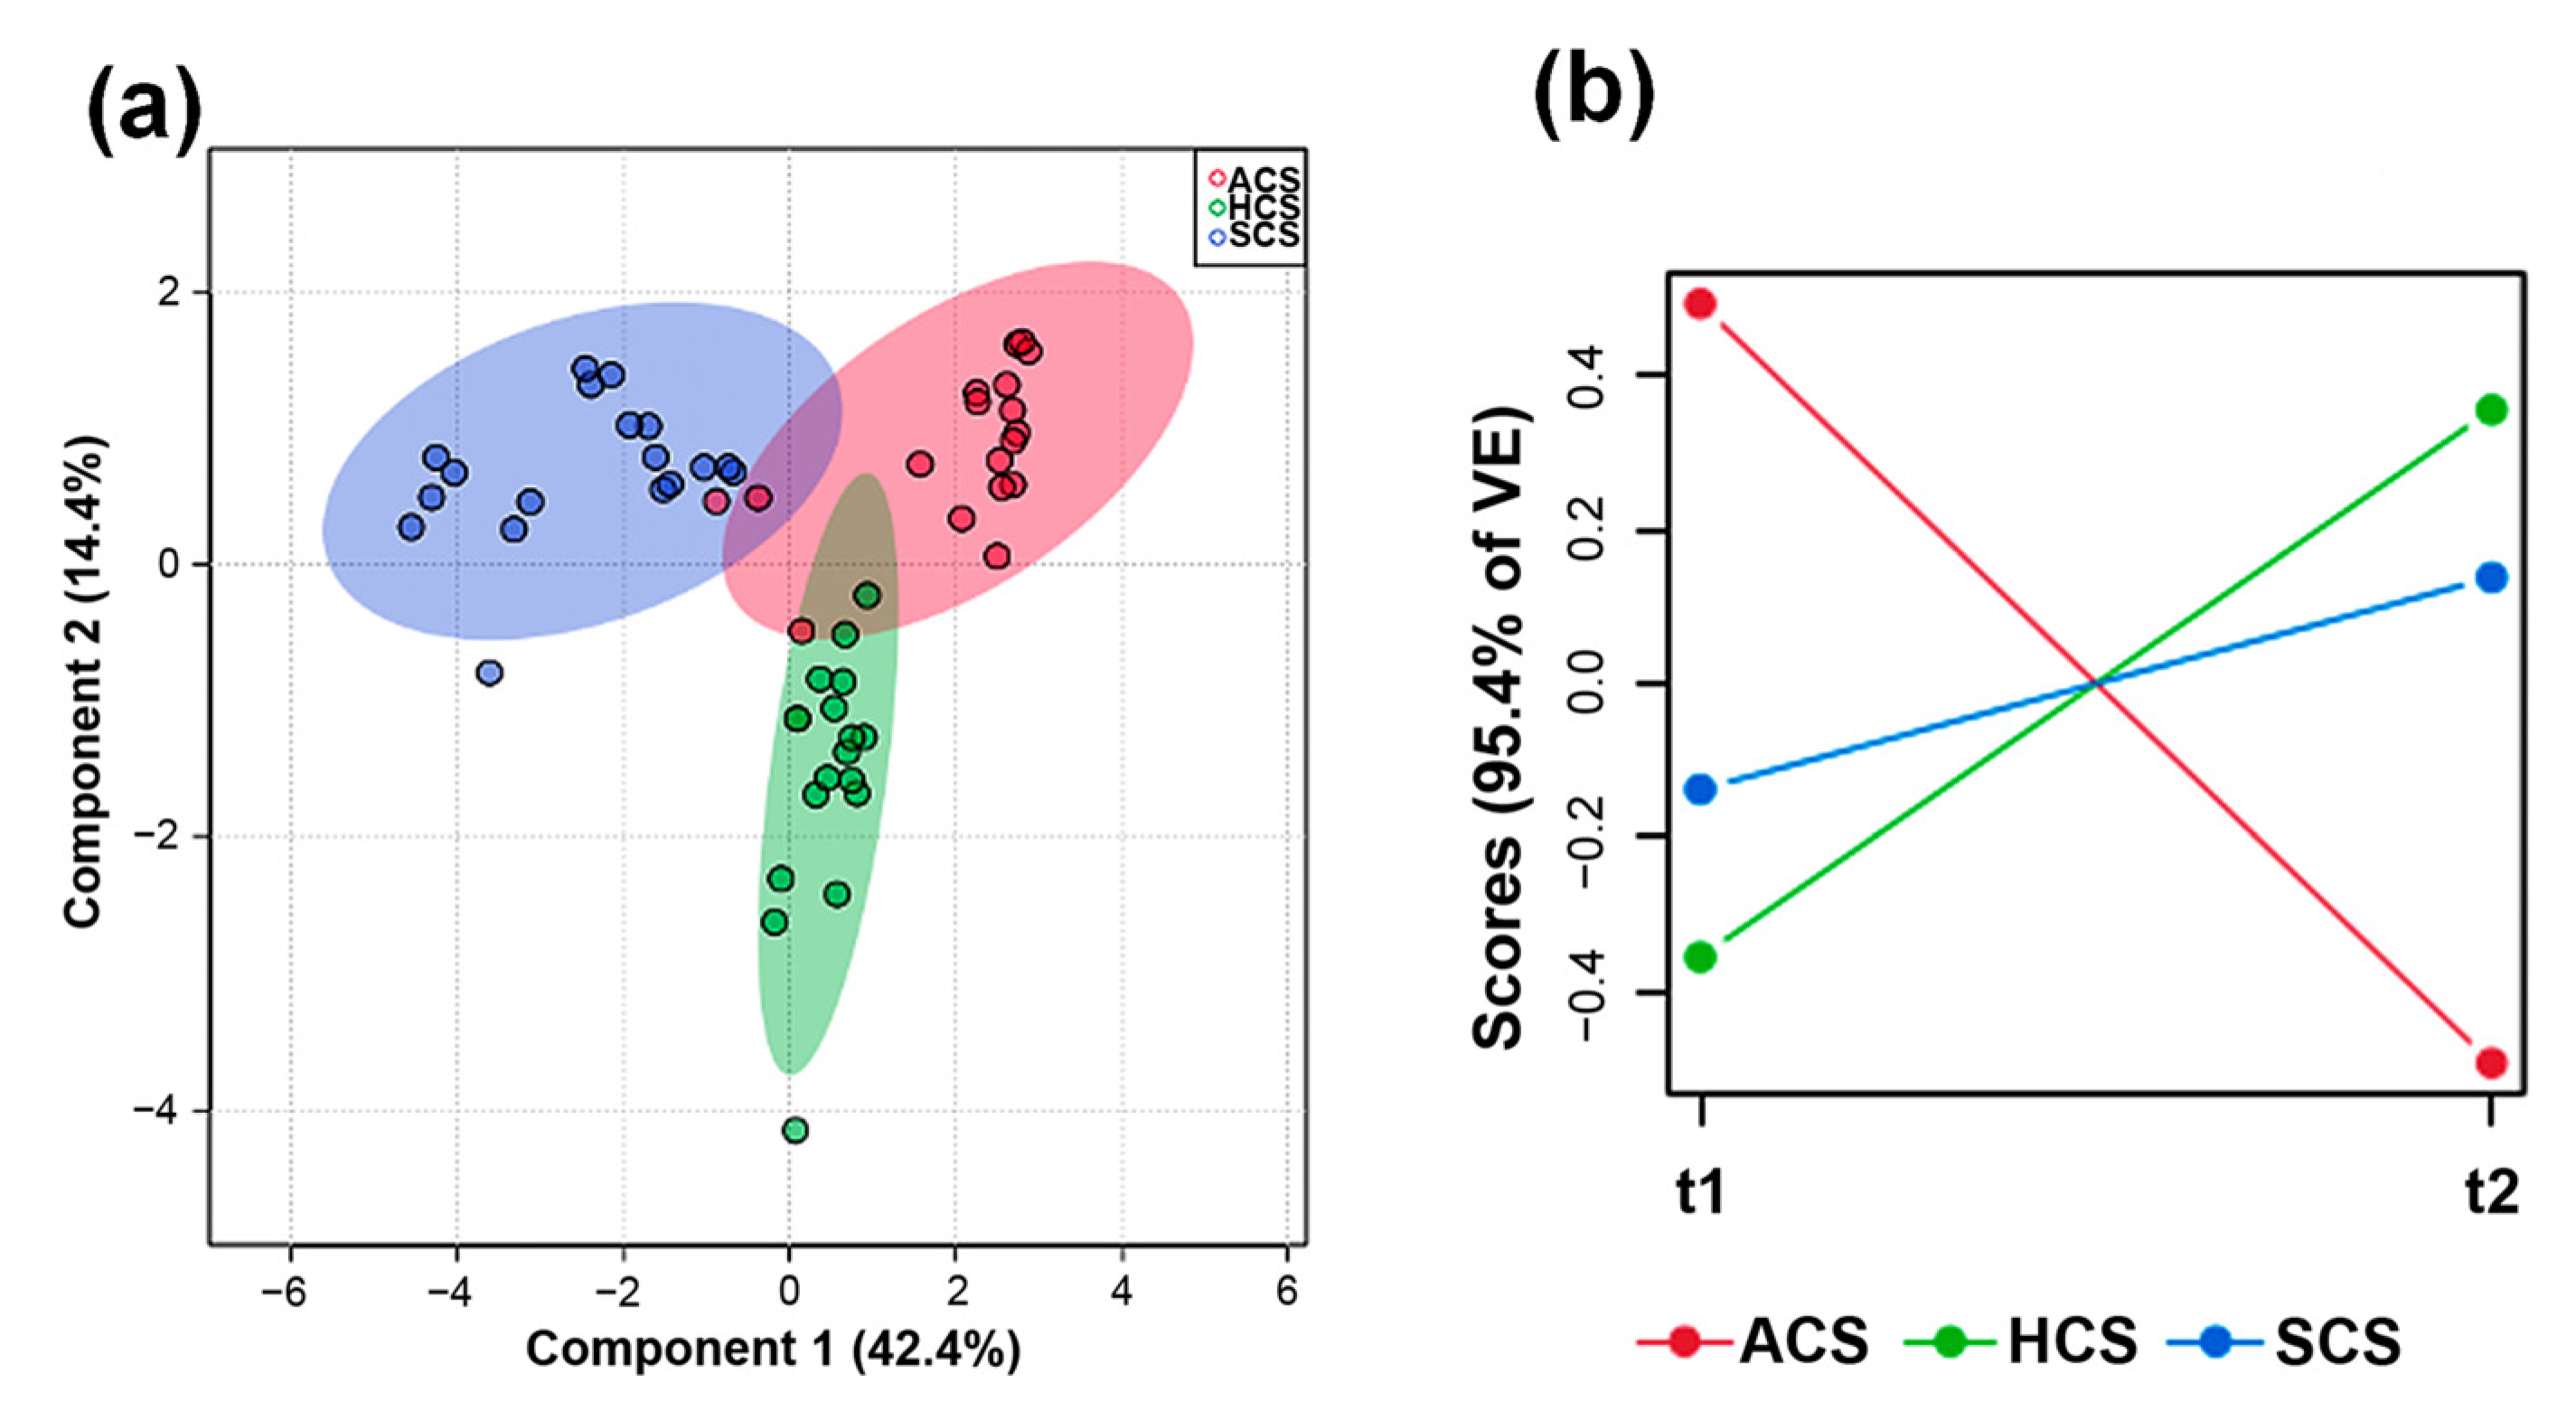
Exploiting the metabolite-based variations began with an sPLS-based analysis of the LC–MS data obtained from the three culture systems (hydroponic, aquaponic, and sowing in soil). The resulting scores plot (Figure 2a) involved a 56.4% explained variance using the two first principal components (PC1, PC2). A separation of the groups was notoriously obtained in the three types of cultivation (Figure 2a), indicating an influence of the culture system type on the metabolite profile of E. sativa leaves. PC1 separated (42.4%) the two soilless culture systems (i.e., ACS and HCS), while PC2 explained the discrimination (14.4%) between the soil and the soilless culture systems.
ASCA models extended this discrimination. The ASCA-derived pattern (Figure 2b) indicated that aquaponic systems–cultivated plants had the most significant effect on the interaction of the explained variance (95.4%), observing a greater variation from t1 (21 DAT) and t2 (42 DAT) of those collected plants from ACS. The HCS and SCS had less effect on the metabolite data variation (Figure 2b). This fact can be rationalized since the plants in both HCS and SCS are sufficiently fertilized to satisfy the crop’s nutrient requirements, supplying all the macronutrients such as N, P, K, Mg, Ca, and micronutrients. On the other hand, ACS is notably featured because the primary nutritional source offered to plants comes from fish excretion products since it is estimated that 70% of the food consumed by fish is excreted in the form of ammonia and nitrate [29]. However, some nutrients, such as P, K, Cu, Fe, Mn, Zn, and S, are limited or null for plants since they represent a tiny percentage of fish feed. In this regard, such deficiencies may be implicated in the metabolite pathways regulation that promotes enhanced or reduced accumulation of specialized products, which finally generate variations in the metabolite profiles [30].
The VIP scores were examined to rank and select those influencing metabolites for factor discrimination in the previous sPLS. In this statistical selection, twelve metabolites (VIP > 1) were found to be implied in the differentiation of culture system types (aquaponic, hydroponic, and soil) and harvest times (t1 and t2). These top-ranked metabolites were annotated (Table 1) based on a combined analysis of accurate mass, molecular formula, and MS fragments, reaching level three of putative identification [31].
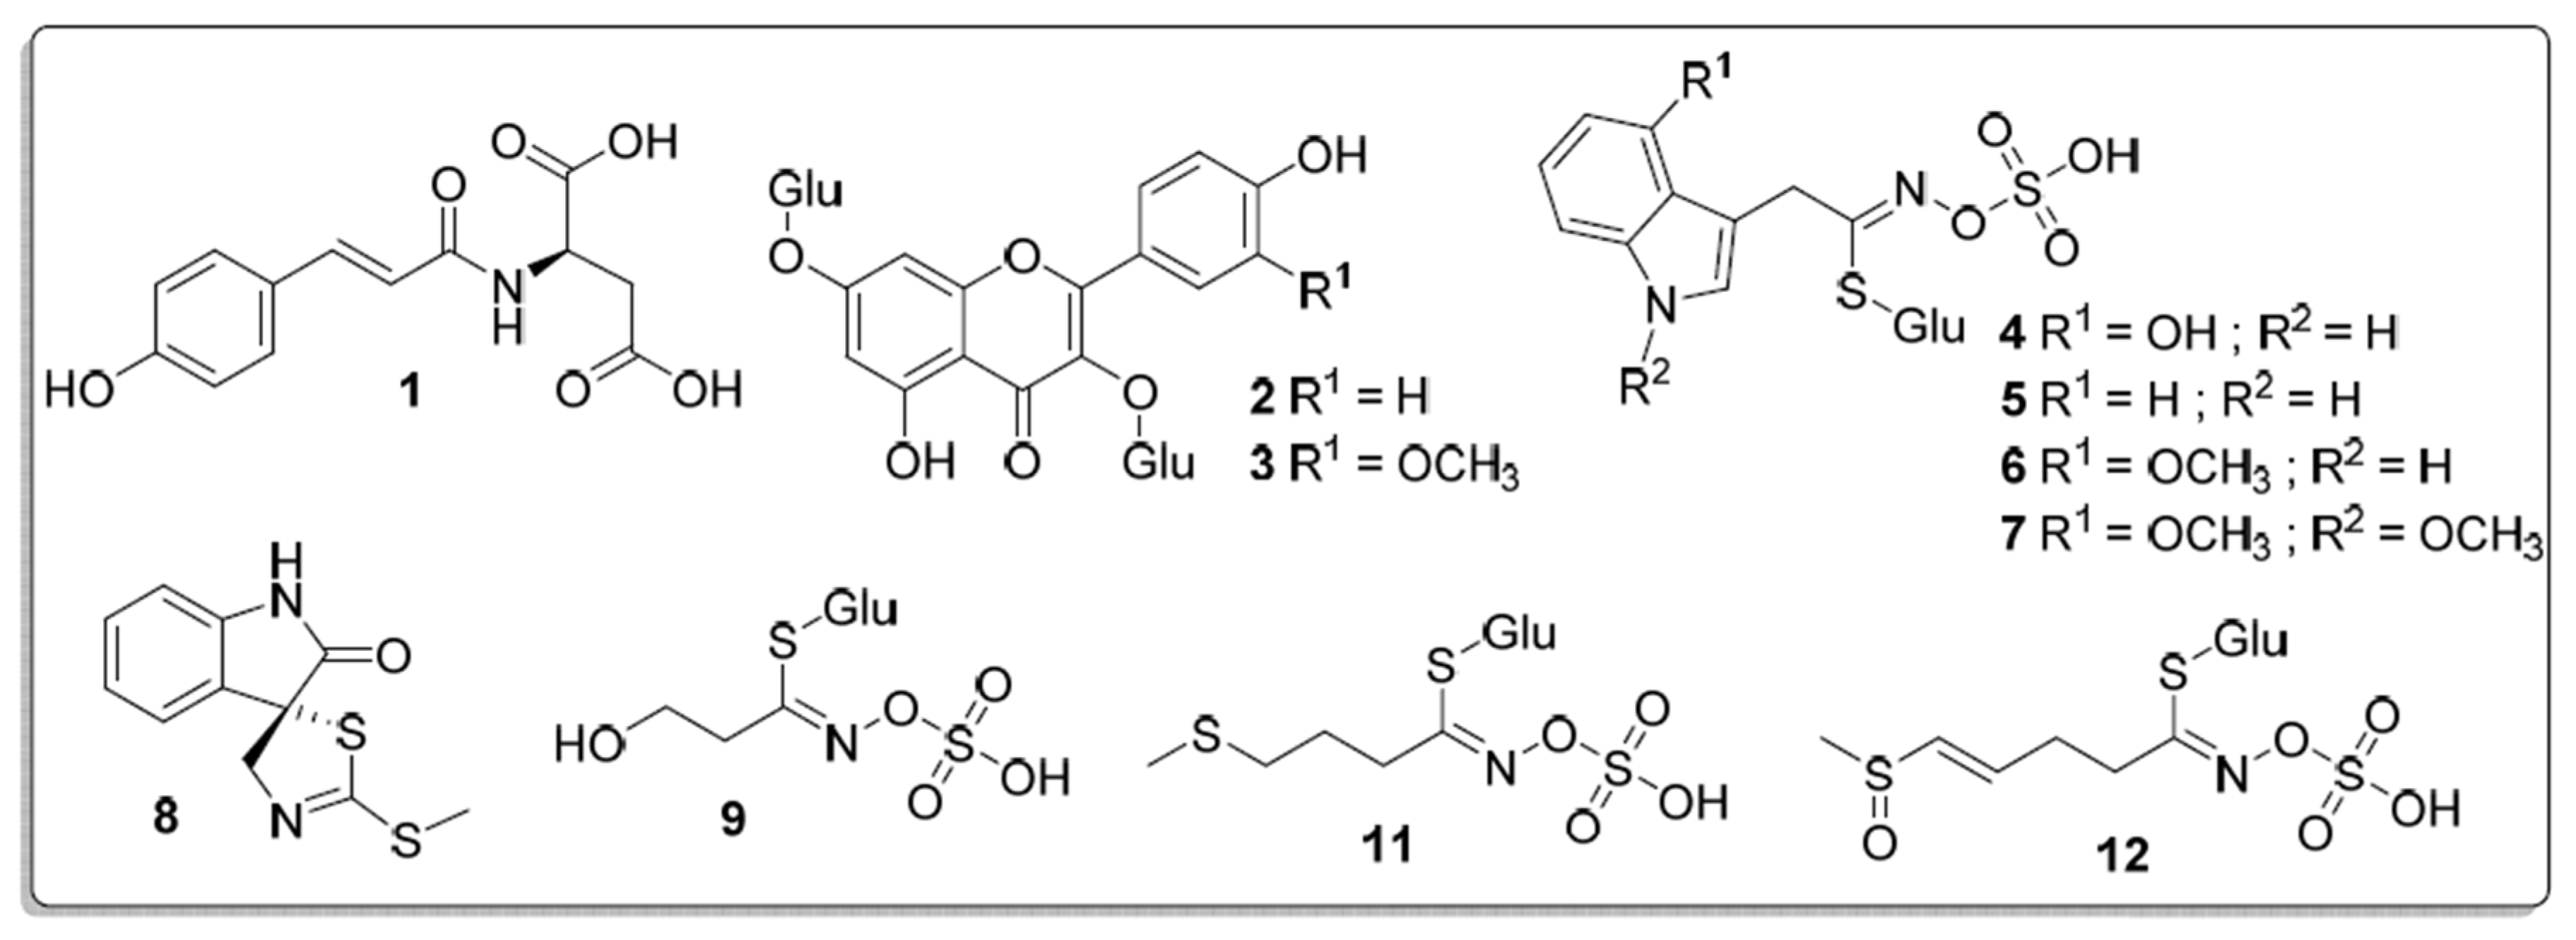
Six types of specialized metabolites were found within the top-ranked metabolite group, such as an amino acid–phenylpropanoid adduct (N-coumaroylaspartate (1)), two flavonols (kaempferol glucopyranoside (2) and isorhamnetin diglucopyranoside (3)), three indole-containing GLSs (4-hydroxyglucobrassicin (4), glucobrassicin (5) and 4-methoxyglucobrassicin (6)), an aliphatic-branched GLS (3-hydroxyethyl glucosinolate (9)), two sulfur-containing side chain GLSs (glucoiberverin (11) and glucoraphenin (12)), and two indolic compounds, recognized as phytoalexins in cruciferace (N,4-dimethoxybrassinin (7) and spirobrassinin (8)) [32]. The group with the highest representation was related to the indole-containing GLSs, biosynthesized from tryptophan, whose involved biosynthetic enzymes are mainly located in the stele and cortex of roots, and are exclusively localized in the parenchyma cells of the phloem [33]. Another relevant compound type is related to sulfur-containing metabolites, known as phytoalexins, and occurs in Brassicaceae plants. These metabolites are produced in plants in response to microbial infection from indole-containing GLSs. There is a biosynthetic phytoalexins precursor, i.e., brasinin, of N,4-dimethoxybrassinin (7), and spirobrassinin (8) [32]. The next group with the highest representation is linked to flavonols, which are synthesized from the phenylpropanoid pathway by the action of enzymes such as isomerases, reductases, hydroxylases, and oxoglutarate-Fe2+. The annotated flavanols corresponded to polyglycosylated kaempferol and isorhamnetin aglycones [34].

3.3. Identification of the Most Important Metabolites per Culture System and Harvest Time

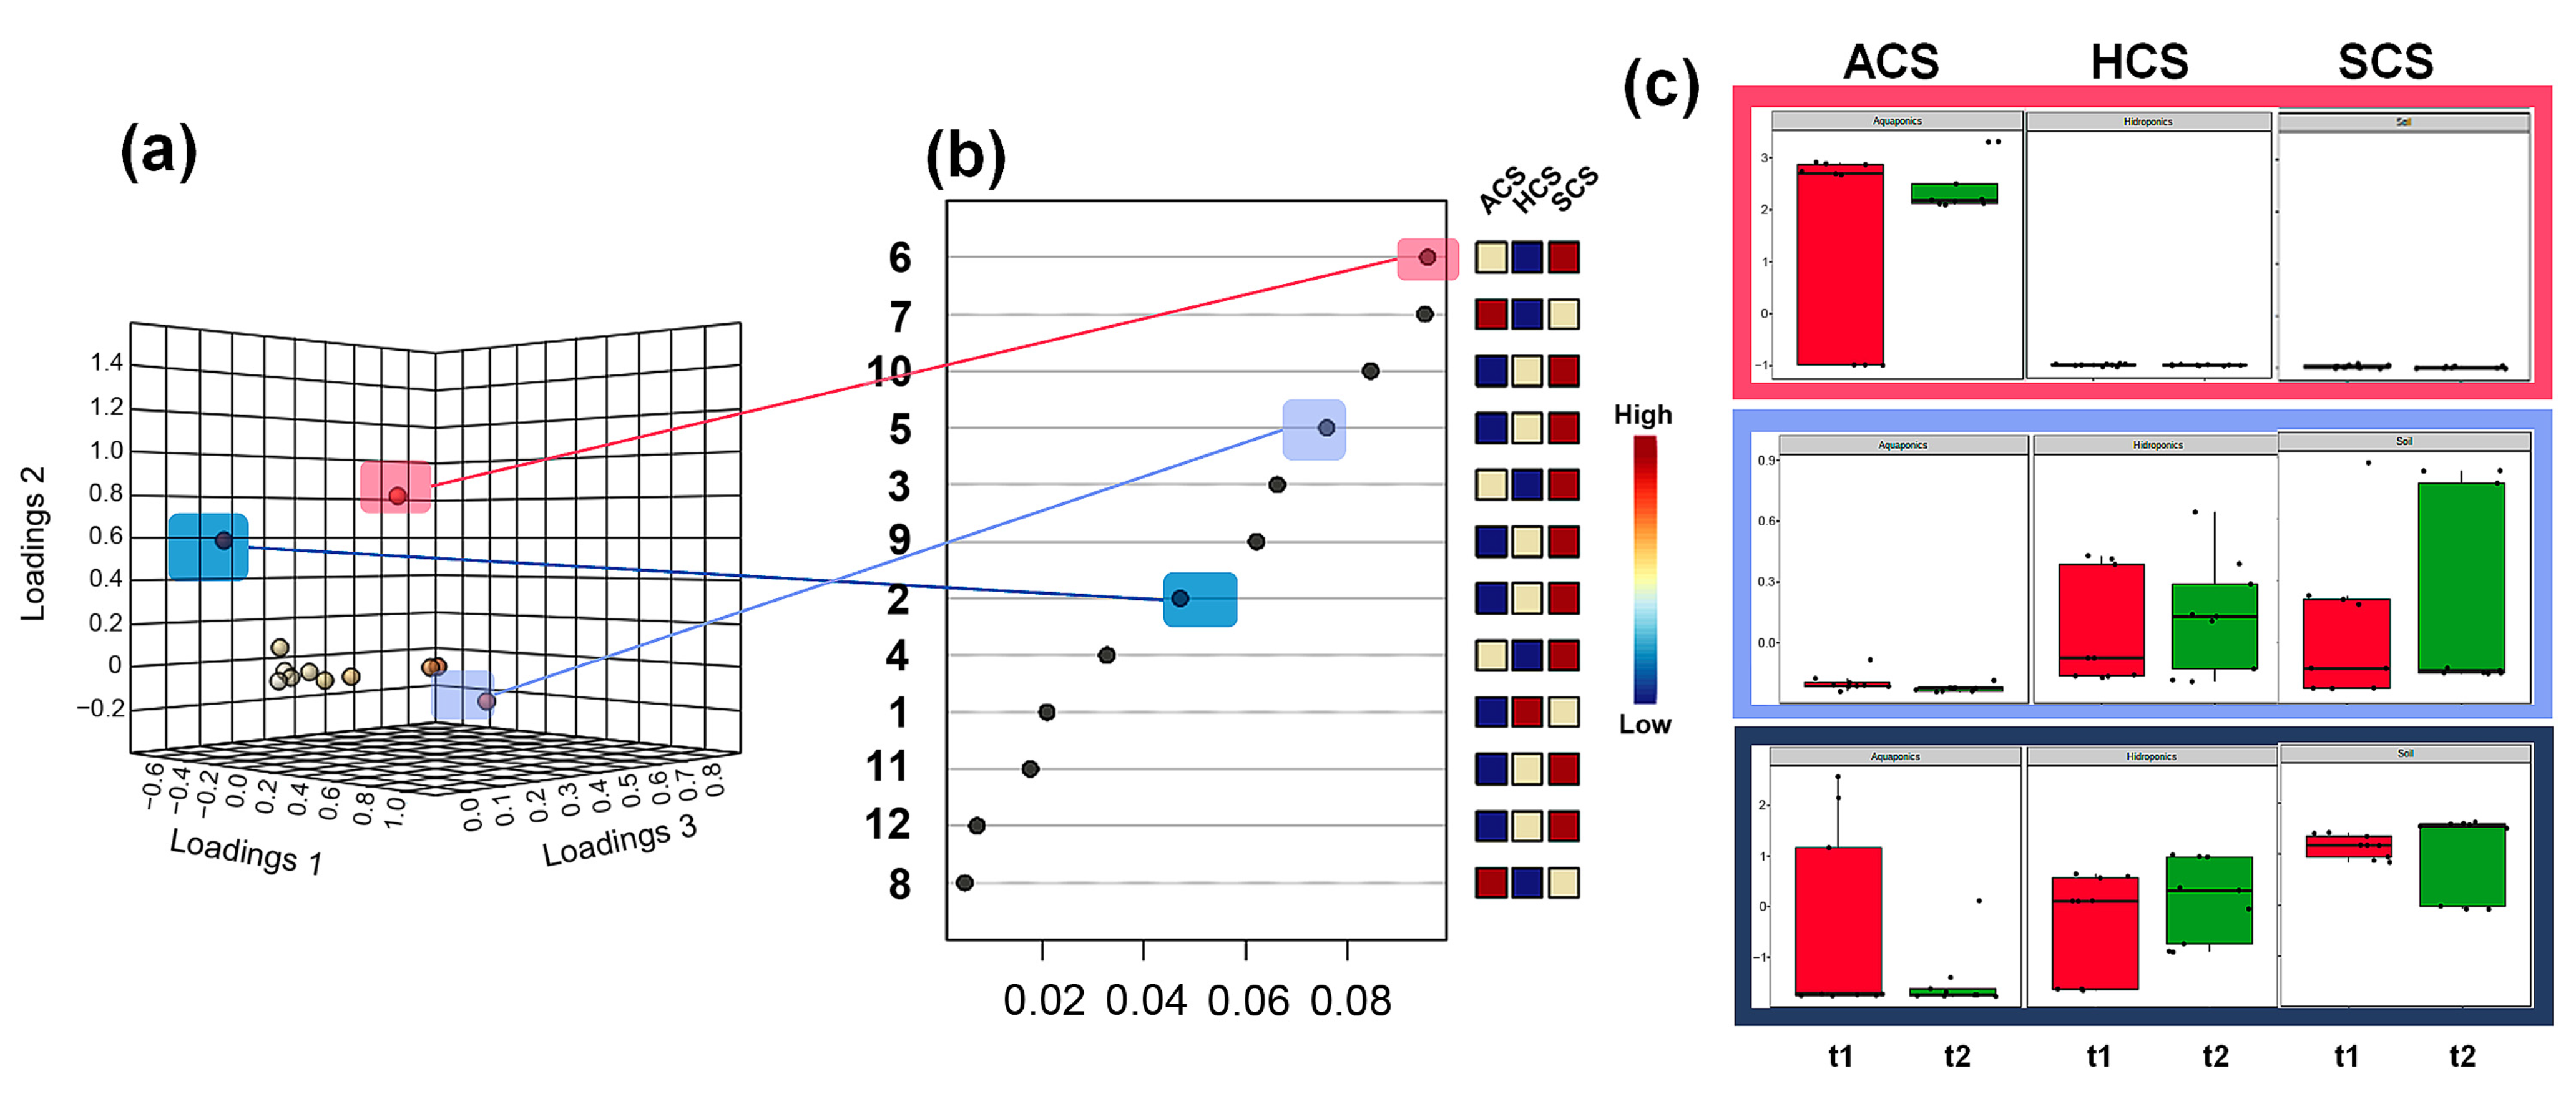
In order to identify the patterns of the top-ranked metabolites for separating the test factors, a loading plot (Figure 3a) from a two-factor iPCA and a mean decrease accuracy plot was built (Figure 3b). Three metabolites were found to be the most important metabolites, i.e., N,4-dimethoxybrassinin (7) to discriminate ACS, and glucobrassicin (5) and kaempferol diglucopyranoside (2) to separate SCS. However, SCS exhibited higher abundances of the other seven top-ranked metabolites (Figure 3b). Only one compound (N-coumaroylaspartate (1)) influenced the discrimination of HCS.
A box plot based on these metabolites’ normalized and autoscaled relative abundances rationalized the previous iPCA-derived observation (Figure 3c). In this regard, compound 7 (see a red box, Figure 3c) exhibited the highest relative abundance in ACS at two harvest times, yet a high variation related to the median for baby leaf (21 DAT) was evidenced. This compound is an oxindoline-type compound, considered a well-recognized cruciferous phytoalexin, particularly induced under microbial stress conditions [35], and biosynthesized from indole-containing GLSs, such as glucobrassicin (5), herein reported as well. One relevant part of the aquaponic system is the biofilter, whose aqueous solution is not regularly changed to maintain nitrifying bacteria, although it is also known to serve as a culture medium for different microorganisms (e.g., bacteria and fungi), which can perform microbial pressure to the ACS-cultivated plants. In this sense, the microbial-diversified entry could be linked to water supply, media reuse, air exchange, or particle carriage for insects and staff. However, corrective and control strategies by pesticides and chemical agents to avoid this entry are still limited because of the possible toxicity for fish and nitrifying bacteria [36]. Hence, once a microbial inoculum contacts the plant, a metabolic defense mechanism can be promoted through phytoalexin upregulation [35].
The SCS-grown plants showed high contents of 5 (purple box, Figure 3c) but high dispersion among growing cycles, having a bimodal trend. On the other hand, SCS promoted the highest relative abundance of 2 regarding HCS in both harvest times (dark blue box, Figure 3c). This compound is present in small amounts in plants of the genus Eruca. It has not been directly reported as a defense metabolite but provides important organoleptic properties to E. sativa as flavor trait perceptions, such as herbaceous, bitterness, and pungency [9]. The bimodal trend observed in the previously mentioned metabolite relative abundances and other metabolites annotated can mainly be due to the influence of the particular conditions of the three growing cycles (GC1–GC3), which cannot be considered repetitions in time. Such growing cycles were performed in three moments of the year, whose temperature and relative humidity exhibited variations. Figure 4a shows that some data was highly dependent on the third growth cycle (GC3). In this cycle, an average temperature of 18.9 °C was observed, which was higher than the other two growing cycles GC1 and GC2 (16.3 °C and 16.7 °C, respectively). Therefore, a temperature effect on the accumulation of such compounds was also evidenced.
For this reason and according to these differences, a heat map was built to visualize the growing cycle with the most separation influence (Figure 4a) and a correlation coefficient plot supervised by the growing cycle (Figure 4b). The temperature effect mainly influenced the accumulation of flavonols 2 and 3 (highly in GC3). Other compounds with less correlation are related to 9 and the unidentified compound 10, which were mainly accumulated in GC3. Bennet et al. [15] cultivated E. sativa plants under controlled temperature conditions averaging 18 °C and obtained high concentrations of glycosylated flavonoids in the leaves, stems, and roots. Temperature seems to be an influencing factor in the expression/accumulation of this type of compound.

3.4. Analysis of Metabolite-Based Markers Associated with the Culture Type and Harvest Time

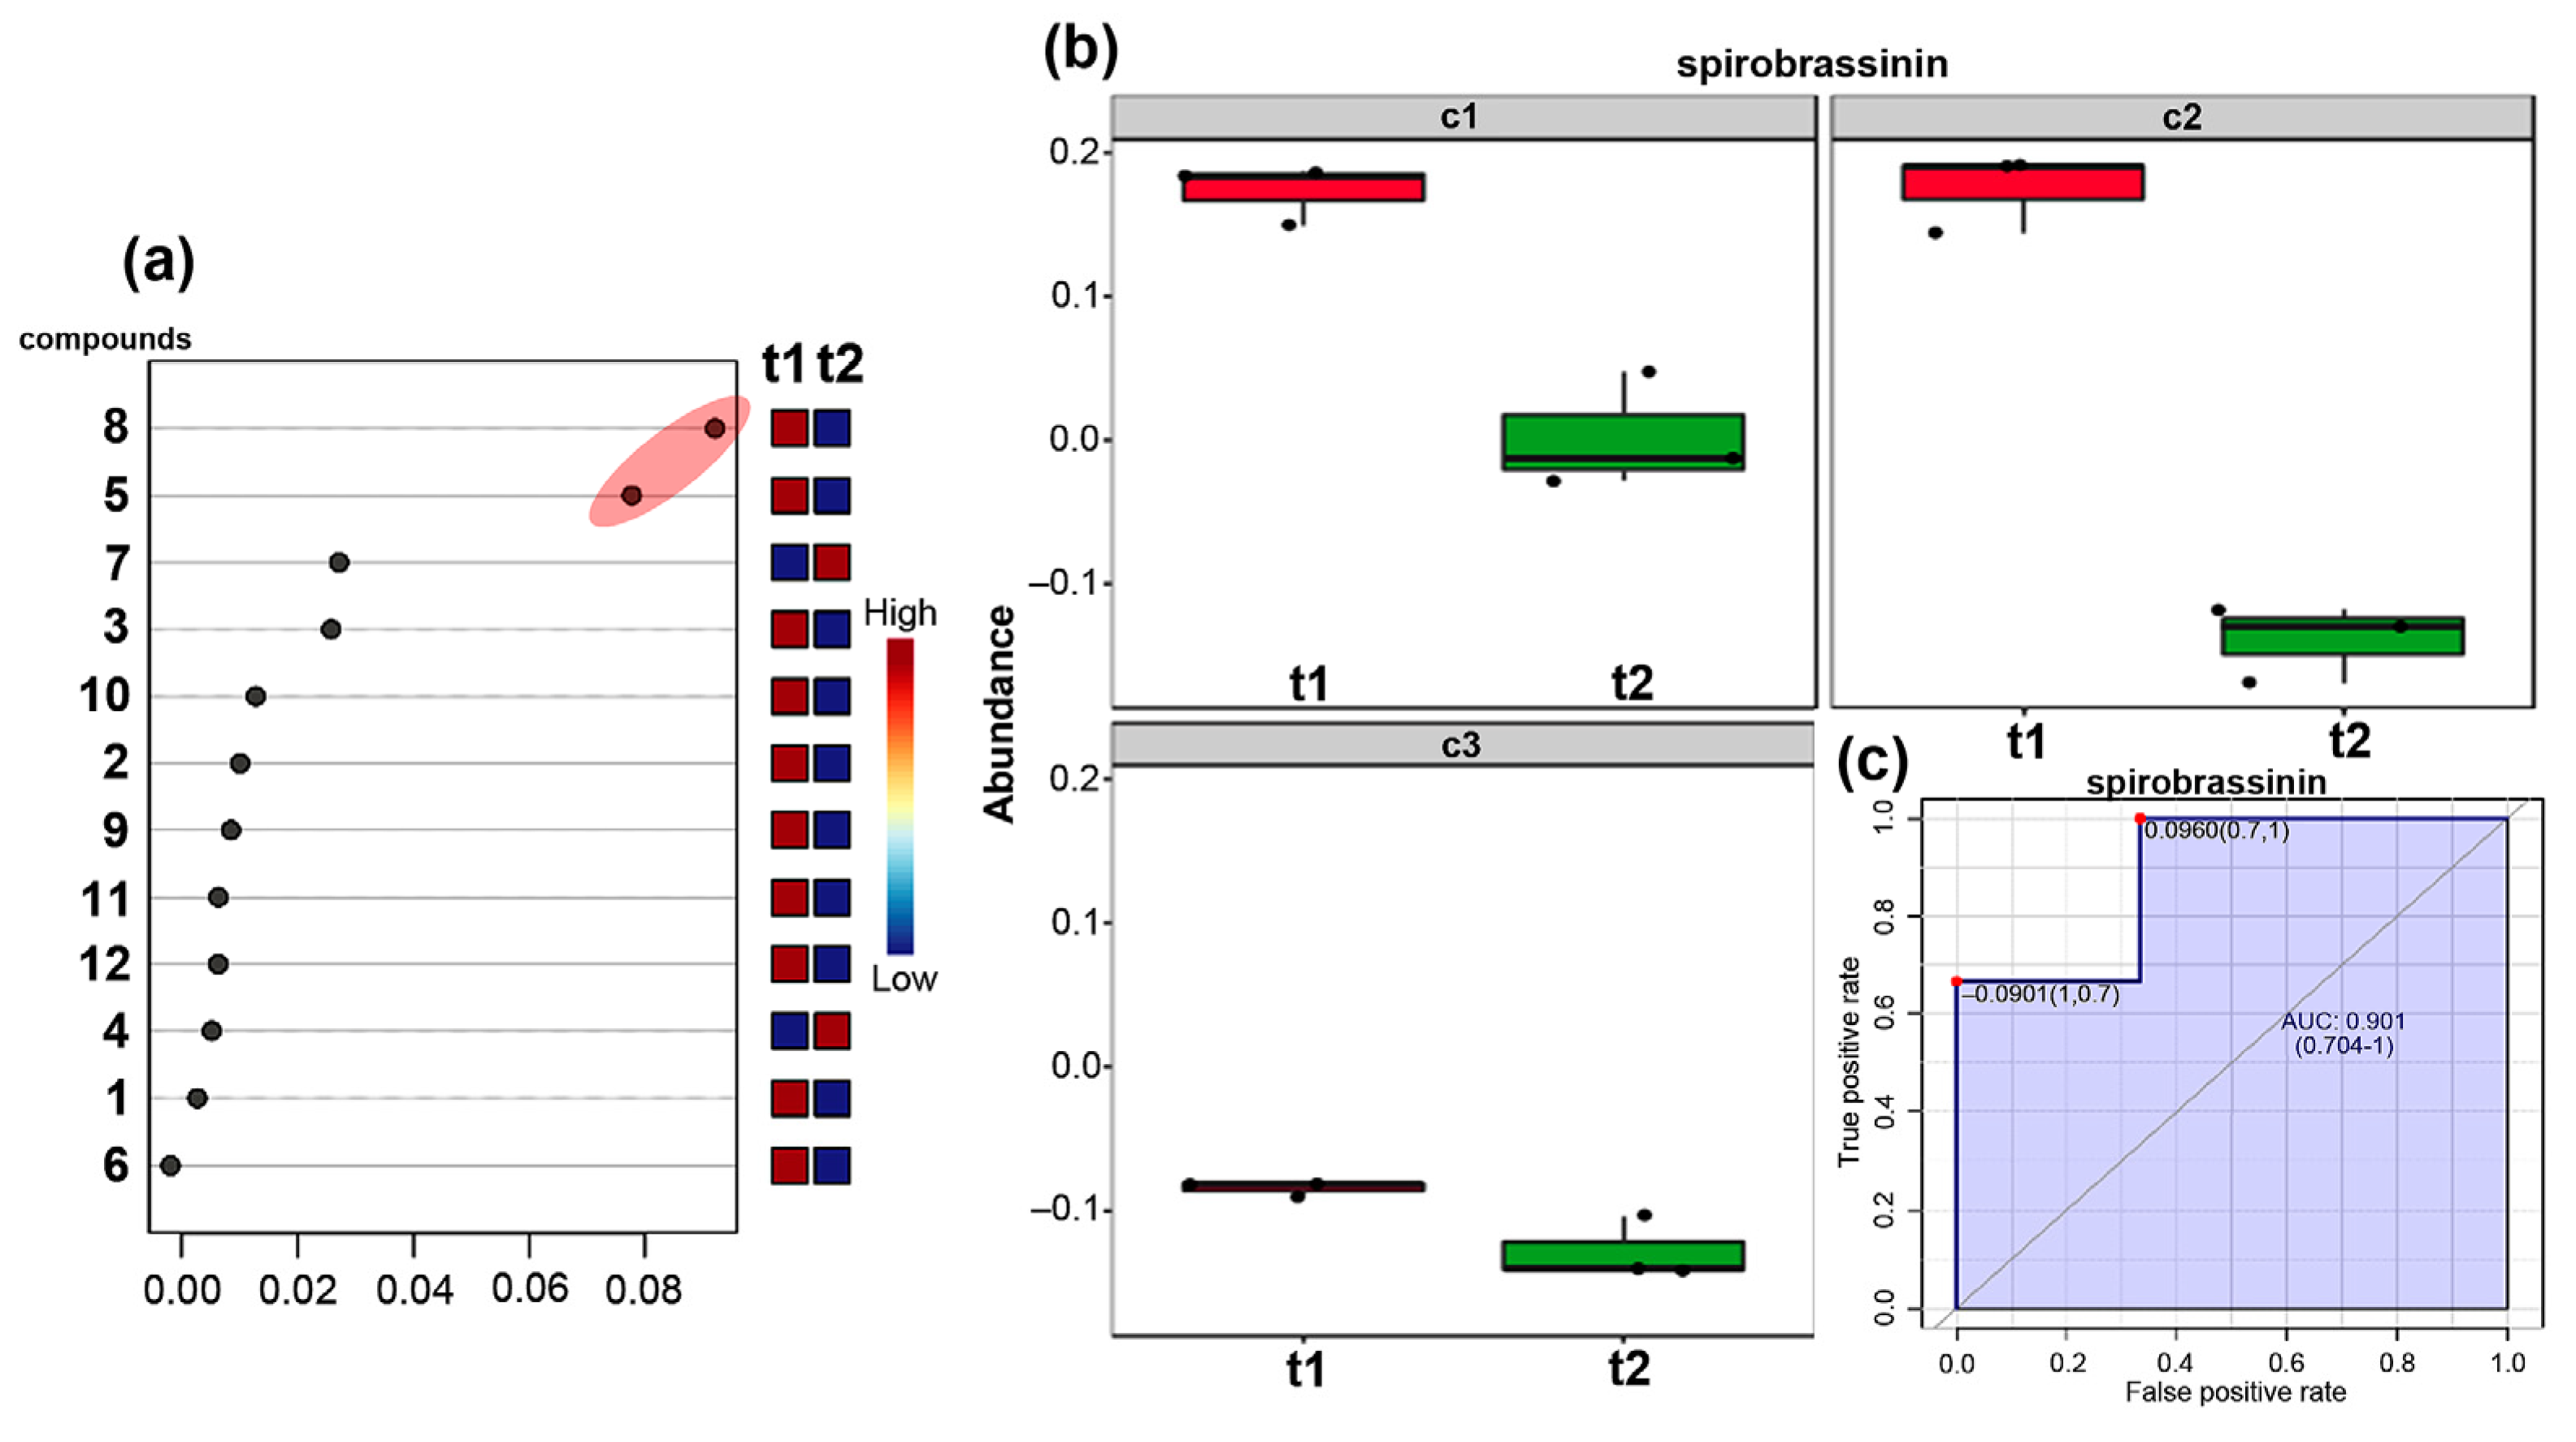
In order to offer a harvest recommendation associated with harvest times, the following criteria were taken: (1) high relative abundance during the three growing cycles means that such a compound can be accumulated independently from the climatic condition, (2) data with low deviation regarding the media, and (3) area under the ROC curves greater than 0.86. After analyzing these three criteria for the twelve top-ranked metabolites, we observed that ACS exhibited a marker associated with 21 DAT, corresponding to spirobrassinin (8) (Figure 5a).
Another important compound was glucobrassicin (5), an indole glucosinolate precursor of indoline-type phytoalexins, such as brassinin and its derivatives. These compounds were found to be accumulated in E. sativa leaves with high relative abundance at 21 DAT (Figure 5b), similar to the results obtained by Bennet et al. [15]. The E. sativa leaves collected at 36 DAT exhibited high concentrations of aliphatic and aromatic GLS. In the analysis of markers associated with harvest time, it is possible to determine that this compound is present in baby leaf materials (21 DAT) cultivated in aquaponic systems, independently of the cultivation cycle. In contrast, HCS presented a high correlation associated with the first harvest time (21 DAT) for three compounds, such as N-coumaroylaspartate (1), spirobrassinin (8), and the unidentified compound (10), indicating a compound accumulation different in nature, which in turn indicates the activation of different metabolic pathways. This fact could occur since this type of system involves a better nutrient supply to the plant, regulating different specialized metabolism pathways. In SCS, compounds with the highest correlation were kaempferol diglucopyranoside (2) and 4-hydroxyglucobrassicin (4), which were associated with a harvest at 21 and 42 DAT, respectively.

4. Conclusions

The evaluated soilless systems (ACS and HCS) were suitable for growing E. sativa under greenhouse conditions. These findings constitute the first report of metabolites, identified as relevant compounds of E. sativa plants cultivated in aquaponic systems. The metabolite accumulation, such as glucosinolates and flavonols, was found to be influenced by the culture type, the harvest time, and even the growing cycle. These variations constituted the criteria to consider when choosing the culture system and the harvest time of E. sativa leaves. ACS-grown E. sativa leaves exhibited the predominant presence of indole-containing glucosinolates, i.e., glucobrassicin (5), and indoline phytoalexins, i.e., dimethoxybrassicin (7), and spirobrassinin (8). Compound 8 was found to be an important marker associated with harvest time t1 (21 DAT). In this regard, it is recommended to harvest young leaves around 21 DAT since they showed the highest content of glucosinolates with reported biological activity. In the same way, it is recommended to identify the microorganisms that occur in the biofilter since a plausible microbial pressure can incite a metabolic response in ACS-cultivated plants. Additionally, during the three growing cycles, it was possible to observe that there are variations in the metabolite composition of E. sativa leaves, particularly by the flavonols, such kaempferol diglucopyranoside (2) and isorhamnetin diglucopyranoside (3), influenced by higher temperatures since they exhibited the highest accumulation in GC3 (18.9 °C). Finally, compound 2 was predominantly present at both harvest times during the soil-based cultivation (SCS). These findings can be adopted as relevant traits to be considered further for growing plants with modulated organoleptic properties, such as strong aroma and pungent taste.

Author Contributions

Conceptualization, I.B.-V. and E.C.-B.; methodology, formal analysis, and investigation, I.B.-V. and R.B.-C.; data curation, writing—original draft preparation, I.B.-V.; writing—review and editing, I.B.-V. and E.C.-B.; validation, resources, supervision, project administration, and funding acquisition, E.C.-B. All authors have read and agreed to the published version of the manuscript.

Funding

This study was funded by MinCiencias (Ministerio de Ciencia, Tecnología e Innovación, Colombia), grant number 513-2014, project code 1123-667-44449, contract FP44842, and Universidad Militar Nueva Granada (UMNG), grant number IMP-CIAS-1921.

Data Availability Statement

The datasets generated during and/or analyzed during the current study are available from the authors upon reasonable request.

Acknowledgments

The authors thank MinCiencias and UMNG for their financial support. The gratitude is extended to the ichthyology research group at UMNG for the support in assembling the soilless culture systems.

Conflicts of Interest

The authors declare no conflict of interest.

Appendix A

Figure A1. Structures of annotated and top-ranked metabolites (identification level = 3) from E. sativa leaves grown under three culture systems. Compound numbering according to the annotated metabolite list of Table 1.
Horticulturae 09 00235 g0a1

References

  1. Filho, A.B.C.; Maia, M.M.; Mendoza-Cortez, J.W.; Rodrigues, M.A.; Nowaki, R.H.D. Seasons of cultivation and splitting of nitrogen fertilization for arugula. Comun. Sci. 2014, 5, 252–258. [Google Scholar]
  2. Garg, G.; Sharma, V. Eruca sativa (L.): Botanical description, crop improvement, and medicinal properties. J. Herbs Spices Med. Plants 2014, 20, 171–182. [Google Scholar]
  3. Abdul, W.M.; Razvi, S.S. Eruca sativa L.—A promising source of drug lead for antimicrobial, neuroprotective and anticancer treatment regimens: Pharmacological properties of medicinal plant “Eruca sativa”. Eur. J. Cell Sci. 2019, 1, 17–21. [Google Scholar] [CrossRef]
  4. Ramazzina, I.; Lolli, V.; Lacey, K.; Tappi, S.; Rocculi, P.; Rinaldi, M. Fresh-cut Eruca Sativa treated with plasma activated water (PAW): Evaluation of antioxidant capacity, polyphenolic profile and redox status in Caco2 cells. Nutrients 2022, 14, 5337. [Google Scholar]
  5. Kim, J.; Jung, Y.; Song, B.; Bong, Y.S.; Ryu, D.H.; Lee, K.S.; Hwang, G.S. Discrimination of cabbage (Brassica rapa ssp. pekinensis) cultivars grown in different geographical areas using 1H NMR-based metabolomics. Food Chem. 2013, 137, 68–75. [Google Scholar]
  6. Kim, S.J.; Ishii, G. Glucosinolate profiles in the seeds, leaves and roots of rocket salad (Eruca sativa Mill.) and anti-oxidative activities of intact plant powder and purified 4-methoxyglucobrassicin. Soil Sci. Plant Nutr. 2006, 52, 394–400. [Google Scholar]
  7. Bell, L.; Oruna-Concha, M.J.; Wagstaff, C. Identification and quantification of glucosinolate and flavonol compounds in rocket salad (Eruca sativa, Eruca vesicaria and Diplotaxis tenuifolia) by LC-MS: Highlighting the potential for improving nutritional value of rocket crops. Food Chem. 2015, 172, 852–861. [Google Scholar] [CrossRef]
  8. Hall, M.K.D.; Jobling, J.J.; Rogers, G.S. Variations in the most abundant types of glucosinolates found in the leaves of baby leaf rocket under typical commercial conditions. J. Sci. Food Agric. 2014, 95, 552–559. [Google Scholar]
  9. Pasini, F.; Verardo, V.; Cerretani, L.; Caboni, M.F.; D’Antuono, L.F. Rocket salad (Diplotaxis and Eruca spp.) sensory analysis and relation with glucosinolate and phenolic content. J. Sci. Food Agric. 2011, 91, 2858–2864. [Google Scholar]
  10. Sarwar Alam, M.; Kaur, G.; Jabbar, Z.; Javed, K.; Athar, M. Eruca sativa seeds possess antioxidant activity and exert a protective effect on mercuric chloride induced renal toxicity. Food Chem. Toxicol. 2007, 45, 910–920. [Google Scholar] [CrossRef]
  11. Kim, B.; Choi, Y.E.; Kim, H.S. Eruca sativa and its flavonoid components, quercetin and isorhamnetin, improveskin barrier function by activation of peroxisome proliferator-activated receptor (PPAR)-α and suppression of inflammatory cytokines. Phyther. Res. 2014, 28, 1359–1366. [Google Scholar]
  12. Doležalová, I.; Duchoslav, M.; Dušek, K. Biology and yield of rocket (Eruca sativa Mill.) under field conditions of the Czech Republic (Central Europe). Not. Bot. Horti Agrobot. Cluj-Napoca 2013, 41, 530–537. [Google Scholar]
  13. Nicola, S.; Hoeberechts, J.; Fontana, E. Comparison between traditional and soilless culture systems to produce rocket (Eruca sativa) with low nitrate content. Acta Hortic. 2005, 697, 549–555. [Google Scholar] [CrossRef]
  14. Ronzón, M.; Hernández, M.P.; Pérez, C.I. Aquaponic production of three vegetables in systems associated to semi-intensive growth of grey tilapia (Oreochromis niloticus). Agroproductividad 2015, 8, 26–32. [Google Scholar]
  15. Bennett, R.N.; Rosa, E.A.S.; Mellon, F.A.; Kroon, P.A. Ontogenic profiling of glucosinolates, flavonoids, and other secondary metabolites in Eruca sativa (salad rocket), Diplotaxis erucoides (wall rocket), Diplotaxis tenuifolia (wild rocket), and Bunias orientalis (Turkish rocket). J. Agric. Food Chem. 2006, 54, 4005–4015. [Google Scholar]
  16. Chun, J.H.; Kim, S.; Arasu, M.V.; Al-Dhabi, N.A.; Chung, D.Y.; Kim, S.J. Combined effect of nitrogen, phosphorus and potassium fertilizers on the contents of glucosinolates in rocket salad (Eruca sativa Mill.). Saudi J. Biol. Sci. 2017, 24, 436–443. [Google Scholar] [CrossRef]
  17. Somerville, C.; Cohen, M.; Pantanella, E.; Stankus, A.; Lovatelli, A. Small-Scale Aquaponic Food Production, 1st ed.; FAO—Food and Agriculture Organization of the United Nations: Rome, Italy, 2014; ISBN 9789251085325. [Google Scholar]
  18. Rodríguez-Delfí n, A. Advances of hydroponics in Latin America. Acta Hortic. 2012, 947, 23–32. [Google Scholar]
  19. Rodríguez-Delfín, A.; Hoyos, M.; Chang, M.; Castro, G.; Barreda, E.; Tamo, J. Evaluation of growth and yield of ‘roja arequipeña’ onion grown in two natural substrates. Acta Hortic. 2005, 697, 505–510. [Google Scholar]
  20. Rodríguez-Delfín, A.; de Jesus López-Herrera, A.; Rojas-Rojas, V.; García-Galindo, B.F. Yield evaluation of lettuce grown in three modified NFT systems in pandemic times. Curr. Top. Agron. Sci. 2022, 2. [Google Scholar]
  21. Cárdenas-Laverde, D.; Rincón-Aceldas, S.; Coy-Barrera, E. Identification of antifungal compounds from Piper plants against Fusarium oxysporum: An untargeted metabolite profiling-based approach. Nat. Prod. Commun. 2022, 17, 1934578X221089995. [Google Scholar]
  22. Chong, J.; Wishart, D.S.; Xia, J. Using metaboAnalyst 4.0 for comprehensive and integrative metabolomics data analysis. Curr. Protoc. Bioinforma. 2019, 68, e86. [Google Scholar] [CrossRef]
  23. Zheng, Y.; Cai, T.; Feng, Z. Application of the time-dependent ROC curves for prognostic accuracy with multiple biomarkers. Biometrics 2006, 62, 279–287. [Google Scholar]
  24. Schymanski, E.L.; Jeon, J.; Gulde, R.; Fenner, K.; Ruff, M.; Singer, H.P.; Hollender, J. Identifying small molecules via high resolution mass spectrometry: Communicating confidence. Environ. Sci. Technol. 2014, 48, 2097–2098. [Google Scholar] [CrossRef]
  25. Molecular Formula Finder. Available online: https://www.chemcalc.org (accessed on 12 December 2022).
  26. Dictionary of Natural Products. Available online: https://dnp.chemnetbase.com/ (accessed on 15 December 2022).
  27. KNApSAcK Core System. Available online: http://kanaya.naist.jp/knapsack_jsp/top.html (accessed on 13 December 2022).
  28. PubChem. Available online: https://pubchem.ncbi.nlm.nih.gov/ (accessed on 17 December 2022).
  29. Roosta, H.R.; Hamidpour, M. Effects of foliar application of some macro- and micro-nutrients on tomato plants in aquaponic and hydroponic systems. Sci. Hortic. 2011, 129, 396–402. [Google Scholar] [CrossRef]
  30. Yildiz, H.Y.; Robaina, L.; Pirhonen, J.; Mente, E.; Domínguez, D.; Parisi, G. Fish welfare in aquaponic systems: Its relation to water quality with an emphasis on feed and faeces-A review. Water 2017, 9, 13. [Google Scholar] [CrossRef]
  31. Creek, D.J.; Dunn, W.B.; Fiehn, O.; Griffin, J.L.; Hall, R.D.; Lei, Z.; Mistrik, R.; Neumann, S.; Schymanski, E.L.; Sumner, L.W.; et al. Metabolite identification: Are you sure? And how do your peers gauge your confidence? Metabolomics 2014, 10, 350–353. [Google Scholar] [CrossRef]
  32. Pedras, M.S.C.; Okanga, F.I.; Zaharia, I.L.; Khan, A.Q. Phytoalexins from crucifers: Synthesis, biosynthesis, and biotransformation. Phytochemistry 2000, 53, 161–176. [Google Scholar]
  33. Huber, A.M.; Mamyrova, G.; Lachenbruch, P.A.; Lee, J.A.; Katz, J.D.; Targoff, I.N.; Miller, F.W.; Rider, L.G. Early illness features associated with mortality in the juvenile idiopathic inflammatory myopathies. Arthritis Care Res. 2014, 66, 732–740. [Google Scholar]
  34. Falcone Ferreyra, M.L.; Rius, S.P.; Casati, P. Flavonoids: Biosynthesis, biological functions, and biotechnological applications. Front. Plant Sci. 2012, 3, 222. [Google Scholar] [CrossRef] [Green Version]
  35. Gupta, S.K. Biotechnology of Crucifers; Gupta, S.K., Ed.; Springer: Berlin/Heidelberg, Germany, 2013; ISBN 9781461477952. [Google Scholar]
  36. Goddek, S.; Joyce, A.; Wuertz, S.; Körner, O.; Bläser, I.; Reuter, M.; Keesman, K.J. Decoupled Aquaponics Systems. In Aquaponics Food Production Systems; Goddek, S., JoyceBenz, A., Kotzen, G., Burnell, G.M., Eds.; Springer Open: Wageningen, The Netherlands, 2019; pp. 201–229. ISBN 9783030159429. [Google Scholar]
Figure 1. Schematic illustration of the hydroponic (HCS) and aquaponic (ACS) culture systems. (a) The HCS is enclosed by the purple box. (b) The HCS coupled with the closed recirculation system represents the ACS.
Horticulturae 09 00235 g001
Figure 2. (a) Sparse partial least squares discriminant analysis (sPLS-DA) for E. sativa leaves profiled by LC–MS used for showing metabolic differences between SCS = traditional soil culture system, HCS = hydroponic culture system, ACS = aquaponic culture system (accumulated explained variance = 56.4% between principal component 1 (PC1) and PC2), (b) Interaction of PC1 through ANOVA-simultaneous component analysis (ASCA), PC1 variance explained (VE) = 95.4%.
Horticulturae 09 00235 g002
Figure 3. (a) Three-dimensional loadings lines generated from two-factor PCA on the relative abundance of top-ranked metabolites, discriminating by culture type and harvest time, along three principal components (PC1 = 0.810, PC2 = 0.127, PC3 = 0.026. (b) Loadings plot-derived rankings showing the highly top-ranked metabolites per culture type (SCS = soil culture system, HCS = hydroponic culture system, ACS = aquaponic culture system); interesting metabolites are highlighted in colored rectangles. (c) Box plot of top-ranked metabolites for each harvest time 21 DAT (in red) or 42 DAT (in green). Metabolites are numbered according to the annotated metabolite list presented in Table 1.
Horticulturae 09 00235 g003
Figure 4. (a) Heat map from Euclidean distances supervised by the culture type (SCS = soil culture system, HCS = hydroponic culture system, ACS = aquaponic culture system) and growing cycle (GC1, GC2, and GC3). (b) Correlation coefficient plot showing the top of metabolites that generated the greatest (pink bars) and lowest (aquamarine bars) influence on the separation per growing cycle.
Horticulturae 09 00235 g004
Figure 5. (a) Loadings plot to rank the annotated metabolites per harvest time. t1 = 21 days after transplanting (DAT); t2 = 42 DAT; (b) box plot of the top-ranked metabolite (8 = spirobrassinin, Table 1), comparing harvest times t1 (red box) and t2 (green box) per cultivation system; (c) receptor operator curve (ROC) for the top-ranked metabolite 8 in the aquaponic system (area under curve value (AUC) = 0.901. Metabolites are numbered according to the annotated metabolite list presented in Table 1.
Horticulturae 09 00235 g005
Table 1. Top-ranked annotated metabolites in Eruca sativa-derived extracts after LC–MS analysis.
NoRt (min)[M+H]+ m/z[M-H] m/zMetaboliteAccurate Mass [M-H]Type
18.5280278N-coumaroylaspartate 278.0677APA
218.1611609kaempferol diglucopyranoside609.1466F
318.4641639isorhamnetin diglucopyranoside 639.1573F
420.24654634-hydroxyglucobrassicin463.0471ICG
521.5449447glucobrassicin447.0541ICG
621.94794774-methoxyglucobrassicin 477.0649ICG
725.9297295N,4-dimethoxybrassinin295.0584IP
826.8251249spirobrassinin249.0142IP
933.0364362hydroxyethylglucosinolate362.0222ABG
1036.4504502unidentified502.1563-
1137.4408406glucoiberverin407.0382SCG
1242.5436434glucoraphenin434.0261SCG
Listed compounds were annotated under the combined analysis of [M+H]+, [M-H] quasimolecular ions, accurate mass, molecular formula, and MS fragments. Classification of compounds according to chemical structures: F = flavonol; IP = indoline phytoalexins; ICG = indole-containing glucosinolates (GLS); ABG = Aliphatic-branched GLS, SCG: Sulfur-containing aliphatic chain GLS, APA = amino acid–phenylpropanoid adduct. Structures of annotated metabolites in Figure A1.
Disclaimer/Publisher’s Note: The statements, opinions and data contained in all publications are solely those of the individual author(s) and contributor(s) and not of MDPI and/or the editor(s). MDPI and/or the editor(s) disclaim responsibility for any injury to people or property resulting from any ideas, methods, instructions or products referred to in the content.