Article

Exogenous Appliance of Nano-Zeolite and Nano-Silicon Elevate Solidago canadensis Invasive Plant Tolerance to Water Deficiency

by
Eman Z. Othman
1,
Asmaa B. El-Attar
1,
Reham M. El-Bahbohy
2,
Sarah N. Abd El-Khalek
3,
Sherif H. Morgan
2 and
Abdel Wahab M. Mahmoud
2,*
1
Department of Ornamental Horticulture, Faculty of Agriculture, Cairo University, Giza 12613, Egypt
2
Department of Agricultural Botany, Plant Physiology Division, Faculty of Agriculture, Cairo University, Giza 12613, Egypt
3
Department of Medicinal and Aromatic Plants Research Department, Horticulture Research Institute, Agricultural Research Center (ARC), Giza 12619, Egypt
*
Author to whom correspondence should be addressed.
Horticulturae 2023, 9(2), 172; https://doi.org/10.3390/horticulturae9020172
Submission received: 19 December 2022 / Revised: 13 January 2023 / Accepted: 26 January 2023 / Published: 28 January 2023
(This article belongs to the Section Biotic and Abiotic Stress)

Abstract

:
Plant production, soil quality, and a sustainable environment depend on climate change. Drought is a multidimensional stressor that seriously affects plant production. The most sensitive plant to climate change is the invasive goldenrod (Solidago canadensis L.), which has potentially high-value materials that can be used to develop a novel approach to controlling its spread. This study aimed to evaluate the impact of different applications (NPK-chemical fertilizers (T1) as control, nano-silicon (T2), nano-NPK (T3), nano-zeolite-loaded nitrogen (T4), and mixed nano-silicon with nano-zeolite-loaded nitrogen (T5)) on plant growth, flowering, chemical composition, yield, essential oil (EO) productivity, and tolerance of water deficit under newreclaimed soil. The results show that T5 application enhanced morphological traits and photosynthetic parameters (photosynthetic rate, CO2 concentration, and water use efficiency while reducing transpiration rate) in goldenrod plants. Moreover, it promoted the plant nutrients uptake compared to the control. The highest total carbohydrate, flavonoid, and phenol contents, as well as a significant amount of the phytohormone indole-3-acetic acid (IAA), were obtained from the T5 application. Conversely, abscisic acid (ABA) and antioxidant enzymes of catalase (CAT) and superoxide dismutase (SOD) appeared with the highest amounts in control plants (T1).Th interaction effect of T5 and drought stress is indicated by increased EO productivity and therapeutic properties.Previous results provide a way to elevate drought stress resistance for the safety production of S. canadensis and improve their qualitative and quantitative trials as economical solutions to achieve an environmental approach to control their spread.

1. Introduction

Abiotic stresses are the most destructive threat to sustainable agriculture and crop productivity worldwide [1]. The unpredictability of the natural environment caused by global warming, climate changes with the continuously growing population, and the severe economic contractions caused by COVID-19 induce an adverse effect on crop yield and water resources [2]. The top environmental stress that harms plant growth and development is drought, which forms about 70% of the potential losses of plant production globally [3]. Meanwhile, drought stress is due to many factors such as rainfall distribution and quantity, evapotranspiration, and soil moisture [4]. Plant tolerance to drought stress varies among species, strains, growth stages, drought periods, and intensity [3]. Water deficit inhibits plant growth by inducing changes in molecular, biochemical, physiological, morphological, and ecological traits and processes, thus negatively affecting plant productivity and quality [4,5]. Mahmoud et al. [6] noted that drought stress causes a decrease in plant biomass and some critical changes that occur in the leaves, such as reduced stomatal conductance and gas exchange rates, which lead to decreasing plant photosynthetic efficiency. In addition, drought stress increases oxidative stress, alterations in metabolism, and disruptions of enzyme activities, which damages cells of multiplication and elongation [7]. Zulfiqar et al. [8] indicated that the reduced leaf water capacity is a primary outcome of drought in plants, thus reducing the photosynthesis activity by the closing of stomata, membrane injury, and accumulation of reactive oxygen species (ROS). On the other hand, Pingping et al. [9] reported that in some blooming plants under drought conditions, floral buds appeared earlier due to the shortened vegetative phase, promoted flowering, and physiological maturity, which is an adaptation trait of drought tolerance. Climate change is a permanent predictor of the increased prevalence of water scarcity, although water is the core of sustainable development [10]. Therefore, drought conditions can be uncontrolled and lead to decreased plant performance and nutrient deficiency, as well as poorly fertile soil [11]. This forces farmers to use more synthetic input uncontrollably, which affects the environment and human health. The excessive use of chemical fertilizers can result in many irremediable problems, such as soil and water toxicity, an enormous waste of mineral resources, environmental contamination, and even become responsible for the emission of greenhouse gases [12].
The current agricultural trends emphasize finding novel methods for adaptation to water deficiency with the mitigation of chemical fertilizers by using nano-fertilizers (NFs) or nanoparticles [13]. They are the best tools in modern sustainable agriculture techniques, being eco-friendly, low-cost, and more effective in improving plant performance and soil quality and improving ecosystems [14]. Nanoparticles (NPs) are smaller than 100 nm in at least one dimension and have a unique effect, better than their bulk-scale counterparts, without any toxic impact on soil fertility and ecosystem health while maintaining the input cost [15,16]. NFs encapsulated with nanomaterials represent a final product of nanotechnology due to their nanoscale size with a vast surface area that ensures the optimum uptake and utilization of nutrients and supports plant growth under stress conditions [17]. Consequently, Xin et al. [18] found that the utilization of CNPs as soil drench is highly efficient in releasing their contents in the proper location of the plant root, thus enhancing the growth, biomass, and tolerance of environmental stress by diminishing oxidative injuries and improving agronomic traits. Furthermore, the application of silicon (Si) as a nano-micronutrient is most influential in reducing the adverse impacts of different abiotic stresses [19]. It is the second most abundant element after oxygen in the Earth’s crust and recently became a quasi-essential element [20]. Si has numerous benefits as a crucial player in regulating plant growth and conferring tolerance to various environmental stresses by reducing the accumulation of ROS and membrane lipid peroxidation in the roots more than in leaves [21]. Some studies indicated that Si acts as a physico-mechanical barrier in the cell walls of the epidermis and vascular tissue, which regulate by individual processes related to improving growth and increasing the defense mechanisms for mitigation of drought stress [22]. Mahmoud et al. [23] used Zn, B, Si, and zeolite NPs as soil applications and found that nanoparticles had a positive effect on the multiple physiological, biochemical, and metabolic processes for enhanced plant performance under stressful conditions. Likewise, the physical and chemical properties of nano-zeolites (n-ZEs) make them suitable soil amendments and organizers of water and nutrient contents [24]. Additionally, nano-sized zeolites (n-ZEs) can retain macro- and micro-minerals and slowly release into the soil solution as smart nano-carriers and are widely available and inexpensive [25]. As a result, Hassan et al. [26] mentioned that n-ZEs enriched with potassium can be used as a safe amendment with hydrophilic and organophilic properties in agriculture to promote sustainable crop production during the dry season. Remarkably, the n-ZEs could retain Zn and slowly be released into the soil solution over a period of 1176 h, while the Zn release from the ordinary ZnSO4 ceased within 216 h [27]. Mahmoud et al. [28] used ammonium ZE nano-fertilizer on Carum carvi plants and reported high N uptake, vigorous plant growth and yield, and better EO productivity compared to ammonium fertilizers under drought conditions.
Some medicinal flowering plant species have economic, ornamental, and environmental values due to their robust reproduction, rapid propagation, high tolerance, and adaptability to abiotic stress, and are known as invasive plants [29]. Solidago canadensis L. (goldenrod) is a valuable ornamental and medicinal plant grown in dry and humid areas [30,31]. It is a perennial belonging to the Asteraceae family, native to the eastern part of North America [32]. Goldenrod plants can form aboveground clonal shoots from persistent below-ground rhizomes used in vegetative reproduction and propagate easily by wind-distributed seeds [33]. Goldenrod also has a magnificent yellow flower with high longevity post-harvest used for decoration, being among the top 25 most popular flowering plants [34]. Earlier, goldenrod species were widely used in traditional medicine as botanical therapies for treating many diseases [35]. Goldenrod is a source of several vital secondary metabolites and contains a large spectrum of bioactive compounds, which have recently shown important anticancer activities [36]. Therefore, goldenrods were recently produced through the development of methods for the simultaneous utilization of ecologically invasive plants and became a potential economic source for biodiversity conservation and landscape restoration [37]. Above all this, goldenrods are more sensitive to climate change and have a visibly strong response to growth due to their opportunistic nature [38]. Moreover, the ability to use their natural products for sustainable management could represent the control of their spread. Nevertheless, the recent advances in this field are limited.
Therefore, the first objective of this study was to evaluate the effects of adding NPK, Si, and ZEs to the soil as nanoparticles on the morphology, physiology, and productivity of S. canadensis plants subjected to drought stress. The second objective was to propose NPs as a substitute for synthetic fertilizers to stimulate plant development associated with mitigating environmental stresses besides and enhancing their tolerance abilities. The last objective was to establish a foundation for a balanced management proposal for improving EO yield and quality to maintain an acceptable degree of goldenrod invasion under climate change scenarios.

2. Materials and Methods

2.1. Experimental Site

An open field study was carried out in sandy soil at a private new reclaimed farm, Ismailia Governorate, Egypt (latitude: 30°36′15.37″ N, longitude: 32°16′20.10″ E) during two successive growing seasons in 2020 and 2021. At the Soil, Water, and Environment Research Institute, Agriculture Research Centre (ARC), the soil properties were analyzed according to Richards [39] and Jackson [40], and they are shown in Table 1.

2.2. Plant Material, Transplant, and Harvest Date

Solidago canadensis L. seedlings with 10 leaves, 10 cm tall with intact roots, were obtained from Floramax company in Mansoria, Giza, Egypt. The seedlings were planted on 21 April 2020 and 2021 in a moist open field, spaced 100 cm among rows and 30 cm between plants in 3 × 5 m plots. Irrigation water was supplied as seedlings needed for two months, and then a drip irrigation network with a 2.0 Lh−1 flow rate was established [41]. Field capacity was calculated under dripping irrigation when water zones overlapped on the line. Farm irrigation was practiced in 6-day intervals. Harvest was carried out on 20 July in both seasons.

2.3. Soil Preparation

Before planting, compost as organic fertilizer was added to all plots at a rate of five tons fed−1 (one feddan = 4200 m2) as recommended by the Agriculture Ministry of Egypt. Then, the soil was prepared before planting seedling replenishment by ploughing mechanically, leveling twice, and all plots were established. The chemical analyses of organic matter (compost) in the ARC were performed according to Richards [39] and Jackson [40], and they are shown in Table 2.

2.4. Chemical Fertilizers

During the soil preparation, chemical fertilization of calcium superphosphate (15.5% P2O5)and potassium sulfate (48% K2O) at a rate of 4.29 and 1.19 kg 100 m−2, respectively, were incorporated into the soil as recommended by the Agriculture Ministry of Egypt. Nitrogen fertilization (ammonium sulfate, 20.5%) was added at a rate of 3.29 kg 100 m−2 and split into three equal doses, starting after complete sprouting (30 days after planting), and two more times at 45-day intervals between applications throughout both seasons.

2.5. Synthesis of Nano-Zeolite (n-ZE)-Loaded Nitrogen Particles

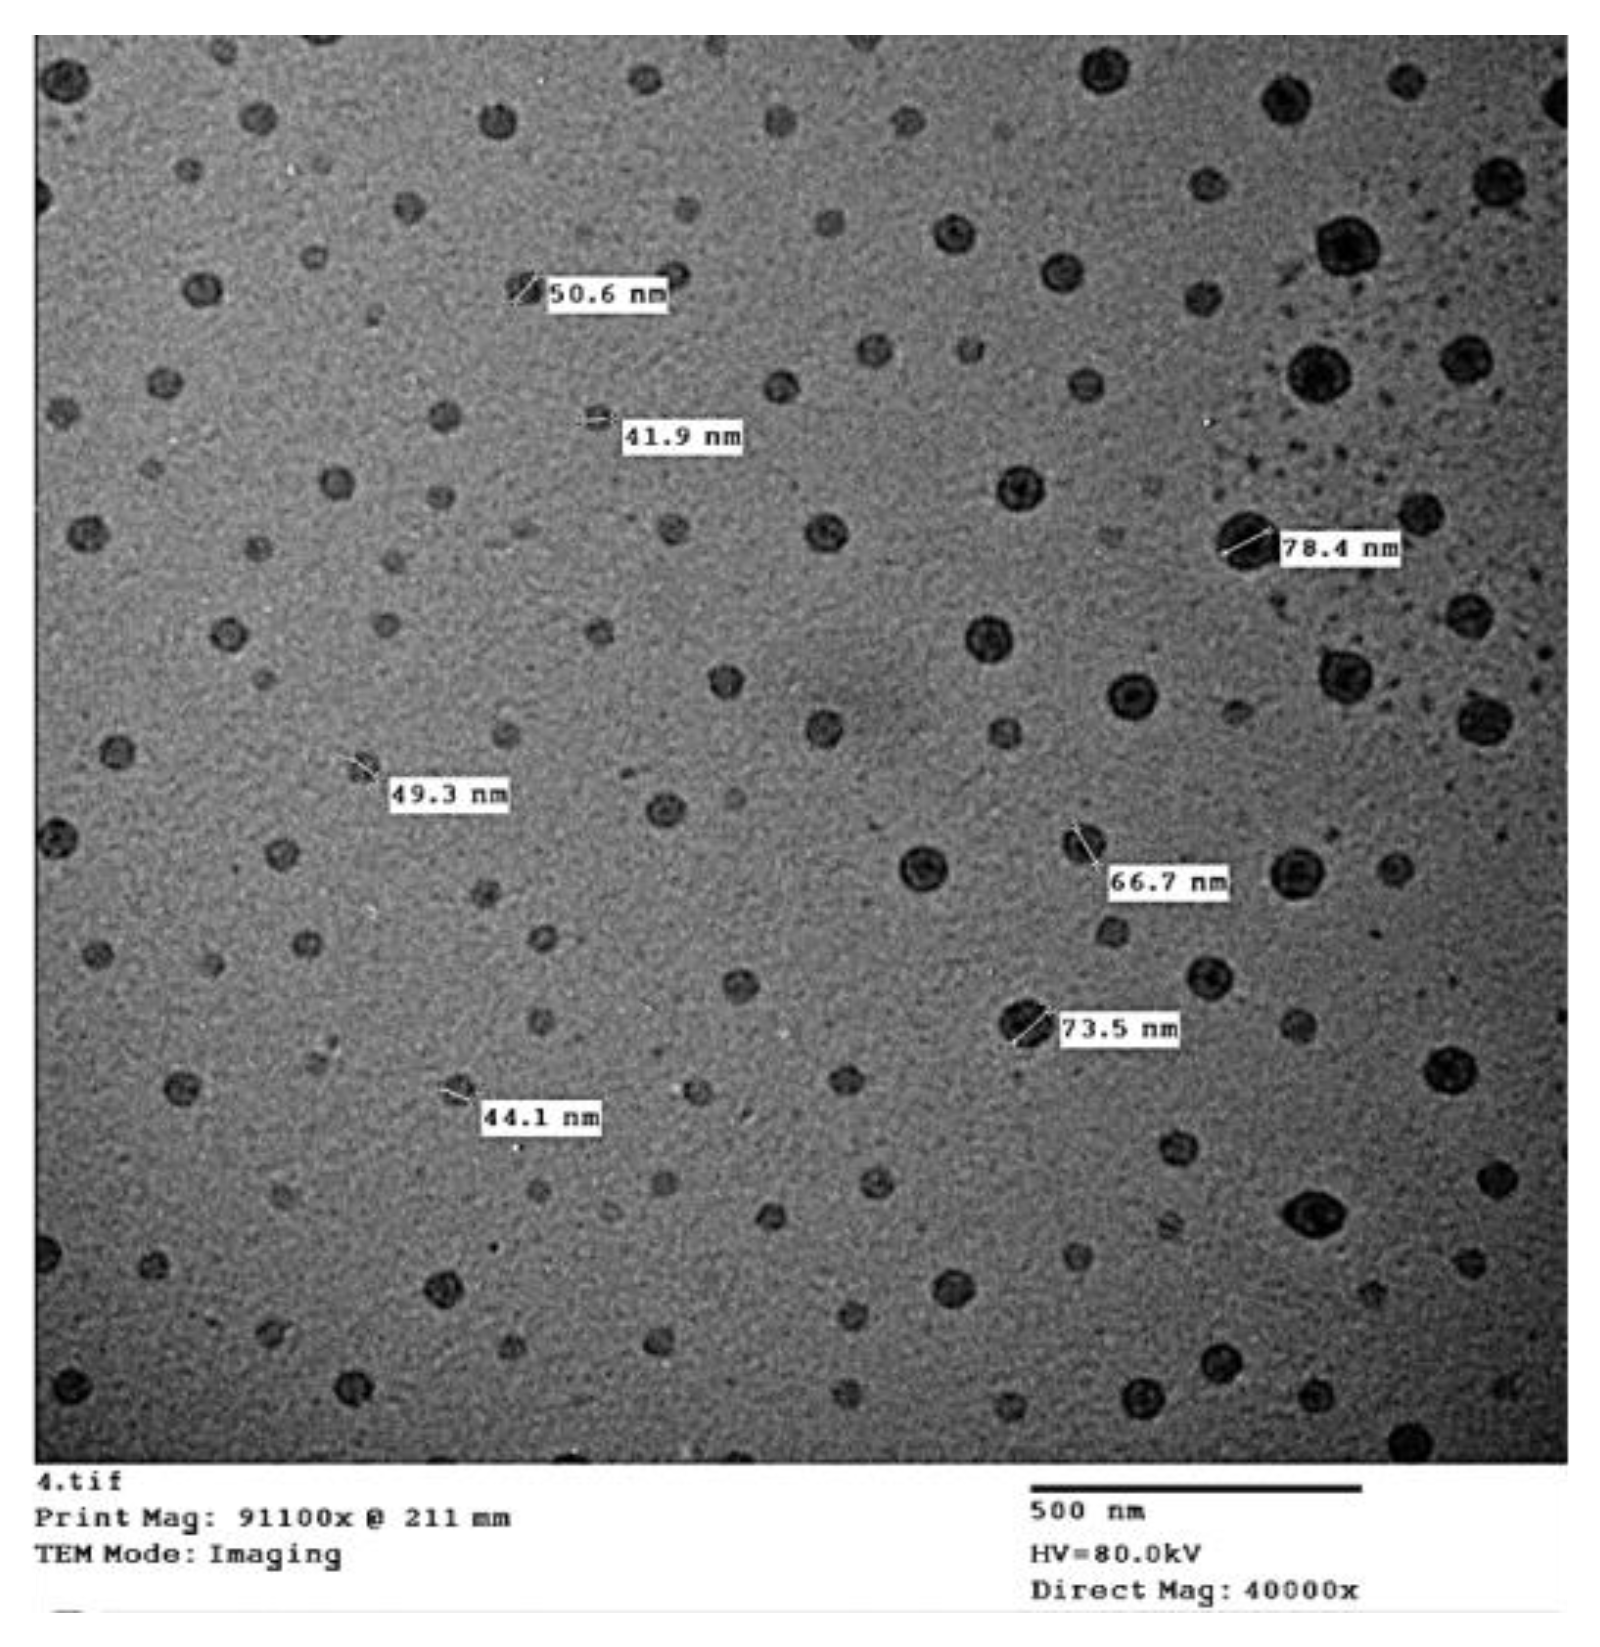
N-ZEswere prepared according to Hassan and Mahmoud [42] and then loaded with nitrogen (Table 3; Figure 1) by soaking in 1M ammonium sulfate solution for 5 days at 25 °C under aeration conditions according to Li et al. [43]. A transmission electronic microscope (TEM) was used for analysis and imaging was conducted at the Research Park, Faculty of Agriculture, Cairo University (FA-CURP), Egypt. The total N content was analyzed using the Kjeldahl digestion method [44]. ZEs nano-loaded with N was applied with dripping irrigation at a rate of 1.3 L fed−1 through the irrigation network 15 days before planting and 20, 35, 55, and 75 days after planting.

2.6. Synthesis of Silicon Nanoparticles

Silicon nanoparticles (n-Si) were synthesized from their precursors, and all pre-cursors were used as silicon tetrachloride [SiCl4], and reagents were purchased from Sigma-Aldrich Chemical Co. (St. Louis, MO, USA). N-Si (Figure 2) was prepared using the method defined by Zhu and Gong [45] and published elsewhere [23]. A JEOL 1010 transmission electron microscope at 80 kV (JEOL, Japan) was used to explore the morphology and size of the nanoparticles. The transmission electron microscopy (TEM) inspection used one drop of the nanoparticle solution applied to a carbon-coated copper grid, then dehydrated at room temperature for 24 h. N-Si particles were applied through the irrigation system network at the rate of 25 mg L−1 on days 20, 35, 45, and 70 after planting in both seasons.

2.7. Synthesis of Nitrogen, Phosphorus, and Potassium Nanoparticles

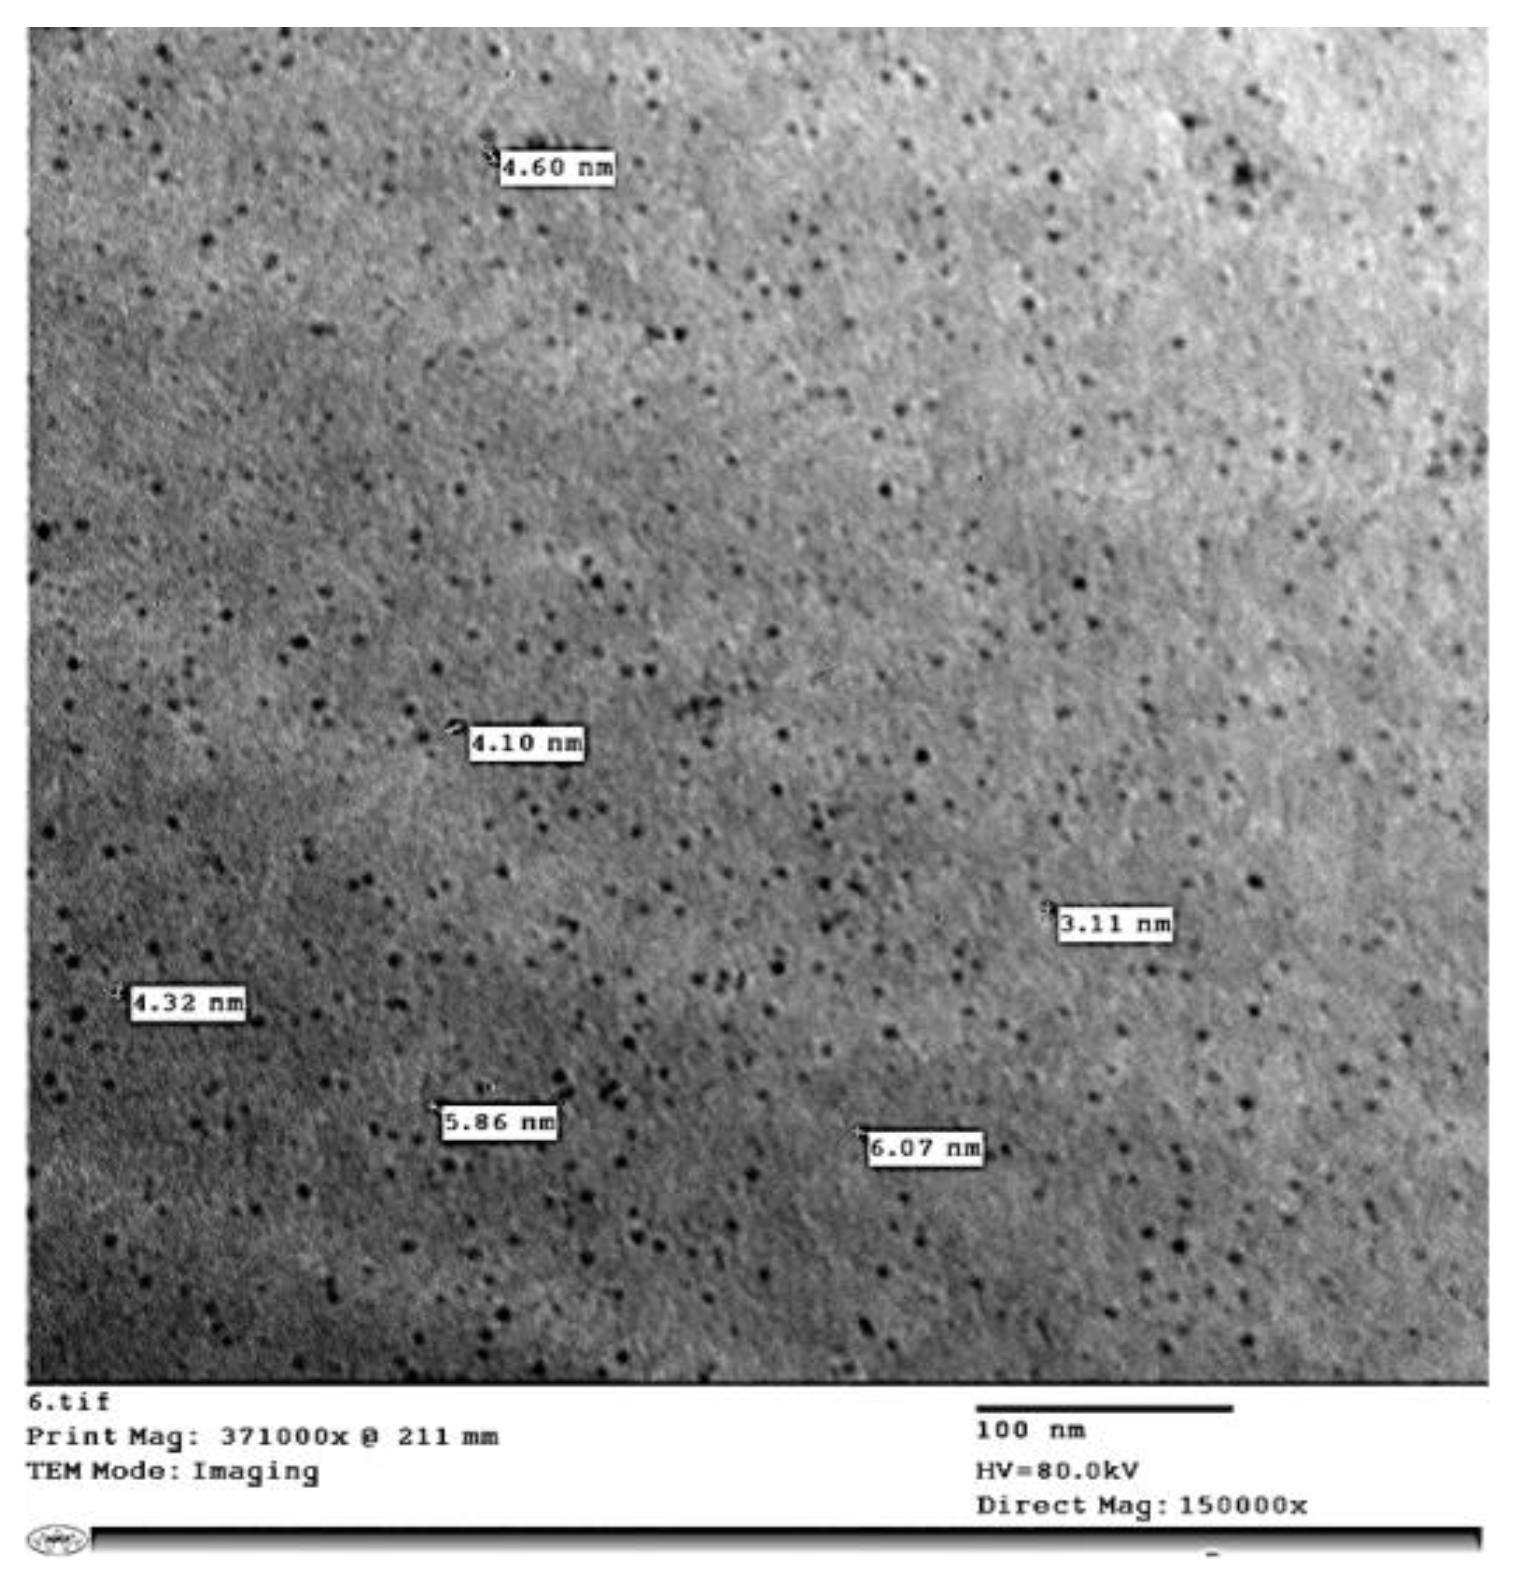
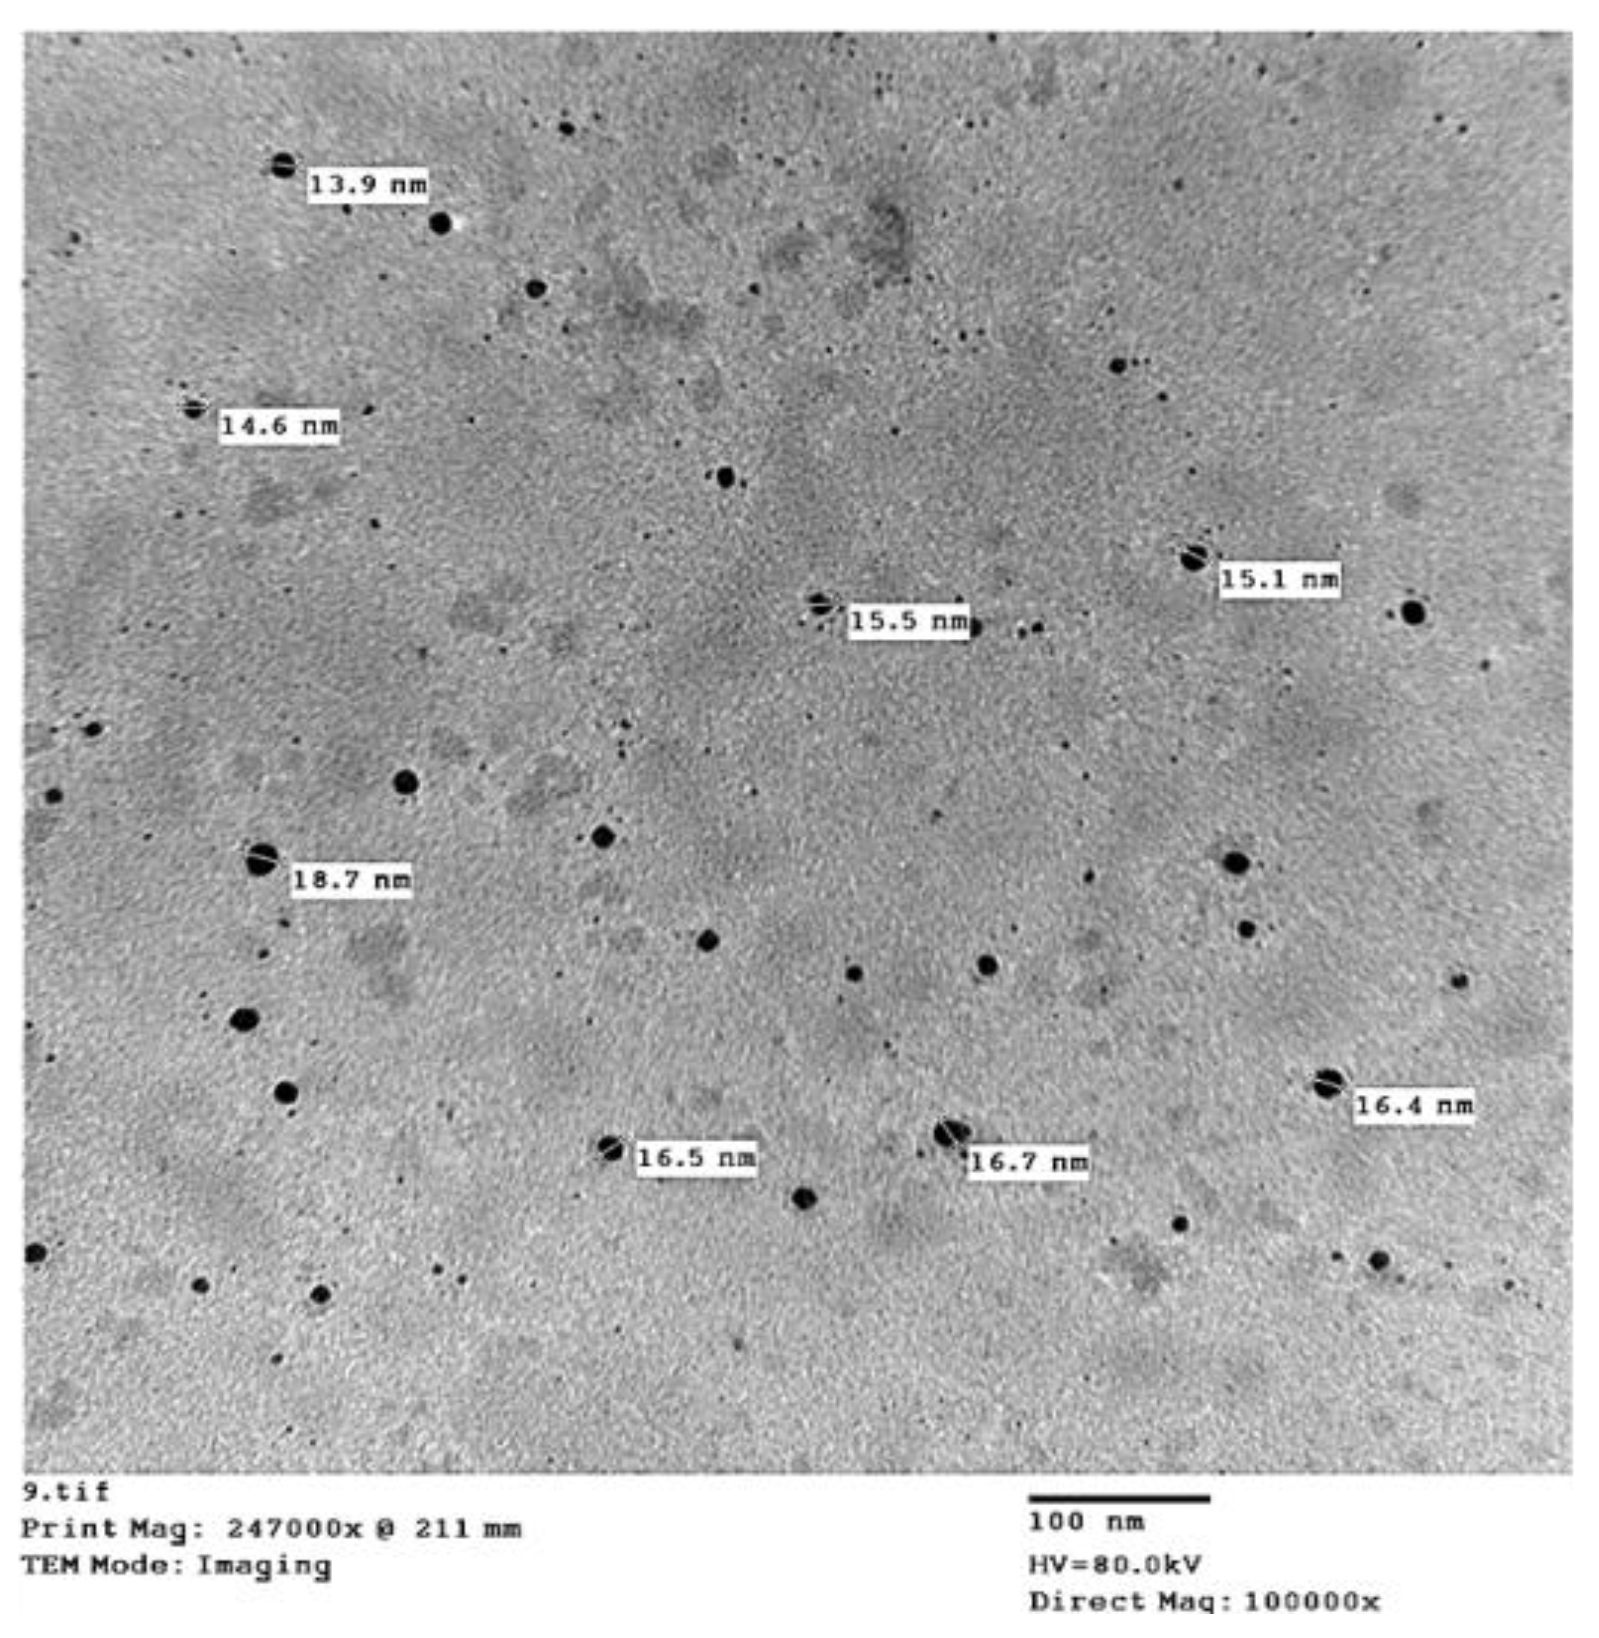
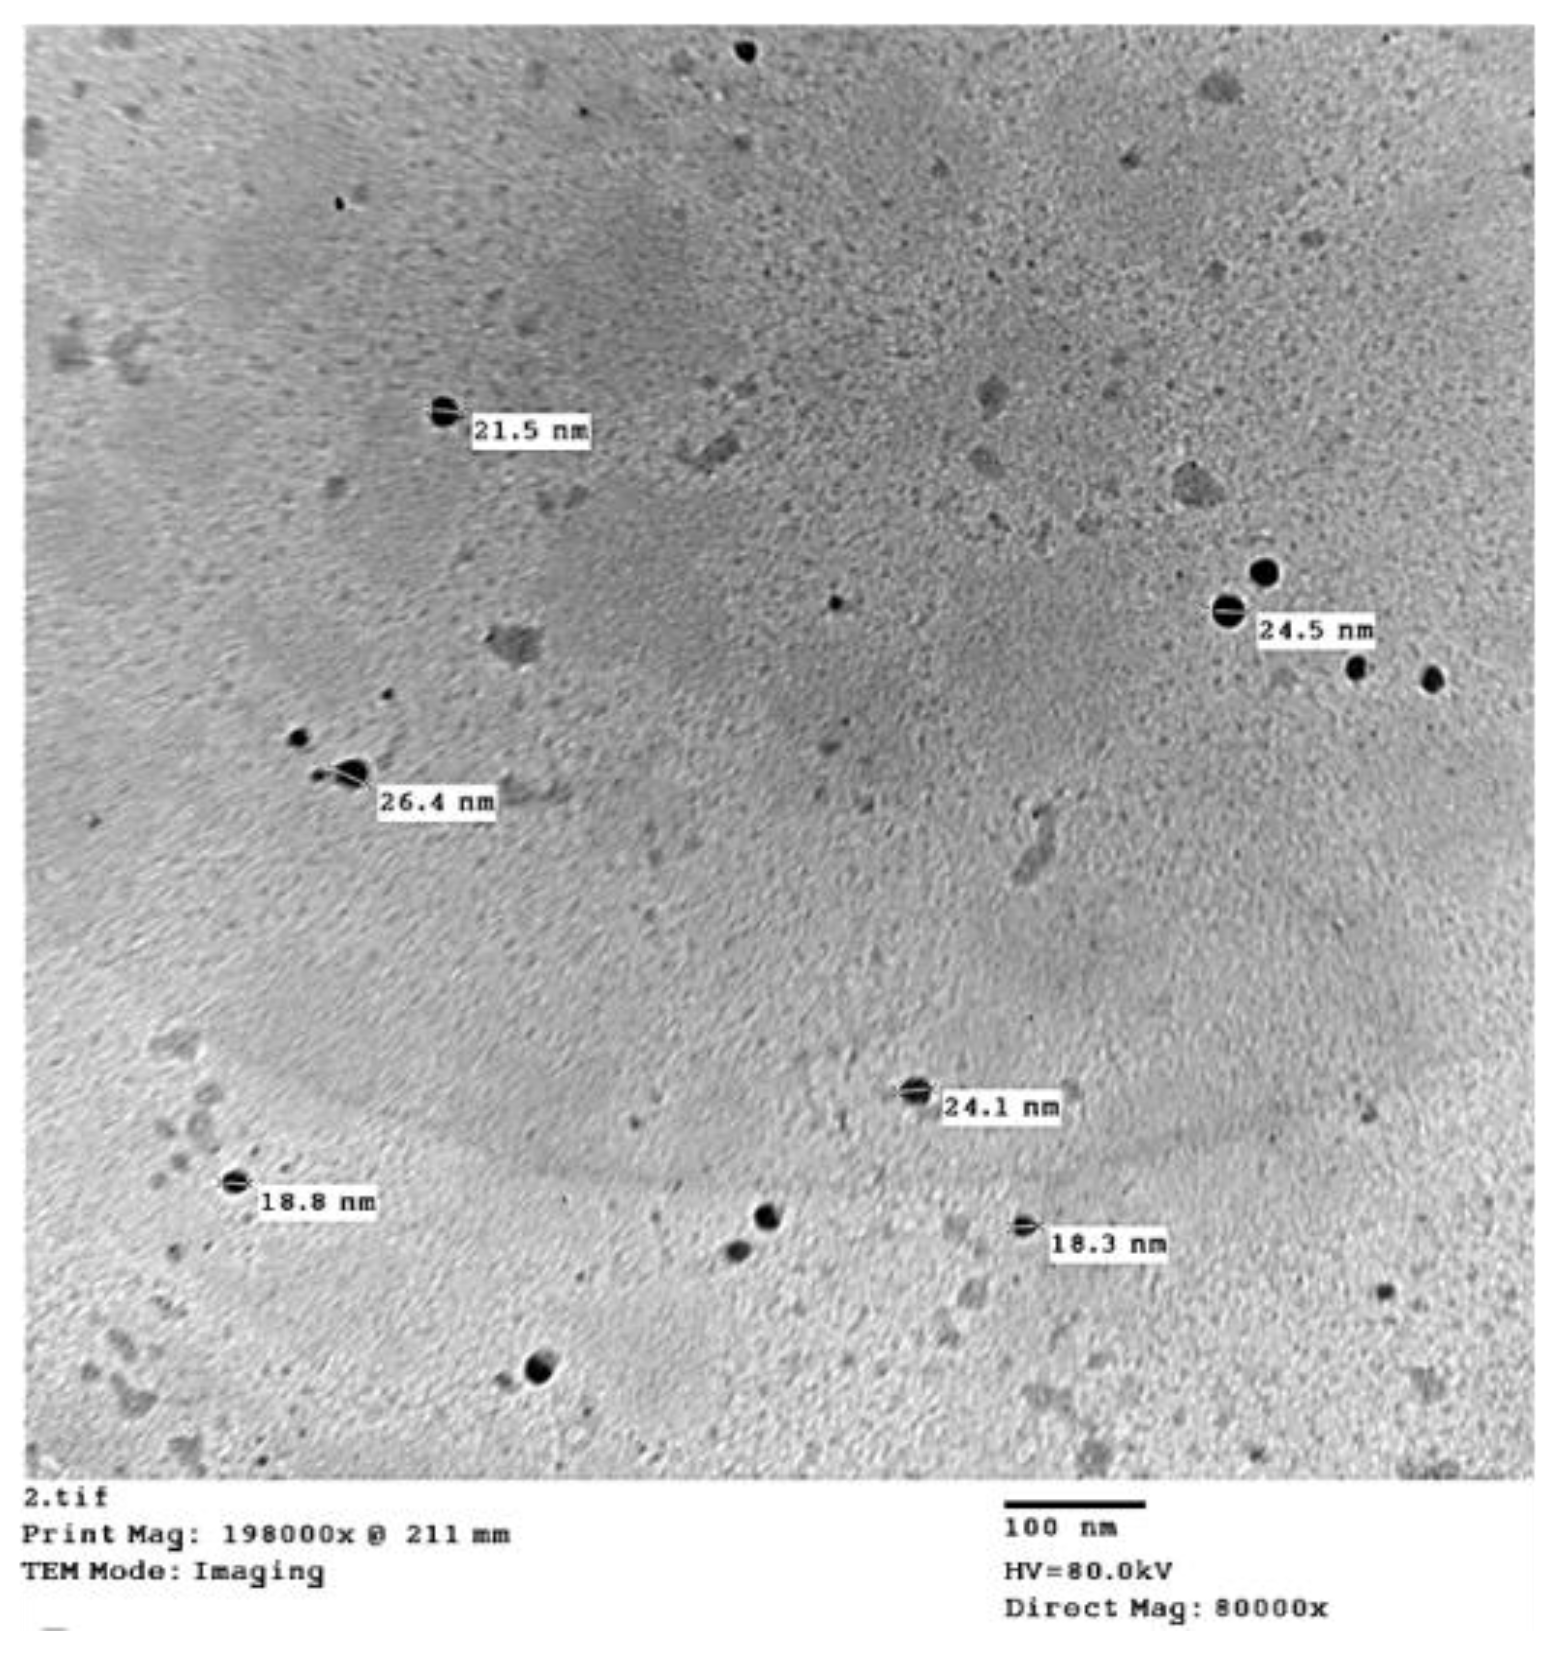
Chitosan MW 71.3 k Da (degree of deacetylation, 89%) was purchased from Wacker Chemie AG, Burghausen, Germany. All reagents were of analytical grade from precursor potassium persulfate [K2S2O8] and methacrylic acids [C4H6O2], purchased from Wacker Chemie AG, Burghausen, Germany. Calcium phosphate [Ca(H2PO4)2 H2O], ammonium nitrate salt [NH4NO3], urea [CO(NH2)2], and potassium chloride [KCl] were purchased from Sigma-Aldrich Chemical Co. (St. Louis, MO, USA). The molecular chemical approach technique was utilized in nanoparticle preparation under a strain of 2 Mpa [46], and polymerizing methacrylic acid in chitosan solution as a carrier coated in buffer solution for 5 h at room temperature in a two-step process. In the first step, 0.23 g chitosan was dissolved in methacrylic acid aqueous solution (0.5% v/v) for 18 h, under magnetic stirring. Then, in the second step, with continued stirring, 0.2 mmol of potassium persulfate was added to the solution, until it became clear. The polymerization was subsequently carried out at 75 °C under magnetic stirring for 4 h, leading to nanoparticle solution formation, then centrifuged at 500 rpm for 30 min, and then cooled in an ice bath. The N, P, and K sources were used separately. Therefore, the loading of N fertilizers in chitosan nanoparticles was obtained by dissolving 2 M of N into 100 mL of chitosan nanoparticle solution under magnetic stirring for 8 h, at 25 °C, then dried at 50 °C for 72 h. Concentrations included 1000 mg L−1 each of N, P, and K, which were finally obtained in each solution with a pH of 5.5. The particles of crystal structure were of 98.5% purity and uncontrolled in shape with a size range of 6.25 to 6.57 nm for N (Figure 3), 5.30 to 12.3 nm for P (Figure 4), and 7.99 to 15.3 nm for K (Figure 5). We used a JEOL 1010 transmission electron microscope at 80 kV (JEOL, Japan) to investigate the morphology and size of the nanoparticles. Then, the size of the nanoparticles was decided directly from the figure using Image-Pro Plus 4.5 software, and the obtained value is the average size of three parallels. The concentrations of n-N at 1000 mg L−1, n-P at 1000 mg L−1, and n-K at 500 mg L−1 were continuously applied and mixed through the irrigation network system every 4 weeks for 3 months after the planting date.
During the two successive seasons, the treatments were as follows:
  • NPK as a control, T1;
  • Nano-silicon (n-Si), T2;
  • Nano-NPK (n-NPK), T3;
  • Nano-zeolite-loaded nitrogen (n-ZE-loaded N),T4;
  • Nano-zeolite-loaded nitrogen (n-ZE-loaded N) + nano-silicon (n-Si), T5.

2.8. Data Recorded

The following data were recorded.

2.8.1. Morphological Traits

Plant height (cm), length (cm), the number of inflorescences in the plant, leaf length (cm/plant), and total leaf area (cm) by leaf area meter (Delta-T SCAN, Image Analysis System) were measured during the experiment using representative samples for five plants from each experimental replicate (10 plants in total for each treatment). Samplings of plants were separated into herbs at harvest time (flowering stage) in the middle of June, and the removal of soil particles from herbs was followed by measuring the fresh weight (ton fed−1) of yield and plant (g/plant); then, they were dried in an electric oven at 60 °C for 72 h for dry weight determination (g/plant).

2.8.2. Relative Water Content (RWC)

The samples were taken from the top leaves after ten days of treatment for RWC determination. The fresh weight (FW) of five leaves was recorded, and then the leaves were immersed in deionized water for 4 h. Before weighing (TW), the wet surface of the turgid leaf was quickly blot-dried; then, the leaf was dehydrated for 72 h at 70 °C in the oven and its dry weight (DW) was measured. The RWC was calculated by the formula: RWC (%) = (FW − DW/TW − DW) × 100 [47].

2.8.3. Net Photosynthesis

Net photosynthesis was analyzed based on the leaf area [μmol CO2 m−2s−1], intercellular CO2 concentration (mg L−1), leaf stomatal conductance [mol H2O m−2s−1], and water efficiency using five leaves/treatment and observed by an LI-COR 6400 (Lincoln, Nebraska, USA) infrared gas analyzer (IRGA). In the sampling chamber, the light intensity (photosynthetically active radiation, PAR) was set at 1500 [μmol m−2s−1] by a Li-6400-02B LED light source (LI-COR). The CO2 flow into the chamber was maintained at a concentration of 400 μmol mol−1 using an LI-6400-01 CO2 mixer (LI-COR).

2.8.4. Chemical Analysis

The sample plant herbs were ground for chemical element determination after they were dehydrated in an electric oven at 70 °C for 24 h. Then, 0.2 g of plant material was digested by adding concentrated sulfuric acid (5 mL) and heating for 10 min until reaching 100 °C and then adding 0.5 mL perchloric with continuous heating to 350 °C until a clear solution was obtained [40,44]. The dried leaves were analyzed using the modified micro-Kjeldahl method to obtain the total nitrogen (N) content [44]. Phosphorus (P) was analyzed calorimetrically using the chlorostannous molybdophosphoric acid blue color method in sulfuric acid [40]. Potassium (K) and calcium (Ca) concentrations were analyzed using a flame photometer apparatus (CORNING M 410, Germany), and the concentrations of Mg, Zn, Mn, Cu, and Fe were analyzed by an atomic absorption spectrophotometer with air acetylene and fuel (PyeUnicam, model SP-1900, US). Total chlorophyll content was measured by spectrophotometry and calculated according to the equation described by Moran [48]. The total carbohydrates in the leaf samples were analyzed by the phosphomolybdic acid method [44]. The total phenolic contents of the extracts of leaves were analyzed spectrophotometrically according to the Folin–Ciocalteu colorimetric method [49], and the total flavonoids were analyzed according to the method of Meda et al. [50].

2.8.5. Endogenous Phytohormones

A mortar and pestle were used to grind the freeze-dried botanical herb (6g FW) until it became a fine powder. The powder was extracted three times (once for 3 h and twice for 1 h) with methanol (80% v/v, 15 mLg−1 FW), supplemented with butylated hydroxytoluene DBPC (2,6-di-tert-butyl-P-cresol) as an antioxidant at 4 °C in darkness. Then, the extract was centrifuged at 4000 rpm. The supernatants were then gathered and transferred into flasks wrapped with aluminum foil. The residue was extracted twice, and then the total volume was reduced to 10 mL at 35 °C under vacuum. The aqueous solution was extracted thrice with an equal volume of pure ethyl acetate and was adjusted to pH 8.6, and then the alkaline extract was dehydrated over anhydrous sodium sulfate and filtered. The filtrate was dried under a vacuum at 35 °Cand redissolved in 1 mL of absolute methanol. The methanol extract used for the quantification of the endogenous phytohormones such as abscisic acid (ABA) and indole-acetic acid (IAA) was extracted by ATI Unicam Gas–Liquid Chromatography, 610 Series, equipped with a flame ionization detector according to the method described by Fales et al. [51] and Furniss [52]. A coiled glass column (1.5 m × 4 mm) packed with 1% OV-17 was used in the fractionation of phytohormones. Nitrogen, hydrogen, and air gas flow rates were 30, 30, and 330 mL min−1, respectively. A Microsoft program was used to calculate the concentrations of the external authentic hormones, identify peaks, and quantify phytohormones.

2.8.6. The Activity of Antioxidant Enzymes

The catalase (CAT) and superoxide dismutase (SOD) activities were determined in the fresh herb samples that were prepared according to the method of Polle et al. [53]. A mixture consisting of 5 mL potassium phosphate buffer, 0.5% Triton X-100, 2% N-vinylpyrrolidone (NVP), 5 mM ethylene-diamine-tetra-acetic acid (EDTA), di sodium salt dihydrate, and 1 mM ascorbic acid was added to 0.5 g of fresh herbs which were then ground with liquid nitrogen to form a homogenized mixture. The samples were centrifuged at 1000 rpm for 25 min at 4 °C and the supernatants were used to measure the activated enzymes [54,55]. The values of CAT and SOD were defined as units mg−1 protein.

2.8.7. Essential Oil Analysis

The essential oil obtained from the different treatments was determined after hydro-distillation of the fresh herbs of the aerial part (mixture of inflorescences and leaves) and roots according to Shelepova et al. [56]. From each oil, 20 μL was taken and diluted to 1 mL with diethyl ether, then 2 μL of the diluted solution was injected into a Perkin Elmer XL gas chromatograph equipped with a flame ionization detector (FID) on a capillary column coated with 5% phenyl and 95% methyl-polysiloxane (TC-WAX FFS fused silica 60 m × 0.25 mm I.D) to separate the different volatile components. The program oven temperature was from 50 to 220 °C at the rate of 3 °C min−1. The injector and detector temperatures were 230 and 250 °C, respectively. The essential oil content and yield, expressed on a dry weight basis, were calculated according to Amani Machiani et al. [57]. The carrier gas, helium, was used at a flow rate of 1.0 mL min−1. The recorded values are the means of three analyses. Gas chromatography-mass spectrometry (GC-MS) was carried out with a Hewlett-Packard 5985 instrument coupled with an HP MS system. The ion source temperature was 200 °C, and the ionization voltage was 70 eV. The NBS MS library or other published mass spectra were used to know the components of the essential oil [58]. The retention indices of the volatile components were compared with published data [59] and calculated using a hydrocarbon kit (C8-C18; Aldrich Chemical Co., Milwaukee, WI, USA).

2.9. Statistical Analysis

The experiment design was a randomized complete block design (RCBD) with five replicates (10 plants for each treatment). The data were subjected to analyses of variance (ANOVA) test at 5% probability by using SPSS software version 21 (Armonk, NY, USA). Then, the mean comparison of treatments was performed with Duncan’smultiple range test (p < 0.05) [60]. All the results were the mean of five replicates (n = 5). Moreover, correlations between different NP applications and concentrations of S. canadensis EO compounds by heatmaps among parameters were derived using the ClustVis online tool [61].

3. Results

3.1. Nanoparticles Enhanced Solidagocanadensis Plant Growth and Its Yield Characteristics

Growth characteristics are among the most significant quantitative and qualitative parameters for evaluating goldenrod plants. The results showed a significant difference among the applications (Table 4). Significant increases in plant height, inflorescence length/plant, inflorescence number/plant, total leaf area/plant, leaf length, herb fresh and dry weight/plant, and herb fresh weight/yield were noted in the S. canadensis plants treated with T5 as n-ZE-loaded-N+ n-Si, or with T3 as n-NPK, in the first and second seasons, respectively with no significant differences between them. The lowest value of growth characteristics was found in plants only treated by T2 as n-Si, followed by those that received chemical fertilizer NPK as T1 (control) during both seasons under drought stress levels in newly reclaimed soil.

3.2. Nanoparticles Enhanced Leaf Endogenous Nutrient Contents of Solidago canadensis Plants

Leaf N, P, K, Ca, Mg, Cu, Zn, Fe, and Mn contents were significantly affected by different treatments (Table 5) during both seasons. Leaf N concentrations ranged from 2.85% to 4.28% in the first season, and in the second season ranged from 2.86% to 4.17%. Compared with the control plant, leaf N content significantly increased by 4.28% in the first season and 4.17% in the second season in plants treated with T5. Additionally, the leaf P concentration varied between 0.29% and 0.45% in the first season and between 0.32% and 0.44% in the second season. In both seasons, the highest phosphorus leaf concentrations were detected in T5- and T3-treated plants, and thus, both were significant when compared to control plants (T1). K concentration in plant leaves varied between 3.24% and 4.41%, and between 3.15% and 4.45% in the first and second seasons, respectively. For both seasons, the highest leaf K concentration in the plants treated with T2 was significant compared to the lowest leaf K concentration in the control plants treated with only chemical NPK (T1). The leaf Ca concentration was significantly increased in plants treated with T5 application in both seasons (0.94% and 0.92% in the first and second seasons, respectively). The plants treated with T2 application showed the lowest leaf Ca concentration in both seasons. In addition, Mg concentration in the leaves of plants increased with any NP applications, improving significantly compared to the non-NP application (T1) in both seasons. Leaf Mg concentrations were obtained in the range of 0.27% to 0.17% in both seasons, and the highest amount was observed in T5. In the first and second seasons, the highest contents of Cu, Zn, Mn, and Fe were almost achieved with the T5 treatment, whereas the lowest contents were obtained from the T1 and T2 applications.

3.3. Nanoparticles Enhanced Photosynthetic Pigments and Biochemical Contents of Solidago canadensis Plants

The data in Table 6 show that the total chlorophyll content was maximized in the T5 treatment (22.90 and 26.17 mg g−1 in the first and second seasons, respectively). The total chlorophyll significantly increased to 19.46 and 21.80 mg g−1 in the first and second seasons, respectively, when plants were treated with T3, and they increased to 18.34 and 19.90 mg g−1 in the first and second seasons, respectively, with T4 treatment. Moreover, the maximum levels of total phenolic content (39.37 and 38.57 mg g−1) and flavonoid content (0.53 and 0.55 mg g−1) were observed in the plants treated with T5 in the first and second seasons, respectively. Their minimum values were noticed with chemical NPK treatment (29.52 and 32.98 mg g−1) and with T2 treatment (32.64 and 33.82 mg g−1) in the first and second seasons, respectively. The flavonoid content was significantly reduced to 0.39 and 0.42 mg g−1 in control plants (T1) in both seasons, respectively. The maximum total carbohydrate levels (34.17% and 35.52% in the first and second seasons, respectively) were observed in T5 treatment and the minimum levels (28.12% and 26.85% in the first and second seasons, respectively) were observed when plants were treated with T2 compared to control plants, with insignificant differences.

3.4. Nanoparticles Enhanced Photosynthetic and Transpiration Rate, Stomatal Conductance, Intercellular CO2 Concentration, and Water Use Efficiency of Solidago canadensis Plants

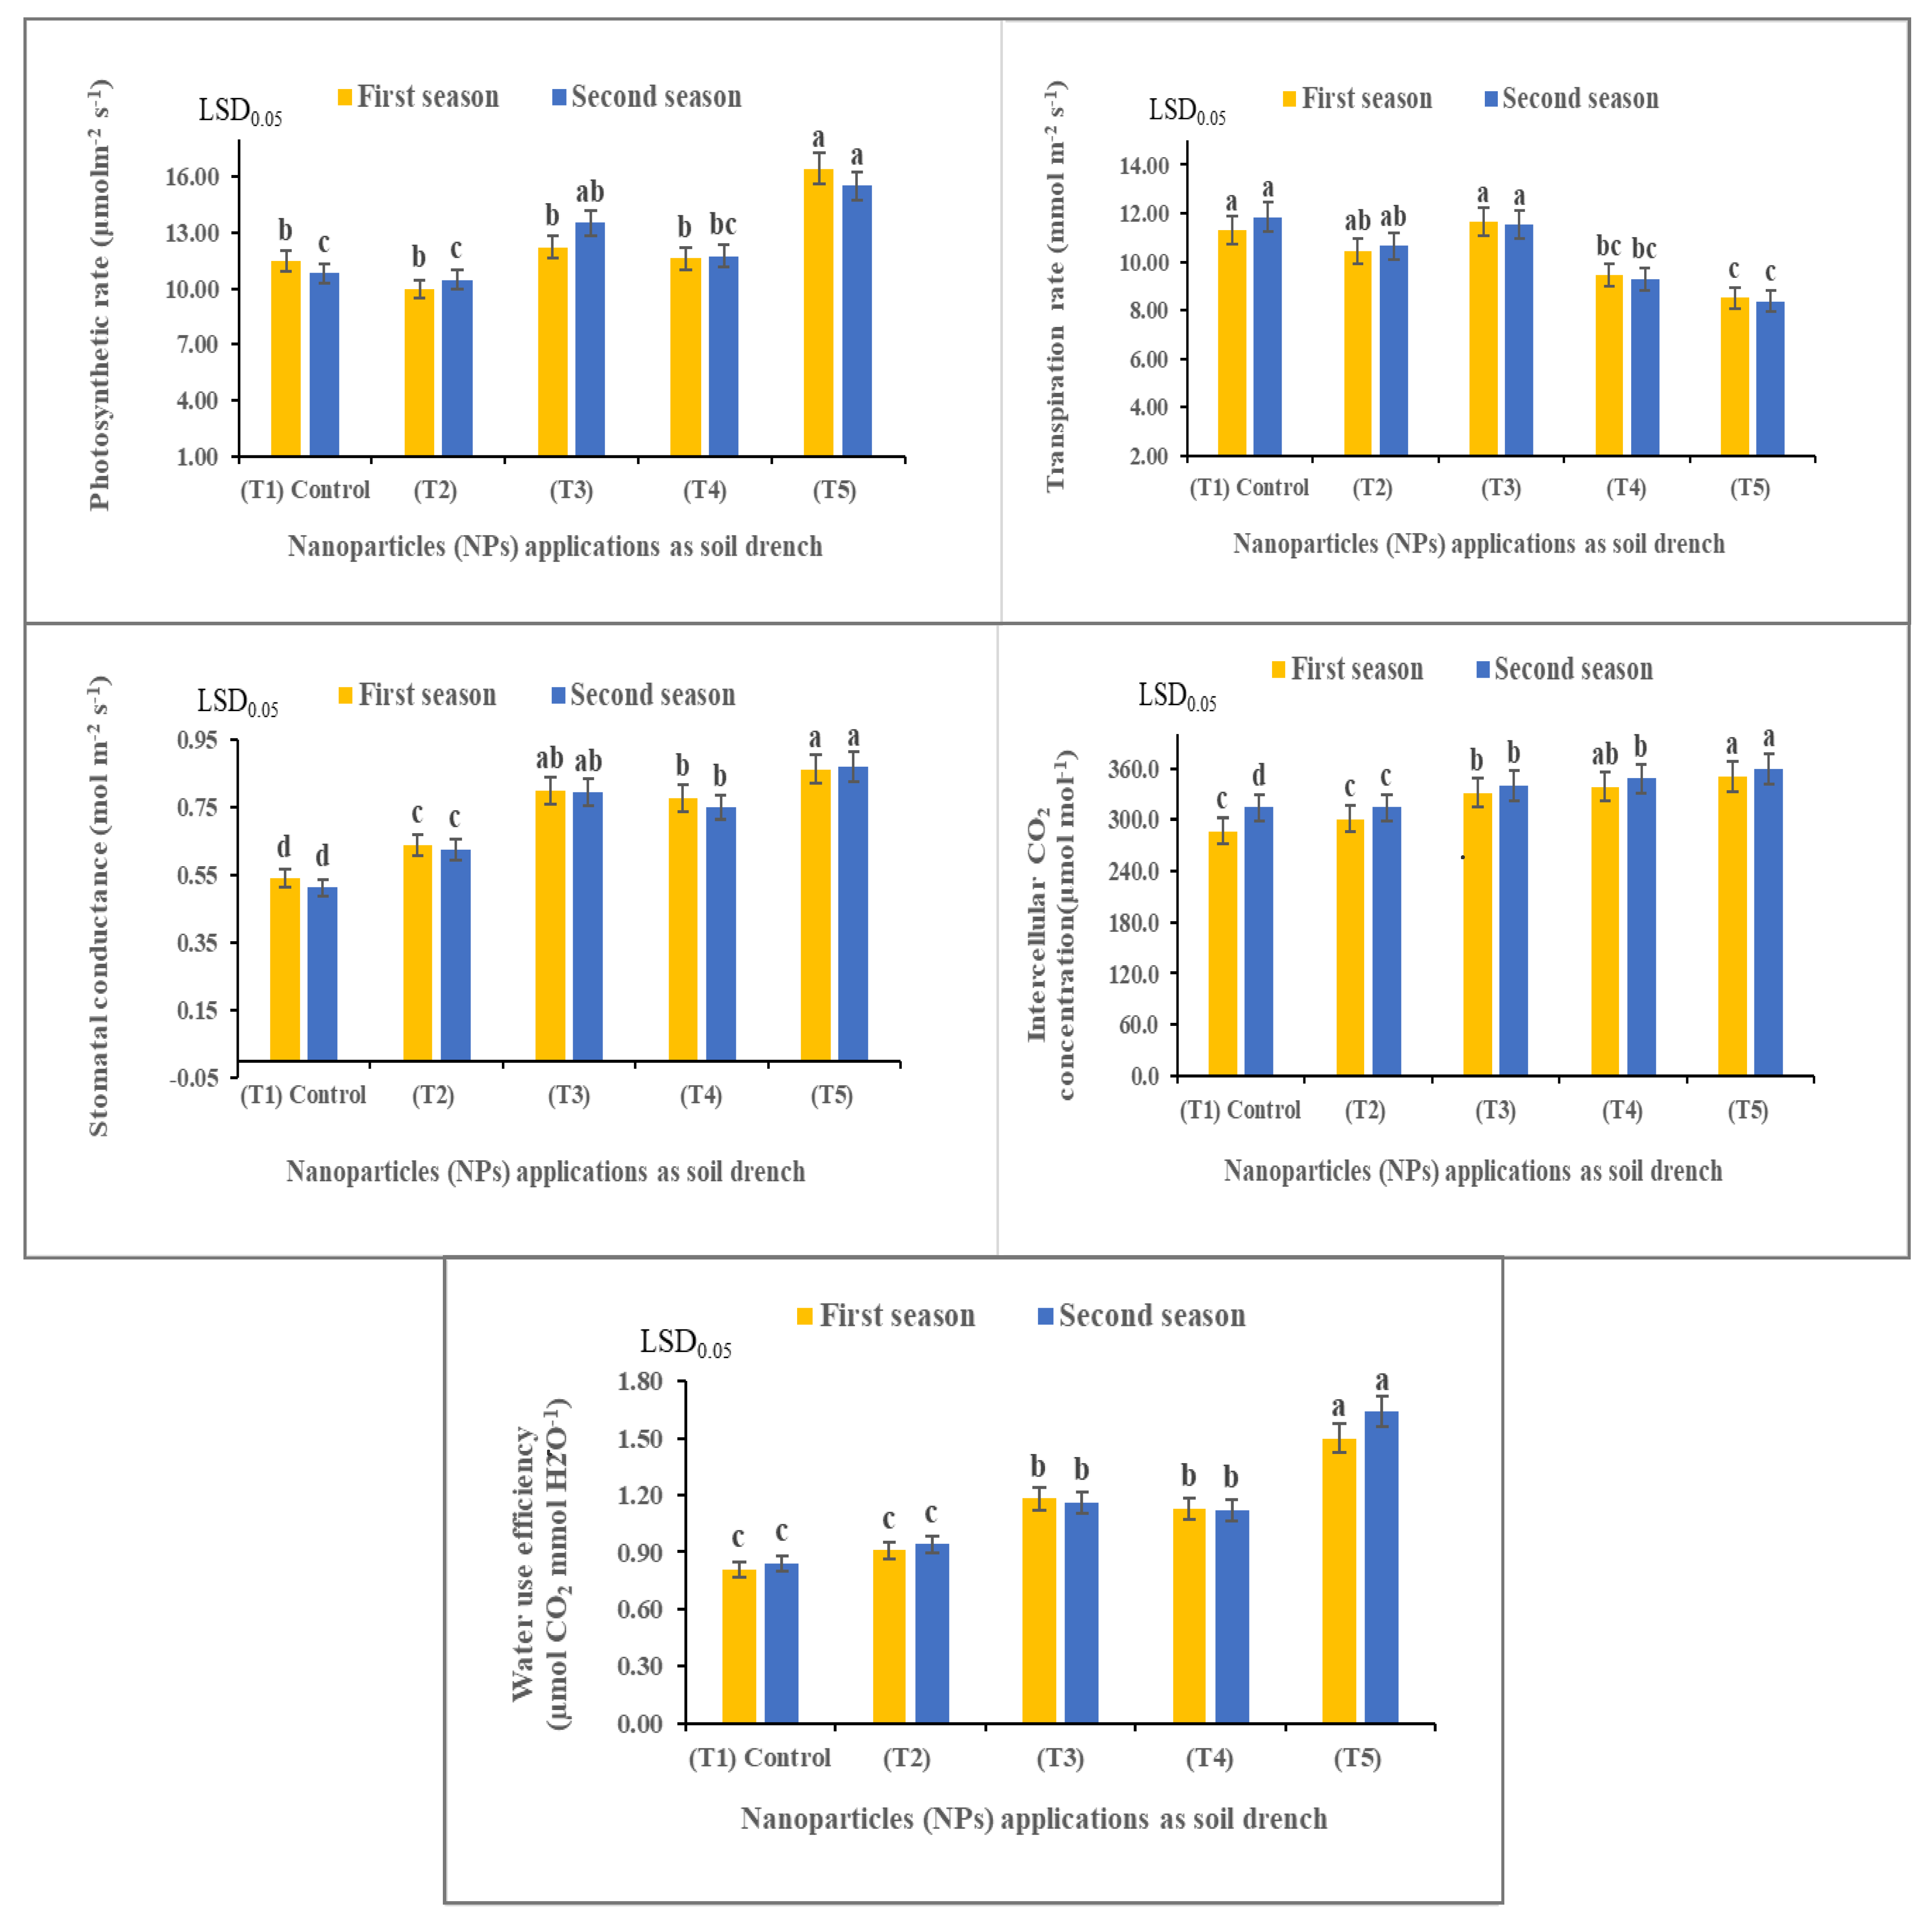
Our results showed that the effect of NP application on photosynthesis rates, intercellular CO2 concentrations, transpiration rates, stomatal conductivity, and water use efficiency was significant with stress (Figure 6). The co-application of T5 provided a significantly higher photosynthesis rate in the first and second seasons (16.43 and 15.50 μmol m−2 s−1, respectively) compared with other applications. The application of T2 recorded the lowest values of 9.98 and 10.45 μmolm−2 s−1 in the first and second seasons, respectively, with no significant differences between T2 and the control (T1), but with significant differences between T2 and other applications. Concerning the transpiration rate, the results showed that the highest transpiration rate values of 11.29 and 11.85 mmol m−2 s−1and of 11.65 and 11.51 mmol m−2 s−1 came from control and T3 application in the first and second seasons, respectively, compared to other treatments. Treatment T5 gave the lowest values of 8.51 and 8.37 mmol m−2 s−1 in the first and second seasons, respectively. Stomatal conductivity in both seasons significantly increased to 0.863 and 0.870 mol m−2 s−1 at T5 compared with 0.540 and 0.513 mol m−2s−1 at control (T1) in the first and second seasons, respectively. Intercellular CO2 concentrations increased significantly to 350.47 and 359.46 μmol mol−1 in plants treated with T5 in the first and second seasons, respectively. Control plants realized the lowest values of 287.06 and 293.52 μmol mol−1 in the first and second seasons, respectively, as well as the plants treated with T2 (301.31μmol mol−1 in the first season), compared with other treatments. Moreover, by adding T5, water use efficiency was significantly increased by 1.50 and 1.64 µmol CO2 mmol H2O−1 compared with the control (T1), which recorded values of 0.81 and 0.84 µmol CO2 mmol H2O−1, and T2 treatment showed values of 0.91 and 0.94 µmol CO2 mmol H2O−1in the first and second seasons, respectively.

3.5. Nanoparticles Enhanced Leaf Hormones and Enzyme Activity of Solidago canadensis Plants

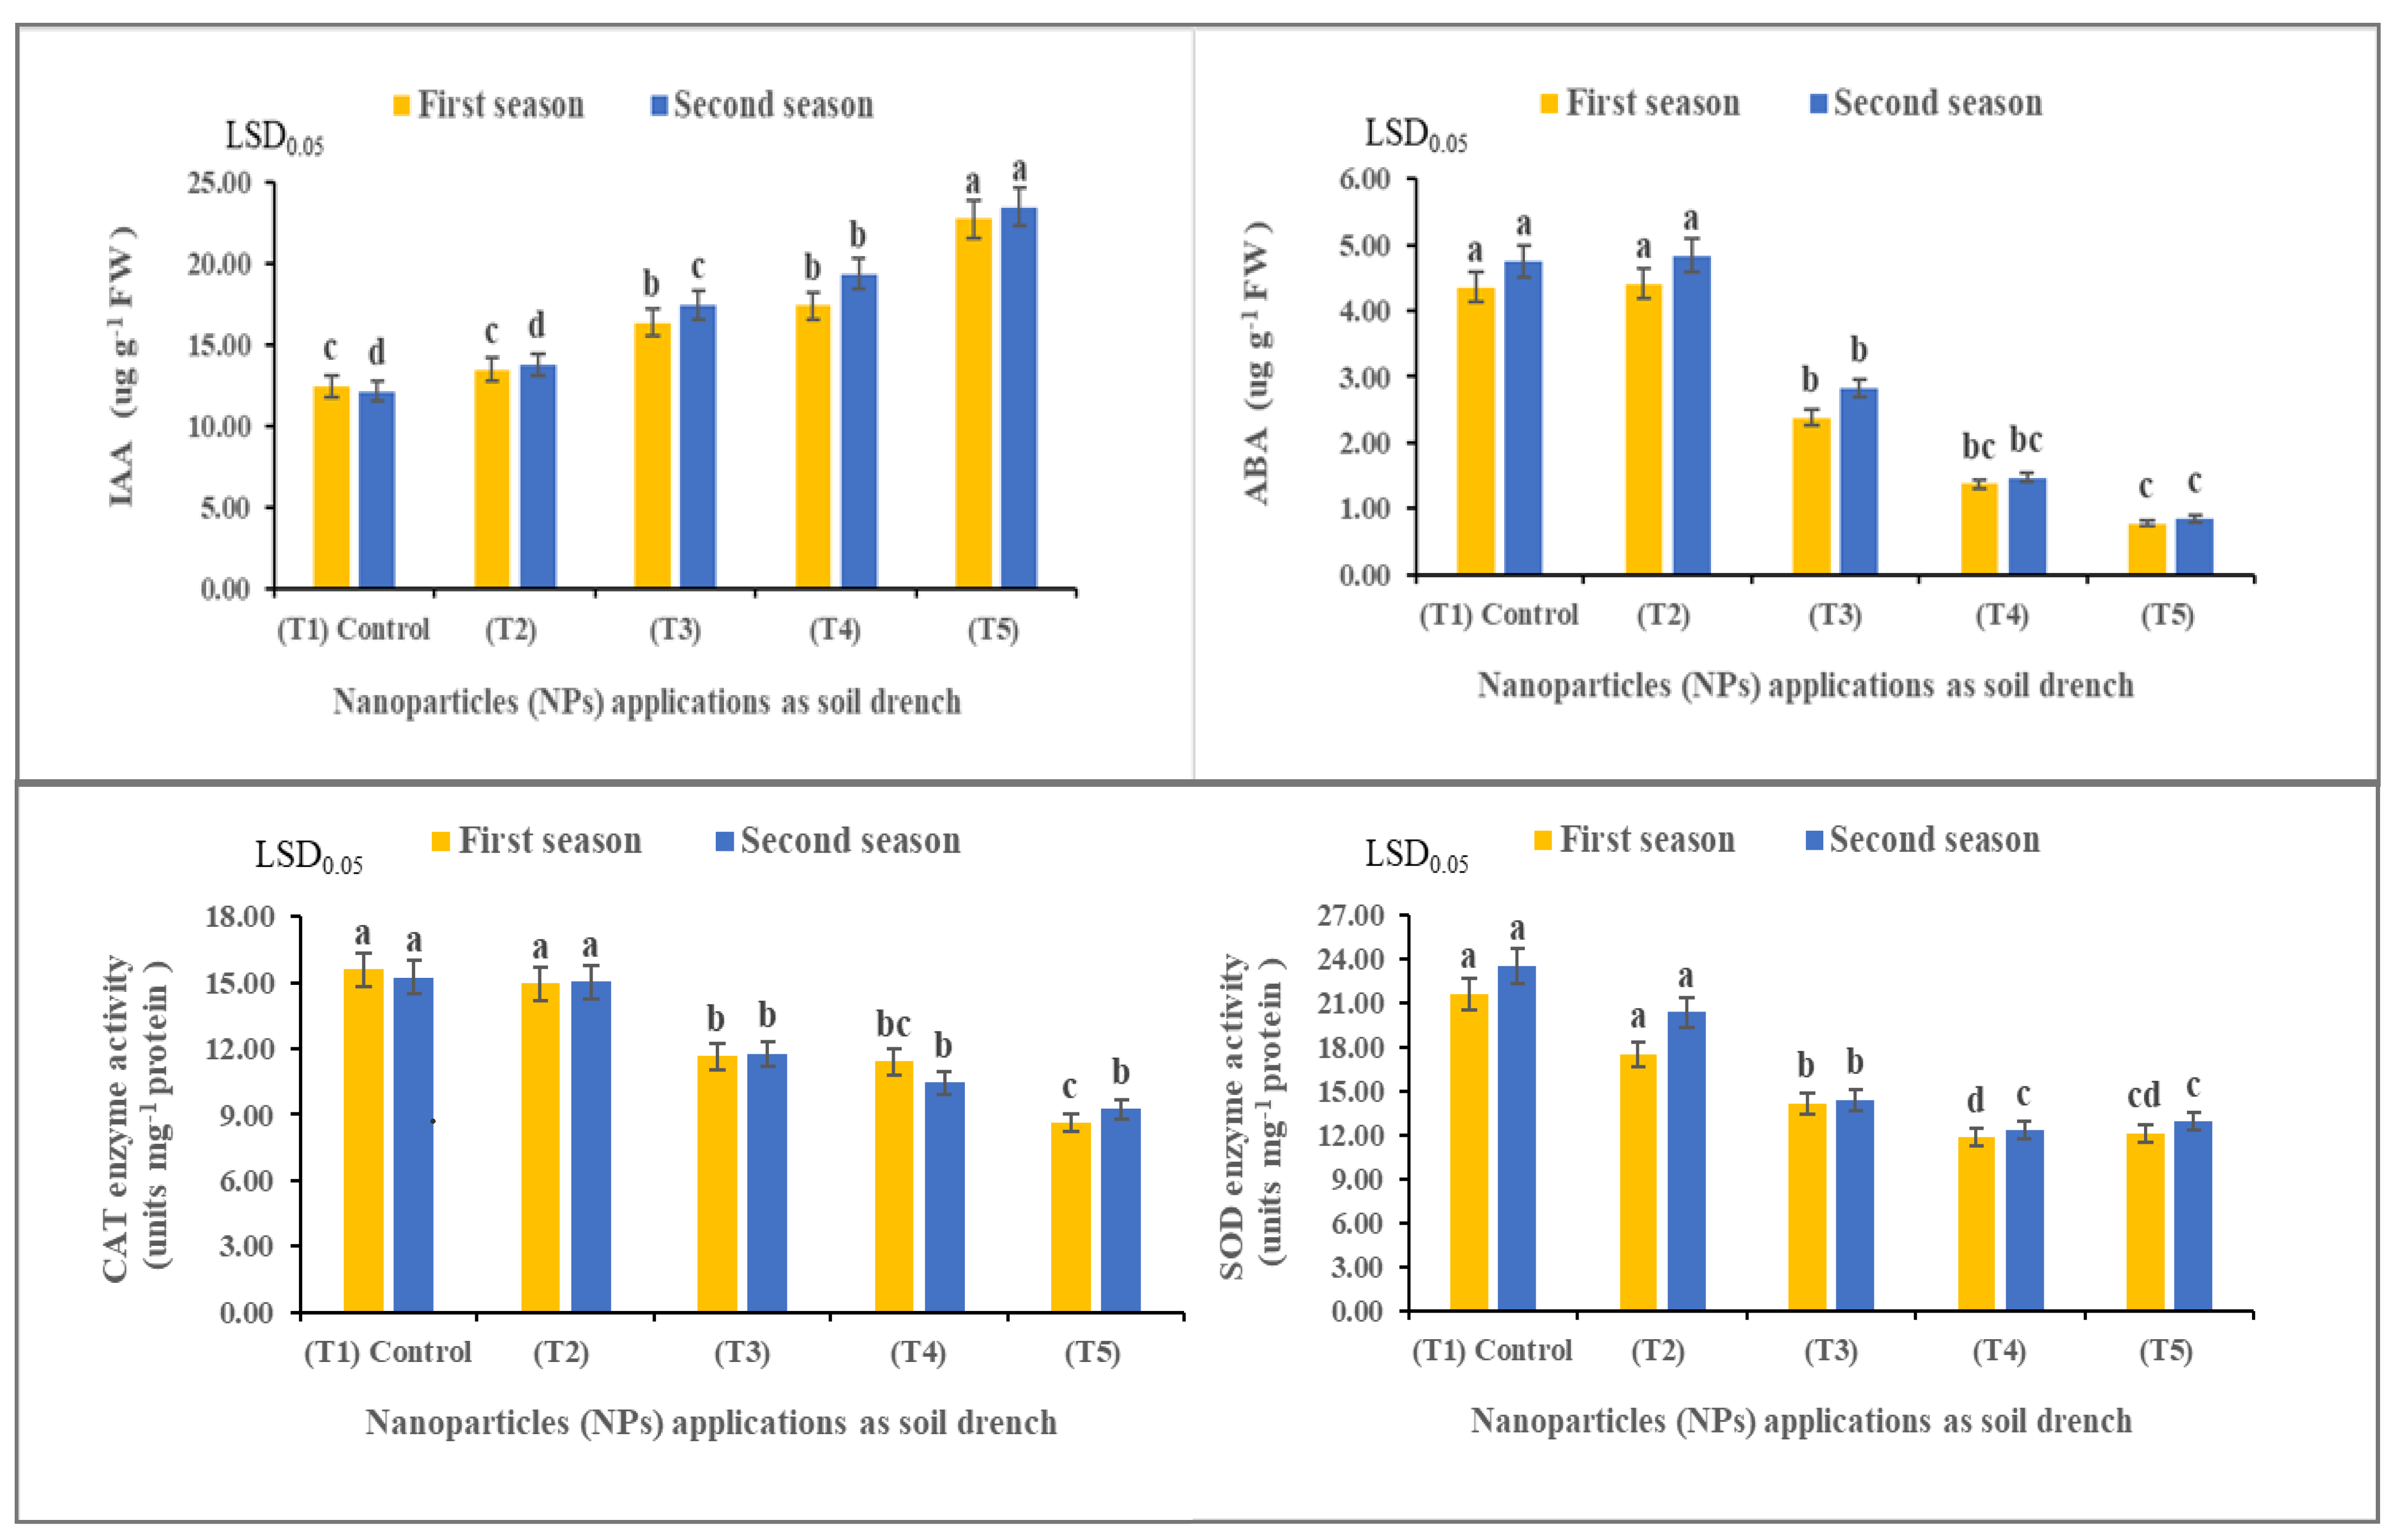
Hormonal and enzyme analyses of S. canadensis plants as affected by different exogenous applications are shown in Figure 7. The obtained data revealed that T5 application significantly recorded the highest amount of indole-3-acetic acid (IAA), with 22.74 and 23.50 ug g−1 FW in the first and second seasons, respectively. Conversely, T1 and T2 applications reduced leaf IAA content in the first and second seasons. However, both T2 and T1 achieved the highest amount of abscisic acid (ABA) in their leaves; the lowest amounts of ABA resulted from T5 application, which was 0.77 and 0.85 ug g−1 FW in the first and second seasons, respectively. In this regard, enzyme data represented in Figure 7 show that the highest amounts of the enzymes catalase (CAT) and superoxide dismutase (SOD) appeared within leaf tissues because of the addition of chemical NPK (T1). CAT activity values were 15.57 and 15.24 units mg−1 protein, while SOD activity values were 21.63 and 23.53 units mg−1 protein in the first and second seasons, respectively. These data might explain the role of phytohormones and enzyme activities under water deficits, which are essential to changing physiological reactions in plant leaves that have finally adapted to a harsh environment.

3.6. Nanoparticles Enhanced Productivity Essential Oil and Components of Solidago canadensis Plants

Different uses of NP sources significantly impacted the goldenrod EO percentage in herbs, roots, and yield (Table 7). The application of T5 led to a higher EO percentage in herbs (0.62% and 0.65%) and roots (0.260% and 0.280%) than in other experimental treatments. Likewise, EO content in yield per feddan due to T5 application was the highest at 1.45 and 1.67 mL in one plant yield, and 36.37 and 41.75 L in one yield per feddan in the first and second seasons, respectively. However, the lowest EO percentage in the herbs, roots, and yield was recorded by T2, and then T1.
GC/MS analysis showed thirty-two compounds in the EO of S. canadensis (Table 8). The main EO constitutes were germacrene D, limonene, α-pinene, β-elemene, caryophyllene oxide, β-caryophyllene, α-caryophyllene, and bornyl acetate in both 2020 and 2021. α-pinene was the main compound affected by the application of different NPs; it differed from 22.14% at drought stress and was treated with T4 to 31.87% under the same conditions but treated with T5. Limonene (12.48–19.54%) showed remarkable variation under drought conditions with T2 application in soil that gave the highest amount of it, whereas the lowest amount was under T3 application in the same conditions. Unlike bornyl acetate, n-Si (T2) decreased its amount, which ranged from 8.81% to 14.33% in plants only treated with n-ZEs (T4) application under water deficiency. Germacrene D was changed under different treatments of NPs with drought stress in a range of 20.12–26.24% and the highest amount of it was obtained from the T5 application. Caryophyllene oxide (0.31–0.77%) was different under these treatments in which its highest amount was obtained from the n-Si application (T2) compared to untreated with any NP application (T1). The maximum β-caryophyllene and α-caryophyllene amounts (2.86% and 0.74%, respectively) were obtained in plants treated with T2 application.
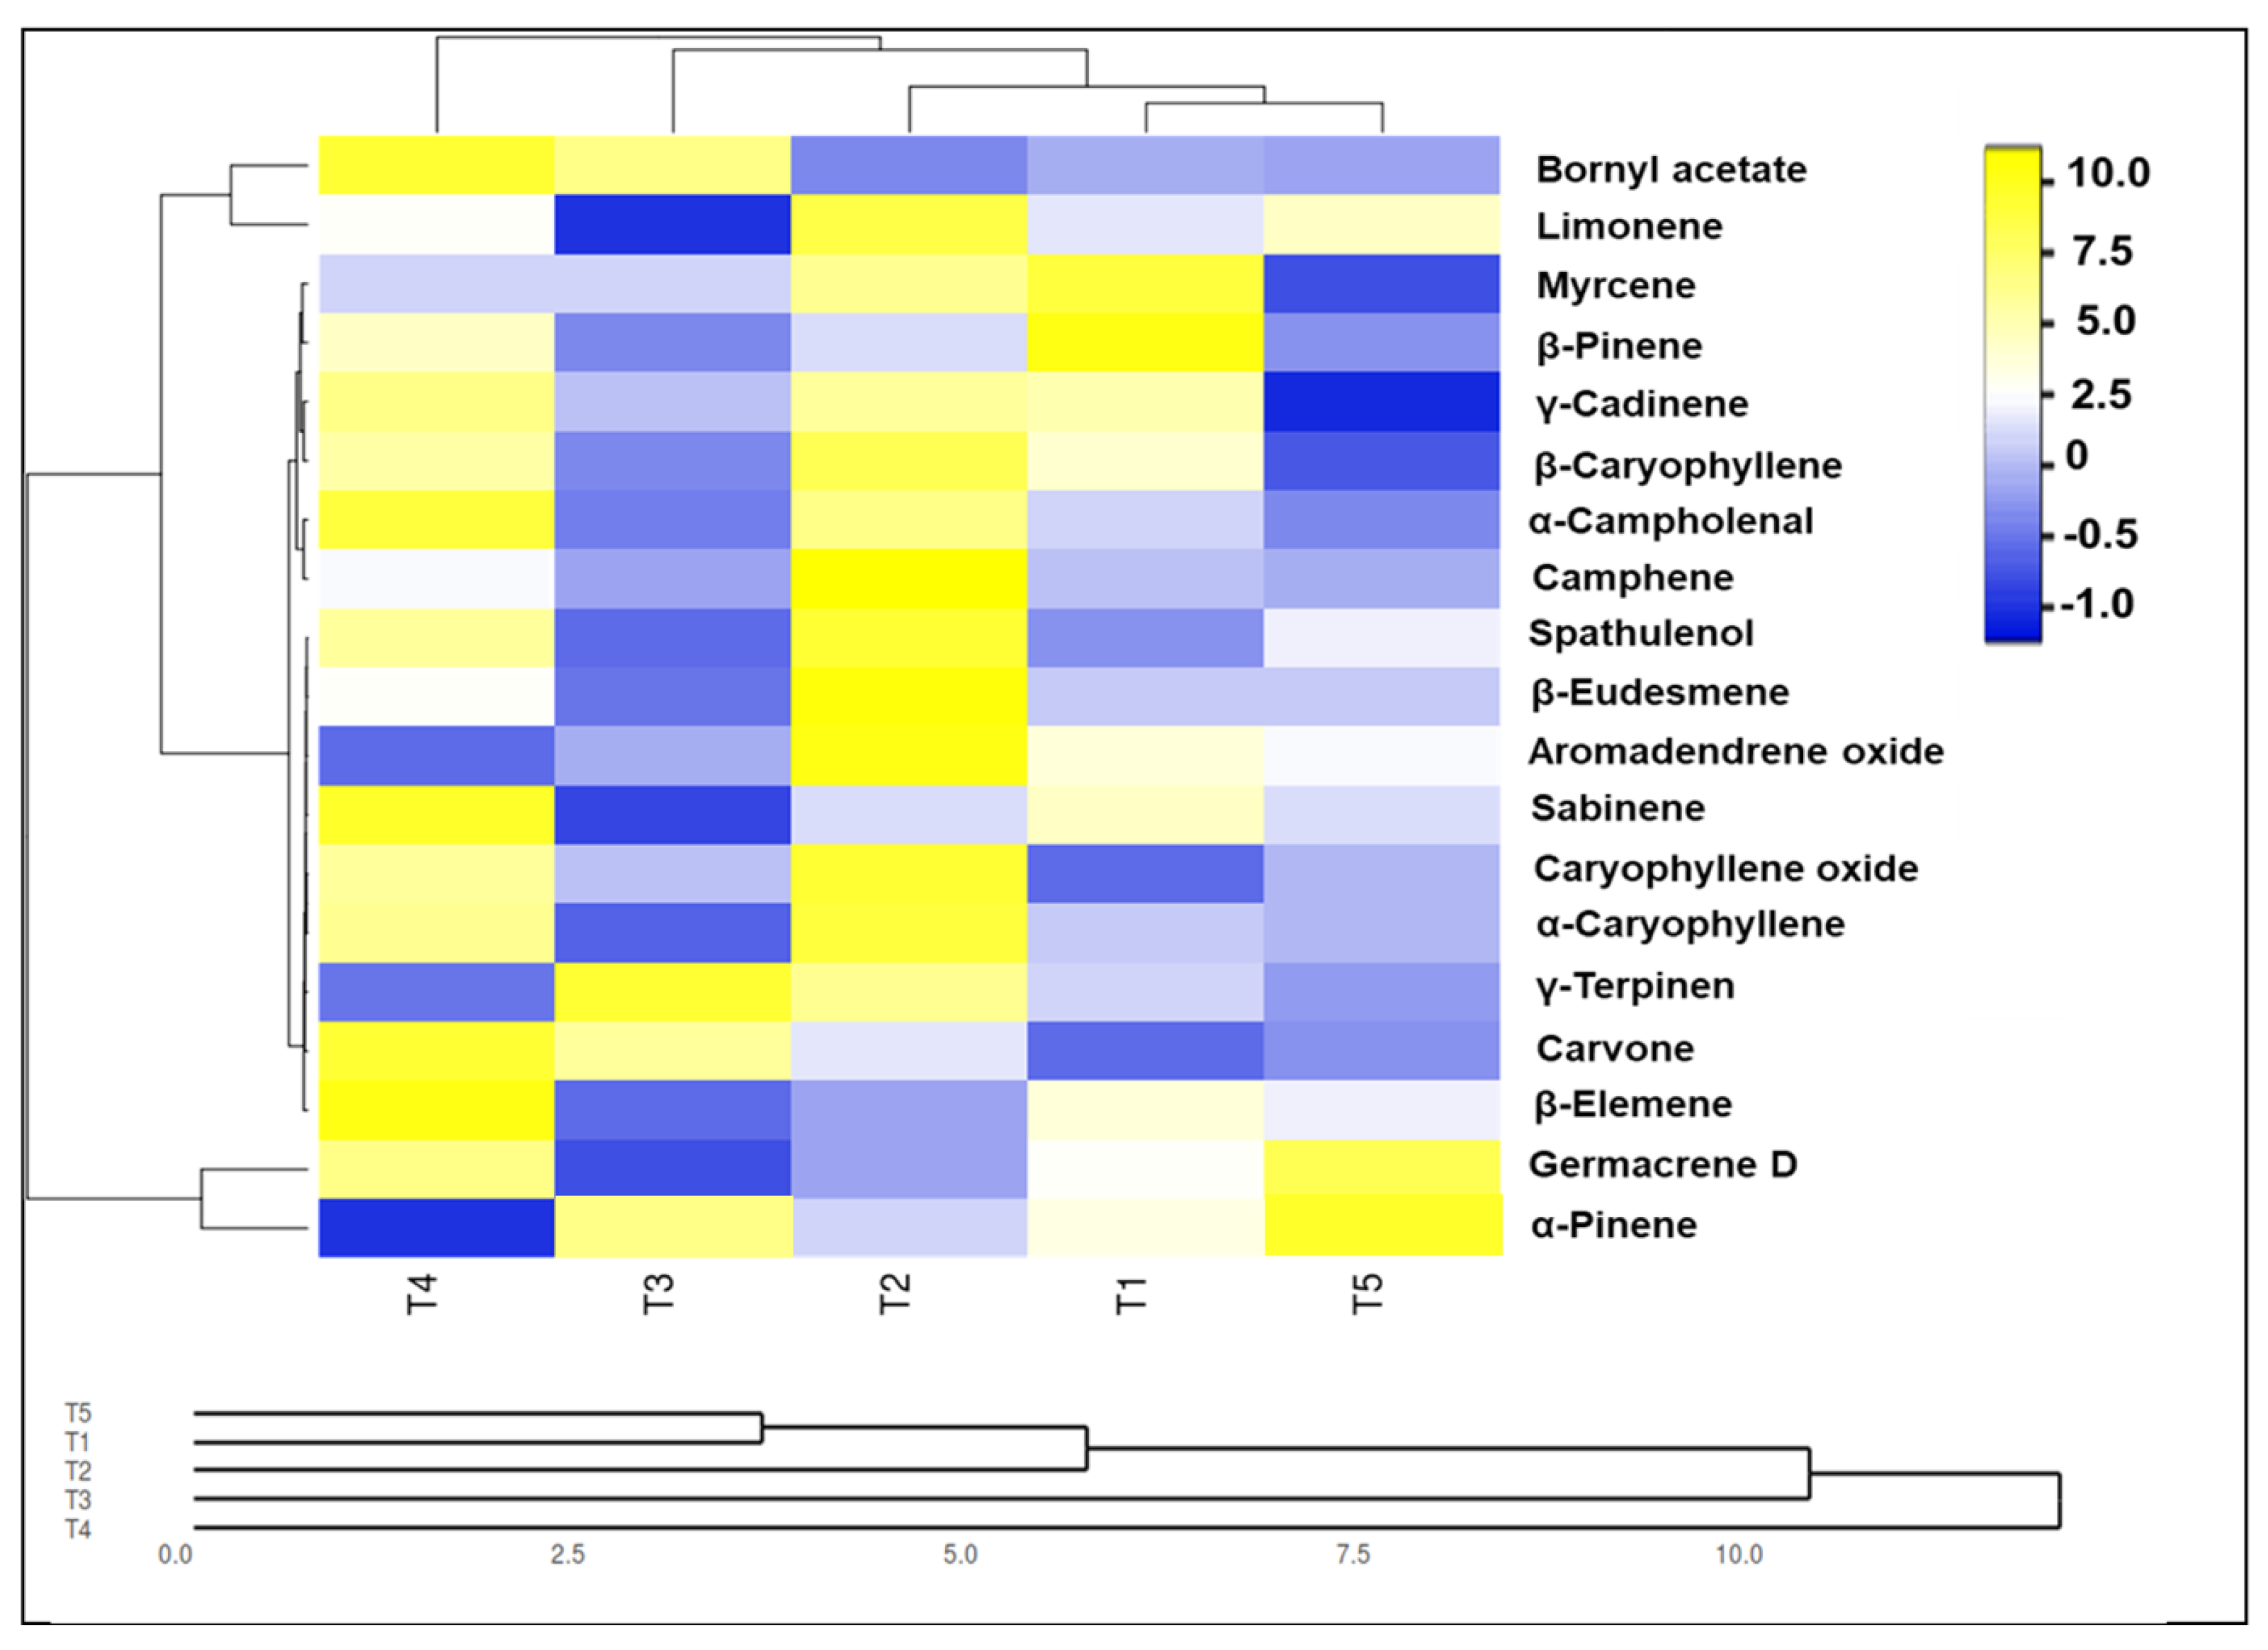
The changes in the chemical profiles for EO of S. canadensis are demonstrated using a heatmap that had the parameters in Table 8. In this study, the correlation heat map for the major compounds of EO in S. canadensis herb corresponding to the applied NP treatments in Figure 8 shows that the EO compounds had a positive correlation (extraordinarily strong, strong, and weak) with different NP treatments. The value of the heat map ranges from +10 to −1, where positive values indicate a positive correlation, while negative values indicate a negative correlation. A stronger linear association exists between data points closer together, whereas a weak one exists between values closer to zero. Moreover, α-pinene and germacrene D content was positively correlated with T5 application. Further, limonene, β-caryophyllene, camphene, α-caryophyllene, β-eudesmene, and caryophyllene oxide contents showed the most favorable correlations with T2 application. Only γ-terpinene content was positively correlated with T3 application, and bornyl acetate, α-campholenal, sabinene, and carbon contents correlated positively with T4 application. Additionally, the contents of myrcene and γ-cadinene correlated negatively with T5. However, limonene, sabinene, and germacrene D content also correlated negatively with T3. α-pinion content also had a negative correlation with T4.

4. Discussion

Plant performance in different developmental stages is markedly decreased by water deficit stress, which is a limiting environmental factor [23,24,29]. As a result of water stress, plants respond to some morphological adjustments with disturbances in growth and biomass aimed at resisting the loss of water to preserve their hydric status [62]. In our experiment, we found that S. canadensis growth under decreased soil water availability and treated with any NP sources performed better than plants treated with chemical NPK (control). It also shows that even with lower soil water availability, these plants can grow and develop, but at a slow rate, indicating their potential to tolerate or adapt to newly reclaimed soil conditions [63]. These findings agree with those obtained by Du et al. [64] and Abbas et al. [65] on S. canadensis, who reported that plants showed a high capacity in various habitats for functional root and leaf traits to cope with drought conditions but grow at a slower rate, mostly by the reduced biomass. Therefore, our study results indicate that the T5 application, followed by T3 and then T4, could mitigate the drought-induced growth reduction and improve the performance of goldenrod plants (Table 4). Ostadi et al. [66] noted that the role of NPs under drought conditions compared to chemical fertilizers in sustainable agricultural systems improves peppermint plant performance by increasing the quantity and quality of yield. Moreover, the co-application of T5 led to a significant increase in most morphological parameters over other treatments due to including both n-Si and n-ZE-loaded N and their favorable effects on plant growth and enhancement of biomass by the increased availability of nutrients to plants [23].It enhanced the chlorophyll contents, influenced by the structure of the chloroplasts and leaf yield, which boosted their ability to utilize light [24]. Additionally, these results are related to the morphological characteristics of S. Canadensis plants, in harmony with those obtained by Mahmoud et al. [7,11,28] on the Thymus vulgaris, Vicia faba, and Carum carvi plants, respectively.
Furthermore, the results suggest that a composite nano-application of T5 on the goldenrod plants led to enhanced absorption and usage of nutrients such as K, Ca, Mg, and Fe under drought stress (Table 5). Potassium (K) is essential in plant growth through osmotic adjustment, decreasing stomatal transpiration, and increasing turgor pressure to raise drought tolerance [26,67]. Magnesium (Mg) and calcium (Ca) are primarily critical for achieving potential survival by improving plant growth, maintaining the integrity of plant membranes, and regulating ion permeability [62]. Similarly, iron (Fe), which is a key component of numerous proteins and enzymes, can cause many metabolic processes to degrade [7]. This finding agrees with that obtained by Mahmoud et al. [68], who found that increased nutrient accessibility, which results in increased leaf area, chlorophyll production, and photosynthetic capacity, was the cause of higher productivity of plants when Si and ZEs were applied together. Another study on thyme showed that yield productivity is enhanced by the application of Si and ZEs as NPs which increased nutrient contents as a positive correlation between them [7]. Additionally, n-Si nutrients regulate the stomatal opening and transpiration of leaves, which enhances the movement of soil nutrients into the roots [69,70]. Regarding the n-ZE-loaded N impact, it increases soil nutrient retention and improves the adsorption of Ca2+, K+, Na+, and Mg2+ by exceptionally increasing the soil’s cation exchange capacity, pH, and exchangeable K, as well as improving N metabolism [28,71].
The total chlorophyll, phenolic, flavonoid, and carbohydrate contents were the highest in goldenrod plants under the T5 application (Table 6) because this co-application conferred a beneficial protective mechanism inside plants. These results are similar to those reported by Cataldo et al. [72] on Vitis vinifera grown in new sandy soil and treated with ZEs application, which enhanced physiological profiles and photosynthesis to give a better ability to counteract low water availability. Sil et al. [73] and Esmaili et al. [74] reported that the plants Triticum aestivum and Tanacetum parthenium were treated by Si as an amendment in soil, which improved photosynthetic pigments and total phenolic content and promoted plant growth under stress conditions. Phenolic compounds are an eminent antioxidant factor that correlates positively with the amount of soluble sugar contents under drought stress and are raised by the addition of T5 and thus enhanced total carbohydrate content (Table 6). The reason for this is that the soluble sugars enhanced the activity of the rubisco carboxylase enzyme that contributes to the stimulation production of total phenolics and flavonoids [75]. Additionally, Dehghanipoodeh et al. [76] and Mahmoud et al. [24] found that Si and ZEs improved the synthesis of carbohydrates, total phenolic content, and flavonoids, as well as significantly affected the photosynthetic rate.
Additionally, CO2 fixation, transpiration rates, water use efficiency, and photosynthesis rates are affected negatively under drought-induced osmotic stress in leaves due to the water moving from the cytoplasm into the intercellular spaces and stomatal closure [77]. In Figure 6, the uptake of CO2 notably decreased intercellular spaces under stress conditions because the consumption of NADPH+H is responsible for their fixation by the Calvin cycle, which also results in the generation of ROS [78]. It was also noticed that treating goldenrod plants with T5 developed a balance between the water loss through transpiration and the CO2 influx, and thus improved the photosynthesis rate and stomatal conductance. These results are in harmony with those obtained by Hajizadeh et al. [79], who reported the positive effect of Si-NP applications under drought stress that enhanced stomatal conductance in leaves by enhanced CO2 influx into their mesophyll structures. The mechanisms that maintain water under drought stress include decreased transpiration and physiological balance by the n-Si application that deposits silica and results in binding to cellulose in the leaf epidermis and below the cuticle; this deposition acts as a barrier to water loss and helps maintain cellular hydration [80]. Likewise, n-ZE-loaded N was more effective and improved the absorption of water and all nutrients in plants because it has a high surface area, mesoporous structure, and high water and nutrient loading capacity [81,82]. Mahmoud et al. [7] reported that the application of Si and ZEs as NPs in newly reclaimed soil led to a twofold increase in the rate of photosynthesis and pigment accumulation by improving the rates of CO2 uptake and stomatal conductance to resist unfavorable conditions.
Exposure to drought induces oxidative stress by generating ROS in cell components (MDA, H2O2, and O2•−) that cause oxidative damage to cellular components and affect their function, disturb redox homeostasis, and result in a damaged cell membrane [83]. Numerous studies conducted under water deficit conditions found that plants can upregulate their antioxidant defense systems to scavenge ROS by improving the regulation of enzymes and non-enzymes, with the modulation of phytohormones [84]. Accordingly, the drought stress, along with n-Si+ n-ZE-loaded N as amendments to fed S. canadensis plants, markedly enhanced plant performance and the antioxidant defense system to enable plants to withstand drought stress, as shown in Figure 8 and Table 1, comparable to control plants. For many reasons, goldenrods are tolerant plants that have some defense traits such as rapid stomata closure and water use efficiency, in addition to developing multiple and interrelated signal pathways to regulate various stress-responsive genes, notably to control H2O2 and O2•− production [38]. Thus, the production of H2O2 is decreased in healthy goldenrod cells under moderate stress conditions by controlling the activity of SOD and CAT enzymes, which are enhanced with increased H2O2 production to convert and disintegrate it into molecular oxygen and water, aiming to prevent their spread in stressed cells under severe stress conditions [33]. Furthermore, n-Si supplies mechanical strength to plant cell walls and up-regulates its defensive mechanism as an enzyme protector from ROS scavenging, regulating phytohormone biosynthesis, and maintaining cell membranes [85]. Additionally, n-ZEs are also used as catalysts and adsorbent materials with structural stability to improve membrane permeability to facilitate mineral nutrient uptake and photosynthesis transportation, thus stimulating plant growth and biomass production [86]. For that reason, T5 application has shown that phytohormones play a vital role in plants to mitigate stress, as they increase the contents of IAA to regulate cell wall extensibility and allow for cellular expansion while decreasing ABA contents to delay leaf senescence [6]. This could be attributed to the increased mineral nutrients needed for the establishment of protoplasm, secondary metabolites, and phytohormones [87]. Furthermore, the actual mechanisms behind the combination of n-Si + n-ZE-mediated alterations on goldenrod plants under drought stress are still unclear. However, some literature was in harmony with the results obtained by Valadabadi and Yousefi [88] and Mahmoud and Swaefy [24].
Integrative application of Si + ZE-loaded NPs (T5) under drought stress enhanced the EO quality and quantity of S. canadensis (Table 7 and Table 8, Figure 7). These results indicate that the integrative application enhanced the EO productivity per plant or yield in feddan as a result of improving nutrient availability, chlorophyll formation, and photosynthesis rate as well as decreasing the negative impacts of drought stress on the plant cells [69,88]. García-Caparrós et al. [89] mentioned that drought stress on six Lamiaceae species might be attributed to the decline in leaf surface and the enhancement of oil gland number and density, also changing the pathways of secondary metabolite production and their distribution. Moreover, Si and its nanoparticles are known to be directly connected with antioxidant activity and to modulate the hormonal status as efficient elicitors to increase the production of secondary metabolites [69]. Mahmoud and Swaefy [24] mentioned that nano-ZE application enhanced sage plant growth and increased EO yield by increasing the availability of water and nutrients, as well as multiplying the density and size of oil gland cells in leaves. Accordingly, the application of T5 enhanced the economic value of goldenrod plants by increasing the EO yield under drought conditions [7,88,89]. The increased quality and quantity of the active ingredients in EO under drought conditions is one of the main defense mechanisms due to the photosynthetic rate decreased by a reduction in CO2 uptake leading to the generation of NADPH+ H+ in an inhibitory photosynthesis process [90].In this way, the biosynthesis of secondary metabolites through the usage of NADPH+ H+ maintains plant cells and decreases the negative impacts of drought stress [91]. Additionally, the enhancement of EO goldenrod composition was related to drought conditions and the effect of the NP application by increasing the accessibility of nutrients that play a critical role in EO compositions and raising the photosynthesis rate to increase carbohydrate productivity for the growth of cells and production of EO glands [37]. Similarly, Thymus vulgaris plants treated with NPs consisting of Si and ZEs significantly enhanced the biomass, oil yield, and EO composition by improving the chlorophyll content and increasing the availability of nutrients in plant leaves that can increase EO contents in the plant [7]. Similarly, Afshari et al. [92] noted that plants treated with Si-NPs increased the EO content in coriander (Coriandrum Sativum L.). The modification of EO yield and constituents of Caraway plants with the nano-ZE application may be in terms of the increased plant biomass and CO2 assimilation [24].
Moreover, co-application with Si and ZE-loaded N-NPs is a valuable method for mitigating stress conditions and enhancing growth, physio-chemical attributes, and optimum EO quality and quantity of S. canadensis plants. EO composition showed different behavior under drought with various sources of NP application. Consequently, these plants have high variations in EO profile to reach the given compound under climate change conditions. Although there is much preoccupation these days with controlling the spread of S. canadensis, exploiting its therapeutic potential in EO could be a cost-effective strategy for sustainable agriculture.

5. Conclusions

In this study, applying the combined treatment of T5 (n-Si and n-ZE-loadedN as soil amendments) significantly alleviated the negative impact of water deficit stress conditions on S. canadensis plants. It is the best treatment when considering water scarcity in newly reclaimed land, resulting in the highest EO productivity, the content of elements in plant biomass (i.e., N, P, K, Ca, Mg, Fe), and growth and flowering characteristics of S. canadensis plants in comparison to individual application of nano-Si or nano-ZEs and/or control treatment. Applied T5 in the soil also resulted in an improvement in photosynthesis and metabolisms processes, intercellular CO2 concentrations, and water use efficiency, which also increased with enhanced IAA contents with control in antioxidants. Conversely, the transpiration rate and ABA contents decreased to delay leaf senescence with stomata closure under drought stress. Finally, we recommend the T5 application to farmers as an efficient strategy to eliminate or reduce chemical input. It enables the prediction of the most likely quality of raw materials harvested from invasive goldenrod plants under climate change conditions for the control of their spread. Thus, it is considered a new window for sustainable agriculture.

Author Contributions

Conceptualization, A.W.M.M. and E.Z.O.; methodology, A.W.M.M., A.B.E.-A. and R.M.E.-B.; implementation, A.W.M.M. and E.Z.O.; visualization, S.N.A.E.-K. and R.M.E.-B.; formal analysis, A.B.E.-A.; writing—original draft preparation, A.W.M.M., E.Z.O. and S.H.M.; writing—review and editing, A.W.M.M. and E.Z.O.; project administration, A.B.E.-A., A.W.M.M. and E.Z.O.; supervision, A.W.M.M. All authors have read and agreed to the published version of the manuscript.

Funding

This research has no funds, but the facilities, equipment, and apparatus are supported by Cairo University, Faculty of Agriculture, Giza, Egypt.

Data Availability Statement

Not applicable.

Acknowledgments

The authors are grateful to the Department of Botany, Plant Physiology Section, Application of the Nanoparticles Project, and the Ornamental Department, Faculty of Agriculture, Cairo University, for providing facilities and equipment to finalize this work.

Conflicts of Interest

The authors declare no conflict of interest.

References

  1. El-Badri, A.M.; Batool, M.A.A.; Mohamed, I.; Wang, Z.; Khatab, A.; Sherif, A.; Ahmad, H.; Khan, M.N.; Hassan, H.M.; Elrewainy, I.M.; et al. Antioxidative and Metabolic Contribution to Salinity Stress Responses in Two Rapeseed Cultivars during the Early Seedling Stage. Antioxidants 2021, 10, 1227. [Google Scholar] [CrossRef] [PubMed]
  2. Beckman, J.; Countryman, A.M. The Importance of Agriculture in the Economy: Impacts from COVID-19. Am. J. Agric. Econ. 2021, 103, 1595–1611. [Google Scholar] [CrossRef] [PubMed]
  3. Bulgari, R.; Franzoni, G.; Ferrante, A. Biostimulants Application in Horticultural Crops under Abiotic Stress Conditions. Agronomy 2019, 9, 306. [Google Scholar] [CrossRef] [Green Version]
  4. Saud, S.; Chen, Y.; Fahad, S.; Hussain, S.; Na, L.; Xin, L.; Alhussien, S. Silicate application increases the photosynthesis and its associated metabolic activities in Kentucky bluegrass under drought stress and post-drought recovery. Environ. Sci. Pollut. Res. 2016, 23, 17647–17655. [Google Scholar] [CrossRef] [PubMed]
  5. Abdul Qados, A.M.S. Effect of salt stress on plant growth and metabolism of bean plant Vicia faba. J. Saudi Soc. Agric. Sci. 2011, 10, 7–15. [Google Scholar] [CrossRef] [Green Version]
  6. Mahmoud, A.W.M.; Samy, M.M.; Sany, H.; Eid, R.R.; Rashad, H.M.; Abdeldaym, E.A. Nanopotassium, Nanosilicon, and Biochar Applications Improve Potato Salt Tolerance by Modulating Photosynthesis, Water Status, and Biochemical Constituents. Sustainability 2022, 14, 723. [Google Scholar] [CrossRef]
  7. Mahmoud, A.W.M.; Esmail, S.E.A.; El-Attar, A.B.; Othman, E.Z.; El-Bahbohy, R.M. Prospective Practice for Compound Stress Tolerance in Thyme Plants Using Nanoparticles and Biochar for Photosynthesis and Biochemical Ingredient Stability. Agronomy 2022, 12, 1069. [Google Scholar] [CrossRef]
  8. Zulfiqar, F.; Chen, J.; Finnegan, P.M.; Younis, A.; Nafees, M.; Zorrig, W.; Hamed, K.B. Application of Trehalose and Salicylic Acid Mitigates Drought Stress in Sweet Basil and Improves Plant Growth. Plants 2021, 10, 1078. [Google Scholar] [CrossRef]
  9. Pingping, W.; Chubin, W.; Biyan, Z. Drought Stress Induces Flowering and Enhances Carbohydrate Accumulation in Averrhoa Carambola. Hortic. Plant J. 2017, 3, 60–66. [Google Scholar] [CrossRef]
  10. Mansoor, S.; Kour, N.; Manhas, S.; Zahid, S.; Wani, O.A.; Sharma, V.; Wijaya, L.; Alyemeni, M.N.; Alsahli, A.A.; El-Serehy, H.A.; et al. Biochar as a tool for effective management of drought and heavy metal toxicity. Chemosphere 2021, 271, 129458. [Google Scholar] [CrossRef]
  11. Mahmoud, A.W.M.; Ayad, A.A.; Abdel-Aziz, H.S.M.; Williams, L.L.; El-Shazoly, R.M.; Abdel-Wahab, A.; Abdeldaym, E.A. Foliar Application of Different Iron Sources Improves Morpho-Physiological Traits and Nutritional Quality of Broad Bean Grown in Sandy Soil. Plants 2022, 11, 2599. [Google Scholar] [CrossRef] [PubMed]
  12. Hafez, M.; Popov, A.I.; Rashad, M. Integrated use of bio-organic fertilizers for enhancing soil fertility–plant nutrition, germination status and initial growth of corn (Zea mays L). Environ. Technol. Innov. 2021, 21, 101329. [Google Scholar] [CrossRef]
  13. Marchiol, L.; Mattiello, A.; Pošćić, F.; Fellet, G.; Zavalloni, C.; Carlino, E.; Musetti, R. Changes in Physiological and Agronomical Parameters of Barley (Hordeum vulgare) Exposed to Cerium and Titanium Dioxide Nanoparticles. Int. J. Environ. Res. Public Health 2016, 13, 332. [Google Scholar] [CrossRef] [PubMed] [Green Version]
  14. Abou-Sreea, A.I.B.; Kamal, M.; El Sowfy, D.M.; Rady, M.M.; Mohamed, G.F.; Al-Dhumri, S.A.; AL-Harbi, M.S.; Abdou, N.M. Small-Sized Nanophosphorus Has a Positive Impact on the Performance of Fenugreek Plants under Soil-Water Deficit Stress: A Case Study under Field Conditions. Biology 2022, 11, 115. [Google Scholar] [CrossRef]
  15. Qureshi, A.; Singh, D.; Dwivedi, S. Nano-fertilizers: A Novel Way for Enhancing Nutrient Use Efficiency and Crop Productivity. Int. J. Curr. Microbiol. Appl. Sci. 2018, 7, 3325–3335. [Google Scholar] [CrossRef] [Green Version]
  16. Astaneh, N.; Bazrafshan, F.; Zare, M.; Amiri, B.; Bahrani, A. Nano-fertilizer prevents environmental pollution and improves physiological traits of wheat grown under drought stress conditions. Sci. Agropecu. 2021, 12, 41–47. [Google Scholar] [CrossRef]
  17. Zulfiqar, F.; Navarro, M.; Ashraf, M.; Akram, N.A.; Munné-Bosch, S. Nanofertilizer use for sustainable agriculture: Advantages and limitations. Plant Sci. 2019, 289, 110270. [Google Scholar] [CrossRef]
  18. Xin, X.; Nepal, J.; Wright, A.L.; Yang, X.; He, Z. Carbon nanoparticles improve corn (Zea mays L.) growth and soil quality: Comparison of foliar spray and soil drench application. J. Clean. Prod. 2022, 363, 132630. [Google Scholar] [CrossRef]
  19. Asadpour, S.; Madani, H.; Mohammadi, G.N.; Heravan, I.M.; Abad, H.H.S. Improving Maize Yield with Advancing Planting Time and Nano-Silicon Foliar Spray Alone or Combined with Zinc. Silicon 2020, 14, 201–209. [Google Scholar] [CrossRef]
  20. Badem, A.; Söylemez, S. Effects of Nitric Oxide and Silicon Application on Growth and Productivity of Pepper under Salinity Stress. J. King Saud Univ. Sci. 2022, 34, 102189. [Google Scholar] [CrossRef]
  21. Rajput, V.D.; Minkina, T.; Feizi, M.; Kumari, A.; Khan, M.; Mandzhieva, S.; Sushkova, S.; El-Ramady, H.; Verma, K.K.; Singh, A.; et al. Effects of Silicon and Silicon-Based Nanoparticles on Rhizosphere Microbiome, Plant Stress and Growth. Biology 2021, 10, 791. [Google Scholar] [CrossRef]
  22. Ismail, L.M.; Soliman, M.I.; Abd El-Aziz, M.H.; Abdel-Aziz, H.M.M. Impact of Silica Ions and Nano Silica on Growth and Productivity of Pea Plants under Salinity Stress. Plants 2022, 11, 494. [Google Scholar] [CrossRef] [PubMed]
  23. Mahmoud, A.W.M.; Abdeldaym, E.A.; Abdelaziz, S.M.; El-Sawy, M.B.I.; Mottaleb, S.A. Synergetic Effects of Zinc, Boron, Silicon, and Zeolite Nanoparticles on Confer Tolerance in Potato Plants Subjected to Salinity. Agronomy 2019, 10, 19. [Google Scholar] [CrossRef] [Green Version]
  24. Mahmoud, A.W.M.; Swaefy, H.M. Comparison between commercial and nano NPK in presence of nano zeolite on sage plant yield and its components under water stress. Agriculture 2020, 66, 24–39. [Google Scholar] [CrossRef]
  25. Hassan, A.Z.A.; Mahmoud, A.W.M. Strategy for Boosting Rock Phosphate Efficiency and Conversion into Nano Zeolite. Am. J. Nanomater. 2016, 4, 27–38. [Google Scholar] [CrossRef]
  26. Hassan, A.Z.A.; Mahmoud, A.W.M.; Turky, G. Rice husk derived nano zeolite (A.M.2) as fertilizer, hydrophilic and novel organophilic material. Am. J. Nanomater. 2017, 5, 11–23. [Google Scholar] [CrossRef]
  27. Yuvaraj, M.; Subramanian, K.S. Development of slow release Zn fertilizer using nano-zeolite as carrier. J. Plant Nutr. 2018, 41, 311–320. [Google Scholar] [CrossRef]
  28. Mahmoud, A.W.M.; El-Attar, A.B.; Mahmoud, A.A. Economic evaluation of nano and organic fertilizers as an alternative source to chemical fertilizers on Carum carvi L. plant yield and components. Agriculture 2017, 63, 33–49. [Google Scholar] [CrossRef] [Green Version]
  29. Besharati, J.; Shirmardi, M.; Meftahizadeh, H.; Ardakani, M.D.; Ghorbanpour, M. Changes in growth and quality performance of Roselle (Hibiscus sabdariffa L.) in response to soil amendments with hydrogel and compost under drought stress. South Afr. J. Bot. 2022, 145, 334–347. [Google Scholar] [CrossRef]
  30. McGaw, L.J.; Omokhua-Uyi, A.G.; Finnie, J.F.; Van Staden, J. Invasive alien plants and weeds in South Africa: A review of their applications in traditional medicine and potential pharmaceutical properties. J. Ethnopharmacol. 2022, 283, 114564. [Google Scholar] [CrossRef]
  31. Dong, L.J.; Yu, H.W.; He, W.M. What determines positive, neutral, and negative impacts of Solidago canadensis invasion on native plant species richness? Sci. Rep. 2015, 5, 16804. [Google Scholar] [CrossRef] [PubMed] [Green Version]
  32. Weber, E. Current and Potential Ranges of Three Exotic Goldenrods (Solidago) in Europe. Conservat. Biol. 2001, 15, 122–128. [Google Scholar] [CrossRef]
  33. Bao, X.-Y.; Wang, Z.-X.; He, Z.-S.; He, W.-M. Enhanced precipitation offsets climate warming inhibition on Solidago canadensis growth and sustains its high tolerance. Global Ecol. Conservat. 2022, 34, e02023. [Google Scholar] [CrossRef]
  34. Mahdi, Z.A.H.; Hussein, J.K. Effect of humic acid, gibberellin and tryptophan on the growth and flowering characteristics of goldenrods plant Solidago canadensis. IOP Conf. Ser. Earth Environ. Sci. 2021, 910, 012128. [Google Scholar] [CrossRef]
  35. Fursenco, C.; Calalb, T.; Uncu, L.; Dinu, M.; Ancuceanu, R. Solidago virgaurea L.: A Review of Its Ethnomedicinal Uses, Phytochemistry, and Pharmacological Activities. Biomolecules 2020, 10, 1619. [Google Scholar] [CrossRef]
  36. Nkuimi-Wandjou, J.G.; Quassinti, L.; Gudžinskas, Z.; Nagy, D.U.; Cianfaglione, K.; Bramucci, M.; Maggi, F. Chemical composition and antiproliferative effect of essential oils of four Solidago species (S. canadensis, S. gigantea, S. virgaurea and S.× niederederi). Chem. Biodivers. 2020, 17, e2000685. [Google Scholar] [CrossRef]
  37. Radušienė, J.; Karpavičienė, B.; Marksa, M.; Ivanauskas, L.; Raudonė, L. Distribution Patterns of Essential Oil Terpenes in Native and Invasive Solidago Species and Their Comparative Assessment. Plants 2022, 11, 1159. [Google Scholar] [CrossRef]
  38. Wang, Z.X.; He, Z.S.; He, W.M. Nighttime climate warming enhances inhibitory effects of atmospheric nitrogen deposition on the success of invasive Solidago canadensis. Clim. Change 2021, 167, 20. [Google Scholar] [CrossRef]
  39. Richards, L.A. Diagnosis and Improvement of Saline and Alkali Soils, U.S.D.A. Agriculture Handbook No. 60; US Department of Agriculture: Washington, DC, USA, 1954; p. 158.
  40. Jackson, M. Soil Chemical Analysis; Pentice Hall of India Pvt. Ltd.: New Delhi, India, 1973; Volume 498, pp. 151–154. [Google Scholar]
  41. Keller, J.; Bliesner, R.D. Sprinkle and Trickle Irrigation; The Blackburn Press: New York, NY, USA, 2000; 652p. [Google Scholar]
  42. Hassan, A.Z.A.; Mahmoud, A.W.M. Hydrothermal synthesis of nano crystals (AM) zeolite using variable temperature programs. J. Nanomater. Mol. Nanotechnol. 2015, 4. [Google Scholar] [CrossRef]
  43. Li, J.; Wee, C.; Sohn, B. Effect of ammonium- and potassium-loaded zeolite on kale, growth, and soil property. Am. J. Plant Sci. 2013, 4, 1976–1982. [Google Scholar] [CrossRef]
  44. Helrich, K. Official Methods of Analysis, 15th ed.; Association of Official Agricultural Chemist: Arlington, VA, USA, 1990; Volume 1, p. 673. [Google Scholar]
  45. Zhu, Y.; Gong, H. Beneficial effects of silicon on salt and drought tolerance in plants. Agron. Sustain. Dev. 2014, 34, 455–472. [Google Scholar] [CrossRef] [Green Version]
  46. Asiya, S.I.; Pal, K.; Kralj, S.; El-Sayyad, G.S.; de Souza, F.G.; Narayanan, T. Sustainable preparation of gold nanoparticles via green chemistry approach for biogenic applications. Mater. Today Chem. 2020, 17, 100327. [Google Scholar] [CrossRef]
  47. Lugojan, C.; Ciulca, S. Evaluation of relative water content in winter wheat. J. Hortic. Sci. Biotechnol. 2011, 15, 173–177. [Google Scholar]
  48. Moran, R. Formulae for determination of chlorophyllous pigments extracted with N,N-dimethylformamide. Plant Physiol. 1982, 69, 1376–1381. [Google Scholar] [CrossRef] [Green Version]
  49. Singleton, V.L.; Rossi, J.A. Colorimetry of Total Phenolics with Phosphomolybdic-Phosphotungstic Acid Reagents. Am. J. Enol. Vitic. 1965, 16, 144. [Google Scholar]
  50. Meda, A.; Lamien, C.E.; Romito, M.; Millogo, J.; Nacoulma, O.G. Determination of the total phenolic, flavonoid and proline contents in Burkina Fasan honey, as well as their radical scavenging activity. Food Chem. 2005, 91, 571–577. [Google Scholar] [CrossRef]
  51. Fales, T.M.; Jaouni, J.F.; Babashak, I. Simple device for preparing ethereal diazomethane without resorting to codistillation. Ann. Chem. 1973, 45, 2302–2303. [Google Scholar] [CrossRef]
  52. Furniss, B.S. Vogel’s Textbook of Practical Organic Chemistry; Pearson Education India: Delhi, India, 1989; pp. 1174–1179. [Google Scholar]
  53. Polle, A.; Otter, T.; Mehne-Jakobs, B. Effect of magnesium deficiency on antioxidative systems in needles of Norway spruce [Piceaabies (L.) Karst.] grown with different ratios of nitrate and ammonium as nitrogen sources. New Phytol. 1994, 128, 621–628. [Google Scholar] [CrossRef]
  54. Nishikimi, M.; Appaji Rao, N.; Yagi, K. The Occurrence of Superoxide Anion in the Reaction of Reduced Phenazine Methosulfate and Molecular Oxygen. Biochem. Biophys. Res. Commun. 1972, 46, 849–854. [Google Scholar] [CrossRef]
  55. Aebi, H. Catalase in vitro. InMethods in Enzymology; Academic Press: Cambridge, MA, USA, 1984; pp. 121–126. [Google Scholar] [CrossRef]
  56. Shelepova, O.; Vinogradova, Y.; Zaitchik, B.; Ruzhitsky, A.; Grygorieva, O.; Brindza, J. Constituents of the essential oil in Solidago canadensis L. from Eurasia. Potravin. Slovak J. Food Sci. 2018, 12, 20–25. [Google Scholar] [CrossRef] [Green Version]
  57. Amani Machiani, M.; Javanmard, A.; Morshedloo, M.R.; Maggi, F. Evaluation of Competition, Essential Oil Quality and Quantity of Peppermint Intercropped with Soybean. Ind. Crops Prod. 2018, 111, 743–754. [Google Scholar] [CrossRef]
  58. Stenhagen, E.; Abrahamsson, S.; McLafferty, F.W. Registry of Mass Spectral Data; John Wiley & Sons, Ltd.: New York, NY, USA, 1974. [Google Scholar]
  59. Sadtler, R. The Sadtler Standard Gas Chromatography Retention Index Library; Sadtler Research Laboratories: Philadelphia, PA, USA, 1986; Volume 4. [Google Scholar]
  60. Duncan, D.B. Multiple range and multiple ’F’ tests. Biometrics 1955, 11, 1–42. [Google Scholar] [CrossRef]
  61. Metsalu, T.; Vilo, J. ClustVis: A web tool for visualizing clustering of multivariate data using Principal Component Analysis and heatmap. Nucleic Acids Res. 2015, 43, W566–W570. [Google Scholar] [CrossRef]
  62. Kusvuran, S. Microalgae (Chlorella vulgaris Beijerinck) alleviates drought stress of broccoli plants by improving nutrient uptake, secondary metabolites, and antioxidative defense system. Hortic. Plant J. 2021, 7, 221–231. [Google Scholar] [CrossRef]
  63. El-Sayed, I.M.; Salim, R.G.; El-Haggar, E.F.; El-Ziat, R.A.; Soliman, D.M. Molecular Characterization and Positive Impact of Brassinosteroids and Chitosan on Solidago canadensis cv. Tara Characteristics. Horticulturae 2020, 6, 100. [Google Scholar] [CrossRef]
  64. Du, L.; Liu, H.; Guan, W.; Li, J.; Li, J. Drought affects the coordination of belowground and aboveground resource-related traits in Solidago canadensis in China. Ecol.Evolut. 2019, 9, 9948–9960. [Google Scholar] [CrossRef] [PubMed] [Green Version]
  65. Abbas, A.; Huang, P.; Hussain, S.; Shen, F.; Wang, H.; Du, D. Mild evidence for local adaptation of Solidago canadensis under different salinity, drought, and abscisic acid conditions. Pol. J. Environ. Stud. 2022, 31, 2987–2995. [Google Scholar] [CrossRef] [PubMed]
  66. Ostadi, A.; Javanmard, A.; Amani Machiani, M.; Kakaei, K. Optimizing antioxidant activity and phytochemical properties of peppermint (Mentha piperita L.) by integrative application of biofertilizer and stress-modulating nanoparticles under drought stress conditions. Plants 2023, 12, 151. [Google Scholar] [CrossRef]
  67. El-Attar, A.B.; Othman, E.Z.; El-Bahbohy, R.M.; Mahmoud, A.W.M. Efficiency of different potassium sources, and soil bio-fertilizers for growth, productivity, and biochemical constituents of Narcissus (Narcissus tazetta L.). J. Plant Nutr. 2022. [Google Scholar] [CrossRef]
  68. Mahmoud, A.W.M.; Hassan, A.Z.A.; Mottaleb, S.A.; Rowezak, M.M.; Salama, A.M. The role of nano-silicon and other soil conditioners in improving physiology and yield of the drought-stressed barley crop. Agriculture 2021, 67, 124–143. [Google Scholar] [CrossRef]
  69. Golubkina, N.; Logvinenko, L.; Konovalov, D.; Garsiya, E.; Fedotov, M.; Alpatov, A.; Shevchuk, O.; Skrypnik, L.; Sekara, A.; Caruso, G. Foliar Application of Selenium under Nano Silicon on Artemisia annua: Effects on Yield, Antioxidant Status, Essential Oil, Artemisinin Content and Mineral Composition. Horticulture 2022, 8, 597. [Google Scholar] [CrossRef]
  70. Greger, M.; Landberg, T.; Vaculík, M. Silicon Influences Soil Availability and Accumulation of Mineral Nutrients in Various Plant Species. Plants 2018, 7, 41. [Google Scholar] [CrossRef] [Green Version]
  71. Bybordi, A. Influence of zeolite, selenium and silicon upon some agronomic and physiologic characteristics of canola grown under salinity. Commun. Soil Sci. Plant Anal. 2016, 47, 832–850. [Google Scholar] [CrossRef]
  72. Cataldo, E.; Fucile, M.; Mattii, G.B. Leaf Eco-Physiological Profile and Berries Technological Traits on Potted Vitis vinifera L. cv Pinot Noir Subordinated to Zeolite Treatments under Drought Stress. Plants 2022, 11, 1735. [Google Scholar] [CrossRef]
  73. Sil, P.; Das, P.; Biswas, A.K. Impact of Exogenous Silicate Amendments on Nitrogen Metabolism in Wheat Seedlings Subjected to Arsenate Stress. Silicon 2019, 12, 535–545. [Google Scholar] [CrossRef]
  74. Esmaili, S.; Tavallali, V.; Amiri, B. Nano-Silicon Complexes Enhance Growth, Yield, Water Relations and Mineral Composition in Tanacetum parthenium under Water Deficit Stress. Silicon 2021, 13, 2493–2508. [Google Scholar] [CrossRef]
  75. Namjoyan, S. Nano-silicon protects sugar beet plants against water deficit stress by improving the antioxidant systems and compatible solutes. Acta Physiol. Plant 2020, 42, 157. [Google Scholar] [CrossRef]
  76. Dehghanipoodeh, S.; Ghobadi, C.; Baninasab, B.; Gheysari, M.; Shiranibidabadi, S. Effect of Silicon on Growth and Development of Strawberry under Water Deficit Conditions. Hortic. Plant J. 2018, 4, 226–232. [Google Scholar] [CrossRef]
  77. Li, W.; Wang, Y.; Ren, H.; Guo, Z.; Li, N.; Zhao, C.; XIE, Z. Transcriptomic and physiological analyses identifying Lanzhou lily (Lilium davidii var. unicolor) drought adaptation strategies. Hortic. Plant J. 2022, in press. [Google Scholar] [CrossRef]
  78. González-García, Y.; Cárdenas-Álvarez, C.; Cadenas-Pliego, G.; Benavides-Mendoza, A.; Cabrera-de-la-Fuente, M.; Sandoval-Rangel, A.; Valdés-Reyna, J.; Juárez-Maldonado, A. Effect of Three Nanoparticles (Se, Si and Cu) on the Bioactive Compounds of Bell Pepper Fruits under Saline Stress. Plants 2021, 10, 217. [Google Scholar] [CrossRef] [PubMed]
  79. Hajizadeh, H.S.; Asadi, M.; Zahedi, S.M.; Hamzehpour, N.; Rasouli, F.; Helvacı, M.; Alas, M. Silicon dioxide-nanoparticle nutrition mitigates salinity in gerbera by modulating ion accumulation and antioxidants. Folia Hortic. 2021, 33, 91–105. [Google Scholar] [CrossRef]
  80. Teixeira, G.C.M.; de Prado, R.M.; Rocha, A.M.S.; de Oliveira Filho, A.S.B.; da Sousa Junior, G.S.; Gratão, A.S.B. Action of silicon on the activity of antioxidant enzymes and on physiological mechanisms mitigates water deficit in sugarcane and energy cane plants. Sci. Rep. 2022, 12, 17487. [Google Scholar] [CrossRef]
  81. Montanari, T.; Busca, G. On the mechanism of adsorption and separation of CO2 on LTA zeolites: An IR investigation. Vib. Spectrosc. 2008, 46, 45–51. [Google Scholar] [CrossRef]
  82. Palanivell, P.; Ahmed, O.H.; Omar, L.; Abdul Majid, N.M. Nitrogen, Phosphorus, and Potassium Adsorption and Desorption Improvement and Soil Buffering Capacity Using Clinoptilolite Zeolite. Agronomy 2021, 11, 379. [Google Scholar] [CrossRef]
  83. Sofo, A.; Scopa, A.; Nuzzaci, M.; Vitti, A. Ascorbate Peroxidase and Catalase Activities and Their Genetic Regulation in Plants Subjected to Drought and Salinity Stresses. Int. J. Mol. Sci. 2015, 16, 13561–13578. [Google Scholar] [CrossRef] [Green Version]
  84. Zandi, P.; Schnug, E. Reactive Oxygen Species, Antioxidant Responses and Implications from a Microbial Modulation Perspective. Biology 2022, 11, 155. [Google Scholar] [CrossRef] [PubMed]
  85. Ahmad, P.; Ahanger, M.A.; Alam, P.; Alyemeni, M.N.; Nasser, M.; Wijaya, L.; Ali, S.; Ashraf, M. Silicon (Si) Supplementation Alleviates NaCl Toxicity in Mung Bean [Vigna radiata (L.) Wilczek] Through the Modifications of Physio-biochemical Attributes and Key Antioxidant Enzymes. J. Plant Growth Regul. 2019, 38, 70–82. [Google Scholar] [CrossRef]
  86. Wen, J.; Dong, H.; Zeng, G. Application of zeolite in removing salinity/sodicity from wastewater: A review of mechanisms, challenges and opportunities. J. Clean. Prod. 2018, 197, 1435–1446. [Google Scholar] [CrossRef]
  87. Balakhnina, T.I.; Bulak, P.; Matichenkov, V.V.; Kosobryukhov, A.A.; Włodarczyk, T.M. The influence of Si-rich mineral zeolite on the growth processes and adaptive potential of barley plants under cadmium stress. Plant Growth Regul. 2015, 75, 557–565. [Google Scholar] [CrossRef]
  88. Valadabadi, S.A.; Yousefi, M. Effect of Zeolite and Biofertilizers on the Essential Oil Yield and Some Physiological Characteristics of Satureja hortensis L. under Water Deficit Stress. J. Med. Plants By-Prod. 2022, 5, 1327. [Google Scholar] [CrossRef]
  89. García-Caparrós, P.; Romero, M.J.; Llanderal, A.; Cermeño, P.; Lao, M.T.; Segura, M.L. Effects of drought stress on biomass, essential oil content, nutritional parameters, and costs of production in six Lamiaceae species. Water 2019, 11, 573. [Google Scholar] [CrossRef]
  90. Caser, M.; Chitarra, W.; D’Angiolillo, F.; Perrone, I.; Demasi, S.; Lovisolo, C.; Pistelli, L.; Pistelli, L.; Scariot, V. Drought stress adaptation modulates plant secondary metabolite production in Salvia dolomitica Codd. Ind. Crops Prod. 2019, 129, 85–96. [Google Scholar] [CrossRef]
  91. Amani Machiani, M.; Javanmard, A.; Morshedloo, M.R.; Aghaee, A.; Maggi, F. Funneliformismosseae inoculation under water deficit stress improves the yield and phytochemical characteristics of thyme in intercropping with soybean. Sci. Rep. 2021, 11, 15279. [Google Scholar] [CrossRef] [PubMed]
  92. Afshari, M.; Pazoki, A.; Sadeghipour, O. Foliar-applied silicon and its nanoparticles stimulate physio-chemical changes to improve growth, yield and active constituents of coriander (Coriandrum sativum L.) essential oil under different irrigation regimes. Silicon 2021, 13, 4177–4188. [Google Scholar] [CrossRef]
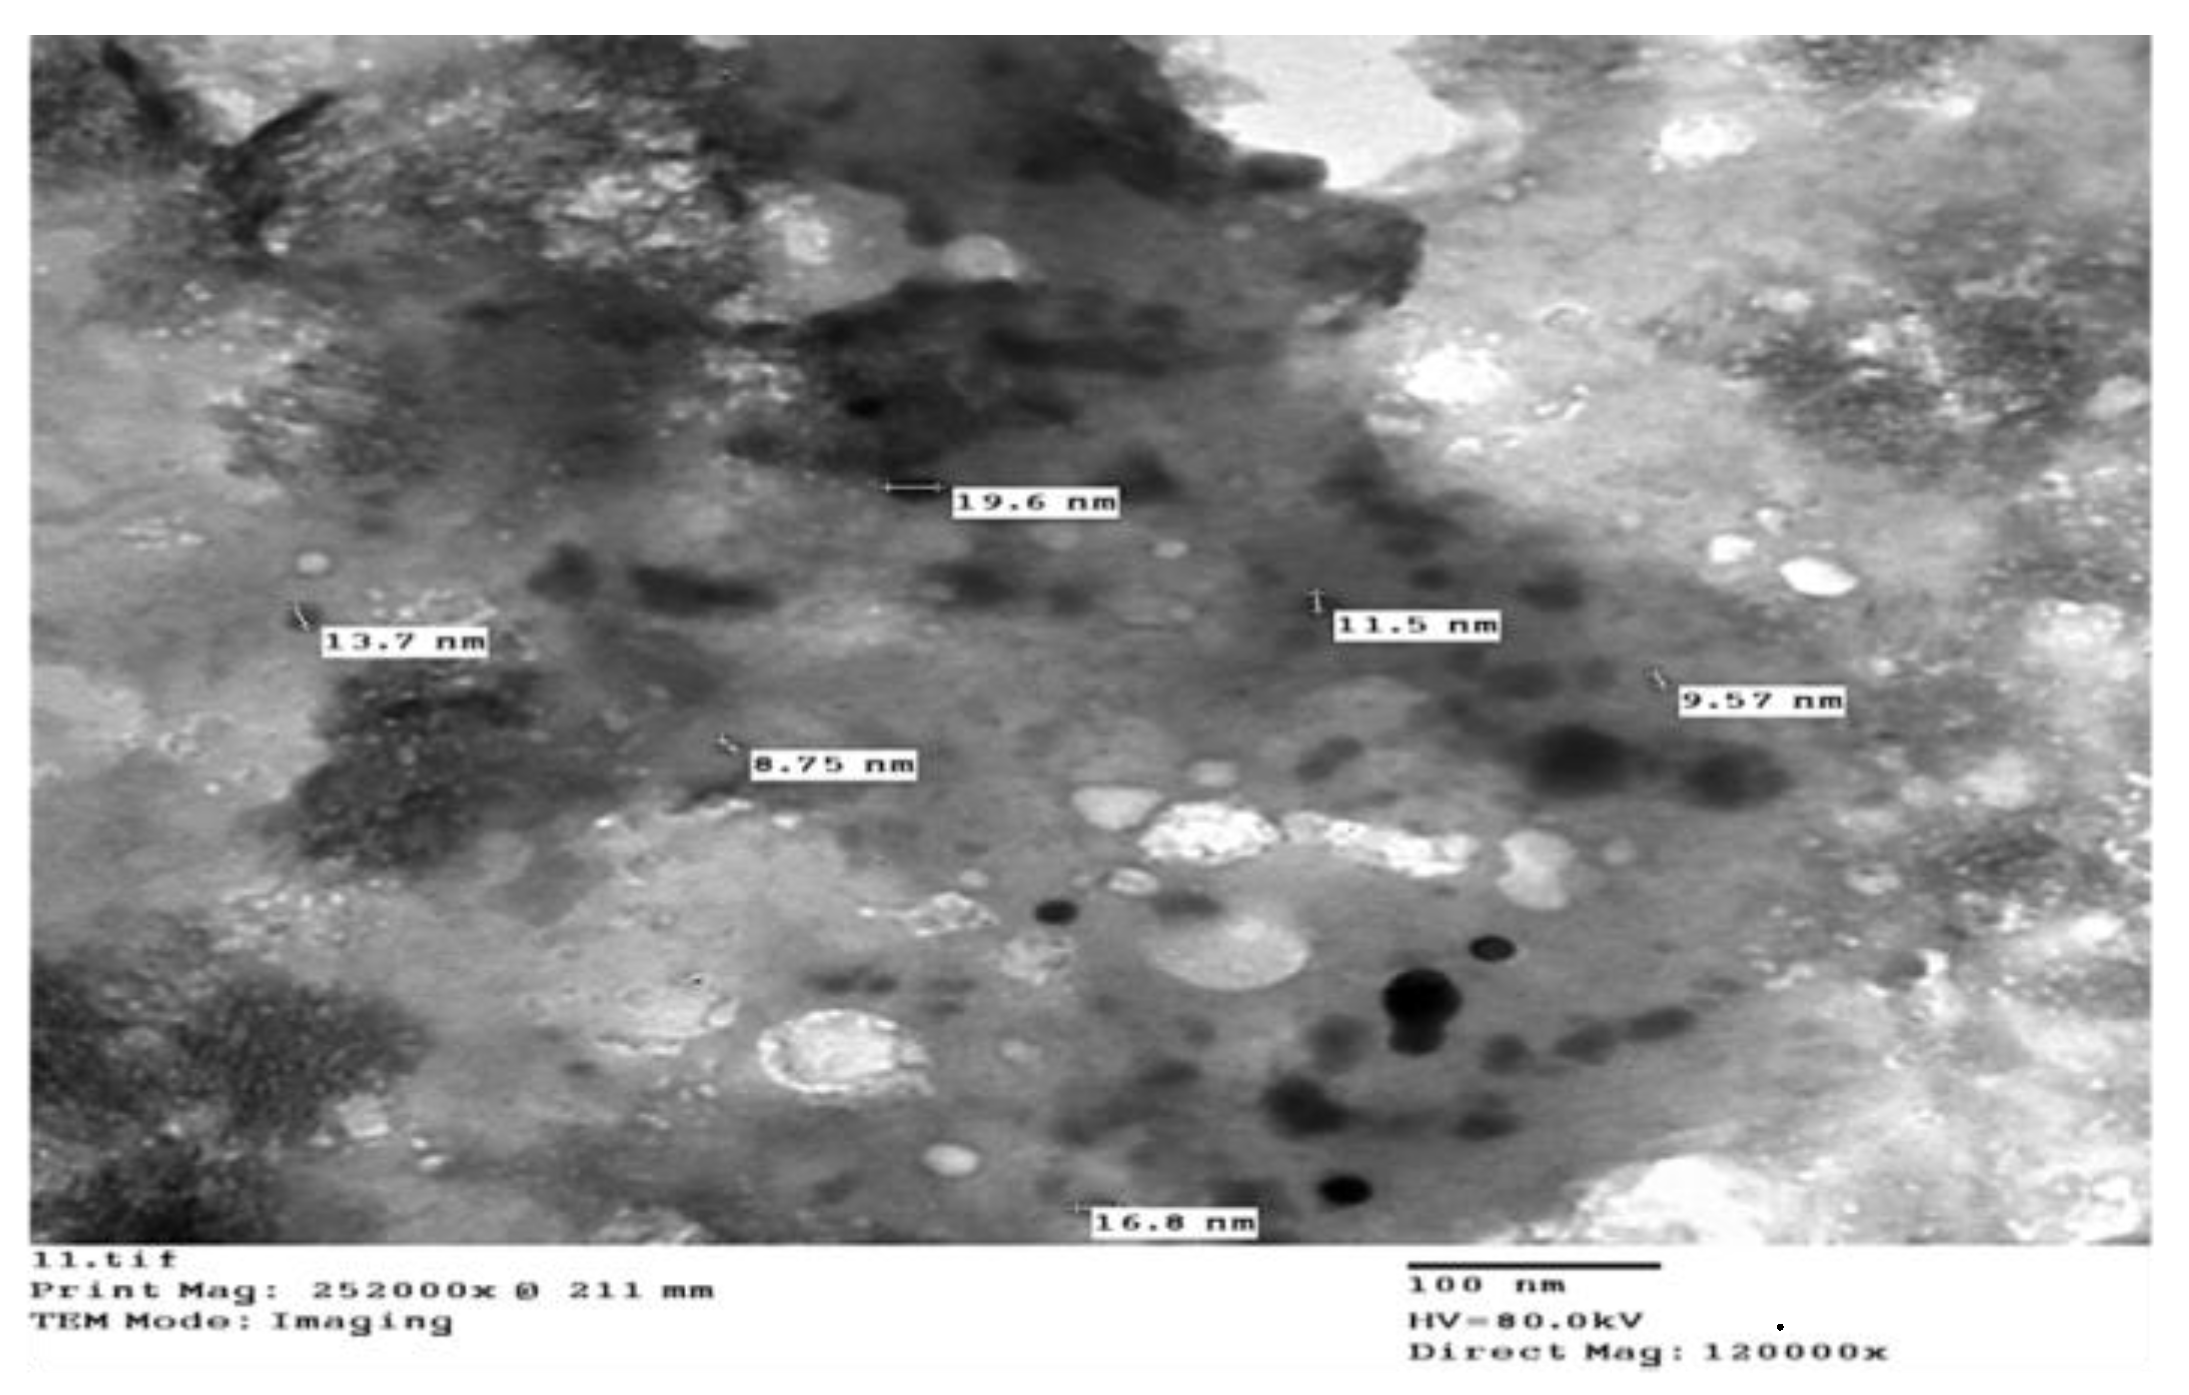
Figure 1. Zeolite nano-loaded nitrogen particles.
Horticulturae 09 00172 g001
Figure 2. Silicon nanoparticles.
Horticulturae 09 00172 g002
Figure 3. Nitrogen nanoparticles.
Horticulturae 09 00172 g003
Figure 4. Phosphorus nanoparticles.
Horticulturae 09 00172 g004
Figure 5. Potassium nanoparticles.
Horticulturae 09 00172 g005
Figure 6. Photosynthetic rate, stomatal conductance, leaf transpiration rate, intercellular CO2 concentration, and water use efficiency under drought conditions and different nanoparticle applications on Solidago canadensis plants during the 2020 and 2021 growing seasons. Different letters show statistically significant differences declared by Duncan’s Multiple Range Test LSD at p ≤ 0.05. (T1) NPK= chemical fertilizer, (T2) n-Si= silicon nanoparticles, (T3) n-NPK= NPK nanoparticles, (T4) n-ZE-loaded N= nano-zeolite-loaded nitrogen, (T5) n-Si+ n-ZE-loaded N= silicon nanoparticles+ nano-zeolite-loaded nitrogen.
Horticulturae 09 00172 g006
Figure 7. Leaf phytohormones and enzyme activities under drought conditions and different nanoparticle applications on Solidago canadensis plants during the 2020 and 2021 growing seasons. Different letters show statistically significant differences declared by Duncan’s Multiple Range Test LSD at p ≤ 0.05. (T1) NPK = chemical fertilizer, (T2) n-Si = silicon nanoparticles, (T3) n-NPK = NPK nanoparticles, (T4) n-ZE-loaded N = nano-zeolite-loaded nitrogen, (T5) n-Si+ n-ZE-loaded N = silicon nanoparticles + nano-zeolite-loaded nitrogen, IAA = indole-3-acetic acid, ABA = abscisic acid, CAT = catalase enzyme, SOD =superoxide dismutase enzyme.
Horticulturae 09 00172 g007
Figure 8. Heat map diagram clustering source treatments based on essential oil constituents in aerial parts of Solidago canadensis plants. The source treatments: T1 (control): chemical-NPK, T2: n-Si, T3: n-NPK, T4: nZE-loaded N, T5: n-Si + n-ZE-loaded N, under drought conditions. Rows in the heatmap represent different volatile compounds, while columns represent different treatments of nano-fertilizers. The key color bar indicates standardized mean values (dark blue indicates relatively lower mean values as negative relationships; dark yellow indicates relatively higher mean values as positive relationships).
Horticulturae 09 00172 g008
Table 1. Initial soil properties of the experimental site.
ParametersSoil Depth (cm)
0–3030–60
Sand%90.1090.00
Silt%6.906.50
Clay%3.003.50
Textural classSandSand
Saturation water content (cm3 cm−3)0.3850.396
Field capacity (cm3cm−3)0.2130.218
Permanent wilting point (cm3cm−3)0.0570.057
Available water (cm3.cm−3)0.1560.161
Bulk density (mg m−3)1.641.65
Saturated hydraulic conductivity (m day−1)2.402.34
Organic matter (%)0.310.25
Calcium carbonates (%)4.803.71
pH (1: 1, soil: water suspension)7.707.81
EC (1:1, soil: water extract) (dS m−1)4.024.13
Soluble ions (meq 100 g−1 soil)
Ca2+13.8513.41
Mg2+12.1510.59
Na+8.1010.25
K+6.006.05
CO3--
HCO311.929.75
Cl14.0010.50
SO415.0821.30
Available nutrients (mg g−1 soil)
N16.2113.12
P7.786.21
K46.5045.89
Fe9.2012.00
Mn1.631.50
Cu2.101.15
B0.230.21
Zn2.001.61
Table 2. Chemical properties of applied organic matter (compost).
PropertyValue
Moisture content (%)25
pH (1:5)7.5
EC (1:5 extract) (dS m−1)3.1
Organic-C (%)33.11
Organic matter (%)70
Total-N (%)1.82
Total-K (%)1.25
C/N ratio19:1
Total-P (%)1.29
Fe (mg L−1)1019
Mn (mg L−1)111
Cu (mg L−1)180
Zn (mg L−1)280
The total content of bacteria (CFU.g−1)2.5 × 10⁷
Phosphate dissolving bacteria (CFU.g−1)2.5 × 10⁶
Weed seeds0
Table 3. Chemical composition of n-ZEs after being loaded with nitrogen.
Chemical composition (%)SiO2TiO2Al2O3Fe2O3FeOMnOMgOCaONa2OK2OSrOP2O3N
45.502.8113.305.408.310.516.309.522.830.870.220.672.70
Trace elements (mg L−1)BaCoCrSeCuZnZrNbNiRbY
101.2350.8196425713551522
Table 4. Growth and yield characteristics under drought conditions and different nanoparticle applications on Solidago canadensis plants during the 2020 and 2021 growing seasons.
TreatmentPlant Height (cm)Inflorescence Length
(cm)
Number of Inflorescences
/Plant
Total Leaf
Area (cm)2
Leaf Length (cm)Herb Fresh Weight (g/Plant)Herb Dry Weight (g/Plant)Yield Fresh Weight (ton/fed)
1st2nd1st2nd1st2nd1st2nd1st2nd1st2nd1st2nd1st2nd
(T1)
control
47.67 b
±1.316
49.36 c
±0.591
21.63 b
±2.009
21.60 b
±1.814
2.0 c
±0.000
2.0 e
±0.577
147.99 c
±1.436
162.42 c
±2.324
6.32 b
±0.447
6.91 cd
±0.344
167.75 c
±6.144
178.66 c
±5.989
38.78 cd
±1.058
39.72 d
±1.058
4.19 d
±0.006
4.47 d
±0.012
(T2)42.22 c
±1.804
44.75 c
±2.074
19.75 b
±1.698
19.73 b
±0.858
2.0 c
±0.577
3.0 d
±0.000
136.17 d
±3.850
144.05 d
±2.138
5.09 c
±0.382
6.31 d
±0.413
150.95 c
±5.239
161.93 c
±5.292
33.35 d
±2.639
36.29 d
±0.132
3.77 e
±0.009
4.07 e
±0.012
(T3) 66.48 a
±2.001
64.33 b
±2.752
23.54 a
±1.624
26.33 a
±1.496
4.0 ab
±0.577
5.0 b
±0.000
165.90 b
±2.725
189.05 b
±2.380
8.10 a
±0.427
8.65 ab
±0.476
214.65 b
±2.451
233.13 b
±4.751
54.55 b
±2.117
58.85 b
±1.493
5.37 b
±0.012
5.84 b
±0.021
(T4) 65.25 a
±1.702
69.32 ab
±1.978
21.90 a
±1.939
27.23 a
±2.158
3.0 bc
±0.000
4.0 c
±0.000
155.32 c
±2.018
164.61 c
±2.289
7.83 a
±0.727
7.86 bc
±0.491
199.41 b
±4.678
222.47 b
±5.292
43.22 c
±2.166
51.47 c
±2.367
4.99 c
±0.000
5.60 c
±0.047
(T5)68.37 a
±0.115
72.25 a
±0.509
27.83 a
±0.301
26.80 a
±0.327
5.0 a
±0.000
6.0 a
±0.000
186.05 a
±1.456
211.92 a
±2.110
8.66 a
±0.269
9.09 a
±0.226
234.67 a
±6.181
255.83 a
±6.289
64.40 a
±1.744
70.88 a
±3.966
5.88 a
±0.007
6.53 a
±0.133
Values are means ± standard deviation (SD) of five replicates (n = 5). Different letters show statistically significant differences declared by Duncan’s Multiple Range Test LSD at p ≤ 0.05. 1st = first season, 2nd = second season, (T1) NPK = chemical fertilizer, (T2) n-Si = silicon nanoparticles, (T3) n-NPK= NPK nanoparticles, (T4) n-ZE-loaded N = nano-zeolite-loaded nitrogen, (T5) n-Si+ n-ZE-loaded N = silicon nanoparticles + nano-zeolite-loaded nitrogen.
Table 5. Leaf endogenous nutrient contents under drought conditions and different nanoparticle applications on Solidago canadensis plants during the 2020 and 2021 growing seasons.
TreatmentMacronutrients
(%)
Micronutrients
(mg L−1)
NPKCaMgCuZnFeMn
1st2nd1st2nd1st2nd1st2nd1st2nd1st2nd1st2nd1st2nd1st2nd
(T1)
control
2.94 bc
±0.156
3.12 c
±0.049
0.29 c
±0.015
0.32 c
±0.006
3.24 c
±0.124
3.15 d
±0.021
0.83 bc
±0.020
0.85 bc`
±0.006
0.17 cd
±0.012
0.19 c
±0.009
7.64 b
±0.316
7.79 b
±0.373
38.64 c
±1.695
42.05 c
±0.913
63.11 c
±1.650
65.73 c
±1.695
50.34 b
±1.411
51.01 d
0.973
(T2) 2.85 c
±0.154
2.90 cd
±0.105
0.31 bc
±0.015
0.32 bc
±0.009
4.41 a
±0.115
4.45 a
±0.020
0.78 c
±0.018
0.80 c
±0.028
0.15 d
±0.015
0.18 c
±0.009
7.43 b
±0.467
8.12 b
±0.088
40.81 bc
±2.075
43.20bc
±0.497
65.96 c
±1.140
67.68 c
±1.064
53.45 b
±1.097
54.19 c
0.990
(T3) 3.20 b
±0.047
3.38 b
±0.085
0.43 a
±0.006
0.43 a
±0.009
3.34 bc
±0.059
3.27 c
±0.024
0.85 b
±0.015
0.88 ab
±0.015
0.22 b
±0.006
0.24 b
±0.012
7.98 b
±0.437
8.01 b
±0.076
45.73 b
±1.346
47.20 b
±1.043
73.16 b
±1.580
75.37 b
±0.665
55.14ab
±0.852
57.57 b
±0.456
(T4)2.87 c
±0.087
2.86 d
±0.059
0.33 b
±0.009
0.35 b
±0.009
3.27 c
±0.022
3.25 cd
±0.047
0.83 bc
±0.015
0.86 bc
±0.009
0.21 bc
±0.012
0.20 bc
±0.012
7.84 b
±0.148
7.87 b
±0.276
41.59 bc
±1.018
44.00bc
±1.165
72.85 b
±1.487
73.56 b
±1.320
54.15 b
±1.527
55.69 bc
±0.919
(T5)4.28 a
±0.059
4.17 a
±0.050
0.45 a
±0.006
0.44 a
±0.006
3.55 b
±0.062
3.43 b
±0.055
0.94 a
±0.012
0.92 a
±0.009
0.27 a
±0.015
0.28 a
±0.012
9.20 a
±0.313
9.40 a
±0.321
52.47 a
±1.590
53.16 a
±2.232
80.09 a
±1.517
81.37 a
±1.224
59.63 a
±2.032
62.28 a
±1.069
Values are means ± standard deviation (SD) of five replicates (n = 5). Different letters show statistically significant differences declared by Duncan’s Multiple Range Test LSD at p ≤ 0.05. 1st = first season, 2nd = second season, (T1) NPK = chemical fertilizer, (T2) n-Si = silicon nanoparticles, (T3) n-NPK = NPK nanoparticles, (T4) n-ZE-loaded N= nano-zeolite-loaded nitrogen, (T5) n-Si+ n-ZE-loaded N= silicon nanoparticles + nano-zeolite-loaded nitrogen.
Table 6. Photosynthetic pigments and biochemical contents under drought conditions and different nanoparticle applications on Solidago canadensis plants during the 2020 and 2021 growing seasons.
TreatmentTotal
Chlorophyll (mg/g)
Total Phenolic
Content
(mg/g)
Total Flavonoids
Content
(mg/g)
Total
Carbohydrate
%
1st2nd1st2nd1st2nd1st2nd
(T1) control15.42 d
±0.618
16.31 c
±0.414
29.52 c
±1.311
32.98 c
±1.251
0.39 d
±0.012
0.42 d
±0.017
29.96 bc
±1.554
27.98 bc
±1.805
(T2) 16.22 cd
±0.954
15.50 c
±1.100
32.64 c
±1.149
33.82 c
±0.874
0.46 c
±0.015
0.49 c
±0.015
28.12 c
±1.236
26.85 c
±0.813
(T3) 19.46 b
±0.610
21.80 b
±1.313
38.11 ab
±1.007
37.13 ab
±0.767
0.51 ab
±0.009
0.54 ab
±0.012
33.41 ab
±1.263
32.80 a
±1.537
(T4)18.34 bc
±0.492
19.90 b
±0.969
35.93 b
±1.034
34.77 bc
±1.118
0.48 bc
±0.015
0.52 bc
±0.018
30.43 abc
±0.514
31.99 ab
±1.556
(T5) 22.90 a
±0.884
26.17 a
±0.921
39.37 a
±0.676
38.57 a
±0.366
0.53 a
±0.012
0.55 a
±0.012
34.17 a
±0.947
35.52 a
±1.274
Values are means ± standard deviation (SD) of five replicates (n = 5). Different letters show statistically significant differences declared by Duncan’s Multiple Range Test LSD at p ≤ 0.05. 1st = first season, 2nd = second season, (T1) NPK = chemical fertilizer, (T2) n-Si = silicon nanoparticles, (T3) n-NPK = NPK nanoparticles, (T4) n-ZE-loaded N = nano-zeolite-loaded nitrogen, (T5) n-Si+ n-ZE-loaded N = silicon nanoparticles + nano-zeolite-loaded nitrogen.
Table 7. Essential oil (EO) productivity under drought conditions and different nanoparticle applications on Solidago canadensis plants during the 2020 and 2021 growing seasons.
TreatmentOil%
of herb
Oil %
of root
Oil yield/plant
(ml)
Oil yield/fed.
(L)
1st2nd1st2nd1st2nd1st2nd
(T1) control0.45 c
±0.018
0.46 d
±0.012
0.187 bc
±0.018
0.180 cd
±0.012
0.75 d
±0.058
0.82 d
±0.045
18.78 d
±1.407
20.57 d
±1.131
(T2) 0.34 d
±0.012
0.38 e
±0.012
0.140 c
±0.012
0.160 d
±0.012
0.51 e
±0.030
0.61 e
±0.020
12.84 e
±0.790
15.36 e
±0.452
(T3) 0.54 b
±0.012
0.58 b
±0.012
0.227 ab
±0.018
0.240 ab
±0.012
1.16 b
±0.038
1.35 b
±0.009
28.99 b
±0.943
33.77 b
±0.182
(T4)0.50 b
±0.012
0.51 c
±0.018
0.207 b
±0.018
0.213 bc
±0.018
1.00 c
±0.047
1.14 c
±0.034
24.95 c
±1.139
28.53 c
±0.932
(T5) 0.62 a
±0.012
0.65 a
±0.018
0.260 a
±0.012
0.280 a
±0.012
1.45 a
±0.036
1.67 a
±0.038
36.37 a
±0.926
41.75 a
±0.983
Values are means ± standard deviation (SD) of five replications (n = 5). Different letters show statistically significant differences declared by Duncan’s Multiple Range Test LSD at p ≤ 0.05. 1st = first season, 2nd= second season, (T1) NPK = chemical fertilizer, (T2) n−Si = silicon nano, (T3) n-NPK = NPK nano, (T4) n-ZEs loaded-N = nano-zeolite loaded nitrogen, (T5) n-Si + n-ZEs loaded-N = silicon nano + nano-zeolite loaded nitrogen.
Table 8. Essential oil (EO) components in aerial parts under drought conditions and different nanoparticle applications on Solidago canadensis plants during the 2020 and 2021 growing seasons.
Components(T1)
Control
(T2)(T3)(T4)(T5)
1-Monoterpene
α-Pinene30.8928.5131.1122.1431.87
Camphene1.232.341.131.451.15
Sabinene0.440.360.220.570.36
β-Pinene2.752.312.162.472.18
Myrcene3.253.052.652.652.29
Limonene15.9719.5412.4816.5317.35
γ-Terpinen0.320.480.580.220.26
α-Campholenal1.341.661.141.821.17
Carvone0.110.170.230.280.13
Bornyl acetate9.488.8112.8714.339.42
2-Sesquiterpene
β-Elemene0.710.630.590.840.68
β-Caryophyllene2.382.861.652.531.45
α-Caryophyllene0.460.740.320.650.43
Germacrene D23.5221.7820.1225.3126.24
γ-Cadinene2.152.191.762.251.33
β-Eudesmene0.370.620.290.420.37
Aromadendrene oxide0.380.490.310.270.36
Caryophyllene oxide0.310.770.420.640.41
Spathulenol0.230.580.190.470.34
Total identified (%)96.7796.4196.2296.1597.79
Grouped compounds (%)
Monoterpenes65.7866.2370.5762.7766.18
Sesquiterpenes30.9930.1825.6533.3831.61
Others3.233.593.783.852.21
Disclaimer/Publisher’s Note: The statements, opinions and data contained in all publications are solely those of the individual author(s) and contributor(s) and not of MDPI and/or the editor(s). MDPI and/or the editor(s) disclaim responsibility for any injury to people or property resulting from any ideas, methods, instructions or products referred to in the content.