Article

Prescriptive-Corrective Irrigation and Macronutrient Management in Greenhouse Soil-Grown Tomato Using the VegSyst-DSS v2 Decision Support Tool

by
Marisa Gallardo
1,2,*,
M. Teresa Peña-Fleitas
1,
Francisco M. Padilla
1,2,
Juan Cedeño
1 and
Rodney B. Thompson
1,2
1
Department of Agronomy, University of Almeria, Ctra. Sacramento s/n, La Cañada de San Urbano, 04120 Almeria, Spain
2
CIAIMBITAL Research Centre for Mediterranean Intensive Geosystems and Agrifood Biotechnology, University of Almeria, La Cañada de San Urbano, 04120 Almeria, Spain
*
Author to whom correspondence should be addressed.
Horticulturae 2023, 9(10), 1128; https://doi.org/10.3390/horticulturae9101128
Submission received: 6 September 2023 / Revised: 2 October 2023 / Accepted: 6 October 2023 / Published: 12 October 2023

Abstract

:
This work relates to greenhouse vegetable production in soil in Almeria, Spain. The prescriptive–corrective management (PCM) of irrigation and fertilization (N, P, K, Ca, and Mg) was evaluated. PCM combined recommendations (prescriptive management) for irrigation and nutrients made with the VegSyst-DSS v2, a decision support system, with monitoring (corrective management) using tensiometers (for irrigation) and petiole sap analysis (for nutrients). PCM was compared with conventional farmer management (CONV). The VegSyst-DSS v2 recommends applied nutrient concentrations considering simulated crop uptake, available soil nutrient supply, and evapotranspiration (ETc). This study was conducted with soil-grown tomato in a plastic greenhouse. Nutrients were applied in nutrient solution via drip fertigation. Compared to CONV management, PCM reduced irrigation by 25%, N, K, and Mg application by 40%, Ca by 58%, and P by 85%. There were no significant differences between treatments in fruit production and quality, despite appreciable reductions in irrigation and nutrient application. An economic analysis indicated that in this 7-month tomato crop, PCM compared to CONV management was associated with a financial saving of 1611 € ha−1. These results showed that by using prescriptive–corrective fertigation management, based on the VegSyst-DSS v2, considerable savings can be achieved in water and nutrient (N, P, K, Ca, and Mg) inputs to greenhouse tomato without compromising production. This can reduce farmer costs and the environmental impact associated with these greenhouse production systems.

1. Introduction

The greenhouse vegetable production system located in southeastern (SE) Spain is mostly concentrated in the province of Almeria, where there are currently 33,000 hectares of greenhouses [1]. This system is one of the most important economic sectors in this region. Approximately 90% of the greenhouse surface area in this region is cropped in soil [2]. Excessive application of water and nutrients to greenhouse crops commonly occurs. It is associated with management practices based on collective experience using fixed standard practices. As a consequence, this system is associated with various serious environmental problems, such as overexploitation of underlying aquifers [3], saltwater intrusion [4], and considerable nitrate (NO3) contamination of underlying aquifers [4]. Additionally, there is appreciable accumulation of available phosphorus (P) in greenhouse soils [5]. In accordance with the EU Nitrates Directive [6], all greenhouse production areas in the province of Almeria, and in neighboring provinces, have been designated nitrate vulnerable zones [7], and are required to implement improved nutrient management practices [8]. Recent Spanish government regulations on sustainable fertilization requires that farmers must prepare detailed plans of intended fertilizer use, compatible with good agricultural practices, prior to starting a crop [9].
Greenhouse vegetable growers in Almeria, and neighboring provinces, have lacked science-based tools that enable planning the optimal N supply, applied via fertigation, for an individual crop. To provide such a tool, the decision support system (DSS) VegSyst-DSS v1 was developed to calculate crop N and irrigation requirements for greenhouse vegetable crops. It also provides recommendations for the N concentration to be applied in fertigation nutrient solutions [10]. The VegSyst-DSS v1 is based on the VegSyst simulation model [10,11] which calculates daily dry matter production (DMP), crop N uptake, and crop evapotranspiration (ETc). Considering that (a) in greenhouse vegetable production, all macronutrients are applied in each irrigation and (b) the difficulty for potential users to manage N separately from other macronutrients, the VegSyst-DSS v2 was subsequently developed to provide nutrient recommendations for N, P, K, Ca, and Mg for soil-grown vegetable crops in SE Spain [12]. This tool calculates the daily requirements of (i) irrigation based on estimations of ETc, and (ii) various macronutrients (N, P, K, Ca, and Mg) based on crop demand and soil content of available nutrients. Nutrient recommendations are provided in both amounts (in kg ha−1) concentrations (in mmol L−1) for fertigation nutrient solutions [12].
The VegSyst-DSS v2 is based on the VegSyst v3 simulation model, which calculates daily values of DMP, crop uptake of N, P, K, Ca, and Mg, and ETc from climate data [12]. In the VegSyst-DSS v2, the N fertilizer recommendations are based on estimations of daily crop N uptake, calculated using the VegSyst simulation model, and subsequent daily N balances that consider soil mineral N, N mineralized from manure and from soil organic matter (OM), using N efficiency values for each N source [10]. The recommendations for P, K, Ca, and Mg consider soil available/exchangeable content (from soil analysis) and simulated crop uptake. Recommended concentrations of N, P, K, Ca, and Mg (in mmol L−1) are calculated from simulated requirements of each nutrient and ETc [12].
Practical agronomic applications of DSSs, based on models, are most effective when used as part of prescriptive–corrective management of irrigation and nutrient application [13]. The prescriptive component being crop-specific plans of recommendations provided by a DSS, and the corrective component being the use of monitoring approaches to guide adjustments to ensure optimal nutrient and irrigation status [13,14]. Effective prescriptive–corrective management of irrigation, using recommendations from the PrHo program [15] combined with tensiometers, was reported by the authors of [14,16]. Prescriptive–corrective management of N was used in sweet pepper by the authors of [16], using the VegSyst-DSS v1 for N recommendations and different crop N monitoring tools (suction cups and sap analysis) for the ongoing adjustment of the N supply. The use of prescriptive–corrective management of both irrigation and N by the authors of [14,16] resulted in large reductions in NO3 leaching loss. Using the stable isotope 15N, it was demonstrated that prescriptive–corrective management resulted in a very high recovery of fertilizer N in a soil-grown greenhouse pepper crop [17].
Until now, evaluations with the VegSyst-DSS, in the Almeria cropping system, have been conducted with sweet pepper and have focused on N management. Currently, there is no information (i) for other species, such as tomato, which is currently the second most cropped vegetable species in Almeria [1], and (ii) for macronutrients other than N.
In soil-grown vegetable production in greenhouses, all nutrients are managed together using advanced fertigation systems. Since vegetable growers manage all nutrients and irrigation together, tools that simultaneously calculate recommendations of irrigation and all macronutrients are required. The VegSyst-DSS v2 has been evaluated for recommendations of several macronutrients, in scenario analyses, with hypothetical soils of low, medium, and high nutrient availability [12]. However, its performance to optimize irrigation and macronutrient management, under realistic field conditions, has yet to be evaluated.
Various decision support systems have been developed to provide irrigation and N recommendations for tomato crops [13,18]; however, very few have been developed for combined irrigation and nutrient recommendations of fertigated tomato [18]. The VegSyst-DSS is the only DSS in which the components, for the determination of crop requirements for irrigation, N, P, K, Ca, and Mg, such as crop interception of PAR radiation, radiation use efficiency, reference evapotranspiration, crop coefficients, growth, and macronutrient dilution curves, have been calibrated and validated for tomato grown in Mediterranean plastic greenhouses in SE Spain [11,12,19]. It is also the only available DSS that recommends the concentrations of a range of macronutrients for fertigation nutrient solutions, considering the crop demand and the soil nutrient supply of individual crops grown in individual greenhouses [12]. For corrective irrigation management in this greenhouse system, tensiometers are recommended for their ease of use, adequate working range, cheap price, and the availability of locally derived threshold values [20,21]. For corrective nutrient management in this system, petiole sap has been thoroughly evaluated [22,23] together with the use of small, portable ion-selective electrode systems to measure sap nutrient concentrations [24,25].
The objective of this work was to evaluate prescriptive–corrective management of irrigation and macronutrient (N, P, K, Ca, and Mg) fertilization by combining recommendations of VegSyst-DSS v2 with soil matric potential data measured with tensiometers and in situ analysis of nutrients in petiole sap. This improved management system was compared with conventional irrigation and nutrient management. This study was conducted in a soil-grown tomato crop, in a plastic greenhouse. All nutrients were applied in complete nutrient solutions via fertigation.

2. Materials and Methods

2.1. Site and Cropping Details

The experimental work was conducted in a 1800 m2 multi-span greenhouse located at the Experimental Station of the University of Almeria, Retamar, Almeria, SE Spain (36°51′ N, 2°16′ W, and 92 m elevation). The greenhouse was passively ventilated using flap roof windows and lateral side panels. The greenhouse had a sandy loam soil and a surface mulch of fine gravel. A long-life tomato (Solanum Lycopersicum L.), cv. Realsol (Rijk Zwaan), was used that was grafted onto cv. Emperador (Rijk Zwaan) rootstock. The crop was grown between 3 September 2021 and 5 April 2022, with a planting density of 2 plants m−2. Above-ground drip irrigation was used for combined irrigation and mineral fertilizer application (i.e., fertigation). Drip tape was arranged in paired lines with 0.5 m spacing between lines within each pair, 1.5 m spacing between adjacent pairs of lines, and 0.5 m spacing between drip emitters within drip lines, giving an emitter density of 2 emitters m−2. Each plant was immediately adjacent to an emitter, which had a discharge rate of 3 L h−1. The coefficient of uniformity of the drip system was >95%. The greenhouse was divided into 8 plots of 80 m2 (8 × 10 m) per plot. Each plot contained 8 paired lines of plants, with 20 plants per line and 160 plants per replicate plot with the same configuration and density as the drip system described before. The greenhouse was divided longitudinally into northern and southern plots via a 2 m path along its east–west axis, with two plots of each treatment in the northern and southern sides. There were border areas along the edges of the greenhouse. Cropping conditions and crop management were generally very similar to those in commercial greenhouses in this region.

2.2. Irrigation and Fertilization Treatments

Two combined irrigation and fertilizer treatments were applied, being (1) a conventional treatment (CONV) representative of commercial practice in the area, and (2) a prescriptive–corrective management treatment (PCM) that applied the irrigation volumes and concentrations of the macronutrients N, P, K, Ca, and Mg recommended by the VegSyst-DSS v2 (the prescriptive component). The corrective component of PCM is described subsequently.
In order to precisely prepare the required concentrations of the nutrient solutions of both treatments, each fertilizer was manually added to irrigation water in the mixing tank of the fertigation system during each irrigation. The amount of each fertilizer was proportional to the irrigation volume for a given irrigation.

2.2.1. Conventional Treatment

In the conventional treatment, the irrigation volumes, which reflected standard local practices, were defined by a group of local technical advisors. The nutrient concentrations applied in the nutrient solution were from a standard local recipe for fertigation of tomato that considered phenological stage [26]. Irrigation frequency was the same in both treatments, being 3–7 irrigations per week according to climatic conditions.

2.2.2. Prescriptive–Corrective Treatment

For prescriptive–corrective management, the software VegSyst-DSS v2 was used to prepare a plan of irrigation and fertilizer recommendations for the duration of the tomato crop. In VegSyst-DSS v2, an internal database of historical climatic data of greenhouses in Almeria [27] provides values of daily air temperature inside the greenhouse and of external solar radiation. Internal solar radiation is calculated as the product of external solar radiation and measured transmissivity of the plastic cladding. Transmissivity was 0.4 from planting until 23 September 2022, 20 days after transplanting (DAT), due to the application of whitening (calcium carbonate suspension) to the greenhouse immediately before transplanting; thereafter, it was 0.55.
To calculate recommendations of daily irrigation volumes with VegSyst-DSS v2, the locally calibrated Almeria radiation method was used to determine the reference evapotranspiration (ETo) [28]. VegSyst-DSS v2 estimates daily N requirements (in kg N ha−1) with a daily N balance that considers simulated crop N uptake, mineralized soil N from organic matter, and soil mineral N, as described by the authors of [10]. Daily P, K, Ca, and Mg requirements (in kg ha−1) consider soil available/exchangeable content (from soil analysis) and simulated crop uptake with the VegSyst model, as described by the authors of [12]. In this work, recommended applied concentrations of N, P, K, Ca, and Mg (in mmol L−1) were calculated using VegSyst-DSS v2 by dividing the estimated requirements of each nutrient by crop evapotranspiration (ETc).
Relevant results of the soil analysis conducted shortly before crop transplanting and the results of the soil evaluation using VegSyst-DSS v2 are presented in Table 1. The sandy loam texture comprised 55% sand, 33% silt, and 12% clay. The soil organic matter and the N-NO3 contents were used in the N balance calculation. No manure had been added in the previous three years, so N mineralization from manure was considered to be zero. The nutrient application factor (f1) (a factor that is multiplied by the daily uptake of a given nutrient considering the soil tests to calculate the nutrient requirements) results, as described by the authors of [12], are listed in Table 1. The f1 value for available P was 0.17, considering the very high levels of available P in the soil. For exchangeable cations, f1 values ranged from 1.2 for K and Ca to 1.8 for Mg (Table 1), which correspond to a soil with medium levels of K and Ca, and a low level of Mg.
The recommendations produced using VegSyt-DSS v2 were daily volumes of irrigation (mm) and 4 weekly values for the concentrations of N, P, K, Ca, and Mg (mmol L−1) in the applied nutrient solution. The PCM treatment followed prescriptive–corrective management for both irrigation and macronutrients, as described by the authors of [14]. The prescriptive component consisted of the use of the VegSyst-DSS v2 to calculate crop requirements of water and nutrients, and the corrective component was the use of monitoring techniques to make subsequent adjustments to avoid deficit or excessive applications. PCM irrigation management was based on simulated ETc; subsequent adjustments were made in response to soil matric potential data measured with manual tensiometers (monitoring) to maintain the soil matric potential of the root zone in the range from −10 to −30 kPa. For nutrient management in the PCM treatments, the prescriptive component was based on applying the concentrations of N, P, K, Ca, and Mg of the nutrient solutions calculated using the VegSyst-DSS v2 for 4-week periods, as described by the authors of [10,12]. The rest of the nutrients, i.e., SO43−, and micronutrients were the same in both treatments to ensure no deficiencies. The criteria for the corrective management of nutrients, which focused on N, P, and K, consisted of maintaining the concentrations of NO3, HPO42−, and K+ in petiole sap above critical reference values, according to the authors of [29] for NO3 and K and to the authors of [30] for HPO42−. The tensiometers were placed in soil within the drip irrigation bulb, where most roots were located, 8 cm to the side of a plant, and 5 cm from the drip line, at a 12 cm depth from the surface of the imported soil. One tensiometer was installed in each plot of each treatment.

2.3. Measurements

2.3.1. Soil

During the crop, three separate soil samplings were conducted at 45 days before transplanting (sampling 1), at 97 DAT (sampling 2), and at 214 DAT (sampling 3). After removing the sand mulch, the soil was sampled within the drip irrigation bulb at 0–10 and 10–20 cm depths in each replicate plot of the two treatments. In the first sampling taken before transplanting, a combined sample was prepared by mixing eight individual samples, one from each replicate plot of the two treatments. In samplings two and three, the combined sample was prepared, for each treatment, by mixing four individual samples, one from each replicated plot and treatment. Soil analysis was conducted in a commercial laboratory to determine texture, total carbonates, organic matter, mineral N (NO3 and NH4+), available (Olsen) P, and exchangeable cations. The results of the first soil sampling (Table 1) were used as input data for VegSyst-DSS v2. All soil analysis parameters presented were the average values of the two soil layers; for N-NO3, the sum value was used.

2.3.2. Climate

Air temperature and relative humidity were measured inside the greenhouse with a relative humidity/temperature probe (model EE210, E+E Elektronik, Stuttgart, Germany). External solar radiation data were downloaded from the closest climate station in the Agroclimatic Information Network of Andalusia [31], located 15 km from the experimental station. Solar radiation within the greenhouse was the product of external solar radiation and the transmissivity of the greenhouse cover, which was measured at midday, shortly before crop planting, immediately after removing the whitening at 10 DAT, and twice per month during the rest of the season. Transmissivity was estimated from measurements made with a linear quantum sensor (model LP-80, Decagon Devices Inc., Pullman, WA, USA).

2.3.3. Volume and Composition of the Applied Nutrient Solution

Irrigation volume was measured by collecting the weekly volumes of irrigation from each of four representative drippers per treatment. The NO3, K+, and Ca2+ concentrations were measured in representative samples of the collected weekly volumes using ion selective electrode (ISE) rapid analysis systems. The three systems used were Horiba LAQUA-Twin ion selective electrode meters (HORIBA, Ltd., Kyoto, Japan). Specifically, the model LAQUA-Twin-NO3-11 was used for NO3, model B-731 for K+, and model B-751 for Ca2+. These rapid on-farm measurements were used for the corrective component of prescriptive–corrective nutrient management.
Composite two-weekly samples of nutrient solution were also prepared, for each replicate plot, by mixing sub-samples of the weekly samples in the same relative proportions as the irrigation volumes applied in each of the two-week periods. In the composite samples, the concentrations of anions (NO3 and HPO42−) and cations (NH4+, K+, Ca2+, and Mg2+) were determined by ion chromatography (Model 930 Compact IC Flex, Metrom AG., Herisau, Switzerland). For each nutrient, the amount applied was calculated every two weeks as the product of the respective concentration and the volume of irrigation applied for that two-week period. For calculations of applied N, the sum of the amounts of NO3 and NH4+ applied was used. The data subsequently presented of the nutrient concentrations in the applied nutrient solution were those determined by ion chromatography.

2.3.4. Nutrient Content in Petiole Sap

Petiole sap measurements were conducted every two weeks during the crop cycle. At each sampling date, between 07:00 and 09:00 solar time, the most recently fully expanded leaf was removed from sixteen different plants in each replicate plot. The petiole sampling, sap extraction, and analytical procedures have been described in detail by the authors of [22]. The extracted sap was diluted (1:5), and the concentrations of NO3, K+, and Ca2+ were analyzed in situ with the same Horiba LAQUA-Twin rapid analysis meters described in Section 2.3.3. Additionally, the concentrations of anions (NO3 and HPO42−) and cations (NH4+, K+, Ca2+, and Mg2+), in the petiole sap samples, were determined in diluted and centrifuged samples (4500 rpm for 15 min) with ion chromatography, as described above (Section 2.3.3). The data subsequently presented of the nutrient concentrations in petiole sap were those determined by ion chromatography.

2.3.5. Nutrient Content in Leaves

Leaves were sampled four times during the crop at 80, 143, 172 DAT, and 187 DAT. At each sampling date, the most recently fully expanded leaf was removed from sixteen different plants, in each replicate plot of each of the two treatments, at between 07:00 and 09:00 solar time. Upon sampling, the leaves were oven dried at 65 ° until constant weight and then ground sequentially in a knife mill and ball mill. The nutrient contents of the leaf samples were determined as follows: Total N content was determined with an elemental analyzer (Model TRUSPEC CN628, LECO Corporation, St. Joseph, MI, USA). The contents of K, P, Ca, and Mg were determined by Inductively coupled plasma (ICP) spectrometry (Model ICAP 6500DUO, Thermo Fisher Scientific, Waltham, MA, USA) after sample digestion.

2.3.6. Nutrients Content in Soil Solution

Soil solution was collected every two weeks using ceramic cup suction samplers that were 3.1 cm in diameter and 35 cm long (Model SPS200 3, SDEC, Reignac Sur Indre, France). The suction samplers were placed in soil within the drip irrigation bulb, where most roots were located, 8 cm to the side of a plant, and 5 cm from the drip line, at a 12 cm depth from the surface of the imported soil. One sampler was installed in each plot of each treatment. Soil solution was collected after applying a vacuum of −70 kPa for 24 h prior to sample collection. No irrigation/fertigation was applied during the 24 h period of sample collection, nor during the 24 h before the application of the vacuum. The concentrations of anions (NO3 and HPO42−) and cations (NH4+, K+, Ca2+, and Mg2+) in the soil solution were determined with ion chromatography, as described above (Section 2.3.3).

2.3.7. Crop Production and Quality

Total fruit yield was determined by summing the fresh weight of mature fruits harvested in 10 successive harvests throughout the crop from 16 marked plants in each replicate plot. At each harvest, the weight of marketable and non-marketable fruit, and the weight and number of individual fruits were recorded. Non-marketable fruits were categorized by criteria of malformation, diseases, and discoloration, according to EU marketing regulations [32].
Fruit quality was evaluated in three harvests, being the third, the sixth, and the tenth fruit harvest on 131, 165 and 209 DAT, respectively. External and internal fruit quality were determined. External quality was characterized by fruit firmness and color measurements. Internal quality was characterized by measuring fruit total soluble solids (TSSs), titratable acidity, and pH in the fruit juice. Four fruits per replicate plot for each treatment were randomly selected and immediately taken to the laboratory, where color was measured on the external skin at three points equidistant from the equatorial zone. Color measurements were made using a chroma meter (Minolta CR-400, Konica Minolta, Osaka, Japan), following the procedures described by the authors of [33]. Firmness of fruit was determined on the external skin at three equidistant points from the equatorial zone using a hand-held penetrometer (PCE-PTR 200N, PCE Ibérica S.L., Albacete, Spain). Results were expressed as newtons (N) of force. To determine fruit total soluble solids (TSSs), titratable acidity, and pH, these measurements were made in the juice of the fruits used for external quality measurements. The juice was obtained using a domestic kitchen blender. TSSs were determined with a digital refractometer (PAL-1, ATAGO Co., Ltd., Tokyo, Japan) and expressed as %Brix. pH was determined with a hand-held pH meter (LAQUA PC110-K, Horiba, Ltd., Kyoto, Japan). Titratable acidity was determined using the following procedure: 10 mL of fruit juice was mixed with 50 mL of distilled water and a few drops of phenolphthalein indicator. The solution was titrated with 0.1 M NaOH.

2.4. Data Analysis

Differences in measured parameters between treatments were evaluated by the analysis of variance (ANOVA) statistical test. Pairwise LSD post-hoc tests were conducted when the treatment effect was significant at p < 0.05. The experimental layout consisted of a complete randomized block design, with four blocks arranged from the north to the south of the greenhouse; a blocking factor was included in the ANOVA. If needed, variables were transformed to meet ANOVA assumptions. Statistical analysis was conducted with STATISTICA 13.5 (TIBCO Software, Inc., Palo Alto, CA, USA). In the two treatments, all measurements of plant and soil parameters were the mean of four values, each from an individual replicate plot.

3. Results

3.1. Water and Nutrients Applied

The seasonal irrigation volumes for the CONV and PCM treatments were 348 and 265 mm, respectively (Table 2). Prescriptive–corrective management resulted in a reduction of 25% in total irrigation. The seasonal evolution of weekly irrigation volumes applied to each treatment and the weekly volumes recommended by PCM are presented in Figure 1b. The weekly irrigation volume applied in both treatments increased from 28 to 63 DAT, reaching maximum values of 22 and 16.5 mm week−1 for the CONV and PCM treatments, respectively (Figure 1b). Subsequently, irrigation volumes were appreciably smaller during the winter, when temperatures and solar radiation were much lower than in the preceding autumn period (Figure 1a). In general, the irrigation volume applied weekly to the PCM treatment agreed well with the recommendations (Figure 1b). However, in the last weeks (189–210 DAT) a period of low solar radiation reduced the actual water requirements in relation to those estimated using historical climate data (Figure 1a).
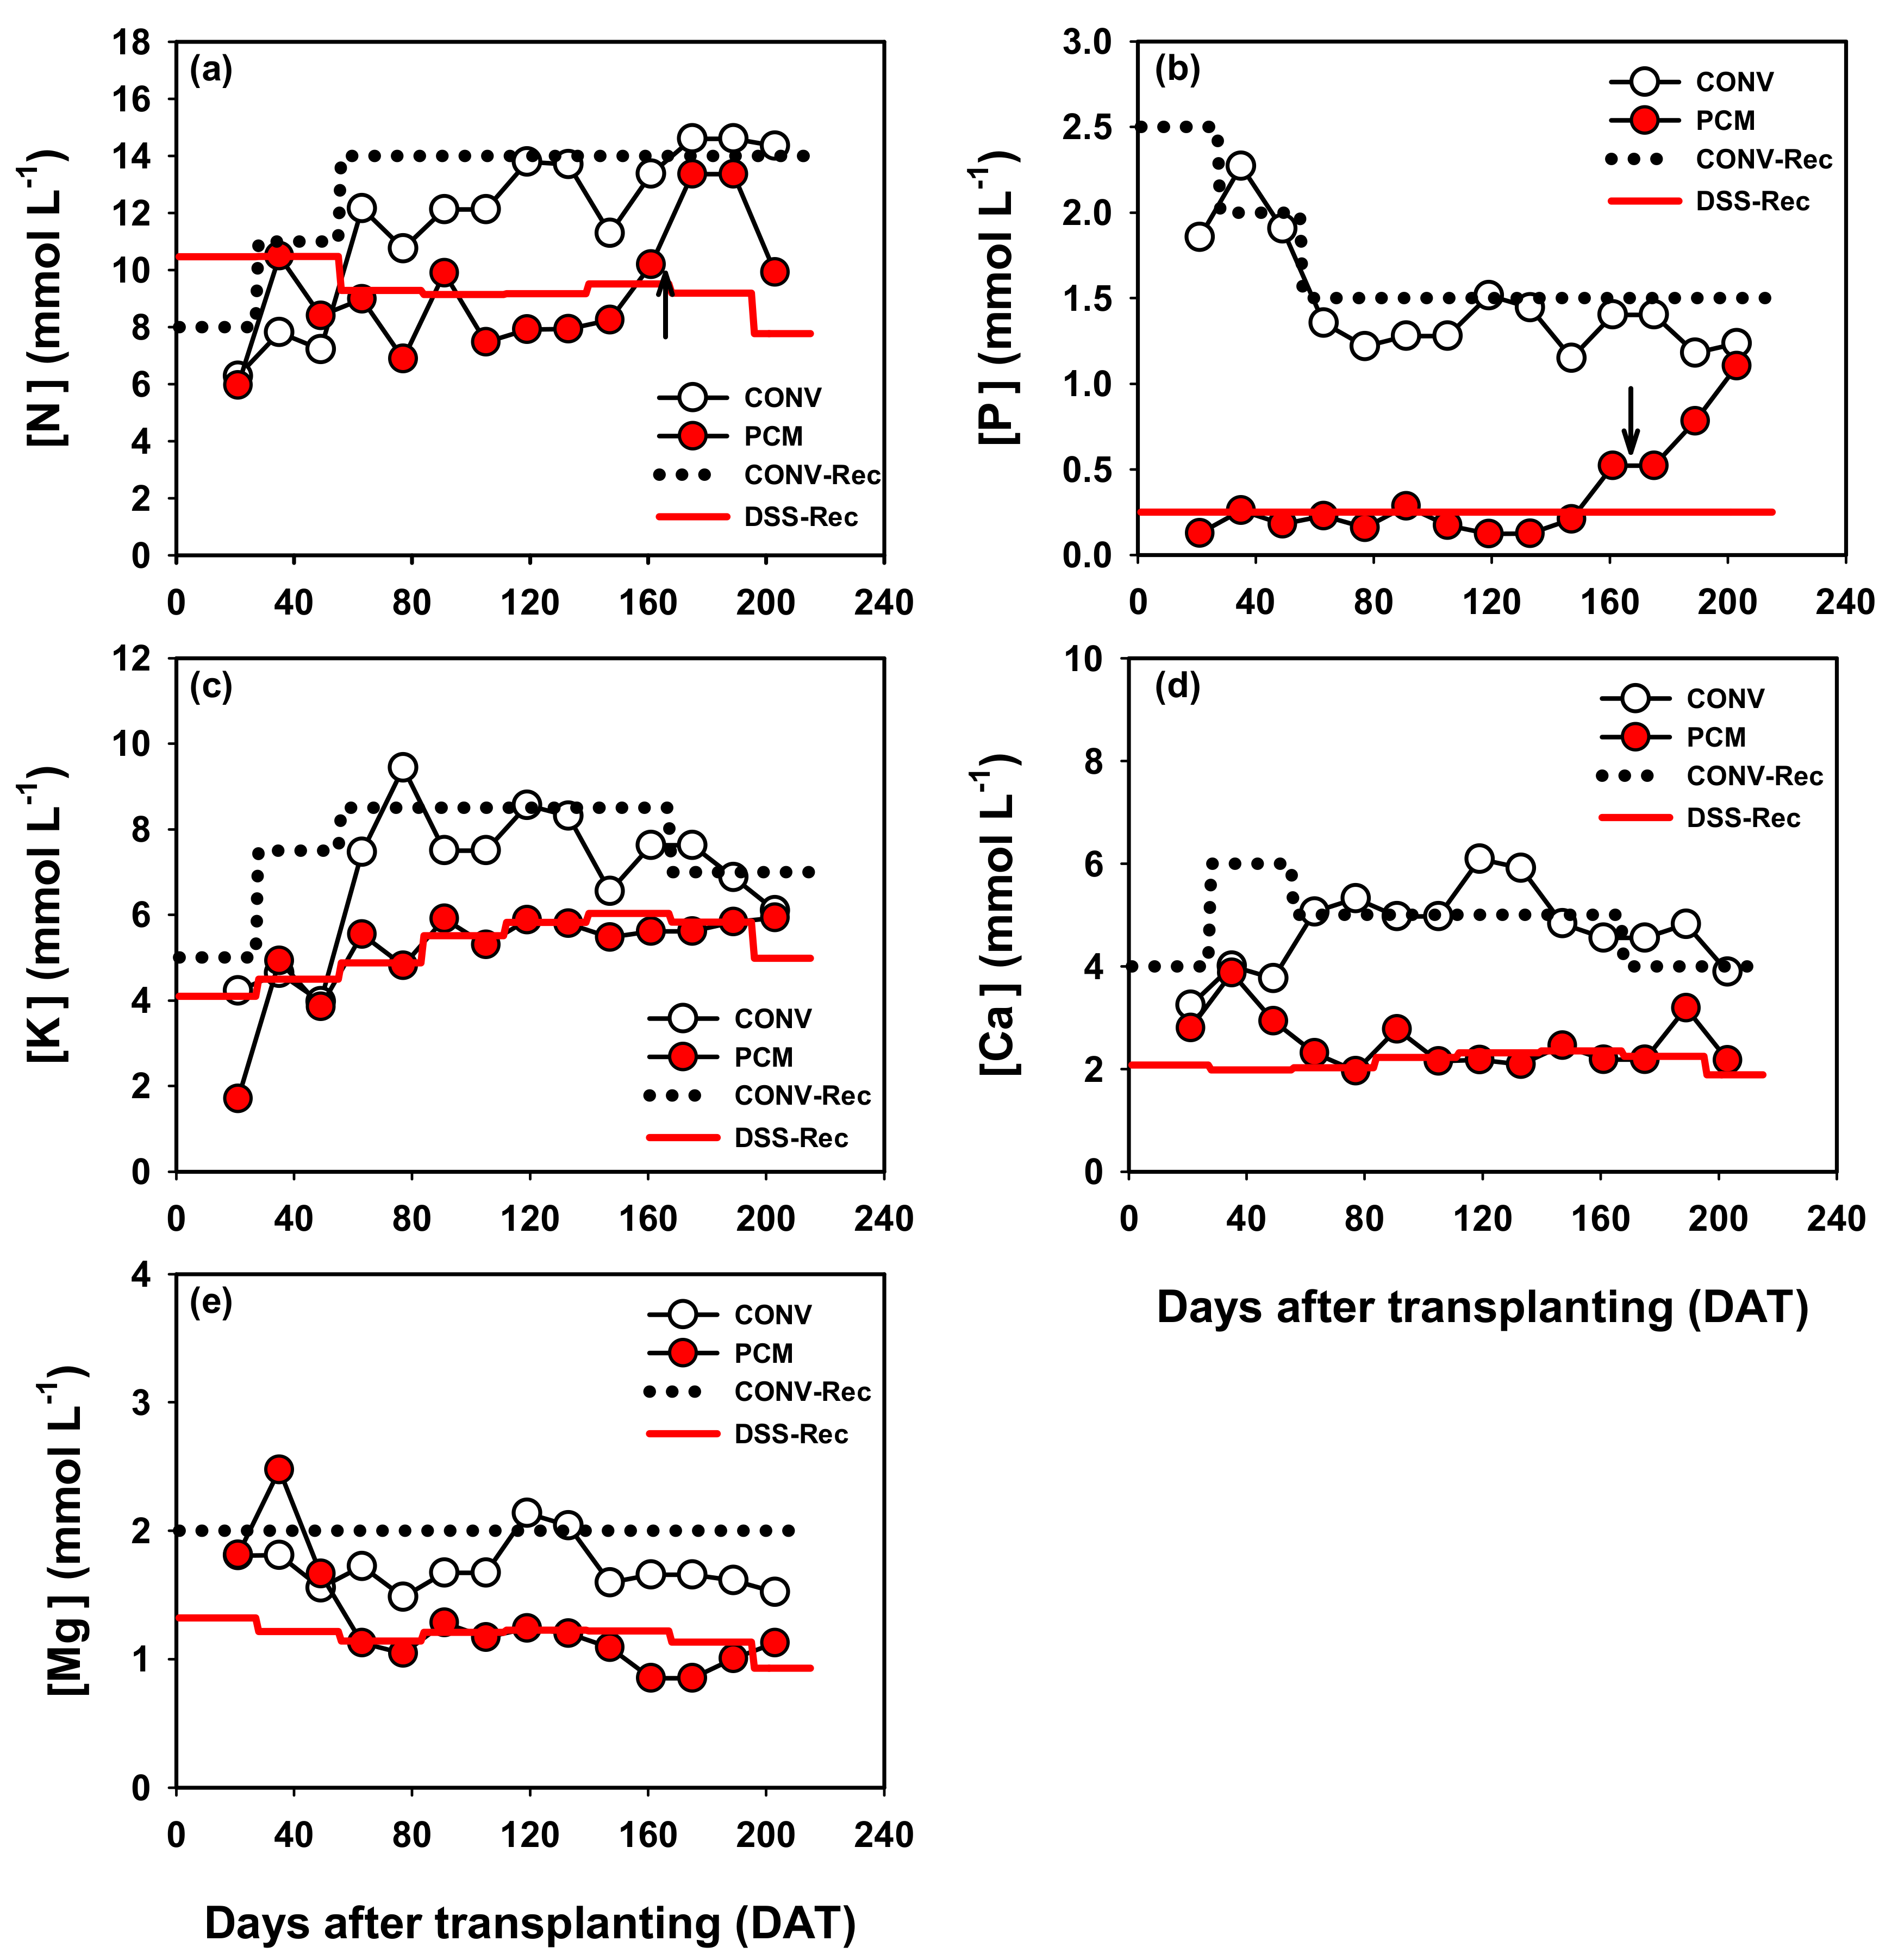
The seasonal evolution of the target and applied concentrations of the macronutrients N, P, K, Ca, and Mg in both the CONV and PCM treatments, for two-week periods, are presented in Figure 2. In general, for each nutrient in each treatment, there was a close agreement between the target and applied concentrations (Figure 2). The exceptions were some occasions when there were slight differences (e.g., during 30–60 DAT in the N, K, and Ca supply in the CONV treatment). At 160 and 164 DAT, corrective interventions were made in N and P, respectively (Figure 2a,b), increasing N from 10 to 13 mmol L−1 (30% increase) and P concentration from 0.52 to 1 mmol L−1 (92% increase).
Weekly data of the applied concentrations of N, K, and Ca, measured with the rapid analysis ISE meters, were used for management purposes. Compared to the two-weekly data, measured in the laboratory, the weekly data showed similar trends but with more fluctuation.
Average measured concentrations (of two-weekly laboratory measurements) in the applied nutrient solution for both treatments, throughout the crop, were very similar to the average target values (Table 2). The total amounts of N, P, and K applied in the PCM treatment were considerably lower than in the CONV treatment, being 60% of CONV for N and Mg, 57% for K, 42% for Ca, and 15% for P (Table 2). Applied P in the PCM treatment was very low because of the high levels of available P in the soil at transplanting (Table 1).

3.2. Monitoring of Plant Nutrient Status

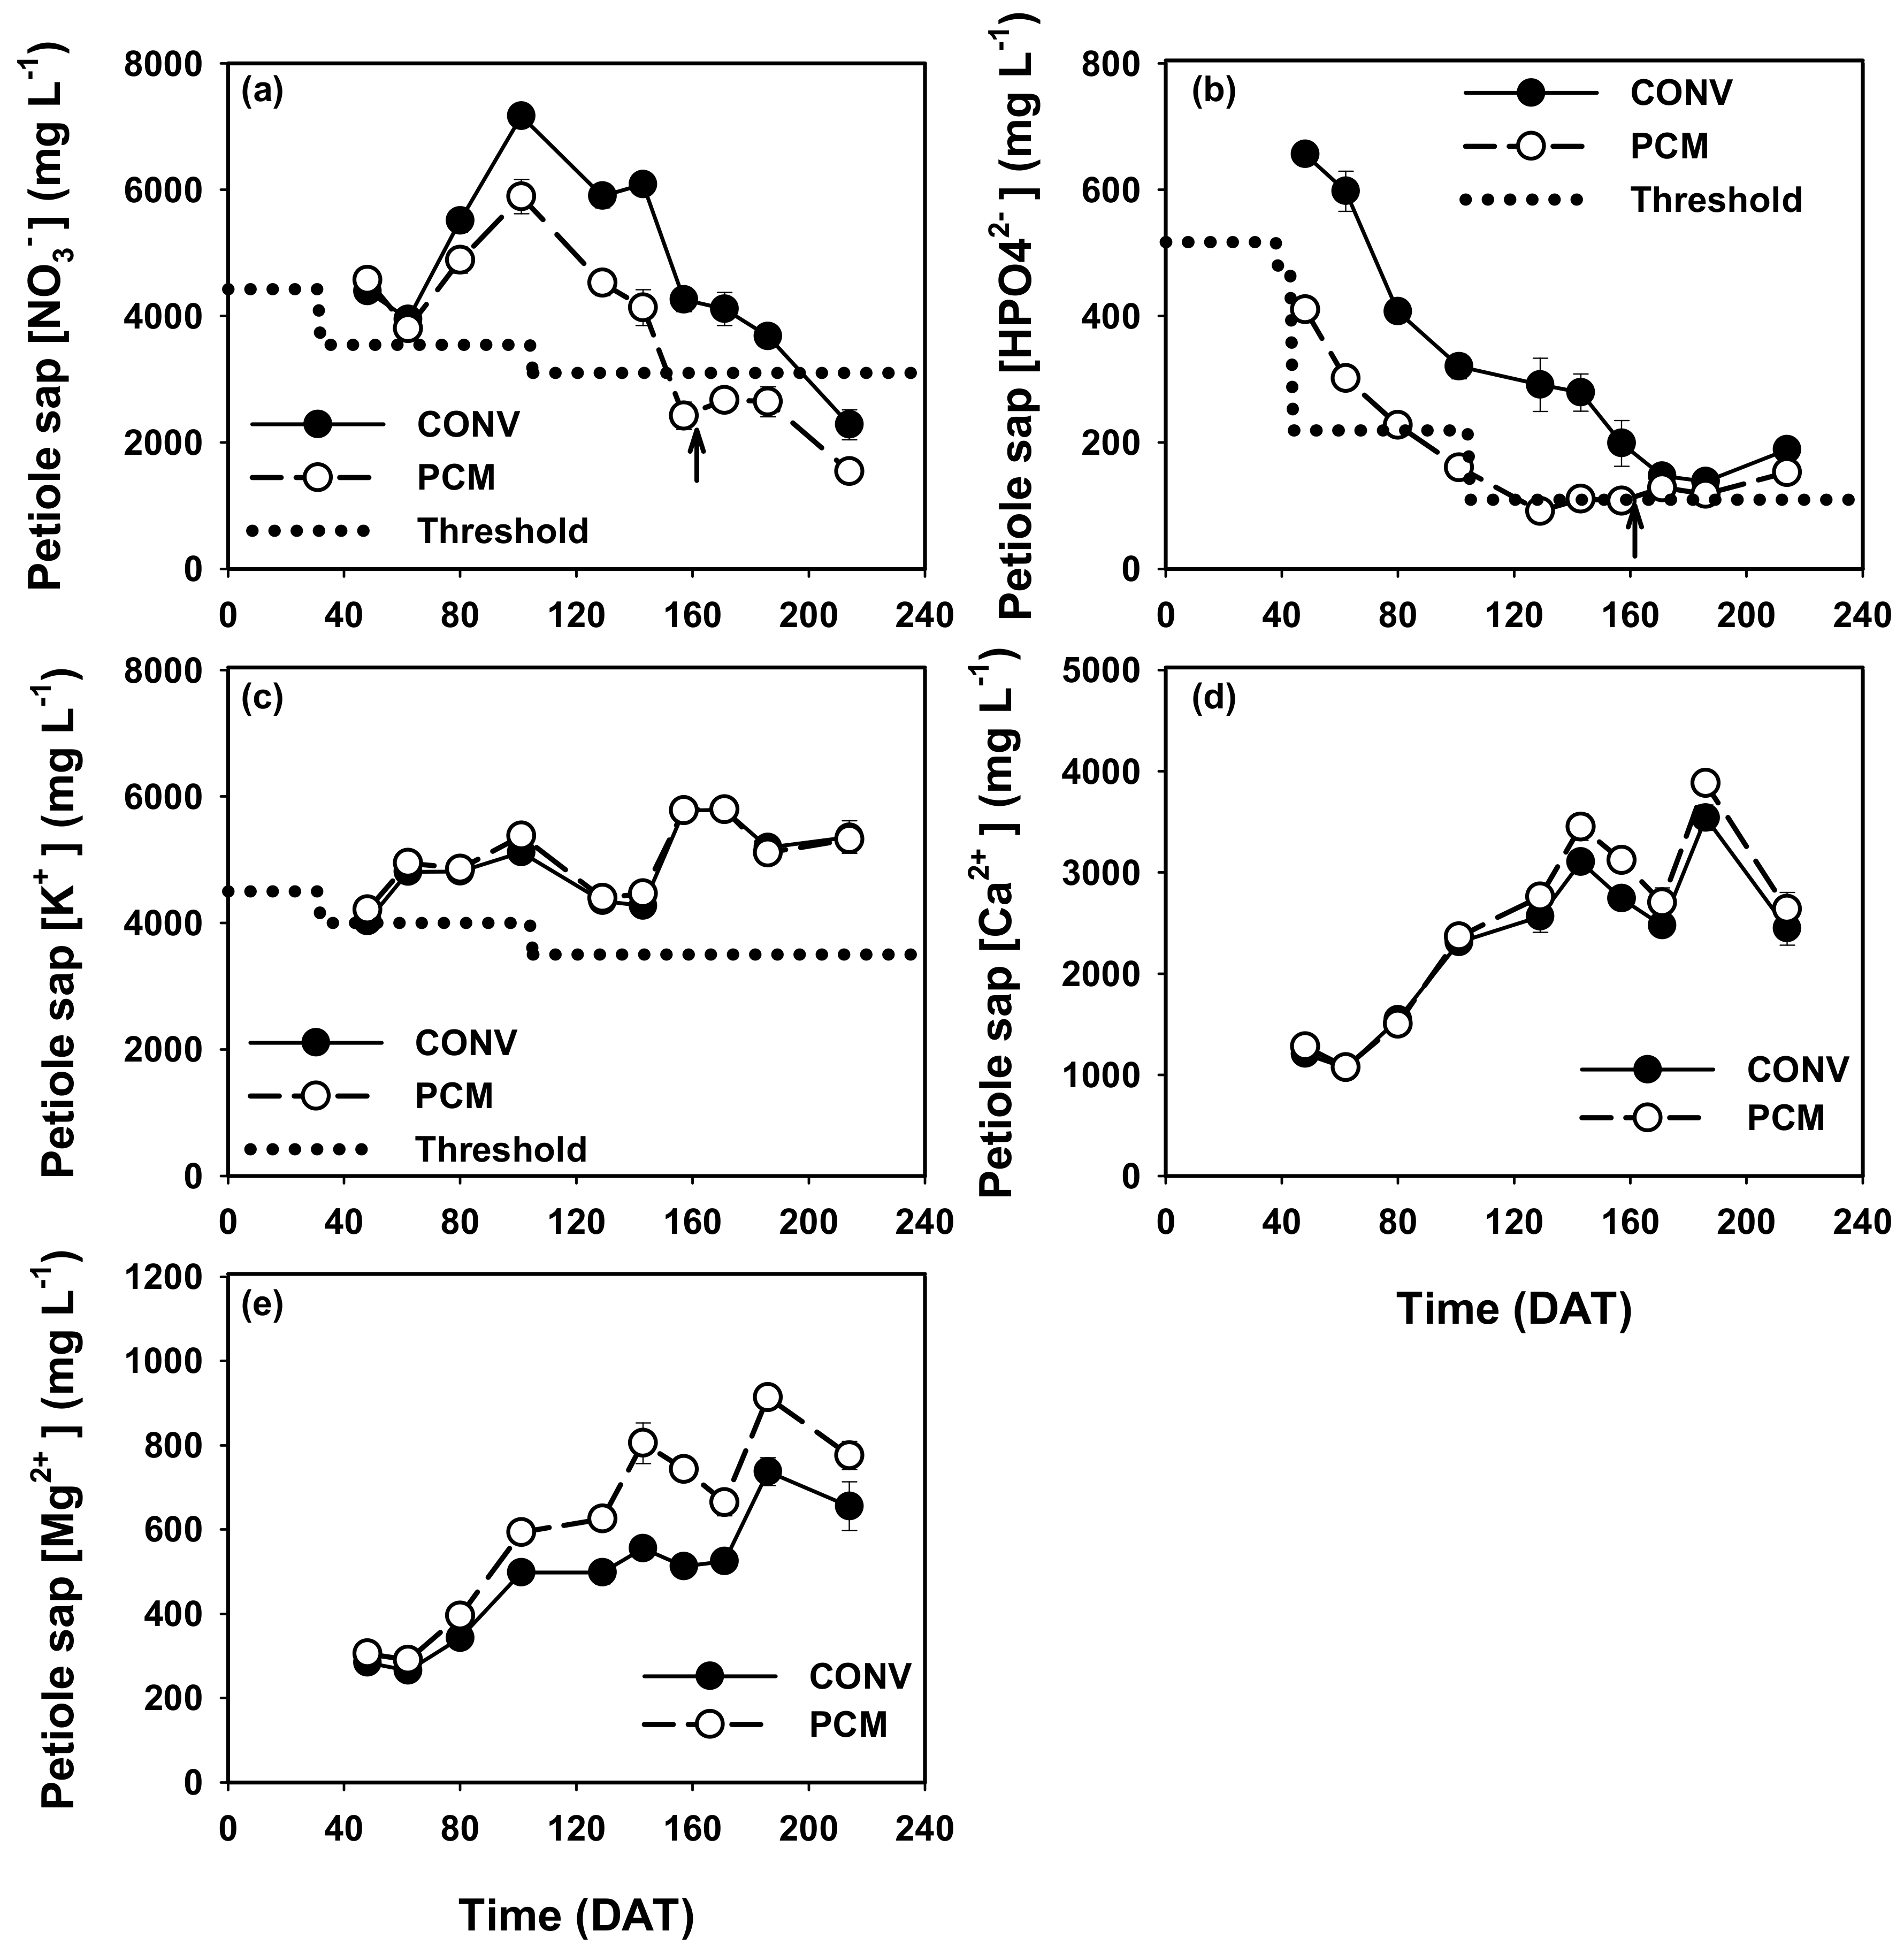
The seasonal dynamics of the nutrient concentrations in petiole sap showed consistently appreciable differences between the two treatments in the NO3 and HPO42− concentrations (Figure 3a,b). There were consistently lower values in the PCM treatment than in the CONV treatment for NO3 from 50 DAT onwards, and for HPO42− in all measurements (Figure 3a,b). These differences were smaller toward the end of the cycle. There were no differences between the two treatments in the concentrations of K+ in petiole sap (Figure 3c,d). The concentration of Mg2+ in petiole sap was either higher or slightly higher for Ca2+ in the PCM treatment than in the CONV treatment (Figure 3d,e). Based on the values of nutrient sap concentration in relation to the threshold values, corrective interventions (increases in the applied concentration) were made for N at 160 DAT, and for P at 164 DAT (Figure 3a,b). The intervention for P was somewhat late due to a delay in obtaining the laboratory results (Figure 3b). The average seasonal values of sap concentrations of NO3 and HPO42− in the PCM treatment were 22 and 44% less than the values in the CONV treatment, respectively (Table 3). In contrast, average seasonal values of the K+ concentration were similar in the two treatments, and were 8% and 25% higher in the PCM treatment than in the CONV treatment for Ca2+ and Mg2+, respectively (Table 3). According to the analysis of variance of seasonal average values of sap concentration, the differences between treatments were significant (p ≤ 0.05) for all of the nutrients examined, with the exception of K+ (Table 3). Comparisons between the concentrations of NO3, K+, and Ca2+ in petiole sap measured with the rapid analysis ISE meters compared to the laboratory analysis throughout the tomato crop for both treatments are presented subsequently (Section 3.4).
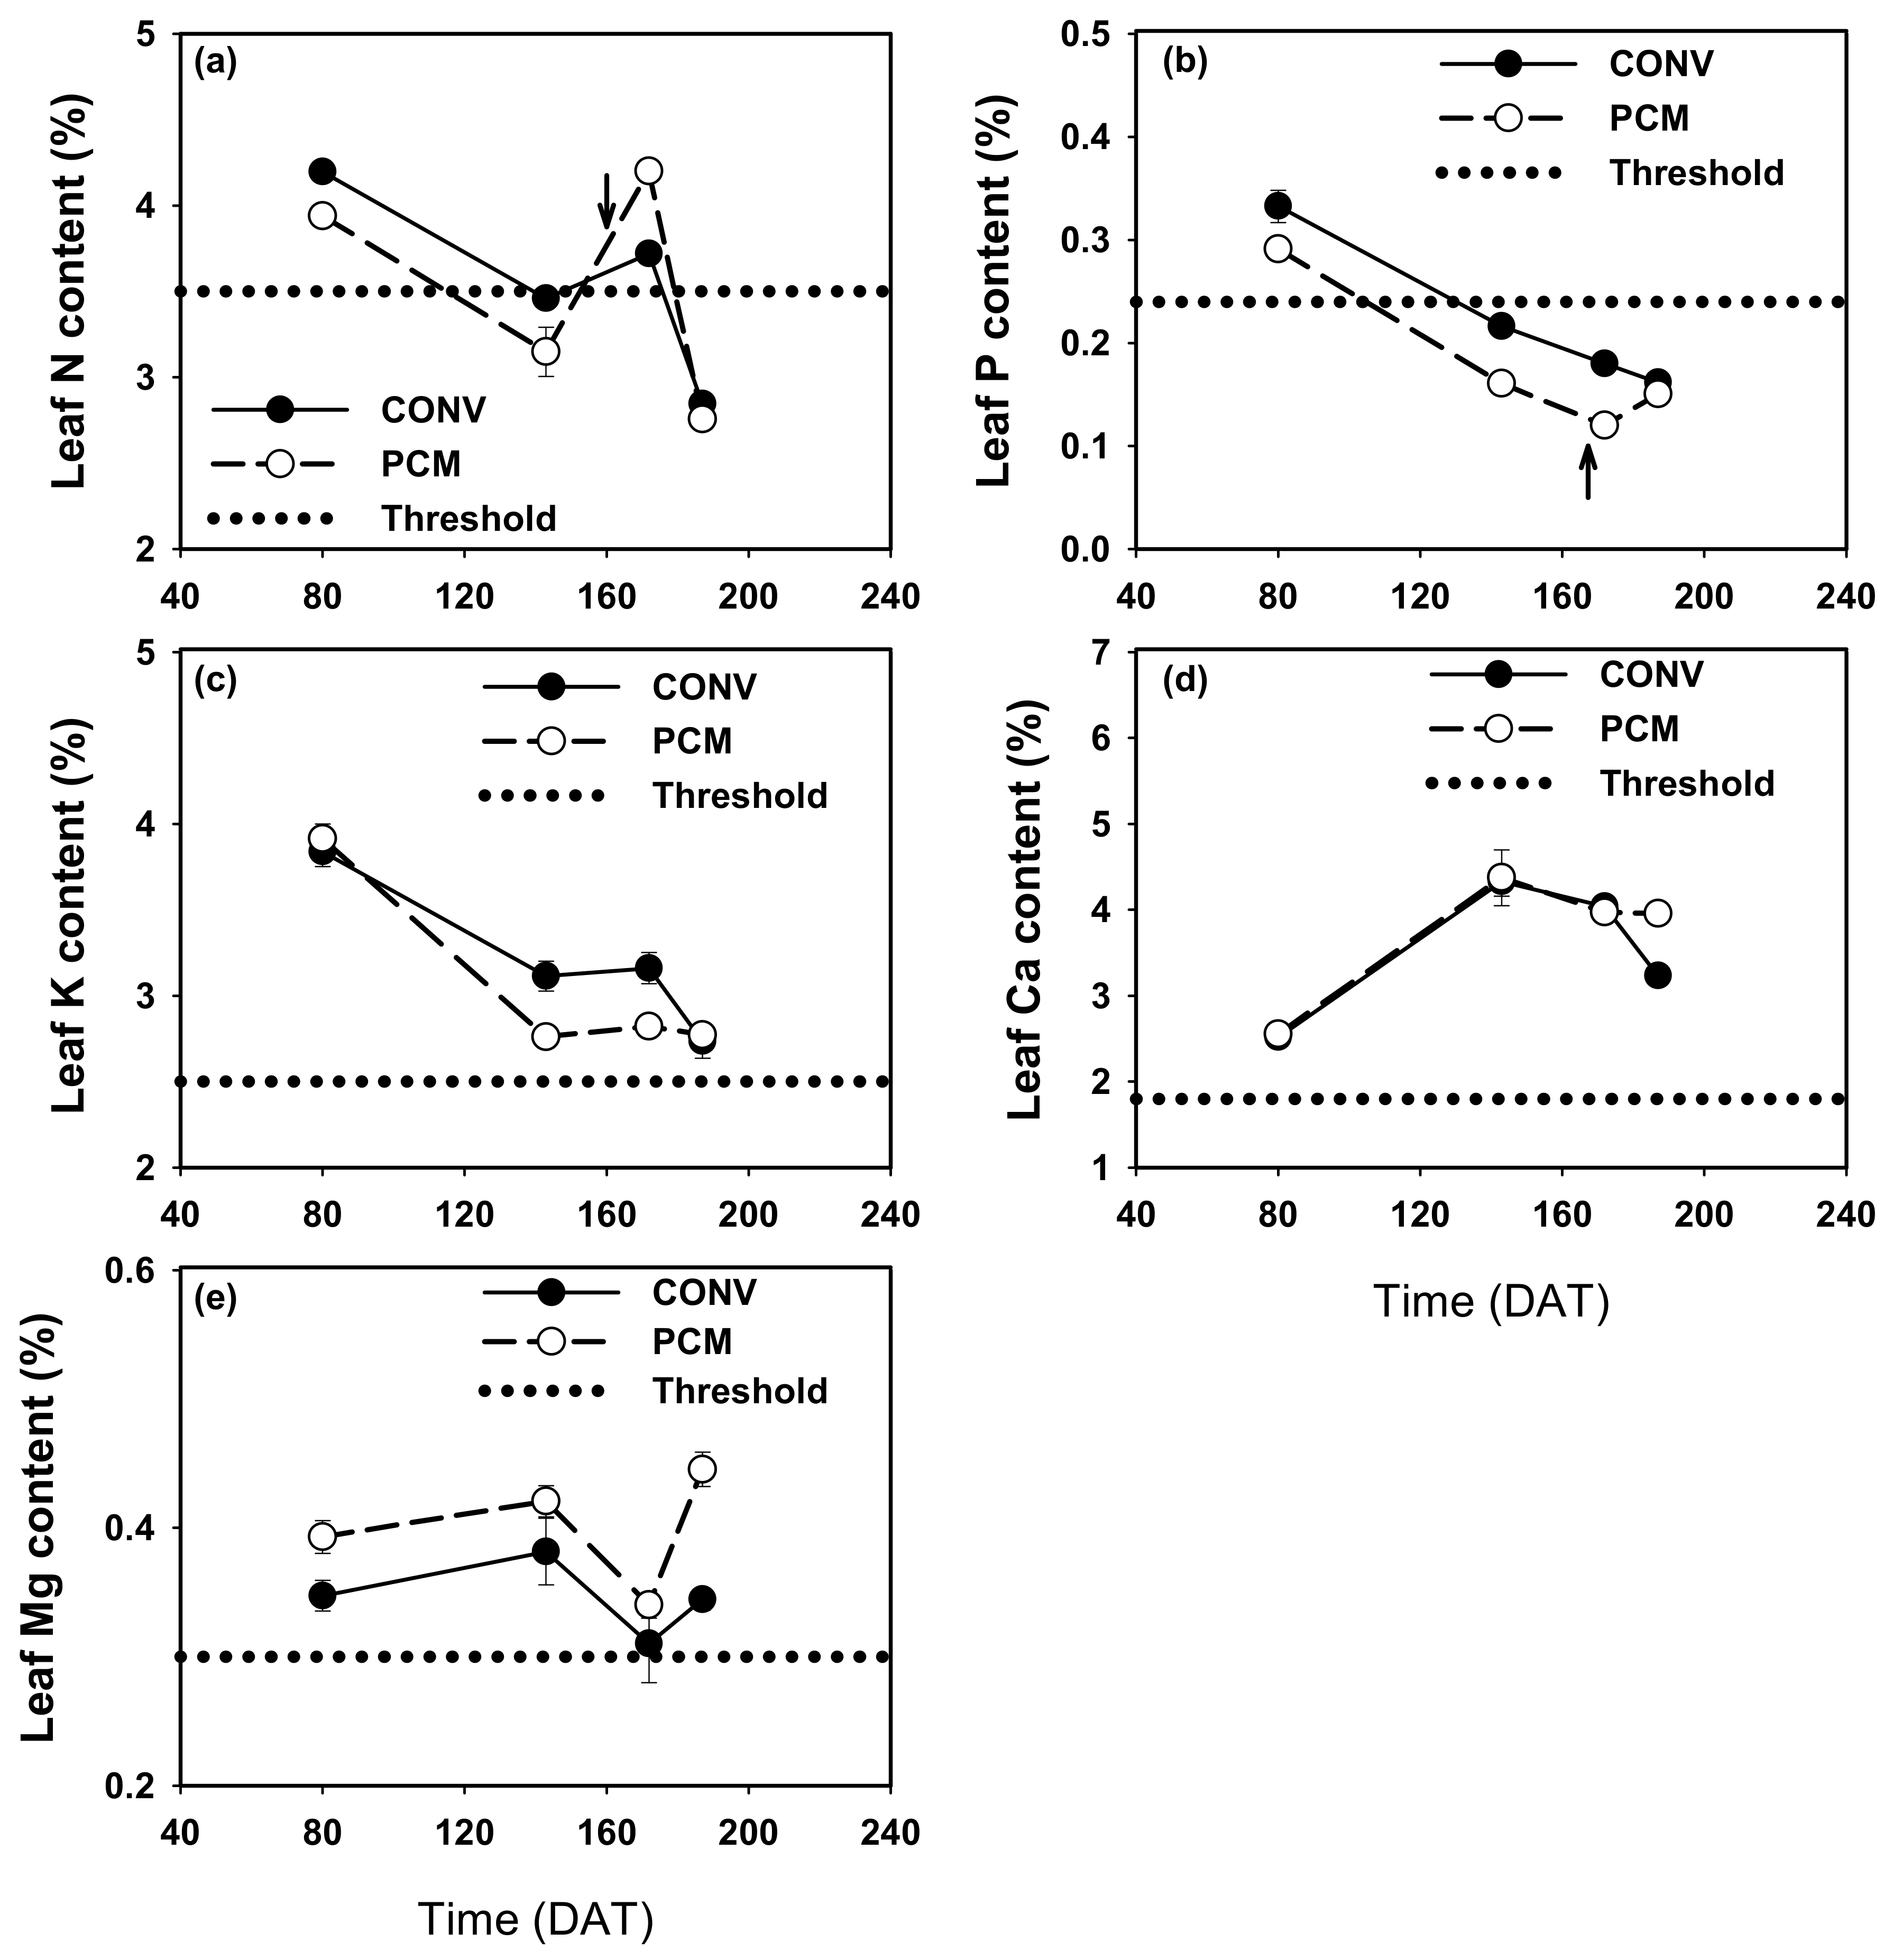
The results of analysis of total nutrient content in leaves were generally consistent with the petiole sap analysis in that the values were consistently lower for N and P in the PCM treatment than in the CONV treatment (Figure 4a,b). The exception was at 172 DAT, when a higher leaf N value was obtained in the PCM treatment. There were small differences between treatments in leaf K content (Figure 4c) and no differences between treatments in Ca (Figure 4d), as occurred with petiole sap (Figure 3d). Leaf Mg content was higher in the PCM treatment than in the CONV treatment (Figure 4e), as observed for petiole sap. The corrective interventions, of increasing the applied nutrient concentration, were perceptible in leaf N at the 172 DAT sampling (Figure 4a), and in leaf P at 187 DAT (Figure 4b). According to the threshold value, the leaf content of N was clearly less than the threshold value in the last measurement of both the PCM and CONV treatments (Figure 4a). The leaf content of P was lower than the threshold value for both treatments in the last three measurements (Figure 4b).

3.3. Monitoring of Soil Nutrient Supply

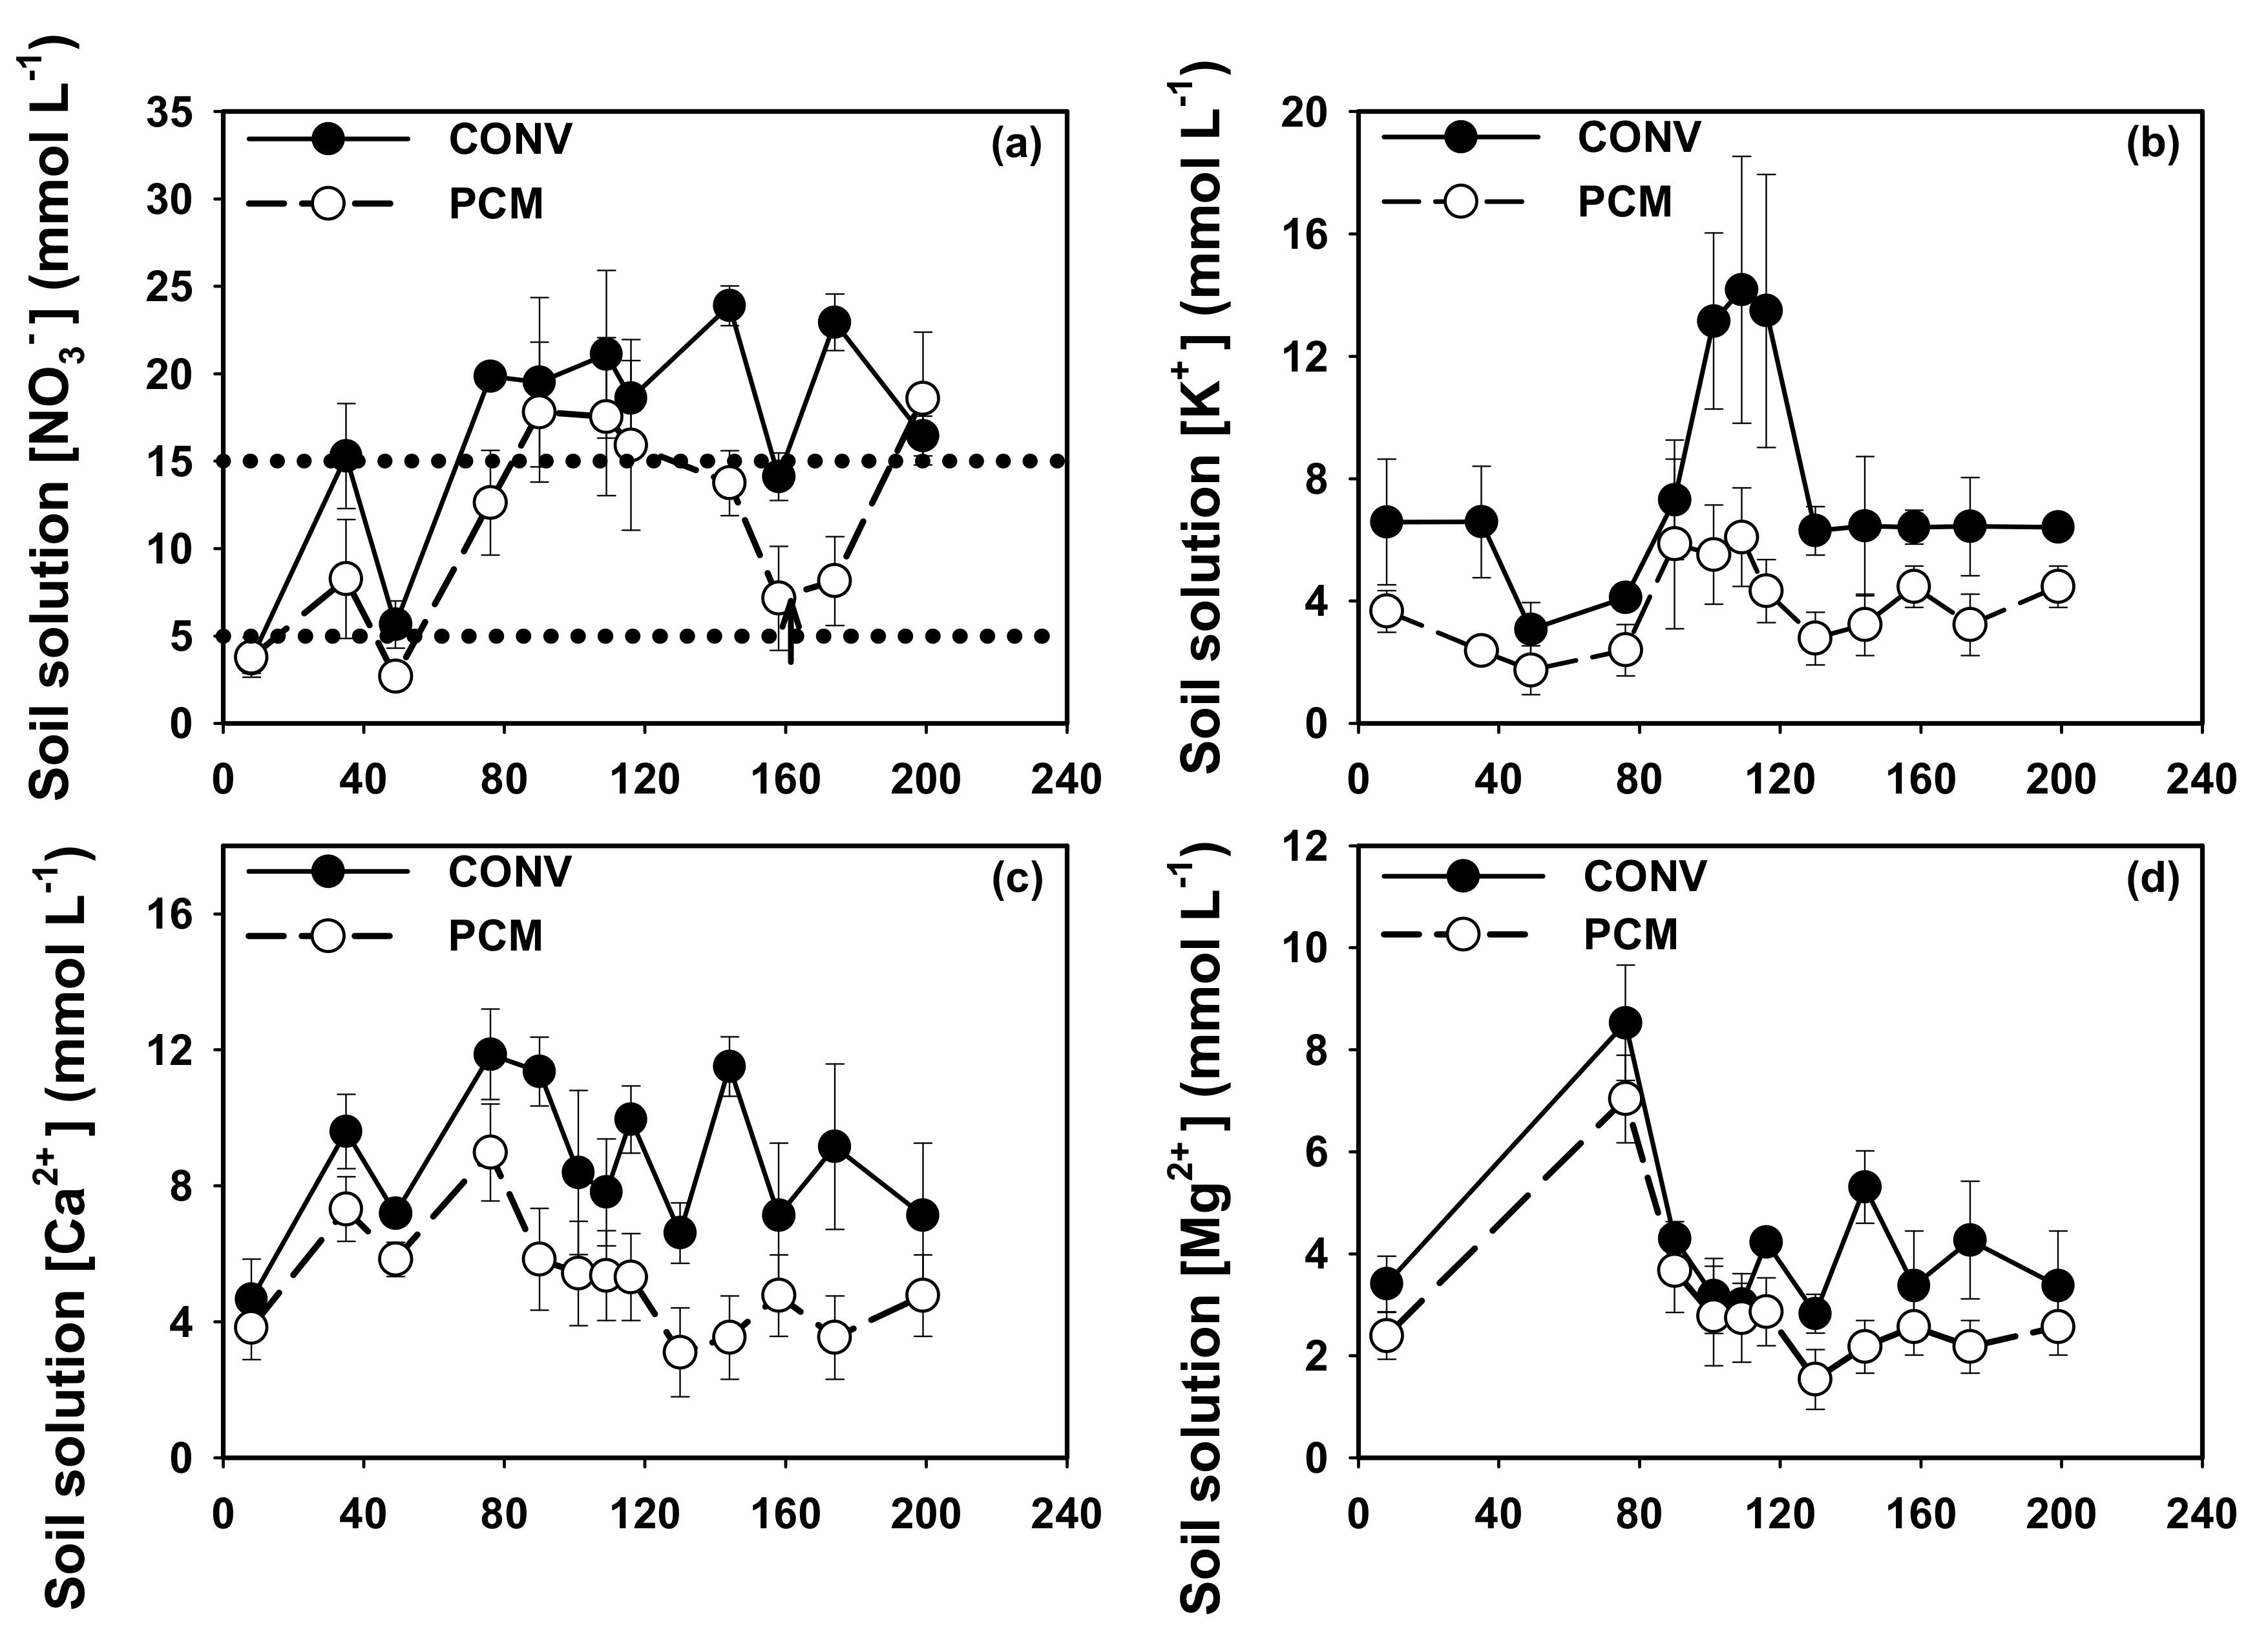
Figure 5 shows the seasonal dynamics of the nutrient contents in the soil solution. For all of the nutrients, their concentrations were consistently lower in the PCM treatment than in the CONV treatment (Figure 5). This is consistent with the differences in applied nutrient concentration between the two treatments (Figure 2). The NO3 concentration in the soil solution was 14–24 mmol L−1 in the CONV treatment, and 6–18 mmol L−1 in the PCM treatment (Figure 5a). The average values were 16.5 and 11.1 mmol L−1 for the CONV and PCM treatments, respectively (Table 3). The soil solution NO3 concentration in the PCM treatment increased at 160 DAT following the corrective application of N. The soil solution HPO42− concentrations were extremely low in both treatments; they were always somewhat higher in the CONV treatment than in the PCM treatment. The soil solution K+ concentration was 4–14 mmol L−1 in the CONV treatment and 2–6 mmol L−1 in the PCM treatment (Figure 5b); its average seasonal values were 8.0 and 3.9 mmol L−1 in the CONV and PCM treatments, respectively (Table 4). The soil solution Ca2+ concentration was 7–12 mmol L−1 for the CONV treatment and between 3 and 9 mmol L−1 for the PCM treatment, with average values of 8.7 and 5.4 mmol L−1 for the CONV and PCM treatments throughout the crop. The soil solution Mg concentration was consistently slighter lower in the PCM treatment compared to the CONV treatment. Compared to the CONV treatment, the average seasonal soil solution concentrations in the PCM treatment were 67% for NO3, 50% for K+, 62% for Ca2+, and 74% for Mg 2+; the differences between these treatments were very significant (p ≤ 0.01) for all of these nutrients (Table 3).
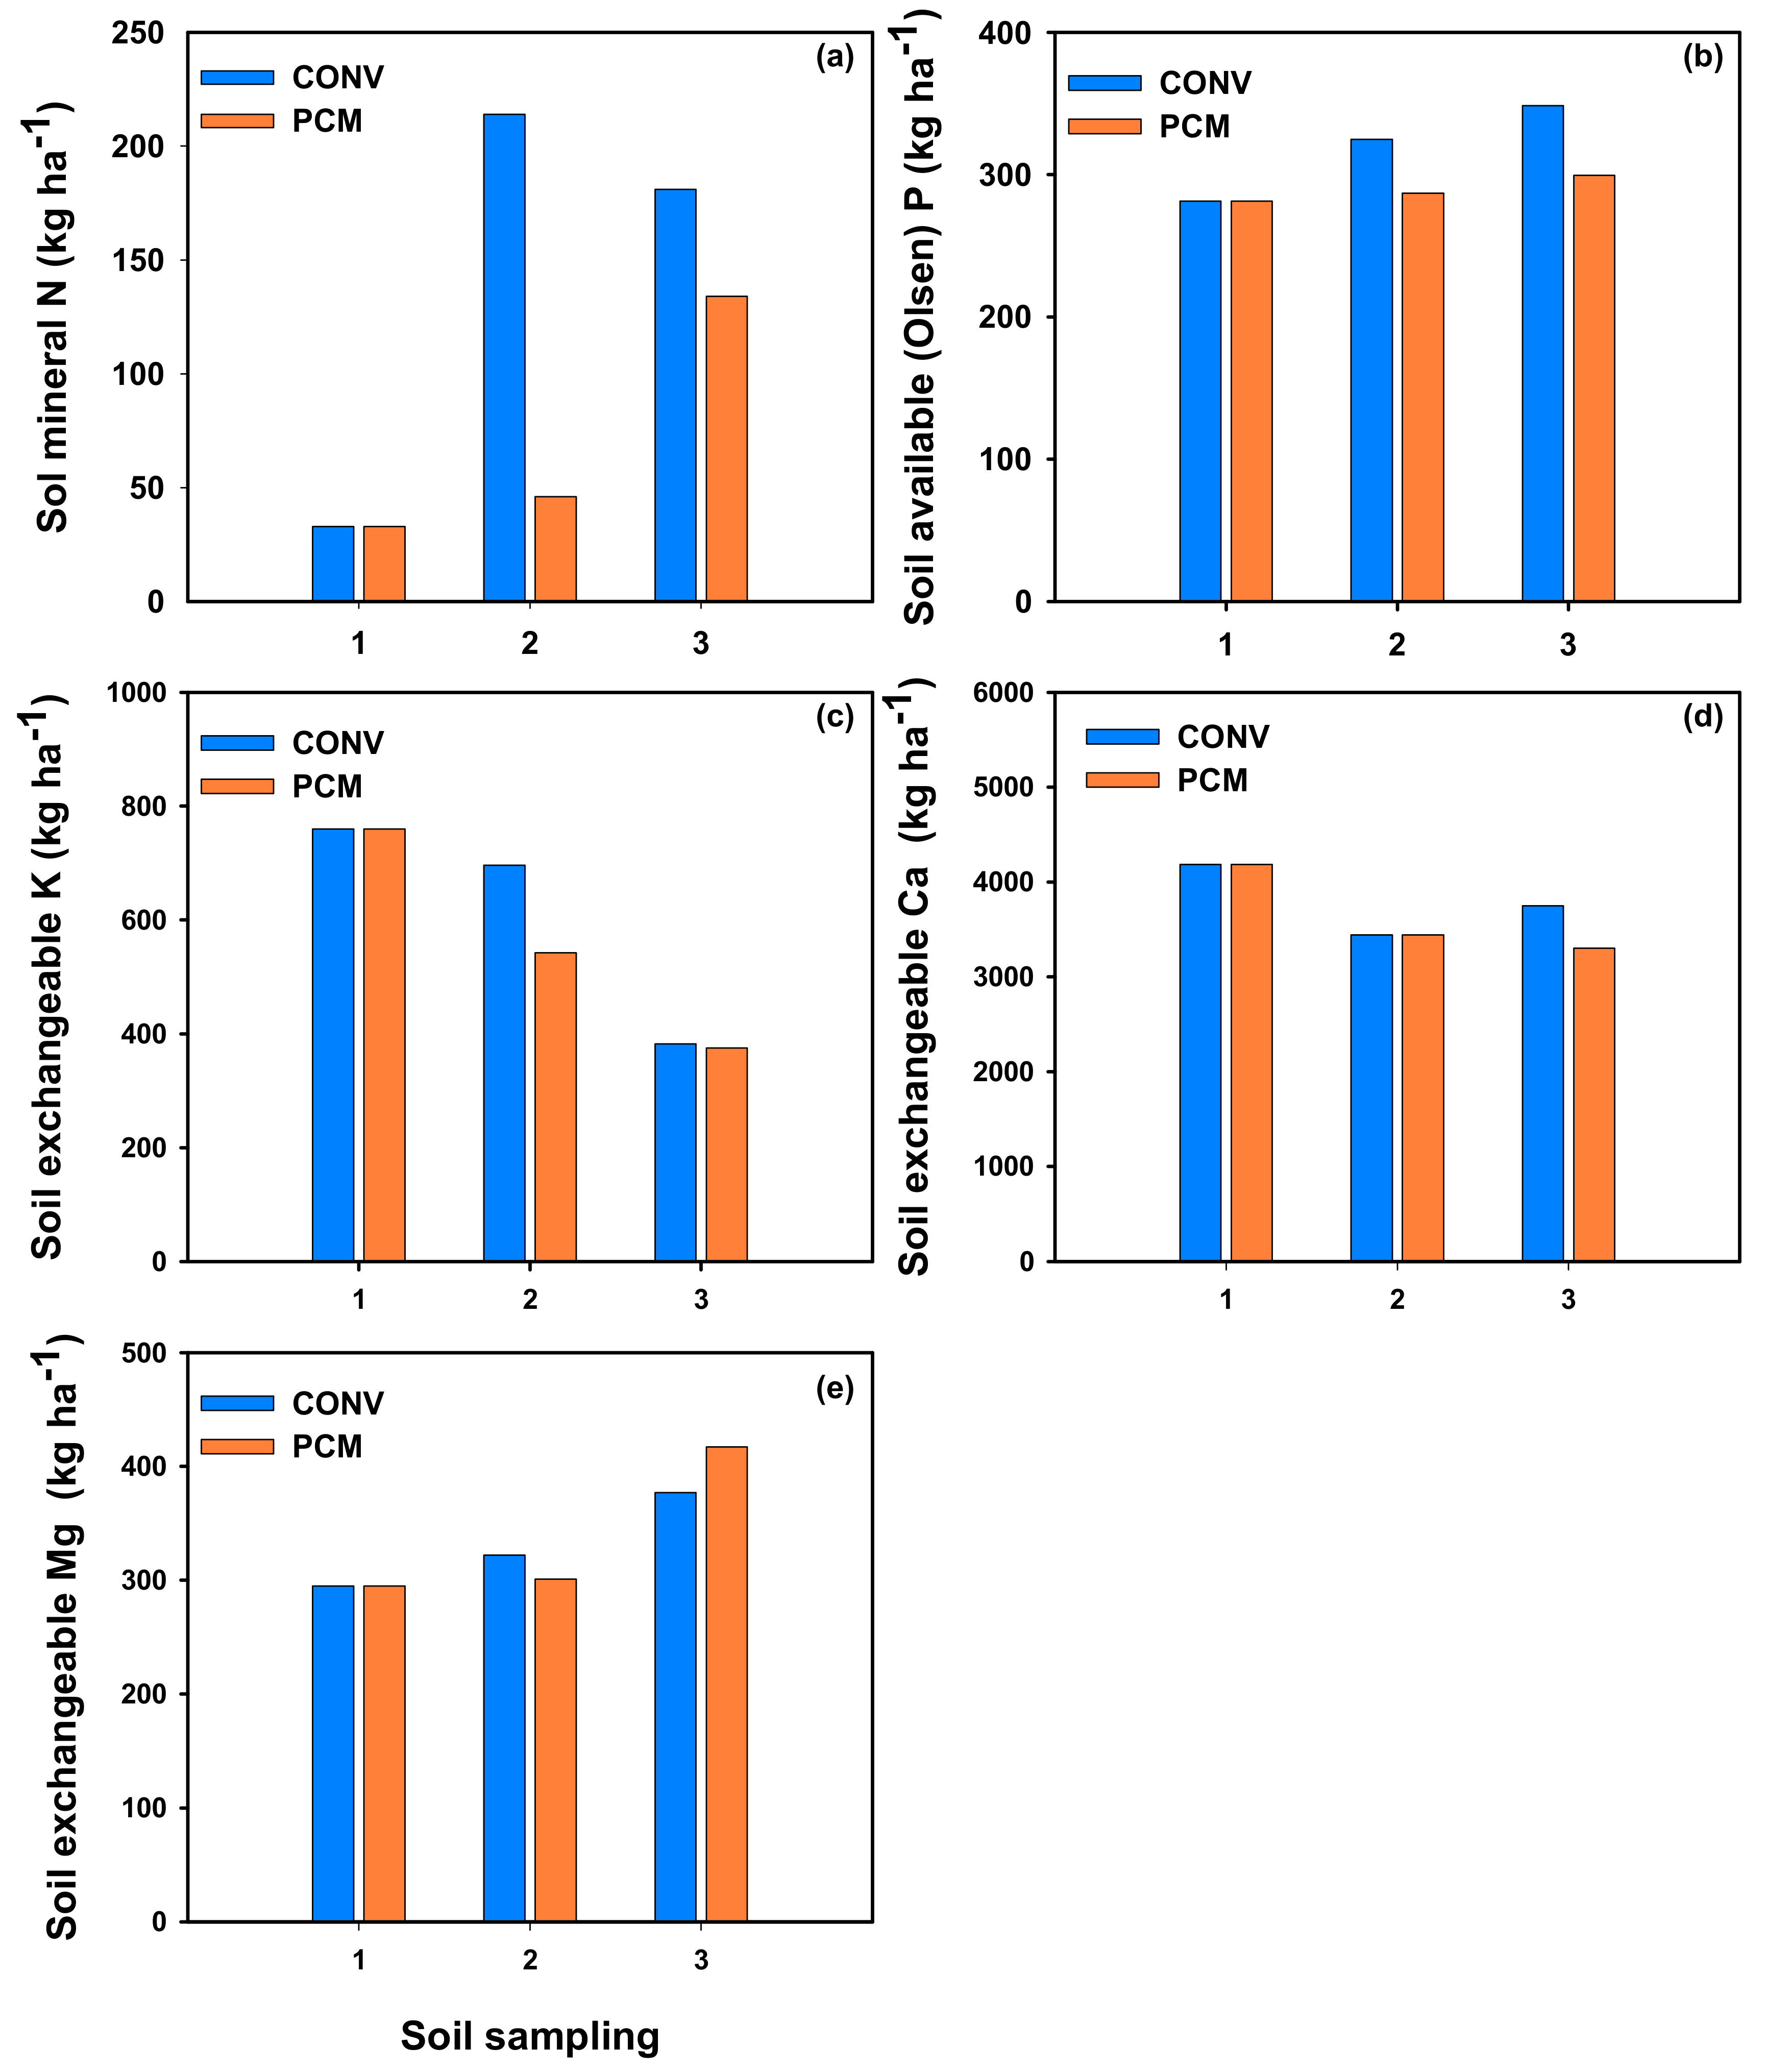
The results of analyses of crop-available forms of each macronutrient are presented in Figure 6 for soil samplings conducted at 45 days before transplanting and at 97 and 214 DAT. During the cropping season (samplings 2 and 3), soil mineral N was consistently lower in the PCM treatment than in the CONV treatment. At 97 DAT, soil mineral N in the PCM treatment was only 22% of the CONV treatment. At 214 DAT, the difference was 74%, possibly on account of the corrective N application to the PCM treatment between 97 and 214 DAT. Values of soil mineral N ranged from 33 kg N ha−1, prior to the crop, to a maximum of 214 kg N ha−1 at the 97 DAT soil sampling of the CONV treatment (Figure 6a). Available P was consistently lower in the PCM treatments during the crop (Figure 6b). Exchangeable K was lower in the PCM treatment at 97 DAT and was similar to the CONV treatment at 214 DAT (Figure 6c). Exchangeable Ca and Mg were very similar in both treatments in the three soil samplings (Figure 6d,e).

3.4. Comparison between Analytical Methods for Petiole Sap

The relationships between the concentrations of NO3, K+, and Ca2+ in petiole sap measured with the rapid analysis ISE systems to the concentrations determined with laboratory analytical systems, in both treatments throughout the crop, are presented in Figure 7. For both NO3 and K+, there was good and very good agreement, respectively, with slopes very close to one and high coefficient of determination (R2) values (Figure 7a,b). In contrast, the Ca2+ concentration was generally underestimated by the ISE system, with the underestimation progressively increasing at concentrations of > 1500 mg L−1 (Figure 7c).

3.5. Yield and Quality

There were no statistically significant differences at p < 0.05 between the two treatments in total and marketable yields, nor in fruit number and mean fruit weight (Table 4).
The results of the evaluation of both organoleptic (internal) and external quality for the CONV and PCM treatments are presented in Table 5. In relation to organoleptic quality, no significant differences at p < 0.05 were found between the two treatments in total soluble solids (TSSs), titratable acidity, and pH (Table 5). In relation to external quality, no significant differences at p < 0.05 were found between the two treatments in fruit firmness and in the indices of color of fruit epidermis expressed by the color coordinates of fruit lightness (L*), red–green axis (a*) and blue–yellow axis (b*), pitch angle (h), chroma (C*), and the color index (CI) (Table 5).

3.6. Economic Analysis

An economic analysis was conducted of the irrigation and fertilizer costs associated with each of the two fertigation management systems examined in this study. In relation to the CONV system, PCM irrigation management, using the VegSyst-DSS v2, resulted in a saving of irrigation water costs of 375 € ha−1, which was 24% less than with CONV management (Table 6). In relation to fertilizer costs, PCM management, involving the combined use of the VegSyst-DSS v2 and plant monitoring, resulted in fertilizer cost savings of 2016 € ha−1, which was 50% of the fertilizer cost of the CONV treatment (Table 6).
An estimation of the costs associated with the implementation of the prescriptive–corrective management system evaluated in this study is presented in Table 7. This is the estimated cost of using this PCM system for irrigation and fertilizer management for a 7-month cycle tomato crop, as in the current study. The cost of implementation (per ha) included the corrective management of nutrients for a commercial greenhouse, with less measurements than in the current experimental crop. The components of corrective management were: (1) soil analysis before cropping, (2) complete leaf analysis at mid-season, (3) monthly analysis of NO3 and K+ concentrations in petiole sap, including the operational costs of sampling, sap extraction, and measurement with the ISE rapid analysis system, and (4) the purchase costs of two ISE systems (for NO3 and K+) and of calibration standards. An amortization cost of the equipment over four years was assumed. It was assumed that the farm has tensiometers to assist with irrigation management, which is common in greenhouses in Almeria. The total annual cost of the PCM system was estimated to be 778 € ha−1 (Table 7). Considering the saving of 1998 € ha−1 in irrigation and fertilizer costs, the use of the PCM system resulted in savings of 1611 € ha−1 for a 7-month long greenhouse tomato crop.

4. Discussion

These results showed that the use of prescriptive–corrective fertigation management, based on the VegSyst-DSS v2, achieved considerable savings in water and nutrient (N, P, K, Ca, and Mg) inputs in the greenhouse tomato crop without compromising production. These savings represented an appreciable reduction in costs and in the likely environmental impact.
The prescriptive–corrective management of irrigation reduced water use by 25%. The weekly application of irrigation in the PCM treatment was very close to the weekly irrigation recommendations of the VegSyst-DSS v2. This agreement indicated that the theoretical recommendations of the DSS were adequate, and that corrective management with tensiometers to adjust irrigation volumes was generally not necessary. The exception was the latter part of the crop, when overcast and rainy weather notably reduced actual irrigation requirements in relation to the estimated requirements.
Similarly, the concentrations of N, P, K, Ca, and Mg applied in the nutrient solution closely followed the recommendations of the VegSyst-DSS v2. This indicated that the recommendations made by the DSS were adequate; the only notable exceptions were the corrective applications of N and P in the latter part of the crop. These corrective N and P applications may have been necessary, as the calibration parameters of the VegSyst model were from earlier work with non-grafted tomato varieties [10], whereas grafted varieties were used in the current crop. Subsequent work, conducted after the current study, has shown that modern grafted tomato varieties have larger nutrient requirements than non-grafted varieties, and consequently have different calibration parameters (M. Gallardo, unpublished data).
The prescriptive–corrective management of nutrients resulted in large reductions in the application of fertilizers. These reductions were consistent with the soil analysis, prior to cropping, which showed a very high level of available P, and medium levels of exchangeable K and Ca. These data show the importance of considering the available nutrients in soil in intensive greenhouse vegetable crops, where traditional nutrient management has not considered nutrients supplied by the soil. In this vegetable production system, consideration of soil mineral N at planting appreciably reduced the amount of applied N required for optimal N management compared to conventional farmer practice [36,37].
Our results are in agreement with earlier work, conducted with soil-grown greenhouse vegetable crops, where the prescriptive–corrective management of irrigation and N resulted in large reductions in the application of irrigation and N fertilizer [14,16]. In both of these studies, prescriptive–corrective management appreciably reduced NO3 leaching losses.
In the current study, the differences between the CONV and PCM treatments in nutrient supply were apparent in the plant and soil monitoring of N and P. Petiole sap concentrations of NO3 and HPO42− were appreciably smaller in the PCM treatment compared to the CONV treatment. However, similar differences were not observed for K+, Ca2+, and Mg2+ in petiole sap. The relative differences between treatments in leaf nutrient contents were consistent with those in petiole sap concentrations. A consistent anomalous result was that Mg was higher in the CONV treatment compared to the PCM treatment in both the petiole sap and leaf nutrient content. The ratio of the concentrations of Mg2+/(K+ + Ca2+) in the soil solution was higher in the PCM treatment compared to the CONV treatment, suggesting that strong competition between Mg2+ and the cations K+ and Ca2+ [38] may explain the higher uptake of Mg in the PCM treatment.
These results are consistent with those published by the authors of [39], in greenhouse tomato, who reported clear differences between treatments in petiole sap NO3 concentration, but not in sap K+ concentration. The available data (in the current study, and that published by the authors of [39]) suggest that petiole sap K concentration may be relatively insensitive to differences in nutrient treatments.
The comparison of results from the ISE rapid analysis systems to those from the laboratory analytical system demonstrated that the ISE systems provide a good approximation of the concentrations of NO3 and K+ in petiole sap. However, there were appreciable errors associated with Ca2+ measurements with the ISE system. These results agree with those published by the authors of [24], who reported a strong relationship between the ISE and laboratory measurements for NO3 in diluted petiole sap, and also in nutrient solution and soil solution. The authors of [40] reported good relationships between the two analytical methods in the soil solution for NO3, K+, and Na+, while Ca2+ was overestimated with the ISE method. The available results suggest that the ISE system used can measure NO3 and K+ in diluted petiole sap with sufficient accuracy to effectively guide on-farm decision making. The effective use of rapid analysis ISE systems requires that measurement protocols be strictly followed, and that the effects of sample temperature on the results be minimized [25].
There were consistently higher values in the conventional treatment in the soil solution concentrations of N, P, Ca, and Mg. For N, the NO3 concentration was generally within the limits established by the authors of [34] for the greenhouse sweet pepper. For the tomato crop, the limits are likely to be very similar. We agree with the authors of [35] in that soil solution [NO3] is an effective method to monitor immediately available soil N for greenhouse vegetable crops.
Petiole sap, leaf nutrient content, and soil solution were effective indicators for the corrective management of N and P. Similarly, findings reported by the authors of [22,34] in sweet pepper and by the authors of [23] in tomato showed that plant indicators and soil solution were sensitive to changes in crop N supply. Analysis of available soil nutrients, during the crop, provided mixed results. Differences in soil mineral N between management treatments were consistent with differences in applied N. However, this was not the case for the other nutrients examined. These results suggest that measures of soil-available nutrients, during a crop, may be a less sensitive indicator of immediately available soil nutrient status than the soil solution nutrient concentration.
The reduced applications of irrigation and nutrients did not affect total or marketable yield, and there were no differences between treatments in yield components. The analysis of internal and external quality also showed no differences between treatments.
The economic analysis conducted showed that the implementation of prescriptive–corrective management based on the VegSyst-DSS v2 tool in combination with plant monitoring resulted in a saving of 24% in the cost of water and of 50% in the cost of fertilizer. The irrigation and fertilizer recommendation system evaluated is compatible with the use of standard fertigation systems commonly used in greenhouses in Almeria. The transfer of this management system to users will require prior training in the use of the VegSyst-DSS v2 and in the methodology of soil solution and sap sampling, and the use of the ISE rapid analysis systems. It is anticipated that the prescriptive–corrective management system will be used by technical advisors rather than directly by farmers. Using the VegSyst-DSS v2, the advisors would prepare plans of irrigation and nutrient recommendations using an initial soil analysis. It is anticipated that they would also conduct plant and/or soil solution sampling, analysis, and data interpretation. The current study has demonstrated the value and practicality of the prescriptive–corrective management of irrigation and various macronutrients in a soil-grown tomato crop grown in a plastic greenhouse in SE Spain.
The VegSyst-DSS v2 used in this study offers a substantial improvement over its previous version, the VegSyst-DSS v1 [10], as it provides recommendations for N, P, K, Ca, and Mg, whereas v1 only provided recommendations for N. Recently, the software VegSyst-DSS Suite has been developed to provide recommendations of irrigation and nutrient requirements for greenhouses (following the VegSyst-DSS v2) and open-air vegetable crops [41]. It is available as a web-based or mobile phone application (both Android and iOS).
Directions for future research are evaluating the VegSyst-DSS-based PCM management package with other vegetable species, and further evaluation with tomato crops including different type of tomato, e.g., cherry tomato. Evaluation of its use by commercial farmers is required to ensure that the input requirements are reasonable, and that the nature and format of the output are useful for practical farm application. Successful on-farm demonstration will be essential to convince appreciable numbers of advisors and farmers to use the VegSyst-DSS. Like all software programs, it is anticipated that there will be ongoing improvements of the algorithms and interface of the VegSyst-DSS as more information and technological developments become available.

5. Conclusions

The prescriptive–corrective management (PCM) of irrigation and fertilization (N, P, K, Ca, and Mg), using recommendations of the VegSyst-DSS v2 combined with tensiometers and in situ analysis of nutrients in petioles sap, was evaluated in soil-grown tomatoes in a plastic greenhouse in SE Spain. The PCM was compared with conventional management (CONV). In relation to CONV management, PCM reduced irrigation by 25%, N and K by 40%, Ca by 58%, and P by 85%. There were no significant differences between the PCM and CONV treatments in fruit production and quality. These results show that, under the conditions of this study, prescriptive–corrective fertigation management, based on the VegSyst-DSS v2, can achieve appreciable savings in water and nutrient (N, P, K, Ca, and Mg) inputs in greenhouse tomato without compromising production, which represents a significant reduction in costs and environmental impact. An economic analysis indicated that in this 7-month tomato crop, PCM, compared to CONV management, was associated with a financial saving of 1611 € ha−1.

Author Contributions

Conceptualization, M.G. and R.B.T.; methodology, M.G. and M.T.P.-F.; software, M.G.; validation, M.T.P.-F. and M.G.; formal analysis, M.G.; investigation, M.G., M.T.P.-F., J.C. and R.B.T.; resources, M.G. and M.T.P.-F.; data curation, M.G. and M.T.P.-F.; writing—original draft preparation, M.G.; writing—review and editing, M.G. and R.B.T.; visualization, M.G.; supervision, M.G.; project administration, M.G.; funding acquisition, M.G., R.B.T. and F.M.P. All authors have read and agreed to the published version of the manuscript.

Funding

This research was funded by the program agroMIS (agroalimentario moderno–innovador–sostenible) of the Campus de Excelencia Internacional Agroalimentario (ceiA3) that was financed by FEADER (European Agricultural Fund for Rural Development) and the Junta de Andalucía (Consejería de Agricultura Pesca y Desarrollo Rural).

Data Availability Statement

Data available on request.

Conflicts of Interest

The authors declare no conflict of interest.

References

  1. Cajamar. Análisis de la campaña hortofrutícola de Almería. Campaña 2021/2022. Available online: https://publicacionescajamar.es/series-tematicas/informes-coyuntura-analisis-de-campana/analisis-de-la-campana-hortofruticola-de-almeria-campana-2021-2022 (accessed on 4 May 2023).
  2. García, M.C.; Céspedes, A.J.; Pérez-Parra, J.J.; Lorenzo, P. El Sistema de Producción Hortícola Protegido de la Provincia de Almería; IFAPA: Almeria, Spain, 2016; p. 180. [Google Scholar]
  3. Downward, S.R.; Taylor, R. An assessment of Spain’s Programa AGUA and its implications for sustainable water management in the province of Almería, southeast Spain. J. Environ. Manag. 2007, 82, 277–289. [Google Scholar] [CrossRef]
  4. Pulido-Bosch, A.; Rigol-Sanchez, J.P.; Vallejos, A.; Andreu, J.M.; Ceron, J.C.; Molina-Sánchez, L.; Sola, F. Impacts of agricultural irrigation on groundwater salinity. Environ. Earth Sci. 2018, 77, 197. [Google Scholar] [CrossRef]
  5. Gil de Carrasco, C. Caracterización Fisicoquímica y Evaluación del Estado General de los Suelos en los Invernaderos del Poniente Almeriense; FIAPA Report Nª 13; FIAPA: Almería, Spain, 2000. (In Spanish) [Google Scholar]
  6. Anonymous. Council Directive 91/676/EEC concerning the protection of waters against pollution caused by nitrates from agricultural sources. O. J. Eur. Commun. 1991, 375, 1–8. [Google Scholar]
  7. BOJA. Orden de 23 de Noviembre de 2020, por la Que se Aprueba la Modificación de las Zonas Vulnerables Definidas en el Decreto 36/2008, de 5 de Febrero, por el Que se Designan las Zonas Vulnerables y se Establecen Medidas Contra la Contaminación por Nitratos de Origen Agrario, al Amparo de su Disposición Adicional Primera. Boletín Oficial de la Junta de Andalucía. N°232, 19–40. 2020. Available online: https://www.juntadeandalucia.es/boja/2020/232/BOJA20-232-00022-14825-01_00182062.pdf (accessed on 4 May 2023).
  8. BOJA. Orden de 23 de Octubre de 2020, por la Que se Modifica la Orden de 1 de Junio de 2015, por la Que se Aprueba el Programa de Actuación Aplicable en las Zonas Vulnerables a la Contaminación por Nitratos Procedentes de Fuentes Agrarias Designadas en Andalucía. Boletín Oficial de la Junta de Andalucía. N°214. 24–42. 2020. Available online: https://www.juntadeandalucia.es/boja/2020/214/BOJA20-214-00019-13098-01_00180369.pdf (accessed on 4 May 2023).
  9. BOE. Real Decreto 1051/2022 de 27 de Diciembre, por el Que se Establecen Normas Para la Nutrición Sostenible en los Suelos Agrarios. Boletín Oficial del Estado. N°312. p. 42. Available online: https://www.boe.es/diario_boe/txt.php?id=BOE-A-2022-23052 (accessed on 4 May 2023). (In Spanish).
  10. Gallardo, M.; Thompson, R.B.; Giménez, C.; Padilla, F.M.; Stöckle, C.O. Prototype decision support system based on the VegSyst simulation model to calculate crop N and water requirements for tomato under plastic cover. Irrig. Sci. 2014, 32, 237–253. [Google Scholar] [CrossRef]
  11. Gallardo, M.; Fernández, M.D.; Giménez, C.; Padilla, F.M.; Thompson, R.B. Revised VegSyst model to calculate dry matter production, critical N uptake and ETc of several vegetable species grown in Mediterranean greenhouses. Agric. Syst. 2016, 146, 30–43. [Google Scholar] [CrossRef]
  12. Gallardo, M.; Peña-Fleitas, M.T.; Giménez, C.; Padilla, F.M.; Thompson, R.B. Adaptation of VegSyst-DSS for macronutrient recommendations of fertigated, soil-grown, greenhouse vegetable crops. Agric. Water Manag. 2023, 278, 107973. [Google Scholar] [CrossRef]
  13. Thompson, R.B.; Tremblay, N.; Fink, M.; Gallardo, M.; Padilla, F.M. Tools and Strategies for Sustainable Nitrogen Fertilisation of Vegetable Crops. In Advances in Research on Fertilization Management of Vegetable Crops; Tei, F., Nicola, S., Benincasa, P., Eds.; Springer: Heidelberg, Germany, 2017; pp. 11–63. [Google Scholar]
  14. Granados, M.R.; Thompson, R.B.; Fernández, M.D.; Martı́nez-Gaitán, C.; Gallardo, M. Prescriptive–corrective nitrogen and irrigation management of fertigated and drip-irrigated vegetable crops using modeling and monitoring approaches. Agr. Water Manag. 2013, 119, 121–134. [Google Scholar] [CrossRef]
  15. Fernández, M.D.; Baeza, E.; Céspedez, A.; Pérez-Parra, J.; Gázquez, J.C. Validation of on-farm crop water requirements (PrHo) model for horticultural crops in an unheated plastic greenhouse. Acta Hortic. 2009, 807, 295–300. [Google Scholar] [CrossRef]
  16. Magán, J.J.; Gallardo, M.; Fernández, M.D.; Garcı́a, M.L.; Granados, M.R.; Padilla, F.M.; Thompson, R.B. Showcasing a fertigation management strategy for increasing water and nitrogen use efficiency in soil-grown vegetable crops in the FERTINNOWA project. Acta Hortic. 2019, 1253, 17–24. [Google Scholar] [CrossRef]
  17. Martínez-Gaitán, C.; Granados, M.R.; Fernández, M.D.; Gallardo, M.; Thompson, R.B. Recovery of 15N labeled nitrogen fertilizer by fertigated and drip irrigated greenhouse vegetable crops. Agronomy 2020, 10, 741. [Google Scholar] [CrossRef]
  18. Gallardo, M.; Elia, A.; Thompson, R.B. Decision support systems and models for aiding irrigation and nutrient management of vegetable crops. Agr. Water Manag. 2020, 240, 106209. [Google Scholar] [CrossRef]
  19. Gallardo, M.; Cuartero, J.; Andújar de la Torre, L.; Padilla, F.M.; Segura, M.L.; Thompson, R.B. Modelling nitrogen, phosphorus, potassium, calcium and magnesium uptake, and uptake concentration, of greenhouse tomato with the VegSyst model. Sci. Hort. 2021, 279, 109862. [Google Scholar] [CrossRef]
  20. Thompson, R.B.; Gallardo, M.; Valdez, L.C.; Fernández, M.D. Using plant water status to define soil water thresholds for irrigation management of vegetable crops using soil moisture sensors. Agr. Water Manag. 2007, 88, 147–158. [Google Scholar] [CrossRef]
  21. Gallardo, M.; Thompson, R.B.; Fernández, M.D. Water requirements and irrigation management in Mediterranean greenhouses: The case of the southeast coast of Spain. In Good Agricultural Practices for Greenhouse Vegetable Crops. Principle for Mediterranean Climate Areas; FAO: Rome, Italy, 2017; pp. 109–136. [Google Scholar]
  22. Rodríguez, A.; Peña-Fleitas, M.T.; Padilla, F.M.; Gallardo, M.; Thompson, R.B. Petiole sap nitrate concentration to assess crop nitrogen status of greenhouse sweet pepper. Sci. Hortic. 2021, 285, 110157. [Google Scholar] [CrossRef]
  23. Peña-Fleitas, M.T.; Gallardo, M.; Thompson, R.B.; Farneselli, M.; Padilla, F.M. Assessing crop N status of fertigated vegetable crops using plant and soil monitoring techniques. Ann. Appl. Biol. 2015, 167, 387–405. [Google Scholar] [CrossRef] [PubMed]
  24. Peña-Fleitas, M.T.; Gallardo, M.; Padilla, F.M.; Rodríguez, A.; Thompson, R.B. Use of a portable rapid analysis system to measure nitrate concentration of nutrient and soil solution, and plant sap in greenhouse vegetable production. Agronomy 2021, 11, 819. [Google Scholar] [CrossRef]
  25. Peña-Fleitas, M.T.; Grasso, R.; Gallardo, M.; Padilla, F.M.; de Souza, R.; Rodríguez, A.; Thompson, R.B. Sample temperature affects measurement of nitrate with a rapid analysis ion selective electrode system used for N management of vegetable crops. Agronomy 2022, 12, 3031. [Google Scholar] [CrossRef]
  26. Fernández-Rodríguez, R.; Camacho-Ferre, F. Manual Práctico de Fertirrigación en Riego por Goteo: Sistemática de Resolución de Problemas, Ejemplos Resueltos, 2nd ed.; Ediciones Agrotécnicas: Madrid, Spain, 2013; p. 169. (In Spanish) [Google Scholar]
  27. Fernández, M.D.; López, J.C.; Baeza, E.; Céspedes, A.; Meca, D.E.; Bailey, B. Generation and evaluation of typical meteorological year datasets for greenhouse and external conditions on the Mediterranean coast. Int. J. Biometeorol. 2015, 59, 1067–1081. [Google Scholar] [CrossRef]
  28. Fernández, M.D.; Bonachela, S.; Orgaz, F.; Thompson, R.; López, J.C.; Granados, M.R.; Gallardo, M.; Fereres, E. Measurement and estimation of plastic greenhouse reference evapotranspiration in a Mediterranean climate. Irrig. Sci. 2010, 28, 497–509. [Google Scholar] [CrossRef]
  29. Hochmuth, G.J. Efficiency ranges for nitrate-nitrogen and potassium for vegetable petiole sap quick test. HortTechnology 1994, 4, 218–222. [Google Scholar] [CrossRef]
  30. Cadahia, C. La Savia Como Índice de Fertilización. Cultivos Agroenergéticos, Hortícolas, Frutales y Ornamentales; Ediciones Mundi-Prensa: Madrid, Spain, 2008; p. 254. (In Spanish) [Google Scholar]
  31. Red de Información Agroclimática de Andalucía (RIA). Available online: https://www.juntadeandalucia.es/agriculturaypesca/ifapa/riaweb/web/ (accessed on 5 July 2023).
  32. EU 790/2000. COMMISSION REGULATION (EC) No 790/2000 of 14 April 2000 Laying Down the Marketing Standard for Tomatoes (OJ L 95, 15.4.2000, p. 24). Available online: https://eur-lex.europa.eu/legal-content/EN/TXT/PDF/?uri=CELEX:02000R0790-20010701&from=MT (accessed on 10 October 2023).
  33. Grasso, R.; Peña-Fleitas, M.T.; de Souza, R.; Rodríguez, A.; Thompson, R.B.; Gallardo, M.; Padilla, F.M. Nitrogen effect on fruit quality and yield of muskmelon and sweet pepper cultivars. Agronomy 2022, 12, 2230. [Google Scholar] [CrossRef]
  34. Casas, A.; Casas, E. El Análisis de Suelo-Agua-Planta y su Aplicación en la Nutrición de los Cultivos Hortícolas en la Zona del Sureste Peninsular; Caja Rural de Almería: Almería, Spain, 1999; p. 249. (In Spanish) [Google Scholar]
  35. Rodríguez, A.; Peña-Fleitas, M.T.; Padilla, F.M.; Gallardo, M.; Thompson, R.B. Soil monitoring methods to assess immediately available soil N for fertigated sweet pepper. Agronomy 2020, 10, 2000. [Google Scholar] [CrossRef]
  36. Soto, F.; Gallardo, M.; Thompson, R.B.; Peña-Fleitas, T.; Padilla, F.M. Consideration of total available N supply reduces N fertilizer requirement and potential for nitrate leaching loss in tomato production. Agr. Ecosyst. Environ. 2015, 200, 62–70. [Google Scholar] [CrossRef]
  37. Rodríguez, A.; Peña-Fleitas, M.T.; Gallardo, M.; de Souza, R.; Padilla, F.M.; Thompson, R.B. Sweet pepper and nitrogen supply in greenhouse production: Critical nitrogen curve, agronomic responses and risk of nitrogen loss. Eur. J. Agron. 2020, 117, 126046. [Google Scholar] [CrossRef]
  38. Marschner, H. Mineral Nutrition of Higher Plants, 2nd ed.; Academic Press: San Diego, CA, USA, 2002; p. 889. [Google Scholar]
  39. Bonachela, S.; Fernández, M.D.; Cabrera-Corral, F.J.; Granados, M.R. Salt and irrigation management of soil-grown Mediterranean greenhouses tomato crops drip-irrigated with moderately saline water. Agric. Water Manage. 2022, 262, 107433. [Google Scholar] [CrossRef]
  40. Cabrera-Corral, F.J.; Bonachela, S.; Fernández, M.D.; Granados, M.R.; López, J.C. Lysimetry methods for monitoring soil solution electrical conductivity and nutrient concentration in greenhouse tomato crops. Agric. Water Manag. 2016, 178, 171–179. [Google Scholar] [CrossRef]
  41. López-Martín, M.; Thompson, R.B.; Giménez, C.; Gallardo, M. VegSyst-DSS Suite software to calculate nutrient solution composition in greenhouse soil-grown vegetable crops. Acta Hortic. in press.
Figure 1. (a) Daily average air temperature and daily integral of solar radiation in the greenhouse during the cropping season between 3 September 2021 and 5 April 2022, and (b) seasonal evolution of the weekly volume of water applied during the cropping season to the conventional (CONV) and prescriptive–corrective management (PCM) treatments, and the weekly irrigation recommendations by the VegSyst-DSS v2 (DSS Rec). In Figure 1a, the red arrow shows the date of removing the whitening (CaCO3) application to the plastic cover of the greenhouse.
Horticulturae 09 01128 g001
Figure 2. Seasonal evolution of the measured concentrations of nutrients in the applied solution in the conventional (CONV) and prescriptive–corrective management (PCM) treatments. Also presented are the recommended concentrations following local farmers practice (CONV-Rec) and calculated using the VegSyst-DSS v2 (DSS-Rec). Nutrients are (a) nitrogen, (b) phosphorous, (c) potassium, (d) calcium, and (e) magnesium. Arrows in panels (a,b) show the dates of interventions of corrective management of N and P.
Horticulturae 09 01128 g002
Figure 3. Seasonal evolution of petiole sap concentrations of (a) NO3, (b) HPO42−, (c) K+, (d) Ca2+, and (e) Mg 2+ in the conventional (CONV) and prescriptive–corrective management (PCM) treatments. Data are presented as means (n = 4) ± standard error (SE). The horizontal dotted lines in Figure 3a,c represent the lower threshold for sap content, according to the authors of [29]. The horizontal dotted lines in Figure 3b represent the lower threshold for sap content, according to the authors of [30]. Arrows in panels (a,b) show the dates of corrective management of N and P.
Horticulturae 09 01128 g003
Figure 4. Seasonal evolution of the leaf contents of N (a), P, (b), K (c), Ca (d), and Mg (e) in the conventional (CONV) and prescriptive–corrective management (PCM) treatments. Data are presented as means (n = 4) ± standard error (SE). The horizontal dotted lines in each panel represent the lower threshold, according to the authors of [34].
Horticulturae 09 01128 g004
Figure 5. Seasonal evolution of the soil solution concentrations of NO3 (a), K+ (b), Ca2+ (c), and Mg 2+ (d) in the conventional (CONV) and prescriptive–corrective management (PCM) treatments. Data are presented as means (n = 4) ± standard error (SE). The horizontal dotted lines in Figure 4a represent the sufficiency range, according to the authors of [35].
Horticulturae 09 01128 g005
Figure 6. Contents of soil mineral N (a), available Olsen P (b), and exchangeable K (c), Ca (d), and Mg (e) for the conventional (CONV) and prescriptive–corrective (PCM) management treatments at three sampling dates during the cropping cycle. Sampling 1 at 45 days before transplanting, sampling 2 at 97 days after transplanting, and sampling 3 at 214 at days after transplanting.
Horticulturae 09 01128 g006
Figure 7. Relationship between the concentrations of (a) NO3, (b) K+, and (c) Ca2+ in petiole sap measured with the ISE rapid analysis system and with the laboratory analytical system in the CONV and PCM treatments throughout the tomato crop. The dashed black lines correspond to the 1:1 linear relationships and the blue solid lines to the fitted linear equations. Equations of the lineal relationship are presented in each panel.
Horticulturae 09 01128 g007
Table 1. The initial soil conditions, immediately prior to cropping (soil analysis: 0–20 cm). Results from the soil evaluation using the VegSyst-DSS v2 and the nutrient application factor “f1” (a factor that is multiplied by the daily uptake to calculate the nutrient requirements, using VegSyst v2) are also included.
Soil ParameterInitial ConditionsSoil EvaluationNutrient Application Factor (f1)
TextureSandy loamSoil type 1
Total carbonates (%)12.9Adequate
Organic matter (%)1.6Used in N balance
N-NO3 (kg ha−1)33.4Used in N balance
Available P (mg kg−1)100.5Very high0.2
Exch. K (mg kg−1)271.5Medium1.2
Exch. Ca (mg kg−1)1497.0Medium1.2
Exch. Mg (mg kg−1)105.5Low1.8
Table 2. Seasonal values of total amounts of water, N, P, K, Ca, and Mg applied to the crop. Also presented are the seasonal averages of measured concentrations of macronutrients in the applied nutrient solution; the values in brackets are the average of the recommended concentrations provided by local farmers (CONV) and by the VegSyst-DSS v2 (PCM). The ratio of the total amounts of water and nutrients applied in the PCM compared to the CONV treatments is also shown.
Total ValuesCONVPCMPCM/CONV (%)
Irrigation (mm)34826575
N (kg ha−1)53932560
P (kg ha−1)1592415
K (kg ha−1)84347857
Ca (kg ha−1)60425742
Mg (kg ha−1)1378360
Seasonal average
[N] (mmol L−1)12.3 (12.9)9.5 (9.4)
[P] (mmol L−1)1.5 (1.7)0.3 (0.3)
[K] (mmol L−1)6.9 (7.6)5.2 (5.2)
[Ca] (mmol L−1)4.7 (4.8)2.5 (2.1)
[Mg] (mmol L−1)1.7 (2.0)1.3 (1.2)
Table 3. Average values for the cropping season of petiole sap and soil solution concentrations of NO3, HPO42−, K+, Ca2+, and Mg2+ in the conventional (CONV) and prescriptive–corrective (PCM) treatments. Values are means ± standard error. A summary of the analysis of variance is presented, with non-significant (ns), significant at p ≤ 0.05 (*), very significant at p ≤ 0.01 (**), and highly significant at p ≤ 0.001 (***).
Petiole Sap (mg L−1)
ConvPCMSignificance
NO34608 ± 76.73587 ± 92.0**
HPO42−322 ± 10.1181 ± 3.5***
K+4949 ± 119.15023 ± 23.1ns
Ca2+2299 ± 20.82475 ± 26.6*
Mg 2+487 ± 14.3611 ± 8.2**
Soil solution (mmol L−1)
NO316.5 ± 2.211.1 ± 3.0**
K+8.0 ± 2.13.9 ± 1.1**
Ca2+8.7 ± 1.25.4 ± 1.2**
Mg2+4.2 ± 0.73.1 ± 0.7**
Table 4. Total and marketable yields, total fruit number, and mean fruit weight for each treatment. Different letters indicate significant differences (p < 0.05) between means, according to the LSD procedure. A summary of the analysis of variance is presented, with non-significant (ns).
TreatmentTotal Yield
(kg m−2)
Marketable Yield (kg m−2)Total Fruit Number
(Fruits m−2)
Mean Fruit Weight
(g)
CONV13.6 a12.3 a95.1 a143.3 a
PCM13.5 a12.5 a94.9 a142.0 a
Significancensnsnsns
Table 5. For each treatment, total soluble solids (TSSs), titratable acidity, and pH were assessed (all indicative of internal quality), along with fruit firmness and fruit color indices (both indicative of external quality). Different letters indicate significant differences (p < 0.05) between means, according to the LSD procedure. A summary of the analysis of variance is presented, with non-significant (ns) and significant at p ≤ 0.05 (*).
Organoleptic QualityExternal Quality
Treatment TSS (°Brix)Titratable AciditypHFruit Firmness (N)L *a *b *HC *CI
CONV4.5 a0.43 a4.4 a3.9 a41.3 a16.4 a24 a0.97 a29.2 a17.1 a
PCM4.7 a0.41 a4.3 a3.9 a41.2 a17.4 a24 a0.94 a29.7 a17.9 a
Significancensnsnsnsnsnsnsnsnsns
Table 6. For each treatment, the cost of water used (€ ha−1) considering a cost of desalinated water of 0.45 € m−3; for each fertilizer, the amount (kg) used in each treatment considering a treatment area of 900 m2, the cost of fertilizer (€ kg−1, € ha−1), and the total cost in fertilizer (€ ha−1) for each treatment.
Treatment Irrigation
(€ ha−1)
Fertilizer (kg)Fertilizer
(€ kg−1)
Fertilizer
(€ ha−1)
CONVIrrigation1566
Calcium nitrate 151.00.731225
Potassium nitrate 52.01.47850
Monopotassium Phosphate 30.52.76934
Potassium sulfate 36.01.76703
Magnesium sulfate 66.40.41302
Total 4014
PCMIrrigation1193
Calcium nitrate 64.60.73524
Potassium nitrate 63.91.471044
Monopotassium Phosphate 7.32.76223
Potassium sulfate 1.21.7624
Magnesium sulfate 40.10.41183
Total 1998
Table 7. Costs associated with the field implementation of the prescriptive–corrective fertilizer management.
Monitoring ComponentCost (€ ha−1)
Soil analysis99.2
Leaf analysis73.8
Sap analysis127.1
Rapid analysis ISE (NO3− and K+)211.8
Calibration standard266.2
Total778.0
Disclaimer/Publisher’s Note: The statements, opinions and data contained in all publications are solely those of the individual author(s) and contributor(s) and not of MDPI and/or the editor(s). MDPI and/or the editor(s) disclaim responsibility for any injury to people or property resulting from any ideas, methods, instructions or products referred to in the content.