Article

Nutrients Use Efficiency in Coupled and Decoupled Aquaponic Systems

1
Laboratory of Agricultural Constructions and Environmental Control, Department of Agriculture Crop Production and Rural Environment, University of Thessaly, Fytokou Str., 38446 Volos, Greece
2
Department of Veterinary Medicine, Aristotle University of Thessaloniki, 54636 Thessaloniki, Greece
*
Author to whom correspondence should be addressed.
Horticulturae 2023, 9(10), 1077; https://doi.org/10.3390/horticulturae9101077
Submission received: 8 August 2023 / Revised: 20 September 2023 / Accepted: 22 September 2023 / Published: 26 September 2023
(This article belongs to the Section Protected Culture)

Abstract

:
Aquaponics is currently undergoing a transformation into an intensive food production system. The initially applied systems focused on small-scale, fish-centric coupled (CAP, the aquaculture, and the hydroponic units are arranged in a single loop, and the water flows continuously from the fish tanks to the plant unit and back) aquaponics. More recently, the primary area of research interest has shifted toward larger-scale, plant-centric decoupled (aquaculture and hydroponics units are arranged in a multi-loop setup as separate functional units that can be controlled independently) systems, aiming to achieve greater economic benefits and employ more environmentally friendly practices. The objective of this study was to address gaps in the expansion of decoupled larger-scale aquaponics and to provide a comprehensive understanding of the water and nutrient flow in the system. For this purpose, experiments were performed in a greenhouse on CAP and DCAP systems, while this study also included measurements in a pure hydroponic system (HP). This study presents an assessment of the water and nutrient flow in four different crops: basil; cucumber; parsley; and tomato, all co-cultivated with a tilapia aquaculture system. Significant nutrient deficiencies and imbalances were identified in the CAP solution, leading to pronounced impacts on nutrient assimilation, particularly for fruiting vegetables. However, the average nutrient use efficiency (NUE) for nitrogen, phosphorous, potassium, and calcium was found to be 42% higher in the CAP treatment compared to HP and DCAP treatments. The nutrient solution in the DCAP treatment did not exhibit differences in water quality parameters and nutrient efficiency when compared to HP, resulting in similar effects on nutrient assimilation. Nonetheless, it was observed that DCAP plants exhibited superior NUE compared to HP plants.

1. Introduction

Aquaponics is a system where water is recirculated in a closed cycle to grow both aquatic organisms and plants. The majority of nutrients (>50%) used to fertilize the plants in those systems are derived from waste originating from aquatic organisms [1]. Within the water cycle, fish provide ammonia to the bacteria colony, and bacteria provide nitrates to the plants. The water flow is responsible for the transport of nitrogen and other nutrients to each organism’s compartment.
Aquaponics has been under research as a protein-intensive production system since the 1970s by Naegel and Lewis [2,3]. The first applied systems represented coupled aquaponics at the laboratory scale, where the water flows constantly from the aquaculture to the hydroponic system and vice versa. Rakocy was the pioneer of medium-scale coupled aquaponic systems in the 1980s [4]. Since then, aquaponics has been researched by many institutes in many countries worldwide in terms of system design, plant–fish combination, and type of hydroponic system. Kloas’ research in 2015 brought about a more representative system for commercial aquaponics using a decoupled aquaponic technique [5]. In this method, the cycle of water is independent in each subsystem. The aim of building a decoupled aquaponic system was to develop a cultivation system that allowed for the optimum fish and plant yields with low environmental impacts [6].
Aquaponics was first motivated as a “fish-centric” system with vegetable crops as a secondary commodity used for the biofiltration of aquaculture effluents [7]. This option minimizes the phenomenon of eutrophication and the water scarcity status caused by the spread of Recirculating Aquaculture Systems (RAS) [8]. Later, the greater profit potential of herbs and vegetables in comparison to fish and the development of decoupled techniques gave a boost to “plant-centric” aquaponic systems [7]. The plant-centric aquaponics reduces the demand for chemical fertilizers and contributes to natural resource protection [9]. Nevertheless, it is proven that the utilization of RAS solutions cannot completely replace a profitable and efficient hydroponic solution for plant cultivation [10]. This is attributable to nutrient deficiencies in these solutions [11,12,13]. For this reason, the implementation of fertilizers is a strategy for many researchers [14,15,16] that must take into consideration the nutrient ratio except for the main nutrient deficiencies from RAS solutions, like iron, potassium, and microelements.
Control of water quality in coupled aquaponics is essential for the ideal growing conditions for each organism [17,18,19,20]. Plants require various water quality parameters such as pH, electrical conductivity (EC), temperature (T), and dissolved oxygen (DO) from fish and bacteria to achieve maximum growth rates. Maintaining pH values at a neutral level can lead to plant nutrient deficiencies [21] or high toxicity of ammonia to fish [22]. The implementation of fertilizers up to the ideal electrical conductivity for plants carries the risk of acute or chronic toxicity for fish [23]. On the other hand, control of the quality of water in the system is necessary to obtain high productivity, especially for fruity vegetables [18,24]; otherwise, it may lead to reduced yields compared to monoculture production systems for fish and plants, respectively [25,26].
The low productivity of coupled aquaponic systems is the main reason that led the researchers to decoupled aquaponics, where complete control of both aquaculture and hydroponic solutions is achieved. Particularly, the pH values in RAS solutions are maintained at optimal levels so that the ammonia biofiltration rate can be maximized [27,28] and the feeding activity and vigor response of fish can be increased [29]. In addition, the pH value in hydroponic solutions is stabilized at a value of 5.5–6, improving the availability of phosphorus and other nutrients for plant growth [30]. Nutrient concentrations can be adjusted separately, so intensive fish and plant production, like in conventional single aquaculture and hydroponics, can be realized [5,8]. In comparison to coupled aquaponic systems, decoupled systems are developed for intensive, large-scale, and sustainable food production [31]. Nevertheless, the decoupled approach is relatively new, and less information about its functionality and its successful application is available [31]. The main disadvantages of decoupled systems are the non-optimized adjustment of nutrient solutions and the fact that there is a lack of scientific research [5].
Another issue in aquaponics that needs improvement concerns the substrate technique used in the hydroponic part of the system. Up to now, the most common techniques used have been (i) Deep Water Culture (DWC), (ii) Media Based Technique (MBT), and (iii) Nutrient Film Technique (NFT). The drip irrigation technique is still under research [32], although it is considered by many researchers to be the most suitable hydroponic type for commercial aquaponic systems [5,33]. It is maintained that very little is known about comparisons between intensive crop production in aquaponics and hydroponics under the same conditions [34]. The research team of Monsees [35] tried to fill the scientific gap by comparing coupled and decoupled aquaponics with NFT cultivation techniques in an aquaponic system. A decoupled aquaponic system was applied in other cases as well [36], in comparison to hydroponics, by adding fertilizers for the first time up to the standard hydroponic levels, in contrast to another research [37]. Up to now, the fertilizers were implemented up to 25% of the standard, or a commercial mix of fertilizer with a standard recipe without analyzing the RAS solution was implemented [5]. In aquaponic systems, more than 60 different types of plants have been used [38]. Leafy vegetables and herbs have been chosen primarily due to their short growing period and low nutrient requirements in contrast to fruity plants [32]. Mainly tomatoes have been cultivated aquaponically in the NFT subsystem [33], perlite pots [39], raised beds [40], and DWC [31,41]. However, advanced aquaponic research needs to focus on fruit-bearing crops, and until now, minimal scientific articles have cited this concept [32].
The aim of the current research was to provide knowledge about the progress of the nutrient balance in the different parts of the coupled and decoupled aquaponic systems. The experiments were carried out at the Pilot Greenhouse Park facilities of the University of Thessaly in Greece, applying three different treatments: coupled; decoupled; and conventional hydroponic systems. This is, to our knowledge, the first comprehensive study comparing hydroponics, coupled aquaponics, and decoupled aquaponics under the same environmental conditions in a large-scale aquaponic system using perlite as a substrate for plant growth. Two leafy (basil and parsley) and two fruit-yielding (tomato and cucumber) plants were cultivated; the nutrient concentration in the different parts of each system was measured, and the nutrient use efficiency (NUE) was estimated.

2. Materials and Methods

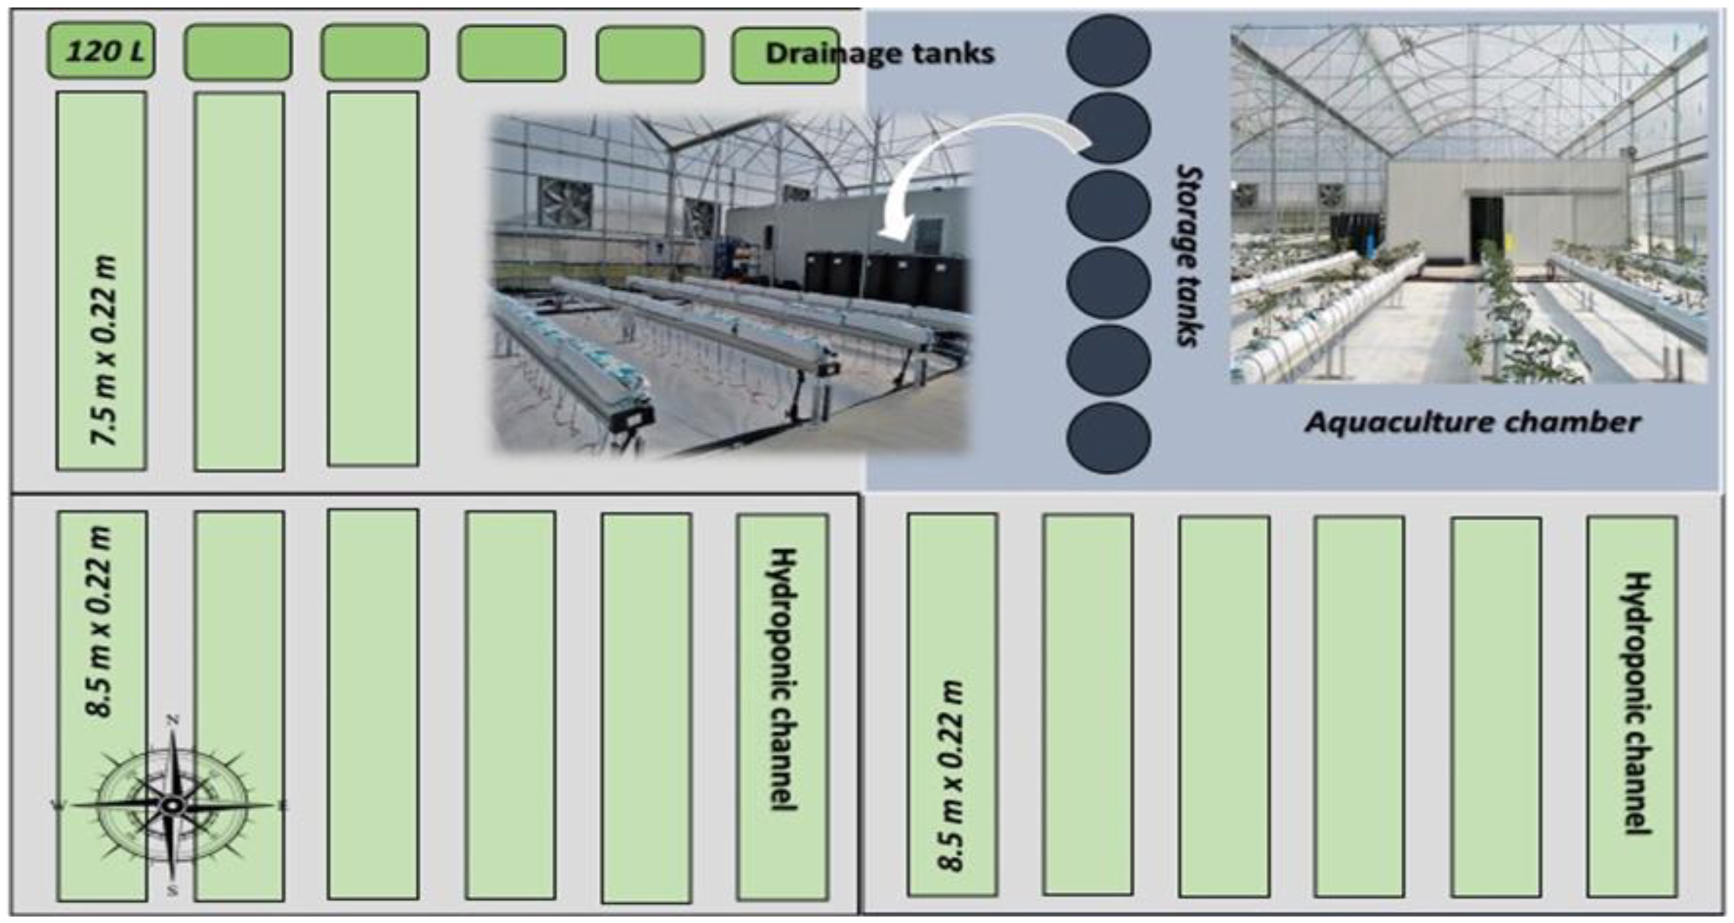
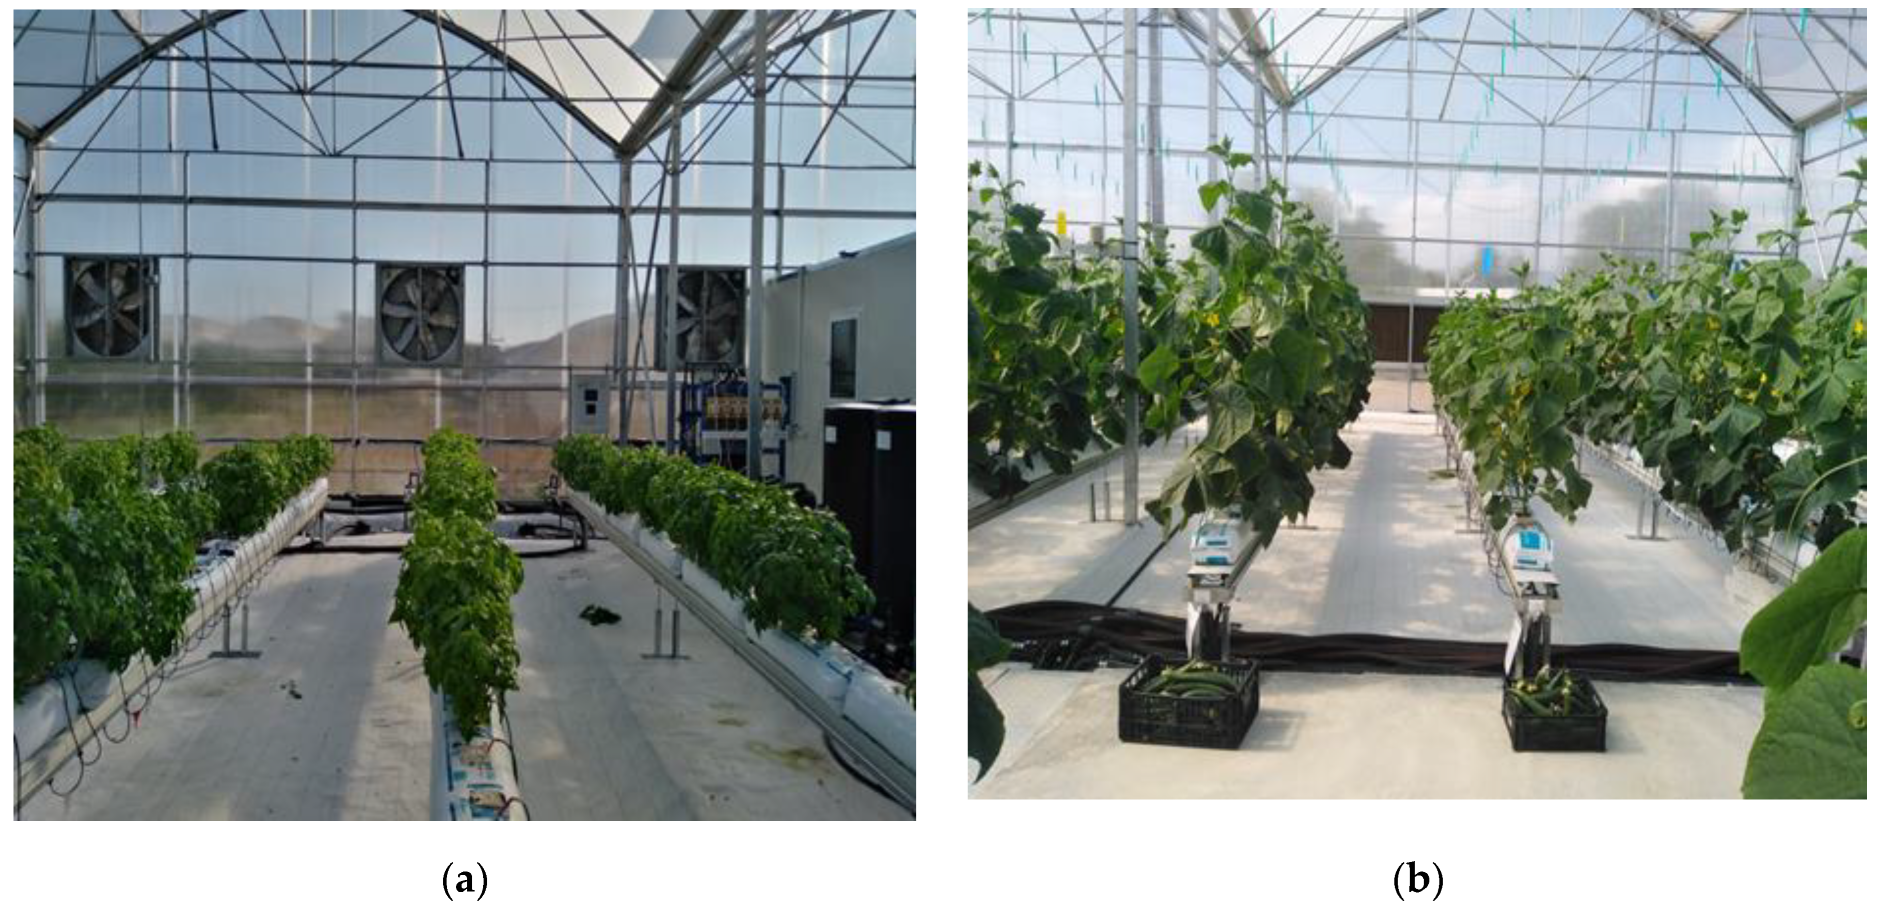
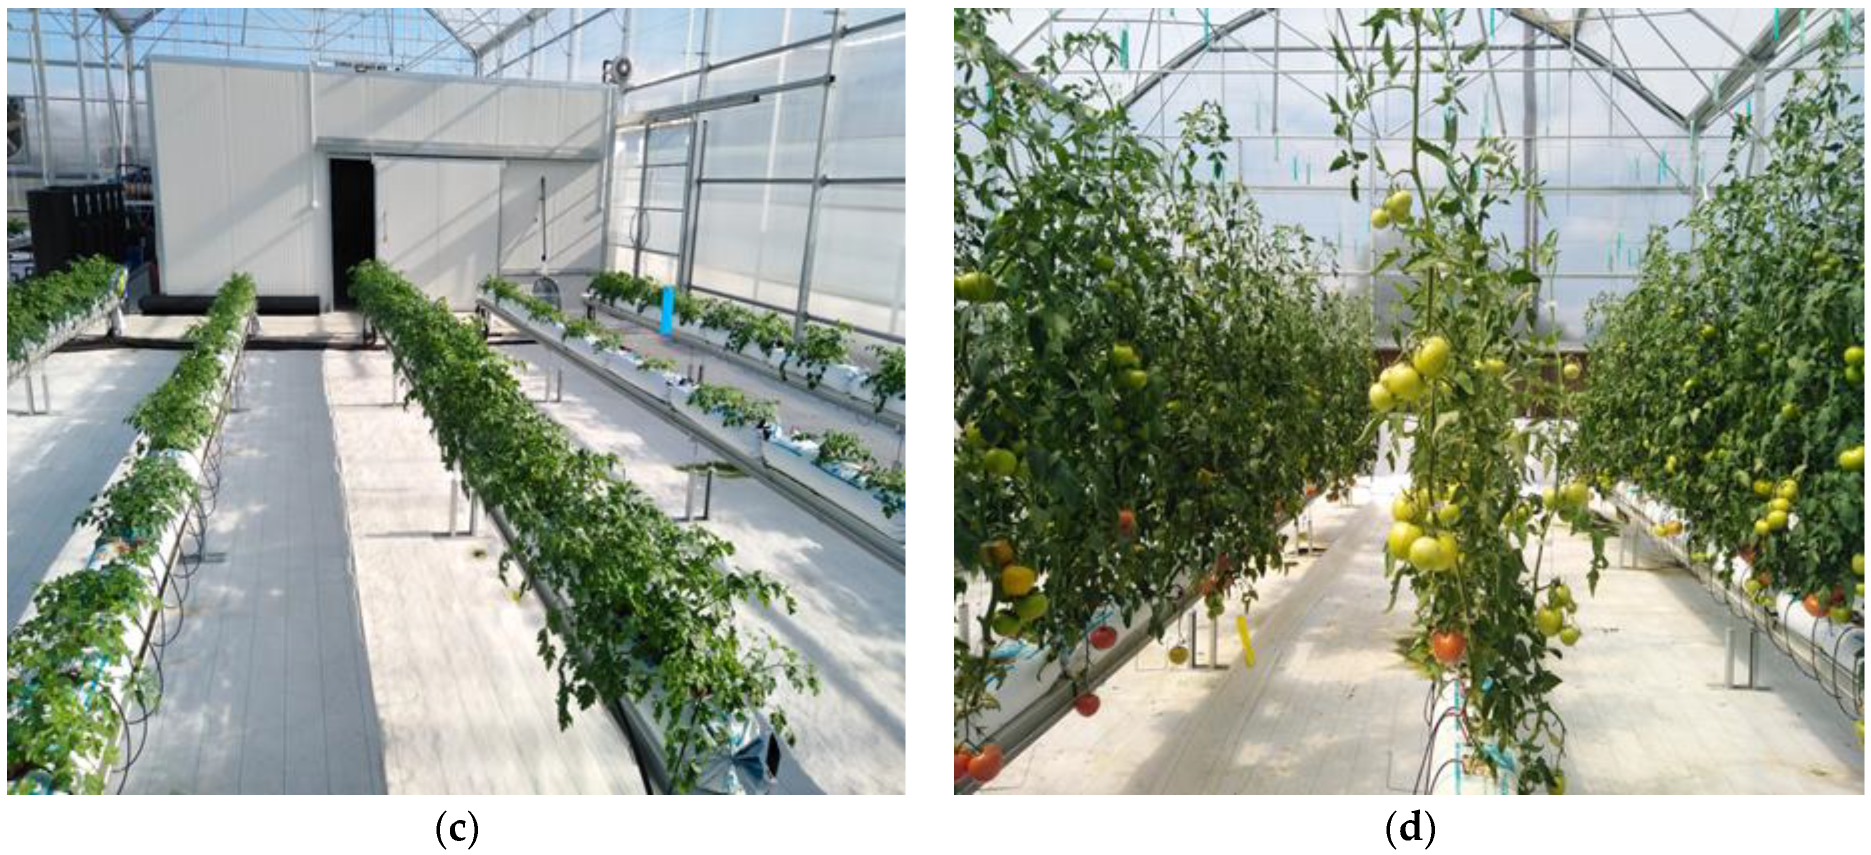
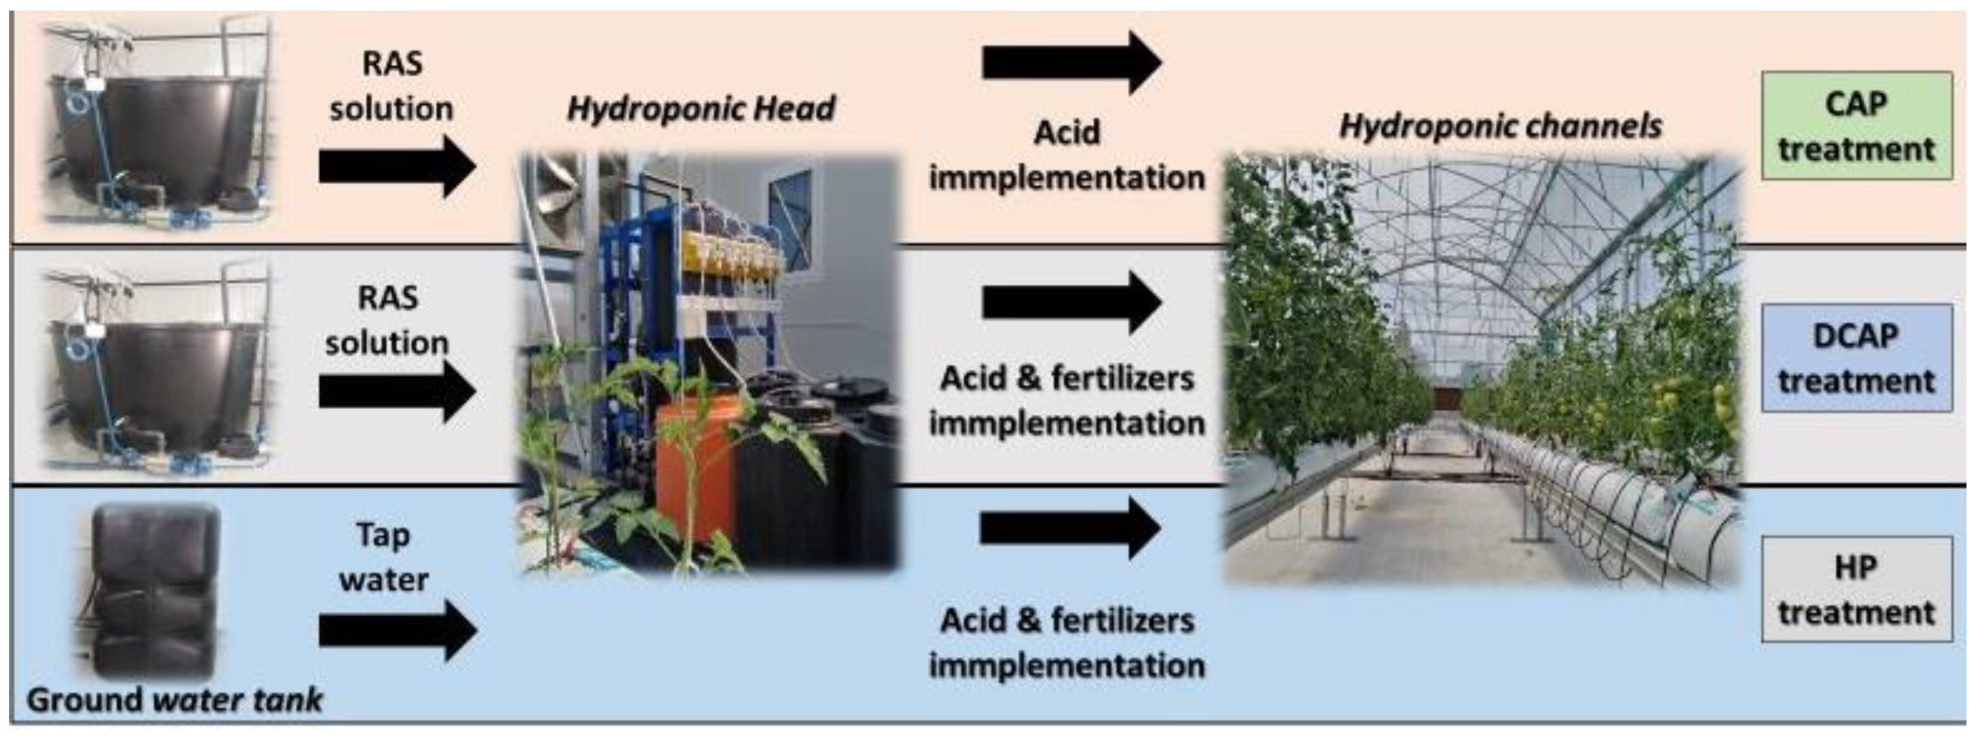
2.1. Experimental Setup

The experiment was carried out in the aquaponic system established within the climate-controlled greenhouse of the Laboratory of Agricultural Constructions and Environmental Control of the University of Thessaly in Velestino (latitude 39°440′, longitude 22°790′, altitude 85 m), Greece. The total ground area was 432 m2; about 352 m2 was used for the hydroponic subsystem, and about 80 m2 for the RAS subsystem settled in a closed controlled environment room (Figure 1).
The RAS subsystem consisted of three fish tanks of 1.3 m3 each, a buffer tank of 0.7 m3, a mechanical filter (Combi Bio 15, ProfiDrum, Retford, UK) of 0.5 m3, a biological filter (ceramic rings, 15 mm and K1, Kaldness media of 1 mm) of 0.7 m3, and a final clear buffer water tank of 2.3 m3. RAS solution is continuously recycled from the clear buffer water tank to the fish tanks via a pump (stainless steel self-priming Jet pump, 83 L min−1, Aquastrong Company LTD, Milan, Italy), completing a continuous water flow rate of 6 m3 h−1 and returns to the same tank by gravity/natural flow. In addition, RAS solution from the clear tank is occasionally pumped via a pump to the central hydroponic mixing tank (head unit) for the preparation of the nutrient solution. The RAS system contained approximately 6.6–7.1 m3 of water recirculating constantly in the system. An air blower (ASC-Standard, Airtech Europe GmbH, Differdange, Luxembourg, capacity of 100 m3 h−1) provided air to RAS tanks via air diffusers (Airstone four inches, KW ZONE, Penang, Malaysia). A portion of the total volume of the water was replenished daily by using tap water. The replenishment varied from 3.3% to 16.9% according to the cultivation species and time of the cultivation period. The nutrient composition of tap water comprised 17.7 mg L−1 NO3, 0.09 mg L−1 NH4+, 0.18 mg L−1 PO42−, 9 mg L−1 SO42−, 0.021 mg L−1 Fe2+, 31 mg L−1 Ca2+, 39.1 mg L−1 Mg2+, 3 mg L−1 K+, and 35 mg L−1 Na+.
The hydroponic subsystem consisted of a central mixing tank connected to six stock solution tanks, 6 fertigation solution storage tanks, 18 crop channels, and 6 drainage tanks. The nutrient solution (NS) was prepared using the Cooper formulation [42] in the central mixing tank (the head unit), receiving the appropriate amount of nutrients stored in the stock solution tanks. During the NS preparation process, acid was injected to set the pH level of the solution. The pH and EC levels of the NS were controlled by pH and EC sensors (pH/ΕC measuring transducer, GHM-Greisinger, Bayern, Germany) connected to the head unit, while the volume of the solution was controlled by a pressure sensor (1–20 mA, 24 V, WIKA Alexander Wiegand SE & Co. KG, Klingenberg, Germany). Once the nutrient solution has been successfully processed, it is transferred to the fertigation solution storage tank to be used for fertigation according to the crop needs. The cultivation receives the nutrient solution automatically via the drippers (2.3 L h−1, spaghetti tubes, angle drippers, five drippers per slab), and the drainage solution flows through gravity to the drainage tank. The channels were placed 50 cm above the ground. In total, 18 identical hydroponic channels (about 8 m × 0.22 m) with 8 perlite slabs (Isocon Perloflor Hydro 1, Isocon S.A., Athens, Greece) per channel were established (Figure 1 and Figure 2) in three blocks (6 channels per block). Every single channel per block was connected to a different fertigation solution storage tank (500 L) and drainage tank (120 L). Irrigation and fertigation were automatically controlled by a custom-developed controller (Argos Electronics, Evia, Greece). The irrigation dose fluctuated daily according to plant needs, with an expected drainage ratio of 30–35% of the irrigated solution [43].
Air temperature and relative humidity within the plant cultivation area were recorded via the iMETOS®sm system (Pessl Instruments, IMT180, Weiz, Austria) and automatically controlled using a climate control computer (Emmanouilidis, Thessaloniki, Greece).

2.2. Experimental Set Up

To assess the efficiency of the coupled and decoupled aquaponic systems, a four-period experiment was carried out from May 2020 to July 2021. During the 1st period, basil seedlings (Ocimum basilicum cv. Genovese) were transplanted (2.4 plants m−2) on May 18, and the cultivation lasted for 60 days. In the 2nd period (21/8/2020 until 17/11/2020, 88 days), 15-day-old cucumber plants (Cucumis sativus cv. Aisopos) were transplanted (1.18 plants m−2). In the 3rd period, parsley plants (Petroselinum crispum (Mill.)) were transplanted at a plant density of 2.4 plants m−2 on 7 December 2020 and cultivated for 70 days. In the 4th period (from 15 March until 13 July 2021), tomato plants (Solanum lycopersicum cv. Kabrera) were transplanted (1.76 plants m−2) and cultivated for 120 days (Figure 3).
The average daily air temperatures were 26.3 ± 2.13 °C, 25.01 ± 3.87 °C, 17.84 ± 3.19 °C, and 24.9 ± 3.74 °C for basil, cucumber, parsley, and tomato cultivations, while relative humidity was 52.48 ± 6.04%, 59.48 ± 11.26%, 60.39 ± 15.98%, and 51.03 ± 13.25%, respectively. The daily average radiation inside the greenhouse was 295.04 ± 63.97 W m−2.
During the cultivation period, red tilapia (Oreochromis spp.) fish were stocked at an average rate of 8.09 kg m−3. Fish initial biomass ranged from 5.78 kg m−3 (1st period) to 8.52 kg m−3 (2nd period), 8.27 kg m−3 (3rd period), and 9.77 (4th period). Fish were hand-fed to satiation three times per day with Prodac Pondsticks Color, containing crude protein 29.0%, crude ash 5.7%, crude fibers 3.3%, crude fat 2.9%, moisture 4.8%, omega 6 42.2%, and omega 3 5.7%.
In all the periods, three different fertigation treatments were performed in two replicates per block (92 plants per treatment and repetition): (i) the hydroponic treatment (HP); (ii) the decoupled aquaponic treatment (DCAP); and (iii) the coupled aquaponic treatment (CAP). In the HP treatment, the plants were fertigated with 100% standard fresh solution, which represented the targeted concentration of the control treatment (Figure 4). In the DCAP treatment, the plants were fertigated with a solution consisting of water-enriched RAS with fertilizers to reach the targeted nutrient solution concentrations. The targeted concentration was set to that applied in the Mediterranean climatic conditions [44] and was modified according to the plant species and growth stage (Table 1). To achieve the targeted concentration in the DCAP treatment, the RAS solution was analyzed once a week for NO3, NH4+, PO42−, SO42−, Ca2+, Mg2+, K+, Na+, and Fe2+. According to the weekly estimated nutrient concentration, a new recipe was developed. In the CAP treatment, the plants were fertigated with a RAS solution that had been taken directly from the clear RAS tank. The drainage solution of the CAP treatment was collected, sterilized, and returned to the aquaculture system, while the HP and DCAP treatments were drained outside the system.
In all the treatments, the pH of the fertigation solution was adjusted to the targeted level before being applied to the plants. In the HP treatment, the pH of the solution was adjusted by adding nitric acid (HNO3 65%) in combination with sulfuric acid (H2SO4 96%). In CAP treatment, the pH of the solution stored in the fertigation solution tank was adjusted by adding sulfuric acid (96%) for cucumber, parsley, and tomato cultivation and a mix of nitric acid (65%), phosphoric acid (85%), and sulfuric acid (96%) for basil cultivation.

2.3. Measurements and Analyses

Measurements of the electrical conductivity (EC, dS m−1) and the pH values in the irrigation and drainage solutions per treatment were recorded weekly. Portable sensors were used for EC (Combo pH-EC-TDS-Temp, 98130 Hanna Instruments, Woonsocket, RI, USA) and pH (HQ40d, Hach, Loveland, CO, USA). The above quality parameters were also recorded daily in the RAS solution via the same sensors.
To estimate the exchange rate fluctuation of nutrients in the system, solution sampling was performed in the irrigation tanks (nutrient solution, NS), hydroponic channels (drainage solution, DS), and RAS system (RAS solution, RAS). Sampling was carried out once a week, with three sample replicates. To estimate potassium, calcium, and sodium, the samples were filtered (filter net, 7 μm) and analyzed with a Flame Photometer (model PFP7, Jenway Technology Company, Hong Kong, China) [45]. For analyzing the concentrations in nitrate (NO3), ammonium (NH4+), and phosphorous (PO4−2), a spectrophotometer (Hach DR3900, Loveland, CO, USA) method according to [46]) was used. A similar protocol was performed to estimate the elements’ content in the tap water. Water volumes for irrigation, drainage, and replenishment in the RAS system were automatically recorded daily via the software to an Access Database (Microsoft Office 2013, Microsoft 365, Access 2021).
Plant samplings were destroyed in an oven (every 10 days after transplantation for basil, parsley, and cucumber and every 15 days for tomato crops) in order to be analyzed for nutrient content such as N, P, K+, Ca2+, and Na+ in leaf tissue. The dry samples were carried out by four plants per treatment and ground with a burr grinder. For the estimation of nitrogen content in plant tissue, the extraction was performed using the Kjeldahl nitrogen method (TKN) based on the Kjeldahl protocol [47]. For P, K+, Ca2+, and Na+ content analysis, 0.5 g of each sample was extracted with a 20 mL hydrochloric solution (6%) and diluted in a 50 mL volumetric flask. The phosphorous content in the final sample was determined in a spectrophotometer (Visible spectrophotometer Libra S11, Harvard Bioscience, Holliston, MA, USA) and the potassium, calcium, and sodium content in a Flame Photometer. The same protocol was used for estimating the nutrient content in fruits like K+, Ca2+, and Na+, where 3 fruits per treatment every 14 days of the whole harvest period were dried and analyzed.

2.4. Calculations

The nutrient availability (NA) in the RAS solution for each cultivation was estimated as follows:
NA = CxRAS/CxStandard × 100
where CxRAS is the average concentration of each x element expressed in mg L−1 in RAS solution, and Cxstandard (mg L−1) is the standard concentration according to the hydroponic recipe for the cultivation period.
Τhe ratio of K+: [K+] + [Ca2+] + [Mg2+] was calculated by dividing the potassium concentration of NS with the sum of potassium, calcium, and sodium concentrations of the irrigated NS. A similar methodology was followed for the overall nutrient ratio of N, P, K+, Ca2+, and Na+.
The removal rate (RM) (mg g−1) of nutrients represents the amount of nutrients absorbed by the plants per dry biomass (leaf and stem) produced and was calculated as follows:
RM = (CxIr × VIr − CxDr × Vdr)/SDW
where CxIr is the average concentration of each x nutrient element in the nutrient solution (mg L−1); VIr is the total volume of nutrient solution irrigated (L); CxDr is the average concentration of x nutrient element in the drainage solution (e.g., NO3) (mg L−1); Vdr is the total volume of drainage solution (L), and SDW is the final dry weight of the cultivated plants (g).
The absorption concentration of nutrients (Cu) (mg L−1) represents the amount of nutrients absorbed per volume of nutrient solution absorbed by plants and was calculated as follows:
Cu = (CxIr × VIr − CxDr × Vdr)/Vabs
where CxIr is the average concentration of each x nutrient element in the nutrient solution (mg L−1); VIr is the total volume of nutrient solution irrigated (L); CxDr is the average concentration of x nutrient element in the drainage solution (e.g., NO3) (mg L−1); Vdr is the total volume of drainage solution (L), and Vabs is the volume of nutrient solution absorbed by the cultivated plants (L).
The Nutrients Use Efficiency (NUE) (%) demonstrates the utilization of nutrients by plants and was calculated as follows:
NUE = (Sfac − Siac)/Sapl
where Sfac is the total final accumulation of a nutrient element in the crop tissue (g); Siac is the total initial accumulation of a nutrient element in the crop tissue (g), and Sapl is the total quantity of the nutrient element applied (g).

2.5. Statistical Analysis

A comparison of means was performed by applying a one-way ANOVA at a confidence level of 95% (p < 0.05) using the Tukey–Kramer HSD test. The Statistical Package is represented by SPSS (Statistical Package for the Social Sciences, IBM, Armonk, NY, USA, 2012). The average values, along with the standard deviation (±SD) of the parameters measured, are reported.

3. Results

3.1. Water Quality Parameters

In Table 2, the pH and EC in the solution measured in the different parts of the system are presented. In CAP, the pH of the DS was consistently higher than that of the NS, regardless of the crop. The opposite effect, where lower pH values of DS compared to NS were achieved, was demonstrated in tomato crops for HP and DCAP treatments. As far as the EC is concerned, the DS had a greater value than the NS in HP and DCAP treatments in all crops except basil. In CAP treatment, only parsley presented a higher EC in the DS.

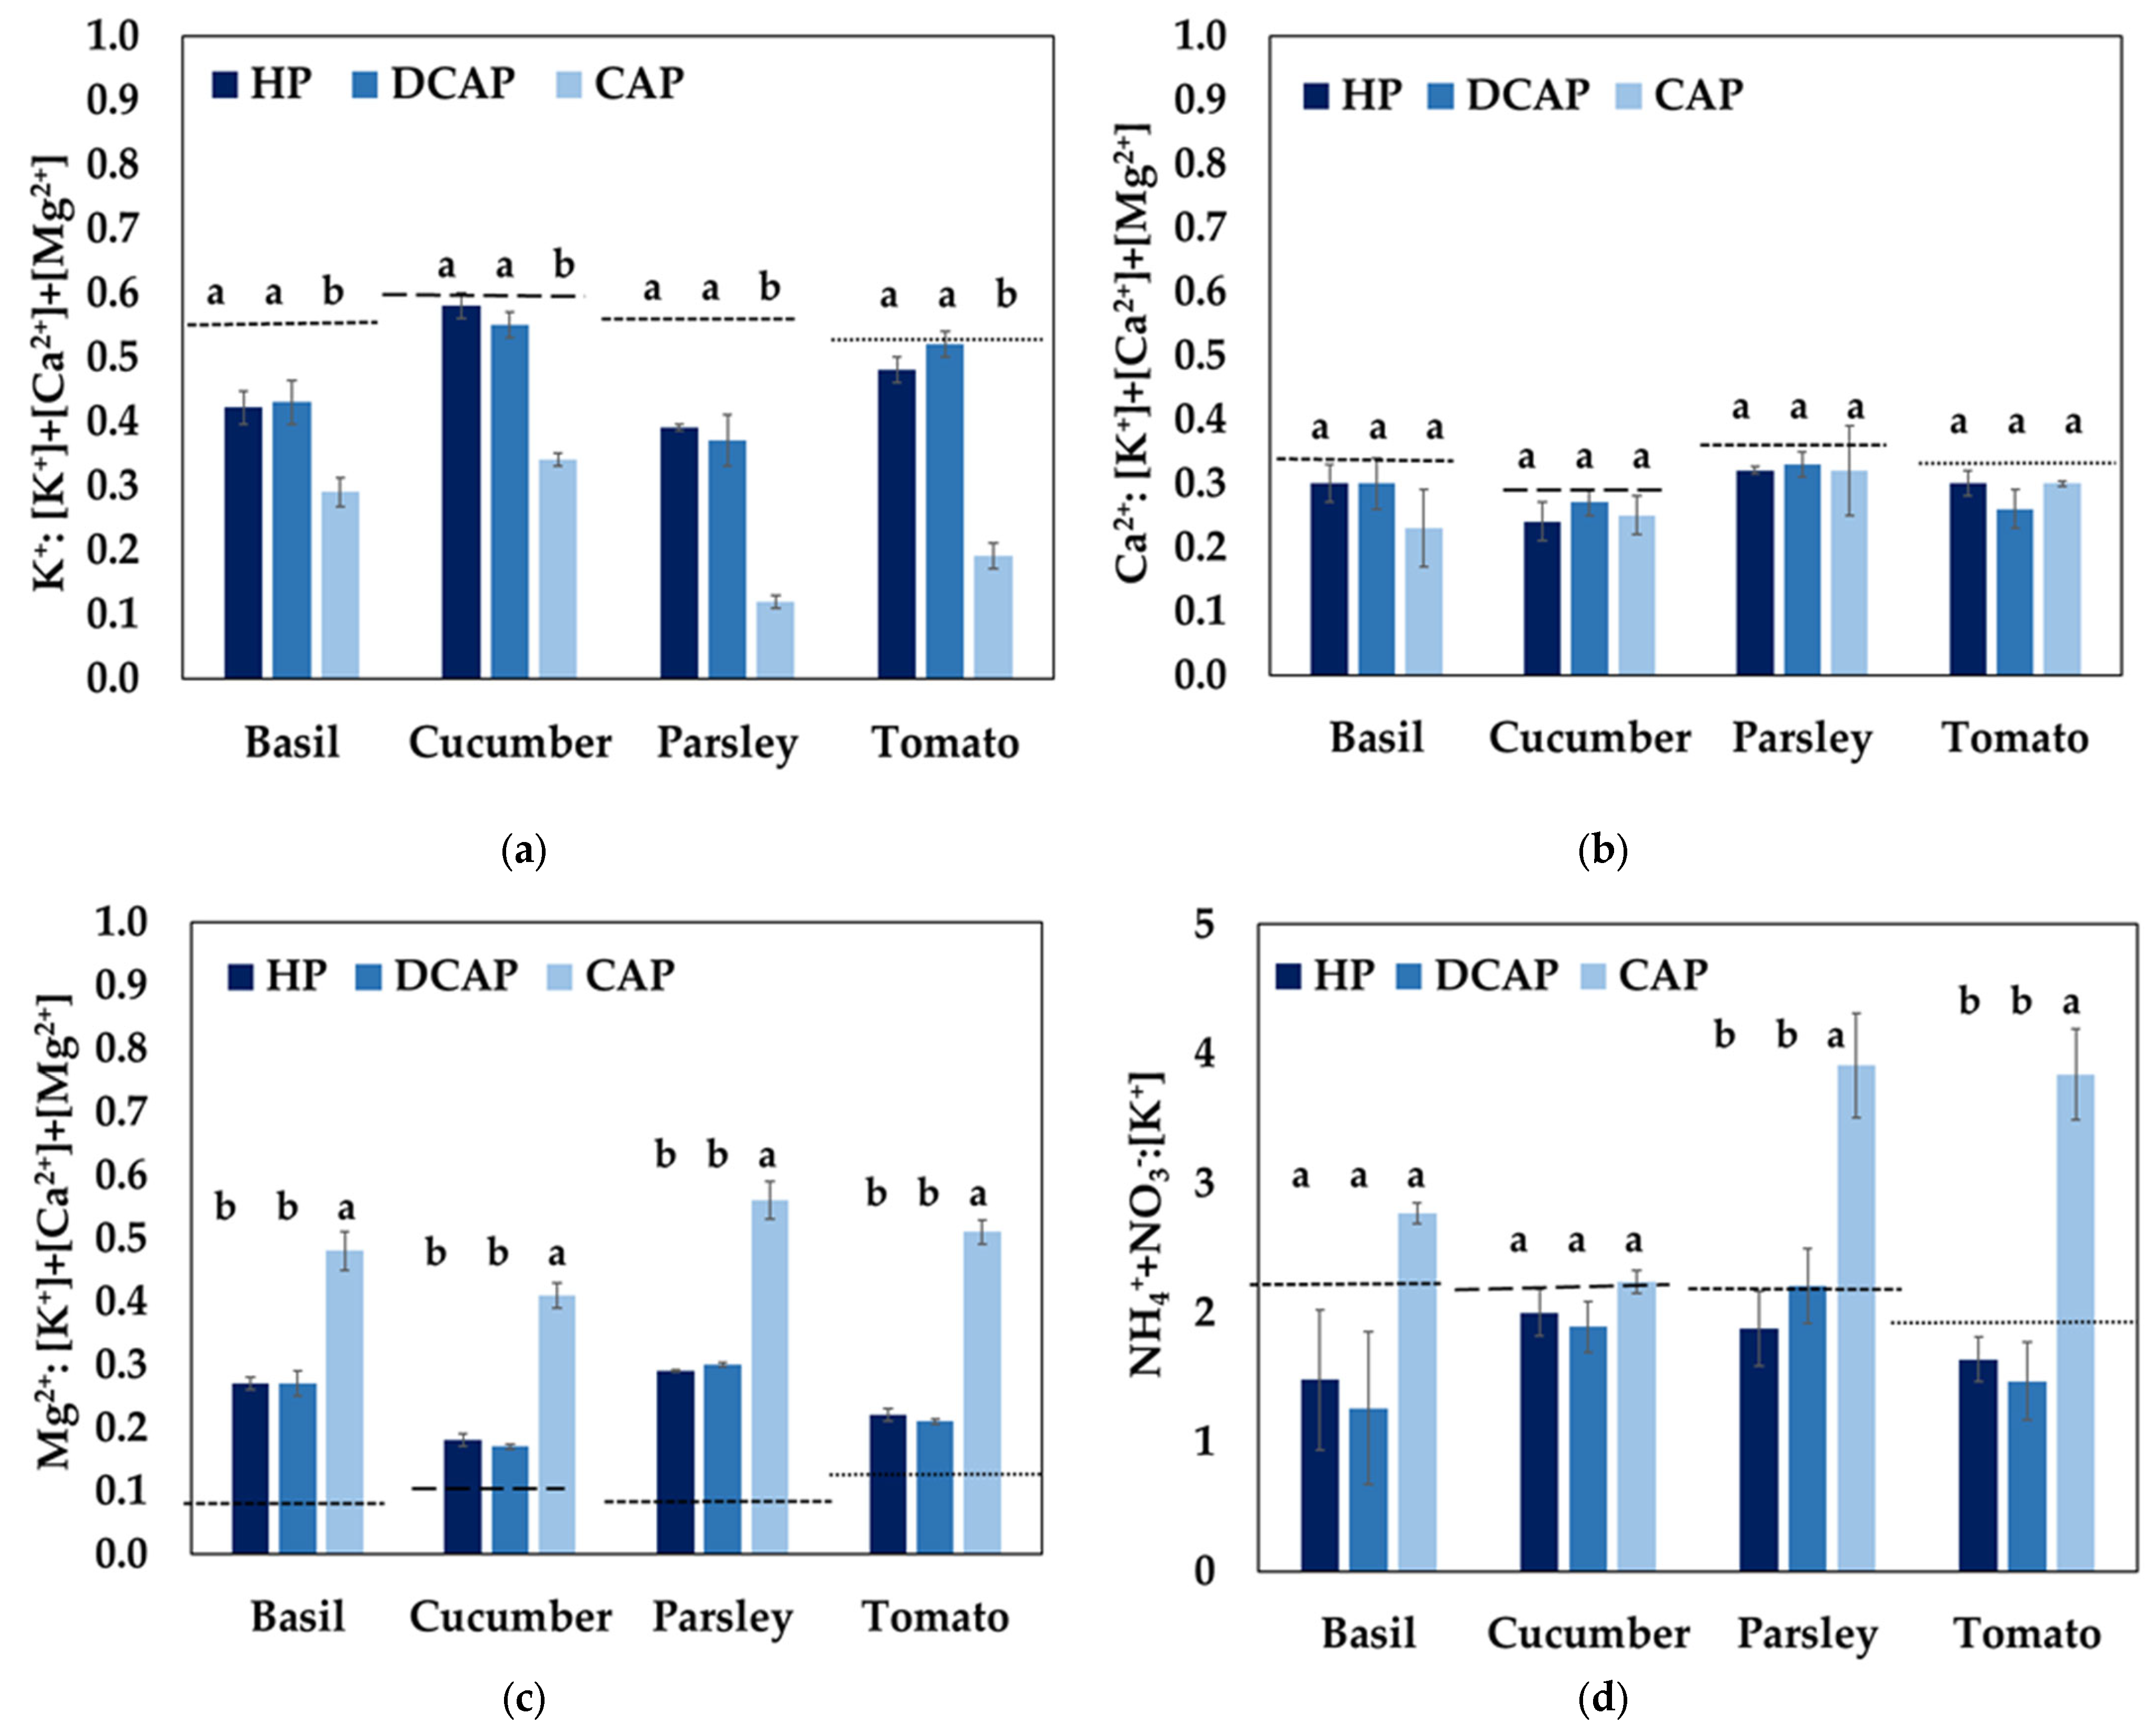
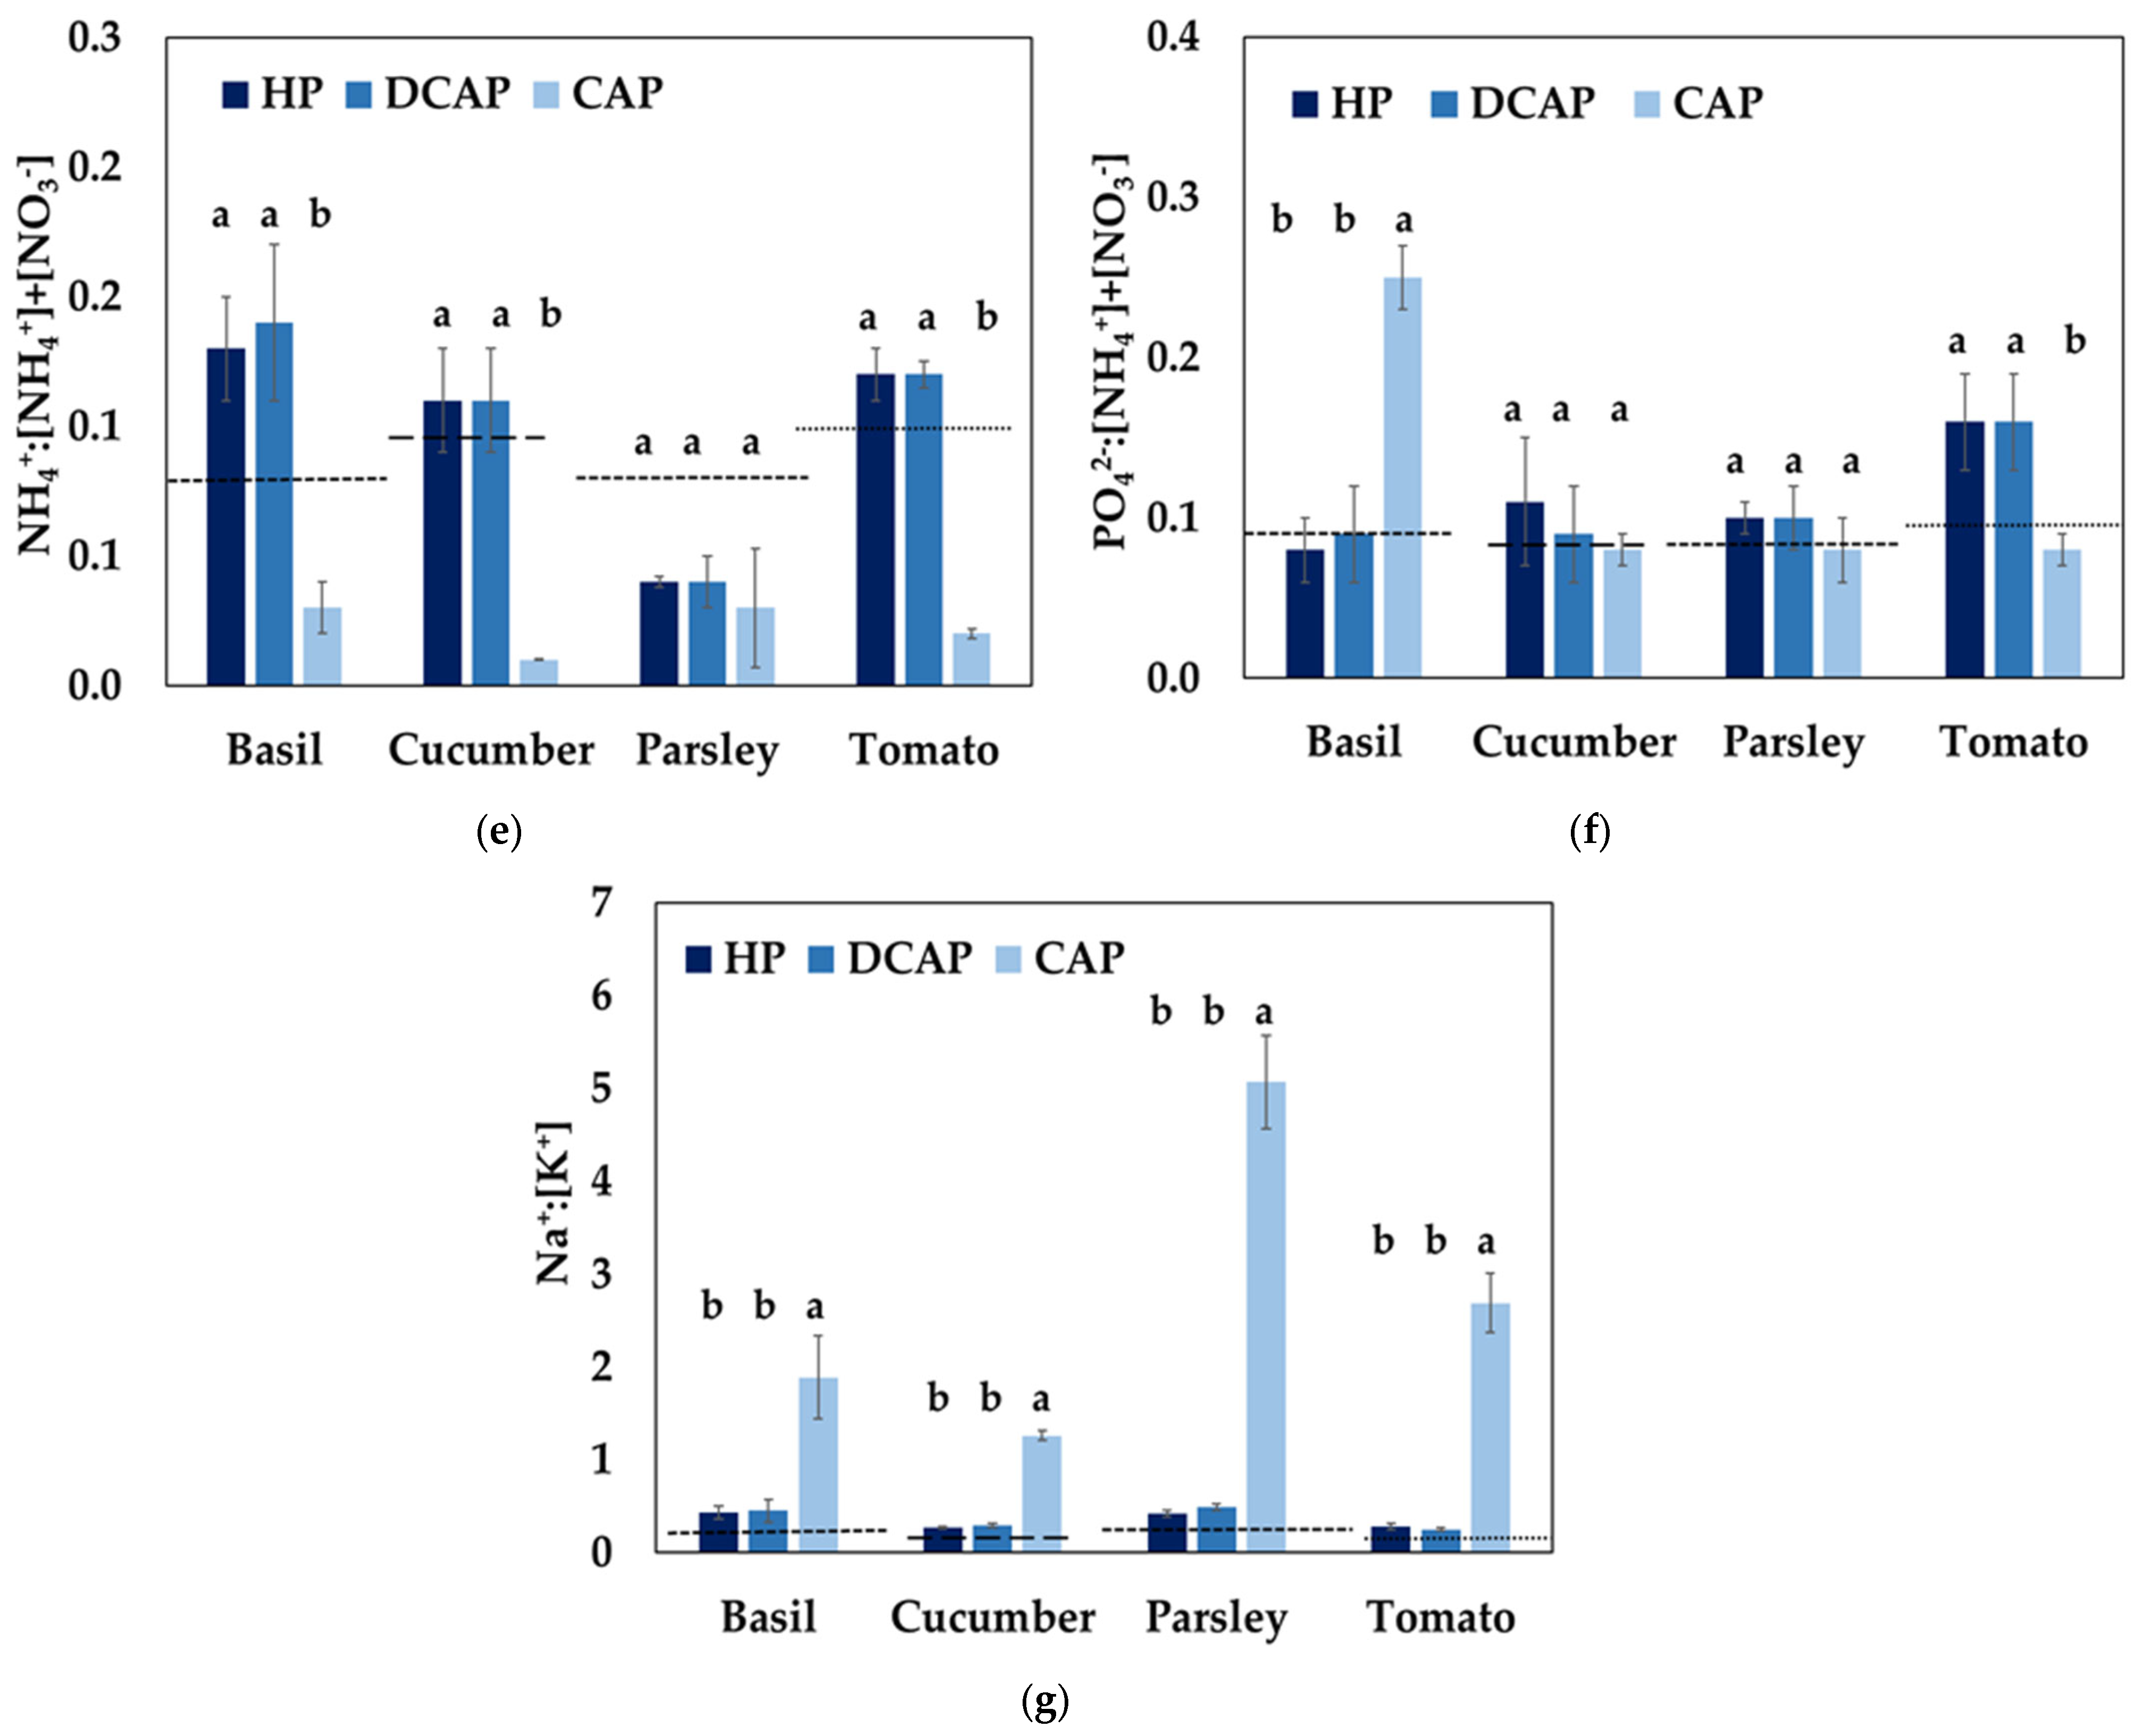
3.2. Nutrient Fluctuation in the System

In Table 3, the average nutrient concentrations for the different crops studied are presented. Magnesium appears to be the most abundant nutrient in all the studied crops. Especially in cucumber cultivation, the availability of magnesium overcame the recipe’s value. The greatest lack appeared in ammonium, whose availability was nearly zero. The fluctuation of all the other nutrients did not meet the desired concentrations, not even at the 50% availability level. The availability of nutrients in the RAS solution for all the cultivation periods can be expressed as follows: Mg2+ > Ca2+, NO3, and SO42− > PO42−, K+, Fe2+ > NH4+.
The mean values of the ratios of macronutrients studied in NS are presented for the different crops and treatments in Figure 5. The CAP nutrient solution presented a much lower ratio of K+: [K+] + [Ca2+] + [Mg2+] in contrast to the HP and DCAP solutions due to the lower potassium concentration in the RAS solution. The ratio of Ca2+: [K+] + [Ca2+] + [Mg2+] did not differ from the HP and DCAP solutions, while the ratio of Mg2+: [K+] + [Ca2+] + [Mg2+] was higher than HP and DCAP. This may be explained by the high concentration of magnesium observed in the RAS solution. Calcium and magnesium absorption are much higher than potassium absorption in CAP plants. The ratio of Na+: [K+] in all CAP nutrient solutions was much higher than the corresponding HP and DCAP, especially in parsley NS.
The ratio of total nitrogen to potassium (NH4+ + NO3: [K]) was calculated to be higher in CAP than in HP and DCAP solutions. This disproportion indicates that CAP plants are more sensitive at the fruity stage as nitrogen is supplied in much larger quantities compared to potassium. On the other hand, the calculated ratio of NH4+: [NH4+] + [NO3] was much lower than the standard one and the corresponding HP and DCAP. The nutrient solutions of the treatments did not differ notably in the ratio of PO42−: [NH4+] + [NO3]. Basil cultivation seems to perform a higher value of this ratio in CAP solution because of the treatment with phosphoric acid for pH control.
Table 4 and Table 5 show the average concentrations (±SD) of the main macronutrients (NO3−, PO42−, NH4+, K+, Ca2+) and Na+ (mg L−1) for the nutrient and drainage solutions, uptake concentration (mg L−1) and removal rate (mg g−1), according to the treatment and studied crop. As was expected, the nutrient concentration of the NS supplied to the CAP plants was close to the RAS settings of the system (Table 1). Most likely, differences may have occurred due to the remaining concentrations of nutrients in the tube network. The concentrations of nutrients in HP and DCAP nutrient solutions did not show significant differences, demonstrating the successful and accurate strategy of the DCAP treatment application. The removal rate index was used to predict the nutrient assimilation in plant tissues (Table 4 and Table 5). According to this index, the greater accumulation of macronutrients was confirmed by HP and DCAP plants. The greater sodium assimilation and phosphorus assimilation, mainly in basil crops, were predicted for the CAP treatment. The absorption concentration indicated sufficient nutrient assimilation only if the values were higher in the irrigated NS.

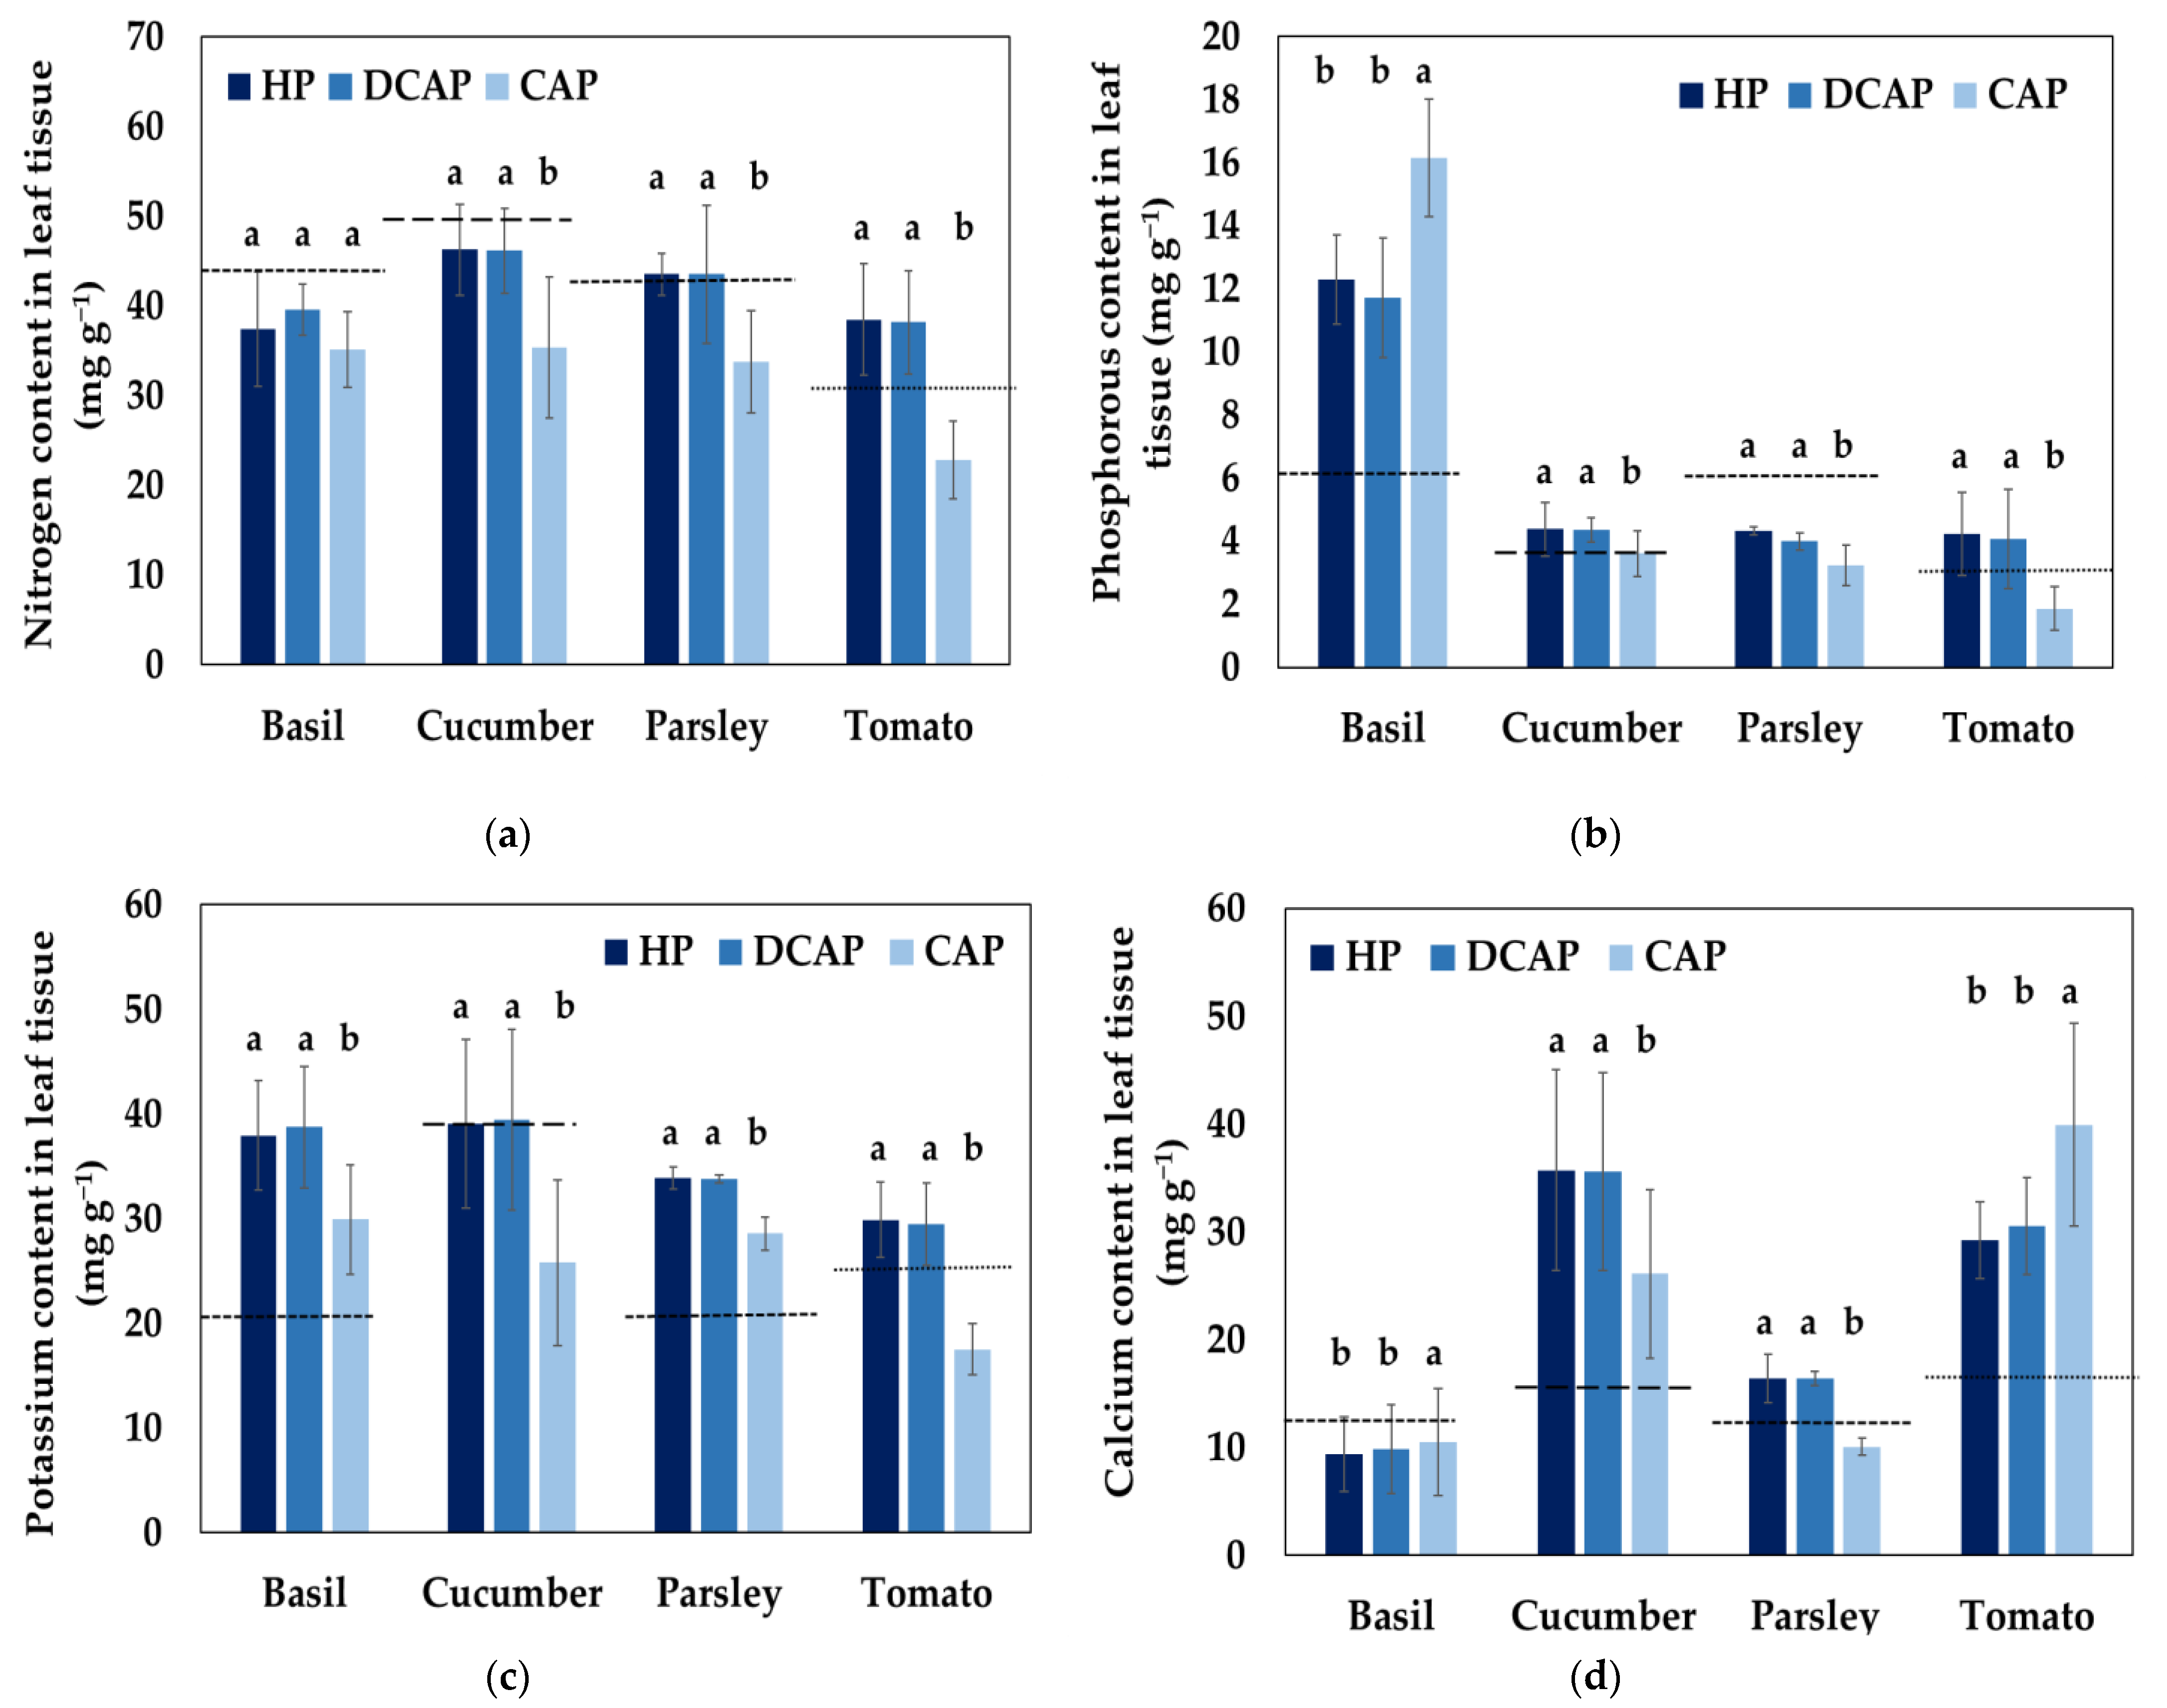
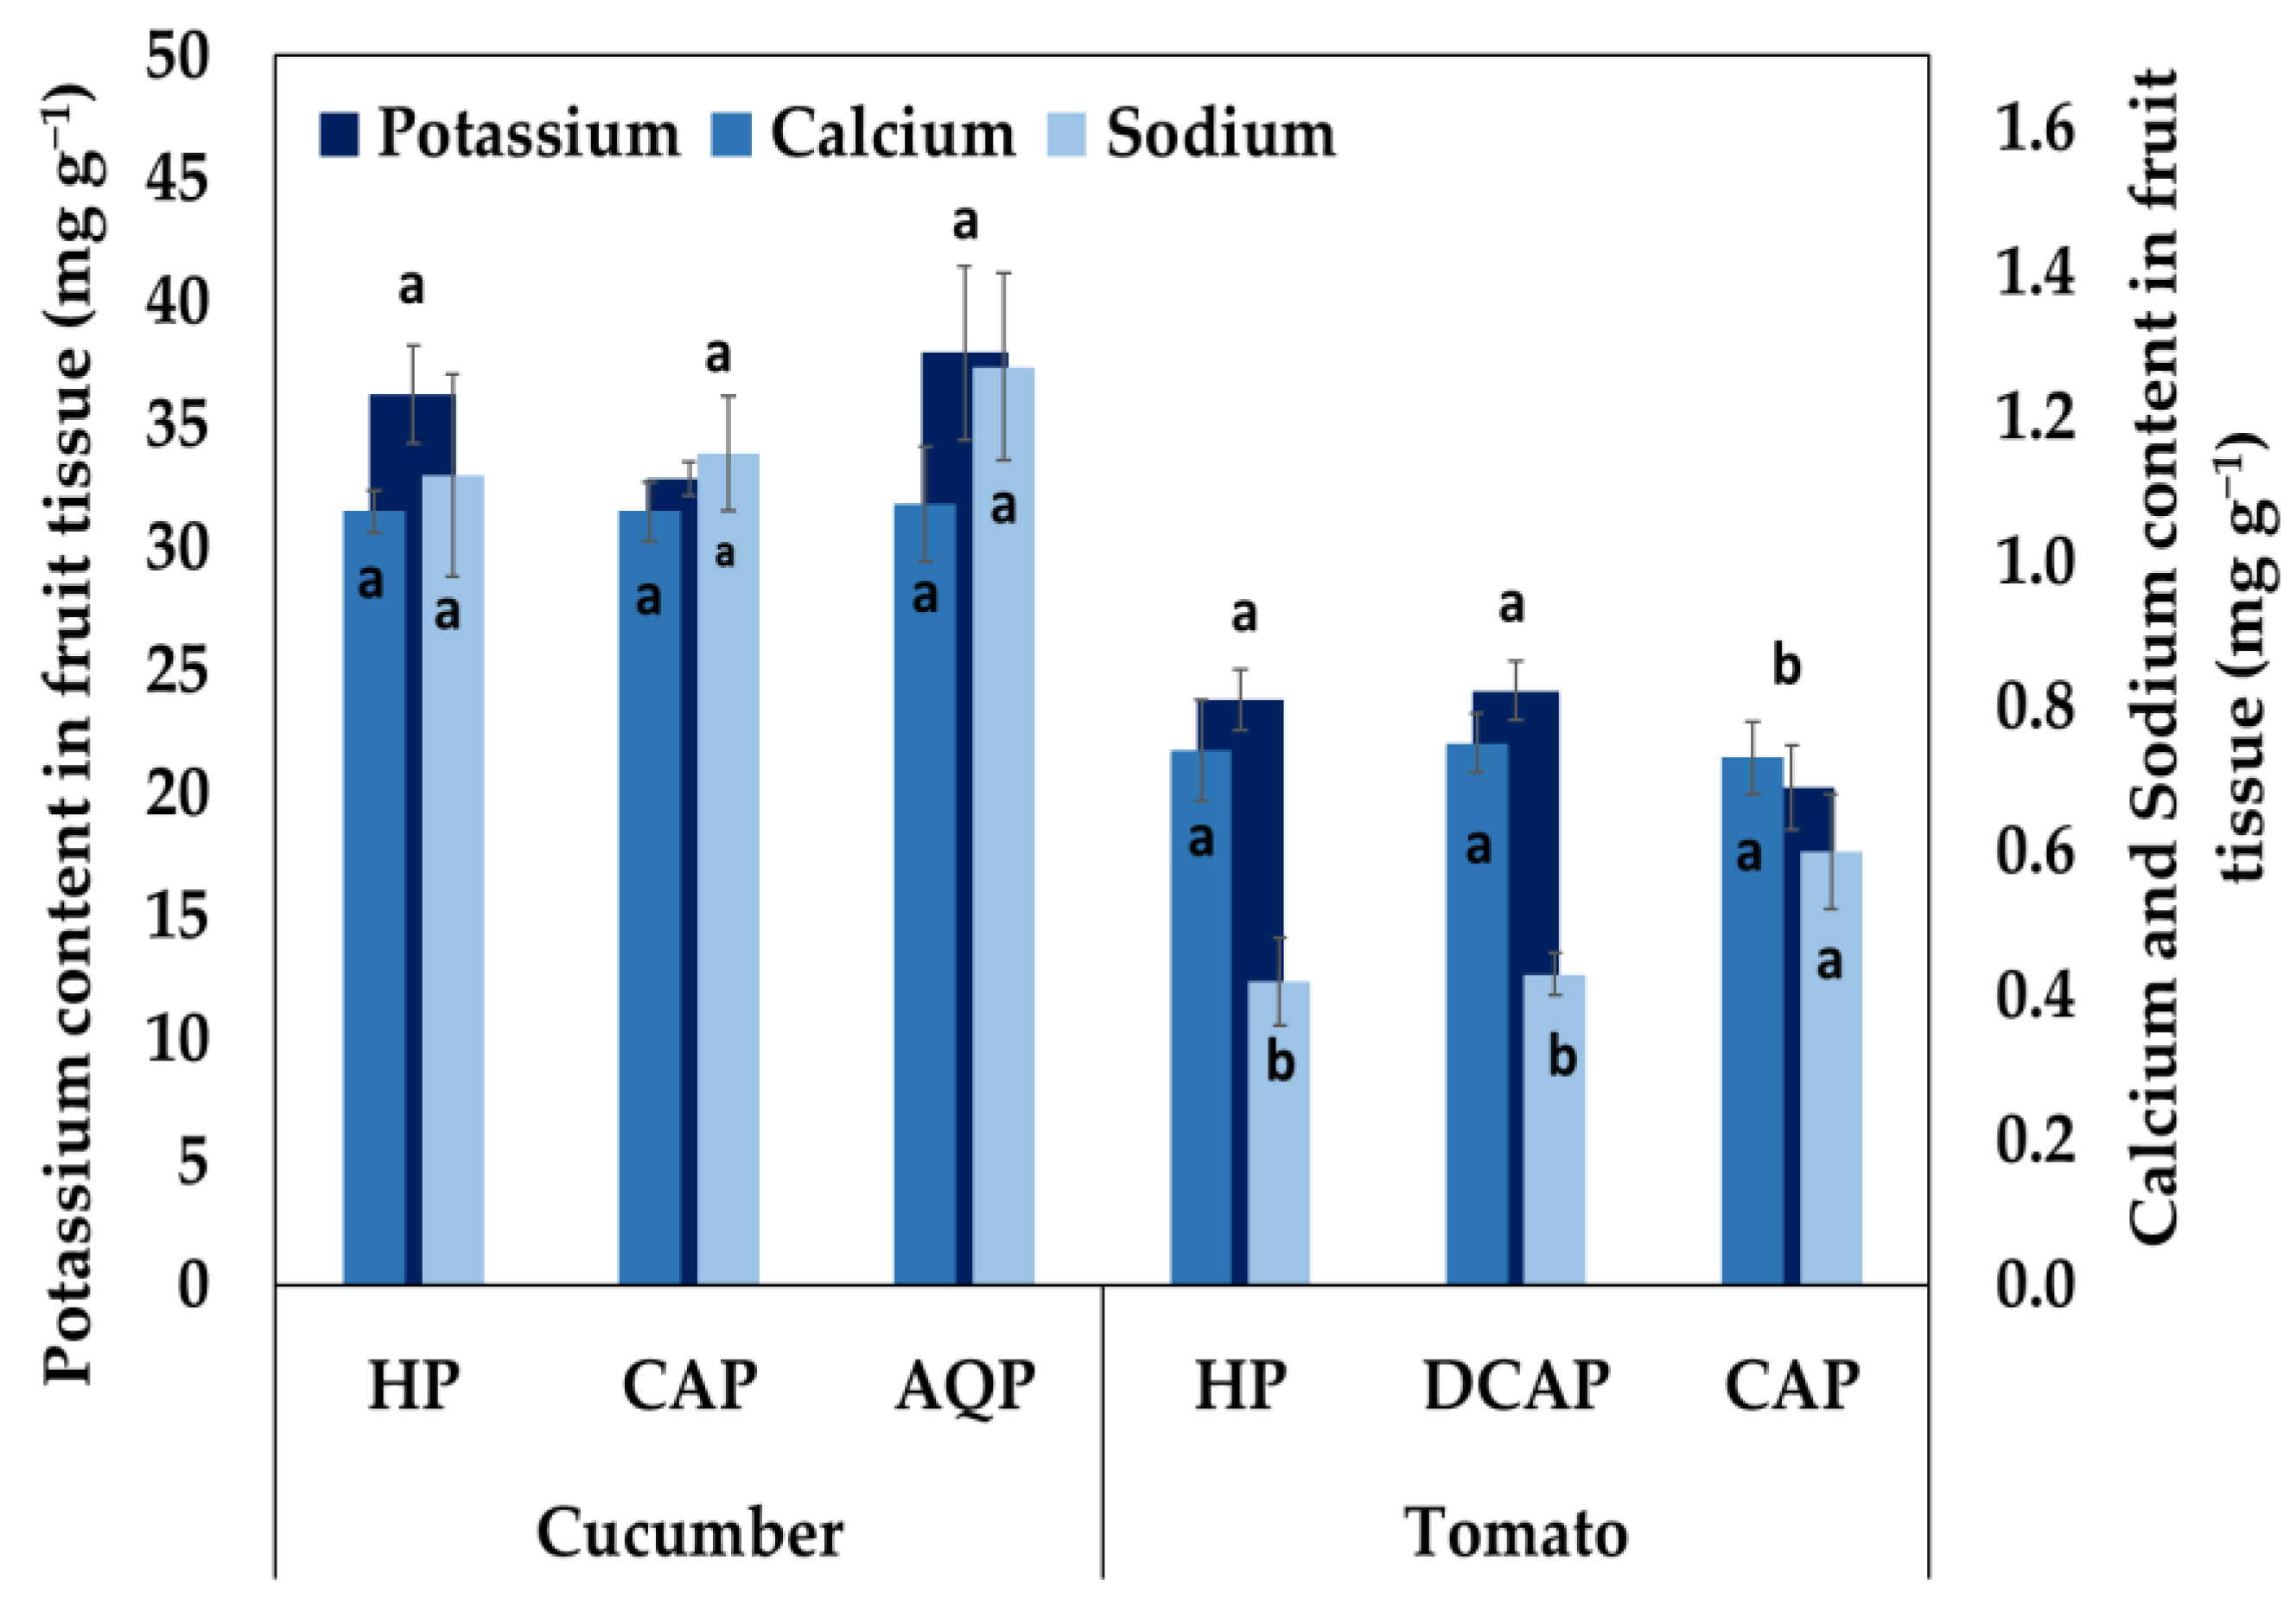
3.3. Nutrients in Leaf and Fruit Tissue

The nutrient concentrations obtained from the leaf sample analysis are presented in Figure 6. As expected, the CAP plants had the lowest nutrient content in the plant tissue among all the treatments because of the low nutrient levels in the NS. Certain elements, though, such as phosphorous in basil plants, calcium in tomato and basil plants, and sodium in cucumber, parsley, and tomato plants, overcame with statistical accuracy the corresponding contents of HP and DCAP plants. The greatest lack of nutrients during the cultivation periods appeared in tomato CAP plants in comparison to HP and DCAP plants, with a phosphorous percentage difference of 55%. Similarly, the greatest potassium deficiency among cultivation species was estimated for tomato CAP plants, which could be the reason for the greater content of calcium in leaf tissue and sodium in leaf and fruit tissue than HP and DCAP. There was no statistical difference among the treatments in the nitrogen content in basil tissue, which was attributed to the nitric acid implementation in CAP’s NS (p > 0.05). Hydroponic and DCAP plants did not show differences in nutrient contents in leaf and fruit tissues in the four cultivation periods.
Potassium, calcium, and sodium concentrations were similar in all studied cucumber treatments (Figure 7). On the contrary, tomato CAP fruits had lower potassium content than HP and DCAP, equal calcium content, and higher sodium content.

3.4. Nutrient Use Efficiency

Figure 8 presents the nutrient use efficiency (NUE) (%) of the main macronutrients according to treatment and studied crop. NUE demonstrated that CAP plants utilize nutrient inputs better than HP and DCAP plants. The exceptions are phosphorous in basil cultivation, where the concentration in NS and the content in leaf tissue were higher due to the implementation of phosphoric acid, but the CAP plants could not utilize it better than HP and DCAP plants because of the other nutrient deficiencies. Secondly, sodium demonstrated a lower NUE in basil, parsley, and cucumber. The sodium concentration in NS and the content in leaf tissue did not differ statistically, so the only parameter is the dry biomass, which is greater in the HP and DCAP treatments. On the contrary, in the tomato case, the accumulation of sodium in leaf tissue is greater in CAP plants than in HP and DCAP, so the NUE is higher. In the cases of P, N, and K, the high values of NUE are correlated with the sufficiently high uptake values observed in Table 4 and Table 5. In the case of Ca and Na, however, the NUE was higher, although the uptake concentration was lower than the imposed NS. It is noteworthy that DCAP plants had higher NUE than HP in nitrogen, phosphorous, and potassium in all cultivations except for the tomato.

4. Discussion

The efficiency of the systems was assessed by the respective pH and EC variations. The lowest EC limit for a nutrient solution must be at least 1 dS m−1 [51,52]. Otherwise, plants suffer from nutrient disorders, mainly from nitrogen. A mineral deficiency was also confirmed by the current study in the plants of the CAP treatment since the EC level (0.83 ds m−1–0.98 ds m−1) did not meet the required specifications. Subsequently, the implementation of fertilizers is fundamental, up to an electrical conductivity of 1 dS m−1 in CAP treatment, to ensure the completion of the basic functions of the plants. Other researchers have mentioned the need to add fertilizer since they found low concentrations of functional nutrients [5,53,54,55].
On the other hand, the effectiveness of the current DCAP system is evident from the ideal conditions that prevailed in both the hydroponic and aquaculture systems. Indeed, the pH of NS for all crops examined was within the acceptable range of 5.5 to 6.5 [56]. Similarly, the pH values in the aquaculture solution correspond to the optimum level required for tilapia cultures 6–9 [57] and for the nitrification process by aerobic bacteria 7–8 [58,59]. The EC value of DCAP treatment corresponded to the same privilege of decoupled systems as the hydroponic recipes. Subsequently, no compromises have to be made in the DCAP system in terms of optimal production parameters for fish, bacteria, and plants, and animal welfare principles are preserved.

4.1. Nutrient Quality Assessment

Based on the nutrient concentrations, the CAP system showed the lowest concentration of most of the elements (90%–99 lower in comparison to the hydroponic recipe). Many researchers have also found a low concentration of nitrogen, phosphorous, and potassium in the CAP NS, unable to cover the actual plant needs, leading, in turn, to low yields [12,60,61]. In this sense, the CAP plants in this study assimilated less nitrogen, phosphorous, and potassium than HP and DCAP plants. The iron element has been characterized as one of the most limited micronutrients in aquaponics [7,25,39] and affects both the plant’s physiology and morphology [62]. Furthermore, it is declared that ammonium toxicity for plants can occur at concentrations as low as 1.8 ± 9 mg L−1 [63]. In the current research, the CAP nutrient solutions of cucumber, parsley, and tomato were 0.88 mg L−1, 0.57 mg L−1, and 0.11 mg L−1, respectively.
Magnesium, on the other hand, appeared to be the most abundant nutrient in all the crops studied in this research in comparison to the HP and DCAP systems. Calcium, nitrate, and sulfur represent the next most available nutrients in comparison to the hydroponic recipes. Kloas et al. [5] agree with calcium sufficiency for basil growth, while another research [54] demonstrated similarly sufficient calcium and sulfur. On the contrary, Cani et al. [64] found that magnesium was deficient in the nutrient solution, and Cerozi and Fitzsimmons [65] encountered magnesium deficiency when applying foliar fertilizers to lettuce plants.
In the prototype DCAP system, the RAS synthesis was significantly improved from 58% to 96% in most of the macronutrients. However, to evaluate the systems, there is a need to study the ion rations performed in the imposed NS. Sonneveld and Voogt [51] demonstrate that the ratio of nutrients in the nutrient solution can be more critical for plant growth than the availability of each nutrient separately.
According to the results of this study, the CAP nutrient solution demonstrated not only a low potassium concentration and a low K+: Ca2+ (67%) ratio but also a high Mg: K (71%) ratio, parameters that disturb potassium absorption. If there is a high Mg2+: K+ ratio, the value of pH at the root zone is increased [30,66], as shown in this study (Table 2). Huett [67] declares that the absorption of potassium declines as the EC, or the ratio of K+: Ca2+, declines. Furthermore, plants prefer sodium uptake over potassium uptake if the concentration is higher because of their antagonism for root entry [66]. This was a predictable phenomenon in this study since the Na+: K+ ratio in CAP NS was 83% greater than HP’s and DCAP’s, respectively.
The NH4+: [NH4+] + [NO3] ratio in CAP NS was detected to be 64%, 86%, and 66% lower than the ideal for leafy, cucumber, and tomato crops, respectively. When the uptake of cations (NH4+) exceeds that of anions (NO3), the pH in the root environment decreases, and vice versa [68]. For that reason, the CAP drainage solution always performed at a higher pH value than the inserted nutrient solution, as ammonium concentration was the most deficient in all crop cases (Table 2). Nevertheless, the optimum level of NH4+ concentration in aquaculture solution for tilapia fluctuates to 1.1 mg L−1 [69], so it is obvious that an aquaculture system with high welfare status can never promote the ideal ratio of NH4:NO3 to any crop cultivation, and so the addition of ammonium fertilizer in the nutrient solution of the plants is crucial.
The effect of these detected disorders is defined by the CAP leaf tissue analysis. In terms of potassium content, the values of CAP were lower than those of HP and DCAP plants in all crop cases. Additionally, sodium and calcium contents in CAP tissue exceeded the respective values of HP and DCAP, especially in the tomato case, with 44% higher sodium and 24% higher calcium leaf content than the other treatments. Researchers confirm that CAP basil and tomato plants have higher calcium and sodium content than HP, with high sodium causing slow death to the plant [70,71], while a high ratio of Na: K decreases plant growth and finally brings toxicity [72]. To avoid the toxicity effects of sodium, its concentration in the nutrient solution must be lower than 34.5 mg L−1 [68].
Subsequently, the nutrient deficiencies (N, P, and K+) or toxicities (NH4+, Na+) and ratio disorders (Mg2+: K+, Na+: K+, NH4+: [NH4+] + [NO3]) in the CAP solution are expected to have a strong impact on the nutrient content in plant tissue. Nevertheless, the nutrient assimilation of CAP plants did not deviate sharply from the optimum ranges in the case of the leafy plants. Geisenhoff et al. [73] consider that plants with a short biological cycle, like lettuce, do not need fertilizer additions for good plant performance. Fruit-bearing vegetables, on the other hand, performed lower than the critical levels of nutrient content, mainly in potassium and nitrogen. Tomato CAP plants showed an especially decreased phosphorous absorption (38%) and supraoptimal calcium absorption (62%), indicating the importance of potassium presence in tomato nutrient solution [74]. However, CAP fruit content (marketable product) in nutrients does not seem to differ significantly from HP and DCAP, except for potassium in tomato fruits.
Nutrient content in leaf and fruit tissue of DCAP plants, on the other hand, showed no statistical differences with HP for all the cultivation periods. These results are in agreement with research [75,76] for basil plants and for lettuce [9] as well. Graber and Junge [25] demonstrated higher potassium content in HP tomato fruits (40.8 g kg−1) than in DCAP (22 g kg−1). Nevertheless, it is realized that this result comes from the 45 times lower potassium concentration in the NS of the DCAP treatment than the HP’s. So, it is obviously derived that just the implementation of fertilizers in RAS solution does not support the ideal application of DCAP treatment, and the precise measurement of all nutrient concentrations is required as applied in this study.

4.2. Systems Evaluation Based on the Nutrient Use Efficiency

The NUE is an indicator that shows the nutrient efficiency of agricultural systems. The higher the value, the more effective the system is, and the less nutrients are released into the environment. In the current research, NUE is defined as being greater in CAP plants than in HP and DCAP. Yang and Kim [70] concluded for the first time that aquaponic treatment can utilize nitrogen and phosphorous elements in a better way, demonstrating better NUE values. Nevertheless, this phenomenon is more accurate if the NUE of both fish and plants is included in the CAP NUE calculation. Aquaponic phosphorous use efficiency in CAP was always higher than HP, either with whole plants or with fish and plants, respectively. In this study, the NUE of CAP plants was always higher than that of HP and DCAP plants for nitrogen, phosphorous, potassium, and calcium, except for phosphorous in basil crops and sodium in basil, cucumber, and parsley crops. The higher NUE of CAP plants indicates their ability to utilize nutrients in a better way, reducing nutrient supply and subsequently minimizing the environmental impact of nutrients in drainage solutions.
DCAP plants also performed better than HP plants for nitrogen, phosphorous, and potassium NUE, confirming that nitrate assimilated by plants in aquaponic systems increases the NUE [77]. It seems that the RAS solution has a special composition that promotes plant nutrient use efficiency. Delaide [78] assumed that two factors in RAS solution stimulate nutrient uptake: dissolved organic matter (DOM) and plant growth-promoting rhizobacteria and/or fungi (PGPR and/or PGPF). It has been observed that DCAP treatment preserved the unique property of RAS solution even after the implementation of fertilizers and overcame the impact of HP on plant nutrient use efficiency.
In summary, aquaponics has exciting, tangible potential, especially the decoupled systems; however, there are still some issues that need to be solved in order to integrate the hydroponic subsystems with the aquaculture one to maximize nutrient utilization efficiency. More culture and nutrient strategies are urgently needed in order to cover the actual needs of the plants with the least environmental impact. A series of nutrient sensors should be added to the system in order to automate the process of nutrient preparation. Adaptation of software that controls the system and the nutrient fluctuations will undoubtedly offer automation and great welfare conditions for both plants and fish. Moreover, there is currently no policy to subsidize the initial investment in the construction of aquaponics. There are also problems, such as a lack of understanding of the new method, uncertainty about its benefits, and concerns about health risks for consumers. Without know-how and policy support, farmers cannot afford the cost of large-scale production, which limits the development of aquaponics.

5. Conclusions

In the current study, the nutrient balance and the use efficiency of coupled and decoupled aquaponics were studied and compared with the conventional hydroponic system. To our knowledge, it was the first time that coupled and decoupled aquaponic and hydroponic systems were tested under the same environmental conditions in a pilot-scale greenhouse system using a perlite substrate and drip irrigation system. According to the results, in the CAP treatment, only the leafy plants managed to absorb a sufficient amount of nutrients close to optimum levels, although the plants were irrigated with poor NS. On the other hand, the fruit-bearing vegetables performed poorly in terms of nutrient assimilation, with the possibility of negatively affecting the yield. All the crops in the CAP system, however, had the least impact on the environment among the systems with the highest NUE values. In the DCAP system, both leafy and fruit-bearing vegetables absorbed sufficient amounts of nutrients close to optimum levels. The special composition of the RAS solution highlighted DCAP treatment with ideal nutrient assimilation and greater nutrient use efficiency than HP. Meanwhile, the environmental impact of the DCAP system was lower than in conventional hydroponics. Improving the fertigation management strategies applied in the DCAP system, the environmental impact can be further improved by reaching the CAP level. It is, thus, concluded that the application of the DCAP system is the key to aquaponic evolution in the future.

Author Contributions

Conceptualisation, N.K.; methodology, N.K., E.L. and E.M.; formal analysis, M.A. and A.E.; investigation, M.A., A.M. and N.K.; resources, N.K.; data curation, M.A. and A.E.; writing—original draft preparation, M.A., A.E. and N.K.; writing—review and editing, M.A., A.E. and N.K.; supervision, N.K.; project administration, N.K.; funding acquisition, N.K. All authors have read and agreed to the published version of the manuscript.

Funding

This research has been co-financed by the European Union and Greek national funds through the Operational Program Competitiveness, Entrepreneurship and Innovation, under the call RESEARCH–CREATE–INNOVATE (project code: T1EDK-01153, Acronym: FoodOASIS). The research work of the Ph.D. student Maria Aslanidou has been conducted in the operating framework of the Center of Research Innovation and Excellence of the University of Thessaly (Invitation to submit applications for the grant of scholarships to doctoral candidates of the University of Thessaly) and was funded by the Special Account of Research Grants of University of Thessaly).

Institutional Review Board Statement

The experimental protocol was approved by the Ethics Committee of the Region of Thessaly, Veterinary Directorate, Department of Animal Protection-Medicines-Veterinary applications (number 6/28-01-2021) and conducted at the registered experimental facility (EL-43BIO/exp-02) at the University of Thessaly.

Data Availability Statement

Data is contained within the article.

Conflicts of Interest

The authors declare no conflict of interest.

References

  1. Palm, H.W.; Knaus, U.; Appelbaum, S.; Goddek, S.; Strauch, S.M.; Vermeulen, T.; Kotzen, B. Towards commercial aquaponics: A review of systems, designs, scales and nomenclature. Aquac. Int. 2018, 26, 813–842. [Google Scholar] [CrossRef]
  2. Naegel, L.C. Combined production of fish and plants in recirculating water. Aquaculture 1977, 10, 17–24. [Google Scholar] [CrossRef]
  3. Lewis, W.M.; Yopp, J.H.; Schramm, H.L., Jr.; Brandenburg, A.M. Use of hydroponics to maintain quality of recirculated water in a fish culture system. Trans. Am. Fish. Soc. 1978, 107, 92–99. [Google Scholar] [CrossRef]
  4. Goddek, S.; Joyce, A.; Kotzen, B.; Burnell, G.M. Aquaponics Food Production Systems: Combined Aquaculture and Hydroponic Production Technologies for the Future; Springer Nature: Berlin/Heidelberg, Germany, 2019; p. 619. [Google Scholar]
  5. Kloas, W.; Groß, R.; Baganz, D.; Graupner, J.; Monsees, H.; Schmidt, U.; Rennert, B. A new concept for aquaponic systems to improve sustainability, increase productivity, and reduce environmental impacts. Aquac. Environ. Interact. 2015, 7, 179–192. [Google Scholar] [CrossRef]
  6. Rahman, S. Effluent Water Characterization of Intensive Tilapia Culture Units and Its Application in an Integrated Lettuce Aquaponic Production Facility. Ph.D. Thesis, Auburn University, Auburn, AL, USA, 2010. [Google Scholar]
  7. Rakocy, J.E.; Masser, M.P.; Losordo, T.M. Recirculating aquaculture tank production systems: Aquaponics–integrating fish and plant culture. SRAC Publ. 2006, 454, 1–16. [Google Scholar]
  8. Suhl, J.; Baganz, D.; Kloas, W.; Dannehl, D.; Jobs, S.; Scheibe, G.; Schmidt, U. The potential of double recirculating aquaponic systems for intensive tomato production. In Proceedings of the III International Symposium on Horticulture in Europe-SHE2016 1242, Crete, Greece, 17–21 October 2016; pp. 679–686. [Google Scholar]
  9. Monsees, H.; Suhl, J.; Paul, M.; Kloas, W.; Dannehl, D.; Würtz, S. Lettuce (Lactuca sativa, variety Salanova) production in decoupled aquaponic systems: Same yield and similar quality as in conventional hydroponic systems but drastically reduced greenhouse gas emissions by saving inorganic fertilizer. PLoS ONE 2019, 14, e0218368. [Google Scholar] [CrossRef]
  10. Andriani, Y.; Dhahiyat, Y.; Zahidah, Z.; Zidni, I. The effect of stocking density ratio of fish on water plant productivity in aquaponics culture system. Nusant. Biosci. 2017, 9, 31–35. [Google Scholar] [CrossRef]
  11. Quilleré, I.; Roux, L.; Marie, D.; Roux, Y.; Gosse, F.; Morot-Gaudry, J.F. An artificial productive ecosystem based on a fish/bacteria/plant association. 2. Performance. Agric. Ecosyst. Environ. 1995, 53, 19–30. [Google Scholar] [CrossRef]
  12. Roosta, H.R. Effects of foliar spray of K on mint, radish, parsley and coriander plants in aquaponic system. J. Plant Nutr. 2014, 37, 2236–2254. [Google Scholar] [CrossRef]
  13. Castillo-Castellanos, D.; Zavala-Leal, I.; Ruiz-Velazco, J.M.J.; Radilla-García, A.; Nieto-Navarro, J.T.; Romero-Bañuelos, C.A.; González-Hernández, J. Implementation of an experimental nutrient film technique-type aquaponic system. Aquac. Int. 2016, 24, 637–646. [Google Scholar] [CrossRef]
  14. Sutton, R.J.; Lewis, W.M. Further observations on a fish production system that incorporates hydroponically grown plants. Progress. Fish-Cult. 1982, 44, 55–59. [Google Scholar] [CrossRef]
  15. Zou, Y.; Hu, Z.; Zhang, J.; Xie, H.; Liang, S.; Wang, J.; Yan, R. Attempts to improve nitrogen utilization efficiency of aquaponics through nitrifies addition and filler gradation. Environ. Sci. Pollut. Res. 2016, 23, 6671–6679. [Google Scholar] [CrossRef] [PubMed]
  16. Fernández-Cabanás, V.M.; Pérez-Urrestarazu, L.; Juárez, A.; Kaufman, N.T.; Gross, J.A. Comparative analysis of horizontal and vertical decoupled aquaponic systems for basil production and effect of light supplementation by LED. Agronomy 2020, 10, 1414. [Google Scholar] [CrossRef]
  17. Rakocy, J.E. Integration of vegetable hydroponics with fish culture: A review. Tech. Mod. Aquac. 1993, 112–136. [Google Scholar] [CrossRef]
  18. Wortman, S.E. Crop physiological response to nutrient solution electrical conductivity and pH in an ebb-and-flow hydroponic system. Sci. Hortic. 2015, 194, 34–42. [Google Scholar] [CrossRef]
  19. Diem, T.N.T.; Konnerup, D.; Brix, H. Effects of recirculation rates on water quality and Oreochromis niloticus growth in aquaponic systems. Aquac. Eng. 2017, 78, 95–104. [Google Scholar] [CrossRef]
  20. Al Tawaha, A.R.; Wahab, P.E.M.; Jaafar, H.B.; Zuan, A.T.K.; Hassan, M.Z. Effects of fish stocking density on water quality, growth performance of tilapia and yield of butterhead Lettuce grown in decoupled recirculation aquaponic systems. J. Ecol. Eng. 2021, 22, 8–19. [Google Scholar] [CrossRef]
  21. Knaus, U.; Palm, H.W. Effects of fish biology on ebb and flow aquaponical cultured herbs in northern Germany (Mecklenburg Western Pomerania). Aquaculture 2017, 466, 51–63. [Google Scholar] [CrossRef]
  22. Colt, J. Water quality requirements for reuse systems. Aquac. Eng. 2006, 34, 143–156. [Google Scholar] [CrossRef]
  23. Monsees, H.; Keitel, J.; Paul, M.; Kloas, W.; Wuertz, S. Potential of aquacultural sludge treatment for aquaponics: Evaluation of nutrient mobilization under aerobic and anaerobic conditions. Aquac. Environ. Interact. 2017, 9, 9–18. [Google Scholar] [CrossRef]
  24. Goddek, S.; Delaide, B.; Mankasingh, U.; Ragnarsdottir, K.V.; Jijakli, H.; Thorarinsdottir, R. Challenges of sustainable and commercial aquaponics. Sustainability 2015, 7, 4199–4224. [Google Scholar] [CrossRef]
  25. Graber, A.; Junge, R. Aquaponic Systems: Nutrient recycling from fish wastewater by vegetable production. Desalination 2009, 246, 147–156. [Google Scholar] [CrossRef]
  26. Vergote, N.; Vermeulen, J. Recirculation aquaculture system (RAS) with tilapia in a hydroponic system with tomatoes. In Proceedings of the XXVIII International Horticultural Congress on Science and Horticulture for People (IHC2010): International Symposium on 927, Lisbon, Portugal, 22–27 August 2010; pp. 67–74. [Google Scholar]
  27. Villaverde, S.; Garcia-Encina, P.A.; Fdz-Polanco, F. Influence of pH over nitrifying biofilm activity in submerged biofilters. Water Res. 1997, 31, 1180–1186. [Google Scholar] [CrossRef]
  28. Tyson, R.V.; Simonne, E.H.; Treadwell, D.D.; White, J.M.; Simonne, A. Reconciling pH for ammonia biofiltration and cucumber yield in a recirculating aquaponic system with perlite biofilters. HortScience 2008, 43, 719–724. [Google Scholar] [CrossRef]
  29. Webster, C.D.; Lim, C. (Eds.) Tilapia: Biology, Culture, and Nutrition; CRC Press: Boca Raton, FL, USA, 2006. [Google Scholar]
  30. Pickens, J. Integrating Effluent from Recirculating Aquaculture Systems with Greenhouse Cucumber and Tomato Production. Ph.D. Thesis, Auburn University, Auburn, AL, USA, 2015. [Google Scholar]
  31. Suhl, J.; Dannehl, D.; Baganz, D.; Schmidt, U.; Kloas, W. An innovative suction filter device reduces nitrogen loss in double recirculating aquaponic systems. Aquac. Eng. 2018, 82, 63–72. [Google Scholar] [CrossRef]
  32. Yep, B.; Zheng, Y. Aquaponic trends and challenges—A review. J. Clean. Prod. 2019, 228, 1586–1599. [Google Scholar] [CrossRef]
  33. Schmautz, Z.; Loeu, F.; Liebisch, F.; Graber, A.; Mathis, A.; Griessler Bulc, T.; Junge, R. Tomato productivity and quality in aquaponics: Comparison of three hydroponic methods. Water 2016, 8, 533. [Google Scholar] [CrossRef]
  34. Nichols, M.A.; Savidov, N.A. Aquaponics: A nutrient and water efficient production system. In Proceedings of the II International Symposium on Soilless Culture and Hydroponics 947, Puebla, Mexico, 15–19 May 2011; pp. 129–132. [Google Scholar]
  35. Monsees, H.; Kloas, W.; Wuertz, S. Decoupled systems on trial: Eliminating bottlenecks to improve aquaponic processes. PLoS ONE 2017, 12, e0183056. [Google Scholar] [CrossRef] [PubMed]
  36. Delaide, B.; Teerlinck, S.; Decombel, A.; Bleyaert, P. Effect of wastewater from a pikeperch (Sander lucioperca L.) recirculated aquaculture system on hydroponic tomato production and quality. Agric. Water Manag. 2019, 226, 105814. [Google Scholar] [CrossRef]
  37. Rodgers, D.; Won, E.; Timmons, M.B.; Mattson, N. Complementary Nutrients in Decoupled Aquaponics Enhance Basil Performance. Horticulturae 2022, 8, 111. [Google Scholar] [CrossRef]
  38. Savidov, N.; Brooks, A.B. Evaluation and Development of Aquaponics Production and Product Market Capabilities in Alberta; Crop Diversification Centre South, Alberta Agriculture, Food and Rural Development: Brooks, AB, Canada, 2004. [Google Scholar]
  39. Roosta, H.R.; Hamidpour, M. Effects of foliar application of some macro-and micro-nutrients on tomato plants in aquaponic and hydroponic systems. Sci. Hortic. 2011, 129, 396–402. [Google Scholar] [CrossRef]
  40. Pattillo, D.A.; Foshee, W.G.; Blythe, E.K.; Pickens, J.; Wells, D.; Monday, T.A.; Hanson, T.R. Performance of aquaculture effluent for tomato production in outdoor raised beds. HortTechnology 2020, 30, 624–631. [Google Scholar] [CrossRef]
  41. Savidov, N.A.; Hutchings, E.; Rakocy, J.E. Fish and plant production in a recirculating aquaponic system: A new approach to sustainable agriculture in Canada. In Proceedings of the International Conference and Exhibition on Soilless Culture: ICESC 2005 742, Singapore, 5–8 September 2005; pp. 209–221. [Google Scholar]
  42. Cooper, A. The ABC of NFT. Nutrient Film Technique; Grower Books: New York, NY, USA, 1979. [Google Scholar]
  43. Katsoulas, N.; Savvas, D.; Kitta, E.; Bartzanas, T.; Kittas, C. Extension and evaluation of a model for automatic drainage solution management in tomato crops grown in semi-closed hydroponic systems. Comput. Electron. Agric. 2015, 113, 61–71. [Google Scholar] [CrossRef]
  44. Savvas, D. Soilless Crops: Hydroponics, Substrates; Agrotypos Press: Athens, Greece, 2011. [Google Scholar]
  45. Vainshtein, E.E.; Lebedev, V.I. New determinations of Li, Na, K, Rb, Cs, Ca, and Sr in standards W-1 and G-1 by flame photometry. Geochemistry 1961, 10, 386–388. [Google Scholar]
  46. APHA. Standard Methods of Water and Wastewater, 21st ed.; American Public Health Association: Washington, DC, USA, 2005; pp. 2–61. ISBN 0875530478. [Google Scholar]
  47. Kjeldahl, C. A new method for the determination of nitrogen in organic matter. Z. Anal. Chem. 1883, 22, 366. [Google Scholar] [CrossRef]
  48. Jones, J.B. Hydroponic Cropping; CRC Press: Boca Raton, FL, USA, 2005. [Google Scholar]
  49. Silva, J.A.; Uchida, R.S. Plant Nutrient Management in Hawaii’s Soils: Approaches for Tropical and Subtropical Agriculture; University of Hawaii: Honolulu, HI, USA, 2000. [Google Scholar]
  50. Owen, W.G.; Cockson, P.; Henry, J.; Whipker, B.; Currey, C.J. Basil (Ocimum basilicum). e-Gro Nutr. Monit. 2018, 1, 7. [Google Scholar]
  51. Sonneveld, C.; Voogt, W. Plant nutrition in future greenhouse production. In Plant Nutrition of Greenhouse Crops; Springer: Dordrecht, The Netherlands, 2009; pp. 393–403. [Google Scholar]
  52. Samarakoon, U.C.; Weerasinghe, P.A.; Weerakkody, W.A.P. Effect of electrical conductivity (EC) of the nutrient solution on nutrient uptake, growth and yield of leaf lettuce (Lactuca sativa L.) in stationary culture. Trop. Agric. Res. 2006, 18, 13. [Google Scholar]
  53. Blidariu, F.; Radulov, I.; Lalescu, D.; Drasovean, A.; Grozea, A. Evaluation of nitrate level in green lettuce conventional grown under natural conditions and aquaponic system. Anim. Sci. Biotechnol. 2013, 46, 244–250. [Google Scholar]
  54. Bittsanszky, A.; Uzinger, N.; Gyulai, G.; Mathis, A.; Junge, R.; Villarroel, M.; Kőmíves, T. Nutrient supply of plants in aquaponic systems. Ecocycles 2016, 2, 17–20. [Google Scholar] [CrossRef]
  55. Tsoumalakou, E.; Mente, E.; Kormas, K.A.; Katsoulas, N.; Vlahos, N.; Kapsis, P.; Levizou, E. Precise monitoring of lettuce functional responses to minimal nutrient supplementation identifies aquaponic system’s nutrient limitations and their time-course. Agriculture 2022, 12, 1278. [Google Scholar] [CrossRef]
  56. Resh, H.M. Hydroponic Food Production: A Definitive Guidebook for the Advanced Home Gardener and the Commercial Hydroponic Grower; CRC Press: Boca Raton, FL, USA, 2012. [Google Scholar]
  57. Popma, T.; Masser, M. Tilapia Life History and Biology; Publication No. 283; Southern Regional Aquaculture Center: Stoneville, MS, USA, 1999. [Google Scholar]
  58. Masser, M.P.; Rakocy, J.; Losordo, T.M. Recirculating aquaculture tank production systems. In Management of Recirculating Systems; SRAC Publication 452; Southern Regional Aquaculture Center: Stoneville, MS, USA, 1999. [Google Scholar]
  59. Rakocy, J.E.; Bailey, D.S.; Shultz, R.C.; Thoman, E.S. Update on tilapia and vegetable production in the UVI aquaponic system. In New Dimensions on Farmed Tilapia: Proceedings of the Sixth International Symposium on Tilapia in Aquaculture, Manila, Philippines, 12–16 September 2004; Creative Unlimited: Somerset, NJ, USA, 2004; pp. 12–16. [Google Scholar]
  60. Guadagnin, S.G.; Rath, S.; Reyes, F.G.R. Evaluation of the nitrate content in leaf vegetables produced through different agricultural systems. Food Addit. Contam. 2005, 22, 1203–1208. [Google Scholar] [CrossRef] [PubMed]
  61. Adler, P.R.; Summerfelt, S.T.; Glenn, D.M.; Takeda, F. Mechanistic approach to phytoremediation of water. Ecol. Eng. 2003, 20, 251–264. [Google Scholar] [CrossRef]
  62. Briat, J.F.; Curie, C.; Gaymard, F. Iron utilization and metabolism in plants. Curr. Opin. Plant Biol. 2007, 10, 276–282. [Google Scholar] [CrossRef]
  63. Britto, D.T.; Kronzucker, H.J. NH4+ toxicity in higher plants: A critical review. J. Plant Physiol. 2002, 159, 567–584. [Google Scholar] [CrossRef]
  64. Cani, A.C.P.; Azevedo, R.V.D.; Pereira, R.N.; Oliveira, M.A.D.; Chaves, M.A.; Braga, L.G.T. Phytodepuration of the effluents in a closed system of fish production. Rev. Bras. Saúde Prod. Anim. 2013, 14, 371–381. [Google Scholar] [CrossRef]
  65. Cerozi, B.D.S.; Fitzsimmons, K. Phosphorus dynamics modeling and mass balance in an aquaponics system. Agric. Syst. 2017, 153, 94–100. [Google Scholar] [CrossRef]
  66. Malvi, U.R. Interaction of micronutrients with major nutrients with special reference to potassium. Karnataka J. Agric. Sci. 2011, 24, 106–109. [Google Scholar]
  67. Huett, D.O. Production and quality of sim carnations grown hydroponically in rockwool substrate with nutrient solutions containing different levels of calcium, potassium and ammonium-nitrogen. Aust. J. Exp. Agric. 1994, 34, 691–697. [Google Scholar] [CrossRef]
  68. Sonneveld, C. Growing cucumbers and tomatoes in rockwool. In Proceedings of the Fifth International Congress on Soilless Culture, Wageningen, The Netherlands, 18–24 May 1980; pp. 253–262. [Google Scholar]
  69. Bhatnagar, A.; Devi, P. Water quality guidelines for the management of pond fish culture. Int. J. Environ. Sci. 2013, 3, 1980–2009. [Google Scholar]
  70. Yang, T.; Kim, H.J. Comparisons of nitrogen and phosphorus mass balance for tomato-, basil-, and lettuce-based aquaponic and hydroponic systems. J. Clean. Prod. 2020, 274, 122619. [Google Scholar] [CrossRef]
  71. Nicoletto, C.; Maucieri, C.; Schmautz, Z.; Borin, M.; Sambo, P.; Junge, R. Baby leaf NFT production and water management in aquaponic system. In Proceedings of the International Symposium on Greener Cities for More Efficient Ecosystem Services in a Climate Changing World 1215, Bologna, Italy, 12–15 September 2017; pp. 159–164. [Google Scholar]
  72. Schachtman, D.; Liu, W. Molecular pieces to the puzzle of the interaction between potassium and sodium uptake in plants. Trends Plant Sci. 1999, 4, 281–287. [Google Scholar] [CrossRef] [PubMed]
  73. Geisenhoff, L.O.; Jordan, R.A.; Santos, R.C.; Oliveira, F.C.D.; Gomes, E.P. Effect of different substrates in aquaponic lettuce production associated with intensive tilapia farming with water recirculation systems. Eng. Agríc. 2016, 36, 291–299. [Google Scholar] [CrossRef]
  74. Adams, P. Nutrition of greenhouse vegetables in NFT and hydroponic systems. In Proceedings of the International Symposium on New Cultivation Systems in Greenhouse 361, Cagliari, Italy, 26–30 April 1993; pp. 245–257. [Google Scholar]
  75. Saha, S.; Monroe, A.; Day, M.R. Growth, yield, plant quality and nutrition of basil (Ocimum basilicum L.) under soilless agricultural systems. Ann. Agric. Sci. 2016, 61, 181–186. [Google Scholar] [CrossRef]
  76. Mourantian, A.; Aslanidou, M.; Mente, E.; Katsoulas, N.; Levizou, E. Basil functional and growth responses when cultivated via different aquaponic and hydroponics systems. PeerJ 2023, 11, e15664. [Google Scholar] [CrossRef]
  77. Wongkiew, S.; Hu, Z.; Chandran, K.; Lee, J.W.; Khanal, S.K. Nitrogen transformations in aquaponic systems: A review. Aquac. Eng. 2017, 76, 9–19. [Google Scholar] [CrossRef]
  78. Delaide, B. A Study on the Mineral Elements Available in Aquaponics, Their Impact on Lettuce Productivity and the Potential Improvement of Their Availability. Ph.D. Thesis, University of Liege, Liege, Belgium, 2017. [Google Scholar]
Figure 1. Schematic representation of the hydroponic subsystem.
Horticulturae 09 01077 g001
Figure 2. Schematic representation of the aquaculture subsystem.
Horticulturae 09 01077 g002
Figure 3. Cultivation of the (a) basil, (b) cucumber, (c) parsley, and (d) tomato crops in the pilot aquaponic greenhouse.
Horticulturae 09 01077 g003aHorticulturae 09 01077 g003b
Figure 4. Schematic flow of the nutrient solution preparation according to the treatment.
Horticulturae 09 01077 g004
Figure 5. Standard nutrient ratio of (a) K+: [K+] + [Ca2+] + [Mg2+], (b) Ca2+: [K+] + [Ca2+] + [Mg2+], (c) Mg2+: [K+] + [Ca2+] + [Mg2+], (d) NH4++NO3: [K+], (e) NH4+: [NH4+] + [NO3], (f) PO42−: [NH4+] + [NO3] and (g) Na+: [K+] according to the treatment and studied crop. The horizontal black line illustrates the optimum levels according to the crop studied [44]. Mean values followed by different lowercase letters (a, b) differ significantly according to the Tukey–Kramer HS test at p < 0.05 across the treatments (HP, CAP, DCAP).
Horticulturae 09 01077 g005aHorticulturae 09 01077 g005b
Figure 6. Nutrient content of nitrogen (a), phosphorous (b), potassium (c), calcium (d), and sodium (e) for leaf tissue according to the treatment and studied crop. The horizontal black line illustrates the optimum level of nutrient elements (N, P, K, and Ca) within leaf tissue in tomatoes [48], cucumbers [49], and leafy plants [50]. Mean values followed by different lowercase letters (a, b) differ significantly according to the Tukey–Kramer HS test at p < 0.05 across the treatments (HP, CAP, DCAP).
Horticulturae 09 01077 g006aHorticulturae 09 01077 g006b
Figure 7. Nutrient content of potassium, calcium, and sodium (mg g−1) in fruit tissue for the two plant cultivations (cucumber and tomato) according to the treatment. Mean values followed by different lowercase letters (a, b) differ significantly according to the Tukey–Kramer HS test at p < 0.05 across the treatments (HP, CAP, DCAP).
Horticulturae 09 01077 g007
Figure 8. Nutrient use efficiency (NUE) (%) of (a) nitrogen (Ν), (b) phosphorous (PO42−), (c) potassium (K+), (d) calcium (Ca2+), and (e) sodium (Na+) for basil, cucumber, parsley, and tomato cultivations for the three treatments, HP, DCAP, and CAP, respectively. Mean values followed by different lowercase letters (a, b) differ significantly according to the Tukey–Kramer HS test at p < 0.05 across the treatments (HP, CAP, DCAP).
Horticulturae 09 01077 g008
Table 1. Recipes for each type and stage of cultivation in the DCAP and HP systems.
Basil and ParsleyCucumber (Vegetative Stage)Cucumber (Fruity Stage)Tomato (3rd Truss)Tomato (5th Truss)Tomato (10th Truss)
Macronutrients (mg L−1)
Nitrate (NO3)682915853887763769
Ammonium (NH4+)182525272222
Phosphate (PO4)97119109142142142
Potassium (K+)200242281274293313
Calcium (Ca2+)150166136204188180
Magnesium (Mg2+)803934585351
Sulfur (SO4−2)288125134346394384
Micronutrients (μmol L−1)
Iron (Fe)51515151515
Boron (B)202525353030
Copper (Cu)10.80.80.80.80.7
Zinc (Zn)555555
Manganese (Mn)51010101010
Molybdenum (Mo)50.50.50.50.50.5
Table 2. Average values (±SD) of water quality parameters [pH and EC] for the RAS, the NS, and the DS, according to the treatment and studied crop.
BasilCucumberParsleyTomato
Nutrient SolutionDrainage SolutionNutrient SolutionDrainage SolutionNutrient SolutionDrainage SolutionNutrient SolutionDrainage Solution
pHHP6.1 ± 0.1 Aa6.1 ± 0.2 Ba6.0 ± 0.0 Aa5.9 ± 0.2 Ba5.7 ± 0.1 Ab6.4 ± 0.2 Ba5.8 ± 0.0 Aa5.2 ± 0.3 Bb
DCAP6.05 ± 0.9 Aa6.2 ± 0.1 Ba6.0 ± 0.1 Aa6 ± 0.2 Ba5.6 ± 0.1 Ab6.3 ± 0.2 Ba5.9 ± 0.0 Aa5.5 ± 0.2 Bb
CAP6.2 ± 0.8 Ab7.1 ± 0.2 Aa6.1 ± 0.1 Ab7.0 ± 0.2 Aa5.9 ± 0.1 Ab7.6 ± 0.3 Aa5.8 ± 0.1 Ab7.5 ± 0.4 Aa
RAS8.1 ± 0.77.8 ± 0.27.8 ± 0.08.1 ± 0.1
ECHP2.2 ± 0.0 Aa2.5 ± 0.1 Aa2.3 ± 0.1 Ab2.8 ± 0.1 Aa2.1 ± 0.0 Ab2.4 ± 0.1 Aa3.0 ± 0.1 Ab4.1 ± 0.5 Aa
DCAP2.2 ± 0.1 Aa2.6 ± 0.1 Aa2.4 ± 0.0 Ab2.7 ± 0.1 Aa2.0 ± 0.0 Ab2.4 ± 0.1 Aa2.9 ± 0.1 Ab3.9 ± 0.4 Aa
CAP1.3 ± 0.1 Ba1.3 ± 0.1 Bb1.2 ± 0.1 Ba1.1 ± 0.1 Bb0.9 ± 0.1 Bb1.3 ± 0.0 Ba1.1 ± 0.0 Ba1.1 ± 0.1 Ba
RAS0.98 ± 0.00.88 ± 0.00.83 ± 0.10.94 ± 0.0
Mean values followed by different lowercase letters (a, b) differ significantly according to the Tukey–Kramer HS test at p < 0.05 across NS and DS solutions. Mean values followed by different capital letters (A, B) differ significantly across the treatments (HP, CAP, DCAP).
Table 3. Average concentrations (mg L−1) and nutrient availability (%) of the main macronutrients (NO3−, PO42−, NH4+, K+, Ca2+, Mg++, SO42−) and Fe2+ (mg L−1) in the RAS solution of all the studied crops.
BasilCucumberParsleyTomato
Concentrations in the RASNutrient AvailabilityConcentrations in the RASNutrient AvailabilityConcentrations in the RASNutrient AvailabilityConcentrations in the RASNutrient Availability
NO3130.119.1111.312.092.413.6113.714.1
NH4+0.10.70.10.60.10.80.10.5
PO413.714.111.79.89.39.68.35.8
K+19.19.519.37.911.25.617.76.0
Ca2+39.326.236.722.135.423.637.919.9
Mg2+42.553.141.4106.537.546.842.578.2
SO42−60.420.933.827.014.75.148.212.9
Fe2+0.18.80.18.20.18.10.19.5
Na+46.5-38.8-41.6-43.8-
Table 4. Average concentrations (±SD) of the main macronutrients (NO3−, PO42−, NH4+, K+, Ca2+) and Na+ (mg L−1) for the nutrient and drainage solutions, uptake concentration (mg L−1) and removal rate (mg g−1) according to the treatment for the basil and parsley cultivation.
Basil
Nutrient ElementTreatmentΝNutrient Solution
(NS; mg L−1)
Drainage Solution (DS; mg L−1)Uptaken Concentration (Cu; mg L−1)Removal Rate
(RM; mg g−1)
NO3HP18509.4 ± 131.9 a590.7 ± 144.6 a519.6489.3
DCAP18511.4 ± 96.4 a557.77 ± 144.0 a521.6488.0
CAP18215.6 ± 55.4 b188.3 ± 55.1 b219.9236.9
NH4+HP1814.1 ± 6.1 a5.4 ± 2.4 a24.019.6
DCAP1814.9 ± 4.0 a5.0 ± 1.0 a25.322.9
CAP182.6 ± 1.0 b1.1 ± 0.7 b3.93.5
PO42−HP1880.5 ± 16.8 a73.4 ± 17.2 a101.896.3
DCAP1879.1 ± 12.5 a67.8 ± 13.5 a99.194.0
CAP1882.8 ± 14.5 a67.1 ± 24.5 a106.5100.4
K+HP36206.4 ± 43.7 a196.2 ± 38.1 a219.4224.4
DCAP36204.6 ± 34.6 a208.3 ± 40.8 a217.6223.2
CAP3641.1 ± 7.3 b32.4 ± 6.7 b52.247.3
Ca2+HP36125.4 ± 30.8 a154.8 ± 34.9 a121.7114.8
DCAP36127.3 ± 18.7 a163.5 ± 34.6 a123.7117.5
CAP3628.0 ± 11.7 b31.0 ± 8.0 b21.726.9
Na+HP3649.9 ± 15.7 a72.2 ± 19.2 a28.339.3
DCAP3653.0 ± 13.7 a76.6 ± 25.5 a42.643.6
CAP3648.9 ± 15.4 a62.0 ± 15.3 a36.442.5
Parsley
NO3HP24495.5 ± 41.8 a521.3 ± 49.3 a466.3161.0
DCAP24496.6 ± 48.4 a500.7 ± 76.1 a467.2167.1
CAP2490.6 ± 12.5 b81.9 ± 6.4 b111.987.2
NH4+HP242.6 ± 0.3 a1.0 ± 0.3 a4.01.4
DCAP242.7 ± 0.4 a1.2 ± 0.3 a4.11.8
CAP240.7 ± 0.2 b0.6 ± 0.2 b1.30.7
PO42−HP2470.5 ± 8.1 a65.4 ± 4.8 a93.527.6
DCAP2465.2 ± 5.2 a54.2 ± 9.2 a85.620.9
CAP2412.8 ± 1.8 b12.4 ± 1.6 b14.02.0
K+HP27156.8 ± 2.6 a185.3 ± 6.4 a146.950.8
DCAP27136.7 ± 2.4 b167.0 ± 9.0 b128.534.7
CAP2716.7 ± 0.3 b33.4 ± 3.3 c32.85.7
Ca2+HP27138.2 ± 3.9 a149.3 ± 5.8 a126.948.4
DCAP27142.9 ± 4.0 a168.3 ± 10.8 a132.041.4
CAP2738.7 ± 0.4 b49.5 ± 4.3 b27.927.9
Na+HP2739.5 ± 1.2 a55.5 ± 5.2 a29.010.4
DCAP2740.4 ± 0.8 a58.6 ± 5.0 a32.19.1
CAP2739.7 ± 1.5 a54.3 ± 4.0 a29.726.2
Averages followed by different lowercase letters (a, b) differ significantly according to the Tukey–Kramer HS test at p < 0.05 across the treatments.
Table 5. Average concentrations (±SD) of the main macronutrients (NO3−, PO42−, NH4+, K+, Ca2+) and Na+ (mg L−1) for the nutrient and drainage solutions, uptake concentration (mg L−1), and removal rate (mg g−1) according to the treatment for the cucumber and tomato cultivations.
Cucumber
Nutrient ElementTreatmentΝNutrient Solution (NS; mg L−1)Drainage Solution (DS; mg L−1)Uptake Concentration (Cu; mg L−1)Removal Rate
(RM; mg g−1)
NO3HP27670.1 ± 93.4 a753.5 ± 215.8 a645.0403.3
DCAP27660.4 ± 133.7 a742.9 ± 121.5 a636.4425.3
CAP27188.4 ± 62.7 b170.1 ± 95.2 b200.7162.0
NH4+HP2723.1 ± 1.5 a7.9 ± 1.7 a39.222.6
DCAP2724.7 ± 1.6 a8.0 ± 2.3 a42.225.3
CAP270.9 ± 0.5 b0.8 ± 0.4 b1.60.6
PO42−HP27110.5 ± 8.5 a108.8 ± 25.0 a108.772.4
DCAP27103.3 ± 8.7 a99.3 ± 21.0 a101.665.1
CAP2728.7 ± 10.3 b23.4 ± 27.7 b29.025.9
K+HP36239.8 ± 6.7 a236.3 ± 16.4 a233.6148.7
DCAP36221.3 ± 5.0 a226.2 ± 7.7 a217.5153.7
CAP3647.0 ± 10.1 b35.7 ± 11.1 b54.743.5
Ca2+HP36107.9 ± 5.3 a142.7 ± 6.2 a90.555.2
DCAP36121.3 ± 4.8 a161.5 ± 9.1 a101.276.3
CAP3642.2 ± 5.3 b42.1 ± 4.5 b37.134.3
Na+HP3642.4 ± 0.8 a70.1 ± 3.9 a27.116.5
DCAP3642.4 ± 1.2 a72.3 ± 3.8 a27.018.2
CAP3640.7 ± 1.0 a52.6 ± 2.0 b25.026.3
Tomato
NO3HP27695.4 ± 6.6 a802.8 ± 13.2 a715.7421.8
DCAP27691.8 ± 17.7 a806.3 ± 21.2 a712.5457.2
CAP27135.5 ± 2.7 b70.5 ± 2.8 b172.5225.4
NH4+HP4522.9 ± 1.1 a9.3 ± 0.6 a31.020.6
DCAP4522.5 ± 1.0 a8.4 ± 0.5 a30.521.8
CAP451.1 ± 0.1 b0.3 ± 0.0 b2.11.9
PO42−HP45163.0 ± 6.0 a183.7 ± 6.8 a166.6105.1
DCAP45164.3 ± 7.4 a182.1 ± 7.8 a167.8117.2
CAP4517.9 ± 0.9 b6.3 ± 0.8 b23.330.7
K+HP36256.0 ± 4.3 a319.6 ± 20.3 a235.4153.5
DCAP36259.0 ± 3.0 a305.3 ± 18.4 a237.7173.0
CAP3627.7 ± 0.7 b12.0 ± 2.2 b37.246.1
Ca2+HP36180.7 ± 3.5 a264.6 ± 26.3 a141.593.8
DCAP36176.8 ± 3.2 a244.6 ± 50.4 a138.7110.5
CAP3641.6 ± 0.5 b47.9 ± 2.7 b37.248.5
Na+HP3642.3 ± 1.1 a75.5 ± 7.6 a28.316.9
DCAP3643.2 ± 0.8 a76.6 ± 9.1 a29.820.5
CAP3641.6 ± 0.9 a58.7 ± 3.6 b27.138.7
Averages followed by different lowercase letters (a, b) differ significantly according to the Tukey–Kramer HS test at p < 0.05 across the treatments.
Disclaimer/Publisher’s Note: The statements, opinions and data contained in all publications are solely those of the individual author(s) and contributor(s) and not of MDPI and/or the editor(s). MDPI and/or the editor(s) disclaim responsibility for any injury to people or property resulting from any ideas, methods, instructions or products referred to in the content.

