Article

Root Exploration, Initial Moisture Conditions, and Irrigation Scheduling Influence Hydration of Stratified and Non-Stratified Substrates †

by
Kristopher S. Criscione
1,
Jeb S. Fields
1,* and
James S. Owen, Jr.
2
1
Hammond Research Station, Louisiana State University Agricultural Center, 21549 Old Covington Hwy, Hammond, LA 70403, USA
2
Application Technology Research Unit, USDA-ARS, 1680 Madison Ave., Wooster, OH 44691, USA
*
Author to whom correspondence should be addressed.
This paper was written as a contributing portion of a Master of Science Thesis for Kristopher S. Criscione to fulfill degree requirements.
Horticulturae 2022, 8(9), 826; https://doi.org/10.3390/horticulturae8090826
Submission received: 28 July 2022 / Revised: 29 August 2022 / Accepted: 3 September 2022 / Published: 8 September 2022
(This article belongs to the Special Issue Horticultural Crops Water and Fertilizer Management)

Abstract

:
Soilless substrate stratification (i.e., layering unique substrates within a single container) is an emerging substrate management strategy that may provide opportunities to augment nursery resource use. As such, this research aimed to analyze water movement through containers during hydration events under different initial moisture conditions. The results indicated substrate stratification had minimal influence on water movement compared to non-stratified systems (uniformly filled nursery containers). Cyclic irrigation significantly increased the stratified substrates’ ability to retain water when irrigated at 20% volumetric water content (p < 0.0001) and significantly decreased the total volume leached (p < 0.0001). Moreover, irrigating the substrate profile with shallow and more frequent irrigations facilitated stratified substrates ty reach effective container capacity conditions (p < 0.0001n compared to non-stratified systems. The stratified systems took longer to leach all gravitational pores (p = 0.0266). In dry moisture conditions, non-stratified substrates were more hydrated when cyclic irrigation applications were applied compared to single applications (p = 0.0492). This study demonstrated that cyclic irrigation scheduling enhanced water retention in both non-stratified and stratified profiles under different initial moisture conditions and can be used as an irrigation strategy when dry substrate conditions prevail.

1. Introduction

Water availability [1] and quality [2] for agricultural production continue to be scrutinized as climate change, and diminishing available fresh water remains a challenge globally [3,4]. Therefore, it is increasingly necessary for specialty crop producers utilizing containerized crop production to incorporate more water-efficient practices, such as substrate management, to increase cost and resource sustainability (i.e., reduce water use) during production. Specifically in the ornamental nursery industry, large quantities of irrigation water are required to quickly produce a high-quality, salable ornamental plant [5]. Future substrate development must engineer substrate systems for improvement in resource efficiency.
Soilless substrate stratification has been identified as a management strategy with promising opportunities to improve resource efficiency; namely conserving routinely applied water and mineral nutrients [6]. This entails the layering of unique soilless substrates, varying in texture and subsequent hydrological properties, vertically in the container profile to redistribute water and air storage properties. Specifically, stratified substrates have been engineered to reduce infiltration speed and increase water-holding capacity in the upper 50% of the container profile, where it has been observed to be drier in conventional substrates due to gravitational forces and evapotranspiration [7]. Coarse substrate materials with increased air-filled porosity are utilized in the lower portion of the container to increase drainage where the presence of a perched water table is pronounced [8].
As measured by quality ratings and overall growth (i.e., physiological measurements), the equal or greater performance of crops produced in the stratified substrate systems have been reported [6,9,10,11]. In the stratified systems, improved crop growth and quality were the most notable within the first year, especially during crop establishment [6]. Furthermore, water and fertilizer inputs can be significantly reduced while producing containerized crops of equal or greater size in the stratified systems [9]. This was hypothesized to be due to less plant stress due to less severe fluctuations in substrate moisture content and water potential in the stratified substrates, when compared to non-stratified systems under varied irrigation schedules [12]. Nevertheless, monitoring water movement patterns through stratified systems paired with varied irrigation regimes such as cyclic irrigation (i.e., applying the daily quantity of water in fractions throughout the day) [13] will aid in a better understanding of soilless substrate hydraulics, resulting in developing clearer directions on how to improve moisture uniformity throughout the container profile. Cyclic application irrigation has been evidenced to reduce container nutrient leaching [14], improve plant growth, and decrease plant water demand stresses [15], which justifies further investigating its mechanisms of water movement through containerized substrates.
The nursery industry is responsible for a significant portion of the USA’s agricultural commodities [5,6]. Moreover, this industry relies heavily upon soilless substrates to produce ornamental crops [16]. To expand, low-cost pine bark is the most utilized soilless substrate component in the southeastern United States [16] because of the forgiving physical properties due to large size particles and consequent increased aeration and drainage [17]. Pine bark-based substrates inherently retain little water when compared to fibrous substrate components; therefore, bark wettability and subsequent water-holding capacity decreases as moisture content declines, becoming hydrophobic during production [18,19]. This, in turn, has been reported to reduce wettability [20], hydration efficiency [21] of substrates, and increase preferential flow, all resulting in a non-uniform wetting [22].
Lysimeters have been used to measure substrate moisture status and control irrigation of containerized systems [23,24,25]. Typically, there are two types of lysimeters utilized in container production research, hanging single containers with an S-type load cell [23] or placing a container on a cantilever base with a beam load cell with a platform attached on top [26]. Prehn et al. [26] and Fields et al. [24] utilized lysimeters to control irrigation of bark-based substrates. Previously, O’Meara et al. [27] and Niu et al. [28] monitored daily water use and evapotranspiration, respectively, of nursery crops. Furthermore, Fields et al. [24] demonstrated how to use dual-lysimeters to provide a mass balance of water in containers and better our understanding of water movement through soilless substrates.
As such, the purpose of this research was to utilize water mass balances of a bark-based substrate system during an individual irrigation event and determine the subsequent effect engineered versus conventional substrate systems have on water retention and release. Therefore, three objectives were investigated to compare stratified and conventional non-stratified bark-based containerized systems, including (1) monitoring water entry, movement, and exit by mass balance; (2) investigating the impact of root systems on substrate porosity and subsequent water movement; and (3) determine the differences in hydration at various initial moisture contents. It was hypothesized that stratified substrates will increase the retention time as water travels through the substrate due to slower infiltration and increased retention in the upper strata, improving moisture retention, especially at lower initial moisture contents. Furthermore, the authors hypothesize that pairing cyclic irrigation strategies with stratified substrates will further improve the substrates’ hydrology extending applied water.

2. Materials and Methods

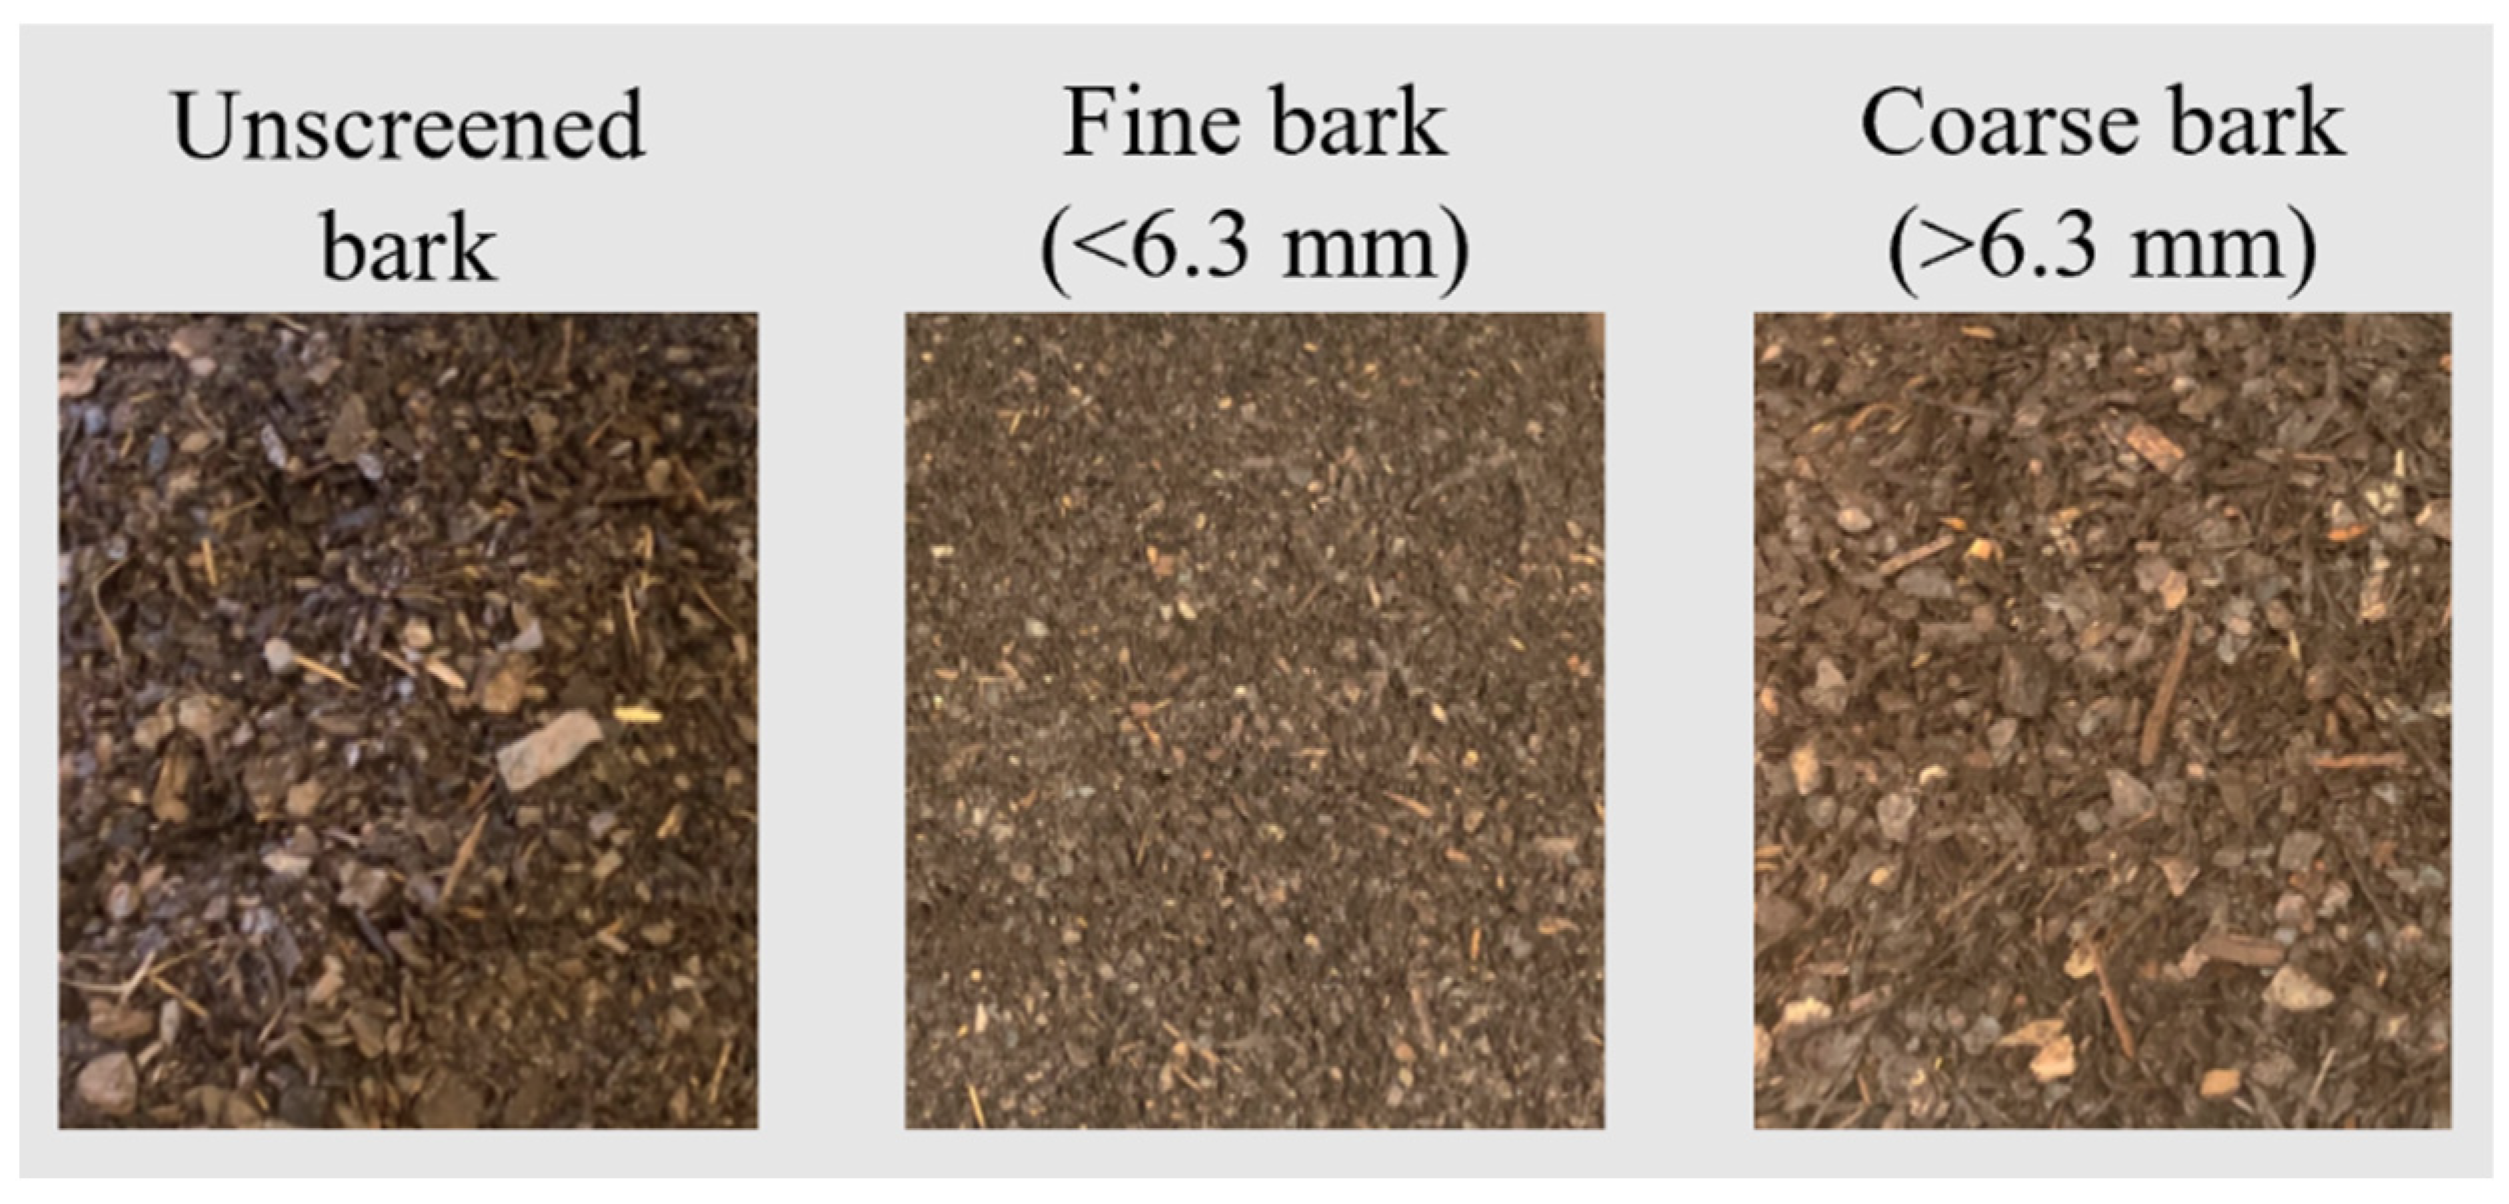
2.1. Substrate Preparation

Locally sourced pine bark aged approximately nine months (Phillips Bark Processing Co.; Brookhaven, MS, USA) was amended with 0.89 kg·m−3 and 1.77 kg·m−3 granulated micronutrients (Micromax G90505; ICL Specialty Fertilizer; Dublin, OH, USA) and dolomitic lime (Lime-Rite Pelletized Dolomitic Lime, Roswell, GA, USA), respectively. Amended bark was then processed by passing through a continuous flow screen (CF-1; Gilson Company Inc. Model; Lewis Center, OH, USA) fitted with a 6.3 mm aperture screen, set to 569 revolutions per minute, and the screen level was maintained at 5° inclined slope. The bark particles passed through the screen at a rate of 0.012 m3·min−1, and the process was stopped every 10 min to remove debris from the screen. The initial mass wetness of 1.86 g·g−1 ± 0.06 SD was gravimetrically determined at the time of screening. Two receptacles were utilized to separately collect the particles that did not pass through the screen (coarse bark) and the particles that passed through the screen (fine bark). This process was continued until a total of 0.05 m3 coarse bark particles, and 0.05 m3 fine bark particles were collected. Multiple subsampling of the screened particle resulted in a 3:5 ratio fine:coarse (by vol.) and a 4:5 ratio fine:coarse (by wet mass). In addition, 0.1 m3 of unscreened pine bark was collected to serve as the control substrate. Each substrate was sealed in plastic bags to prevent moisture loss. The images of the bark we used are shown in Figure 1.

2.2. Physical Properties

Static physical properties, including air space (AS), container capacity (CC), total porosity (TP), and bulk density (Db), were measured via porometer analysis of three replicates per substrate, as described by Fonteno and Harden [29]. Additionally, the particle size distribution of each substrate was then evaluated by passing three 100 g oven-dried replicates of each substrate through a Ro-Tap shaker (Rx-29; W.S. Tyler, Mentor, OH, USA) for five min with a column of stacked sieves with aperture sizes of 6.3, 2.0, 0.7, 0.5, 0.3, and 0.1 mm and a catch pan at the bottom. Additionally, 2.4 L containers (300CS; Nursery Supplies, Kissimmee, FL, USA) were filled normally with either a non-stratified or a stratified fallow substrate system. Then, the entire substrate profile within the container was dried at 105 ℃ and analyzed for its particle size distribution. The remaining particles on each sieve after agitation were weighed and compiled into four size classifications: extra-large (>6.3 mm), large (6.3–2.0 mm), medium (2.0–0.7 mm) and fine (<0.7 mm).

2.3. Treatment Preparation

There are two substrate systems investigated in this study, a conventional non-stratified substrate where the 2.4 L containers are filled uniformly with an unscreened bark, and a stratified substrate, wherein the bottom half (8.3 cm) of the 2.4 L containers was filled with coarse bark and the upper half (remaining upper 8.3 cm) was filled with fine bark. Containers were left fallow (no roots present) or a rooted treatment (substrates are fully root-explored).
After the substrate was prepared, twenty 2.4 L containers were filled with the control bark (non-stratified), and twenty additional containers were stratified (fine bark layered over coarse bark). Zinnia hybrida ‘Profusion Double Hot Cherry’ seeds were sown in a standard 96-cell plug tray and grown until the seedling roots fully explored the plug. The seedlings were transplanted on 29 April 2021 into each of the 40 containers. The plants were allowed to grow for 62 d to ensure full root exploration of the container volume. Each plant was fertilized every 14 d with liquid 20N:8.7.4P:16.6K fertilizer (20N-20P2O4-20K2O; Peters Professional, Summerville, SC, USA) at a rate of 2.89 g L−1 to attain an electrical conductivity of approximately 2.50 mS cm−1. Thereafter, all remaining substrate was placed into separate standard plastic bags to preserve the substrate moisture for the unrooted treatment preparation. Unrooted treatment preparation will be discussed in the following section.

2.4. Experimental Category and Initial Conditions

Prior to analysis within the mass balance system, the substrate volumetric moisture contents (VWC) were adjusted to fit within one of three experimental categories that contained different initial moisture conditions: (1) Experiment 1—effective container capacity (eCC; maximum water-holding capacity achieved through overhead irrigation after allowing for drainage of gravitational pores). (2) Experiment 2—the VWC when the first sign of wilt was observed (i.e., flagging). (3) Experiment 3—a dry initial condition at approximately 10% VWC.

2.4.1. Experiment 1: Effective Container Capacity

For eCC initial conditions, the substrates were not initiated at a targeted VWC. Instead, the substrates were fully hydrated and allowed to drain to eCC. The initial substrate VWC for eCC treatments prior to irrigation in non-stratified fallow, non-stratified rooted, stratified fallow, and stratified rooted were 28.00 ± 0.01SD %, 25.00 ± 0.01SD %, 25.00 ± 0.02SD %, and 19.00 ± 0.01SD %, respectively. The eCC treatments consisted of irrigating a single application of water to rooted and fallow profiles. There were three individual containers per treatment examined in this experiment.

2.4.2. Experiment 2: Flagging Initial Moisture Conditions; (20% VWC)

The flagging treatments were targeted to have a VWC of approximately 20%; however, the average of the substrates VWC in single application irrigation for non-stratified fallow, non-stratified rooted, stratified fallow, and stratified rooted was 19.00 ± 0.01SD %, 14.00 ± 0.03SD %, 19.00 ± 0.01SD %, 14.00 ± 0.00SD %, respectively. In 20% VWC substrates under cyclic application irrigation for non-stratified fallow, non-stratified rooted, stratified fallow, and stratified rooted was 18.00 ± 0.02SD %, 18.00 ± 0.02SD %, 18.00 ± 0.00SD %, and 12.00 ± 0.03SD %, respectively. The flagging treatments consisted of irrigation, both a single and cyclic application to rooted (root-explored profile) and fallow (no roots present) profiles. Three individual containers per substrate and irrigation treatment were examined herein in this experiment.
To attain desired VWC values, fallow non-stratified treatments, conventional bark was filled in a 2370 mL container, filled to a known substrate volume of 1942 mL, emptied, and placed on trays to dry. The trays were air-dried until the targeted VWC was reached. For the stratified treatment, fine bark and coarse bark were spread on trays and allowed to dry while being periodically weighed. Once the substrate met the targeted weight, a stratified profile was constructed in the model container and reweighed.

2.4.3. Experiment 3, Dry Initial Moisture Conditions; (10% VWC)

The dry initial condition treatments in a single application for non-stratified fallow and stratified fallow substrates had VWC values of 12.00 ± 0.03SD % and 10.00 ± 0.01SD %, respectively, and in cyclic application for non-stratified fallow and stratified fallow substrates were 12.00 ± 0.03SD % and 12.00 ± 0.02SD %, respectively. The dry treatments consisted of irrigation, both a single and cyclic application to only fallow profiles. Three containers per substrate and irrigation treatment were examined.
The same procedure was followed as described in Section 2.4.2 to attain desired VWC values for this experiment.

2.5. Irrigation Volume Determination

To determine the quantity of irrigation used in this study, plants were allowed to dry until they exhibited initial signs of wilt (i.e., flagging). Once flagging occurred, each container was weighed and then watered three times and reweighed after 1 h to allow for gravitational drainage to attain eCC. The difference in weight from first flagging to eCC was calculated to be 361.9 g ± 33.1 SD (n = 12) and estimated to be readily available water [22]. Thus, 360 mL of water, which equates to 15% of the container volume (2370 mL), was selected to be the irrigation application volume for this study, where 360 mL was utilized in a single application and 3 × 120 mL applications were utilized in for cyclic application.

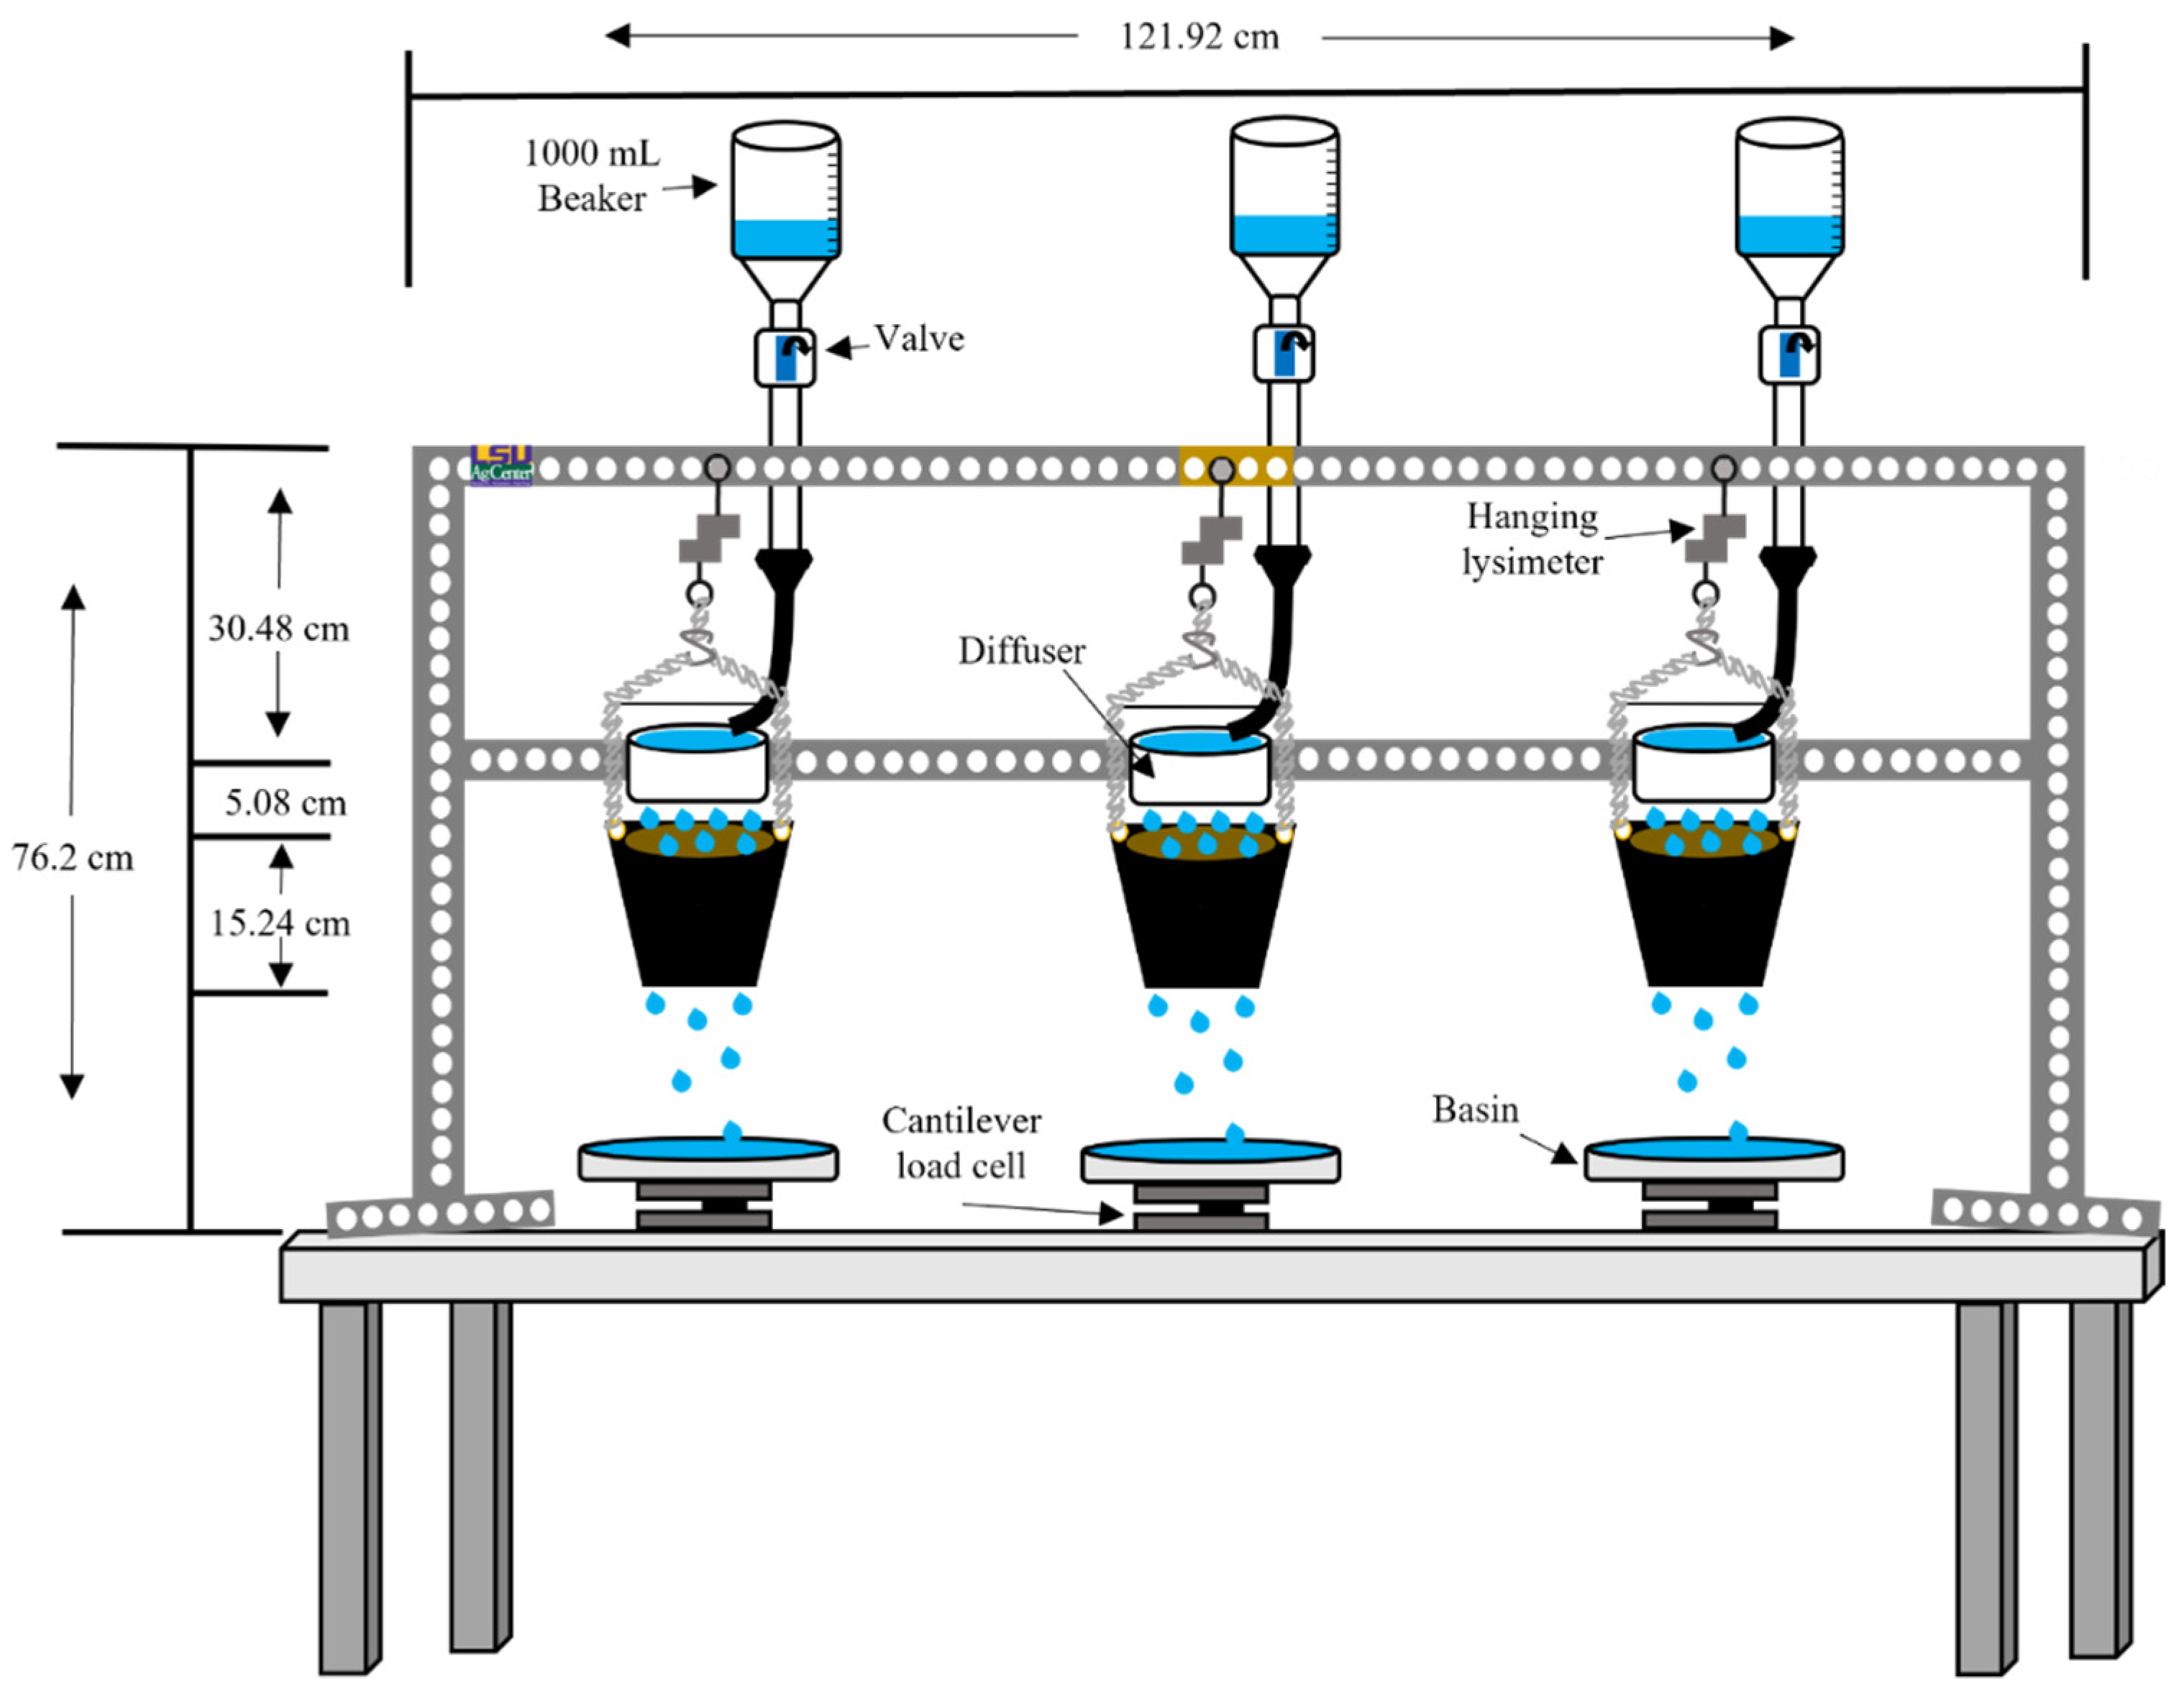
2.6. Applying Irrigation

The rate of water application used within this study exceeded the normal rate used in production. This likely influenced water movement throughout the system, resulting in preferential flow dominating the system to a greater degree than expected in situ. For example, a 3.2 gph spray stake has a rate of approximately 201 mL per min, whereas in this system, the rate of application was approximately 3530 mL per min. This, in turn, would be representative of a storm and a potential worst-case scenario for preferential flow. The diffuser used herein was the lower section of a Buchner funnel. The funnel had a diameter of 13.5 cm and centered in the funnel bottom was an area of 56.75 cm2, where multiple (191) 3 mm diameter holes encompassed approximately 13.5 cm2 of the area. Water was distributed relatively evenly exiting the leveled funnel.
Prior to all hydration events, containers were leveled and suspended for 5 min to mitigate movement. The procedures for each irrigation application with experiments are discussed below.

2.6.1. Experiment 1

To reach initial conditions in the eCC treatments, the containers were hydrated three times, 15 min apart, with single irrigation, but with 853 mL pulses (80% of 1066 mL). Ample amount of time (1 h) passed after the final pulse of water before overhead irrigating an additional 1066 mL of water (container volume × CC of conventional bark; 2370 mL × 45%). The system was allowed to drain for 30 min.

2.6.2. Experiments 2 and 3

In the single application treatments, each replicate was overhead irrigated with one pulse of 360 mL and allowed to drain for 15 min. In cyclic application treatments, each replicated received three pulses of 120 mL every 15 minutes and was allowed to drain for 15 minutes. In all events, after the final 15 min drainage period, an additional 1750 mL [2.1 × substrate volume × CC of conventional bark; 2.1 × 1942 mL × 43%] of water was applied to simulate rehydration to eCC. The substrate was then allowed to drain for an additional 30 min.

2.7. Mass Balance

Three hanging lysimeter systems were designed and utilized for this research study. A frame was constructed from a metal framing strut (Superstrut; ABB Products, Memphis, TN, USA; Figure 2). Three hanging lysimeters, consisting of hanging low-profile tension/compression load cells (MLP-25; Transducer Techniques, Temecula, CA, USA), were affixed to the frame. Three sleeve containers to hold experimental units were created by punching standard aluminum grommets within the inner lip of the container on exactly opposite sides. Aluminum hooks were connected to each other, and the hooks were inserted into the grommets 27.9 cm from the hanging lysimeter. Hooks were hung around a standard plastic Buchner funnel and to ensure that the hooks did not touch the funnel, an aluminum bar was connected to opposing sides of the hooks (Figure 2). The Buchner funnel was affixed to another piece of metal framing and leveled. Below each hanging container, a cantilever-style lysimeter was constructed with a beam load cell (LSP-10; Transducer Techniques, Temecula, CA, USA) centered between two 19.1 cm × 19.1 cm standard acrylic plates. A plastic basin was placed on top of the lysimeter to collect leachate from the suspended container.
All sensors were connected to a data logger (CR1000X; Campbell Scientific, Logan, UT, USA) with readings collected every 2 s on PC400 (Campbell Scientific, Logan, UT, USA). All sensors were calibrated by placing three separate known masses on each load cell and plotting a regression line of the output. The slope equation was attained and inputted into the program.

2.8. Data Analysis

The mass balance data collected was normalized per treatment prior to statistical analysis. All irrigation timings were offset for each of the lysimeters’ independent variables (seconds) so that each irrigation began in unison. This was completed to control the difference in time between opening each of the valves and remove any human error from the system. Additionally, hanging container and leachate weights were normalized so the authors can accurately measure water entry and exit. The slope equation for substrate hydration was calculated as the slope value between irrigation initiation to the time leachate was first observed and, in the basin lysimeter. The basin slope equation was calculated from the first measurement of leachate until the slope began to decline. The authors used a minimum number of three observation values for the slope equation, with no maximum. Additionally, every n value in the results and discussion section equates to 2 s and will be referred to hereafter as ‘retention time’. Three individual containers per treatment were analyzed to determine values for all summarized parameters.
In this paper, the term “retention capacity” (RC) will be used to define the water retained (VWC) by a substrate 15 min after an irrigation event. To better numerically quantify the relationship of RC to eCC, an index was calculated for each instance when equilibrium was achieved post water application (VWC 15 min after each irrigation). The hydration index (HI) was calculated as VWCfinal ÷ eCC and ranged from 0.5 to 1.0 within our study.
The data presented in the tables with associated statistics were analyzed in JMP Pro (15.1.0; SAS Institute, Inc.; Cary, NC, USA). Analysis of variance (ANOVA) was utilized to determine any statistically significant differences between the means of the substrate static physical properties, and particle size fractions based on dry mass. Thereafter, all statistically significant values were further analyzed utilizing Tukey’s Honestly Significant Difference (α = 0.05) to separate means across the substrates and summarized measured parameters.

3. Results

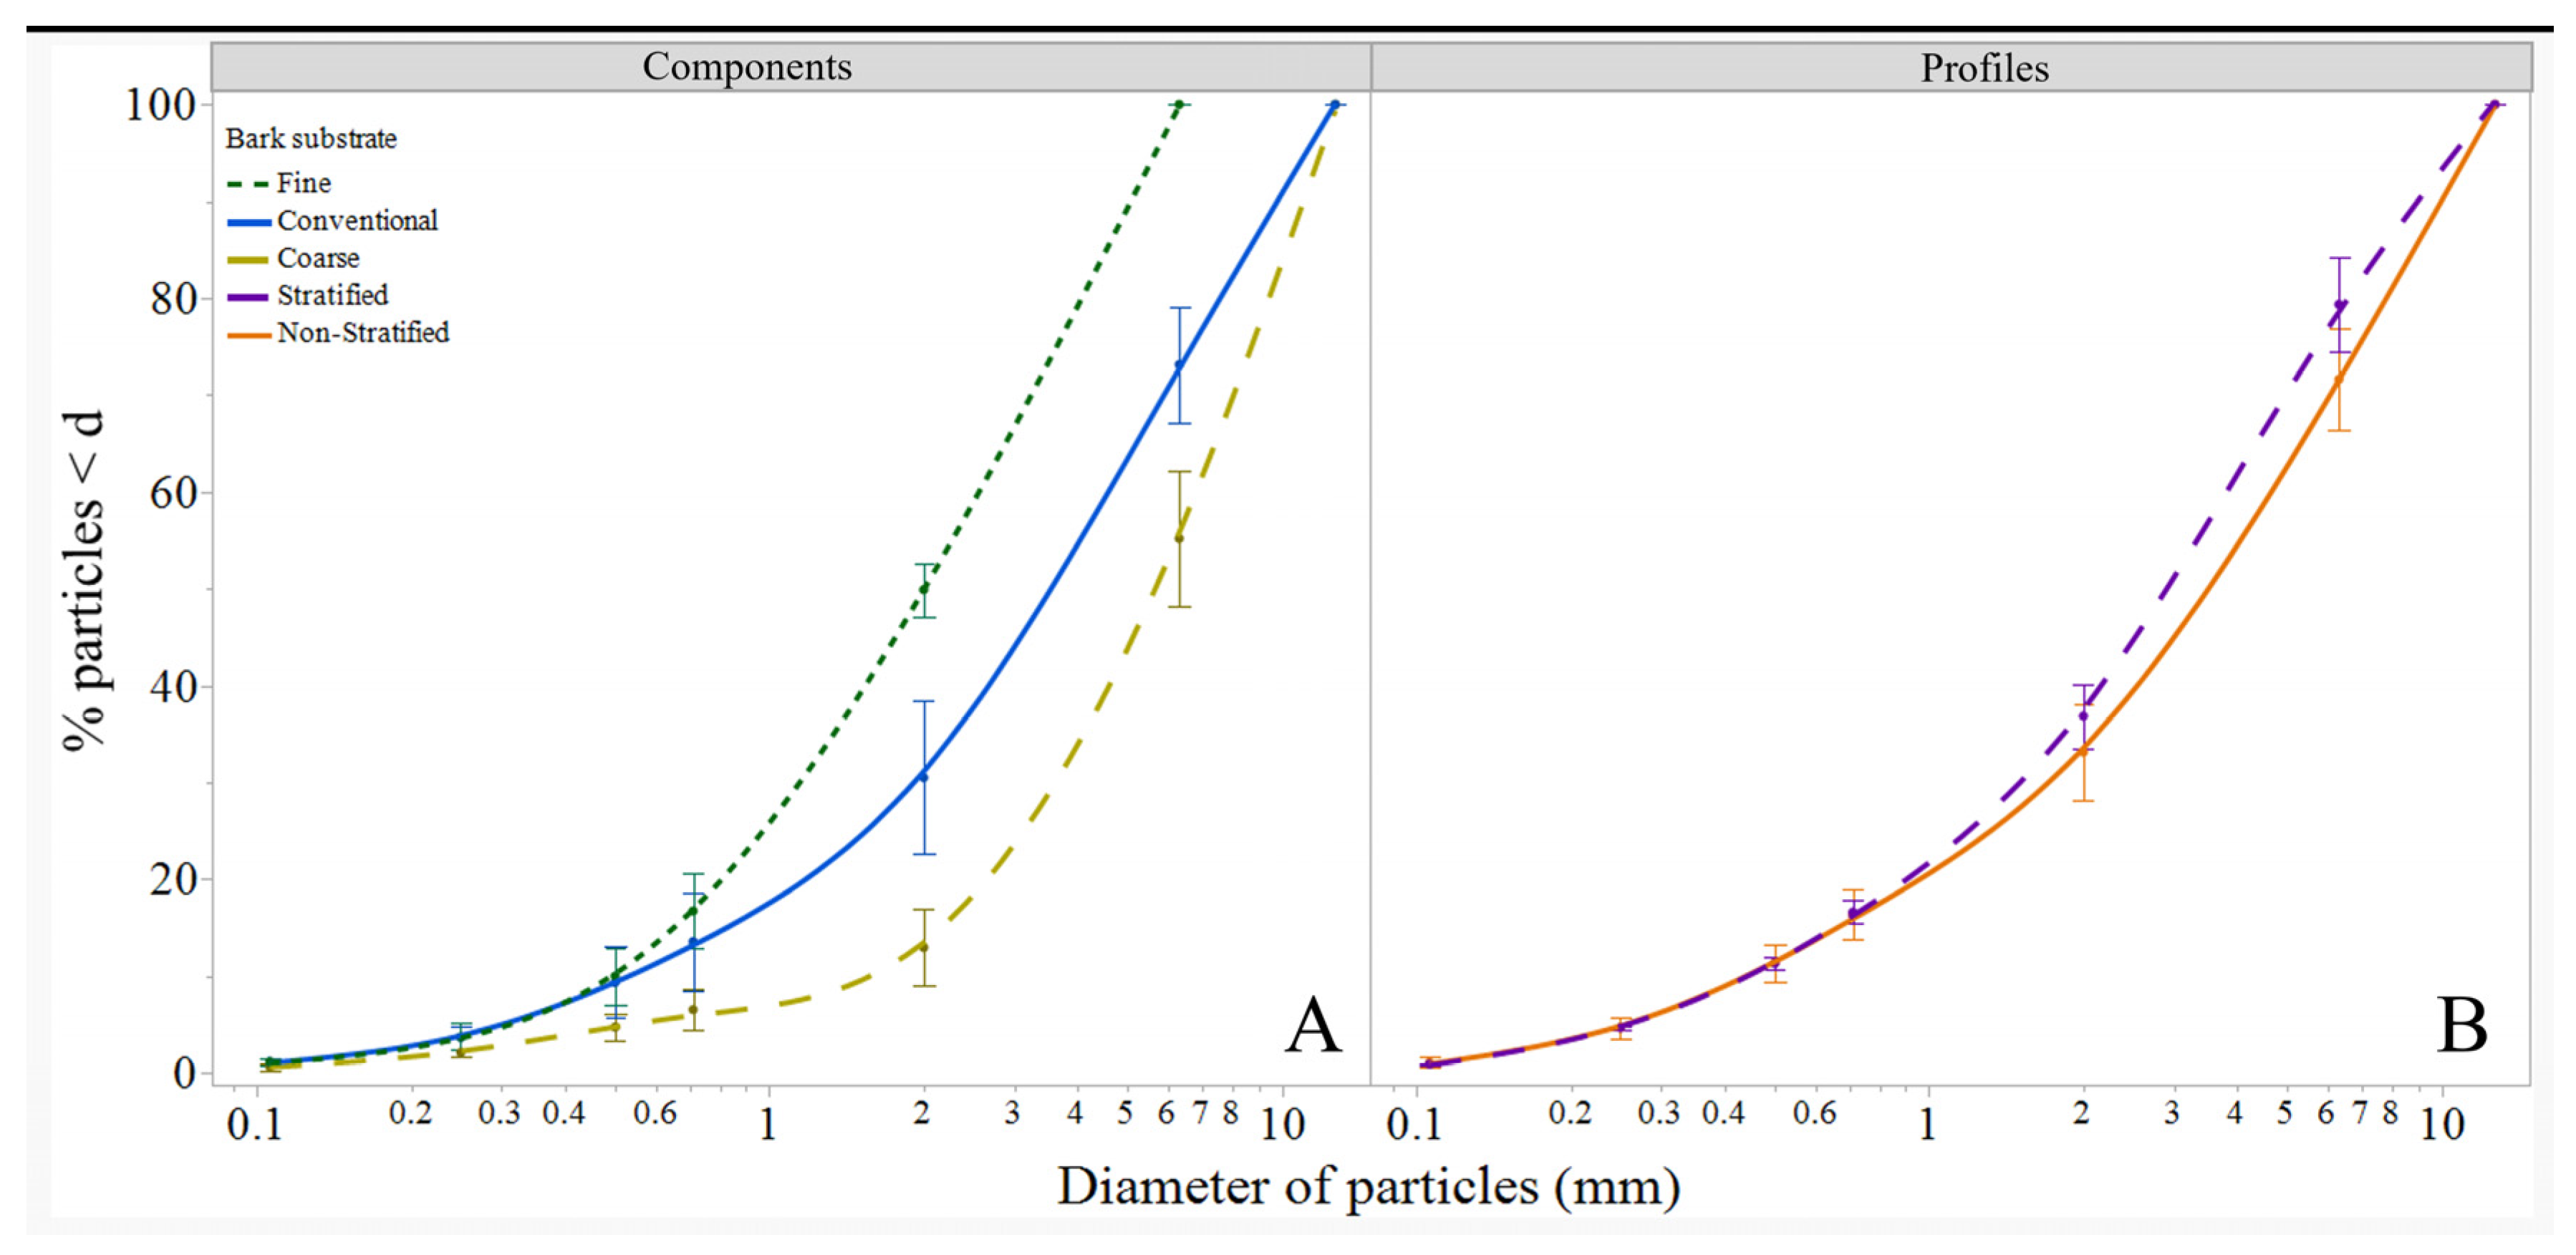
3.1. Static Physical Properties

Fine bark had a greater CC than both conventional and coarse bark (p = 0.0023; Table 1). Coarse bark had the greatest AS (p = 0.0041; Table 1), the lowest Db (p = 0.0037), and a greater TP than conventional bark (p = 0.0320, respectively; Table 1). Fine bark had the least extra-large proportions (p < 0.0001) and the greatest large (p < 0.0001) and medium particles percentages (p < 0.0001; Table 1). Coarse bark had the least medium and fine bark particles (Table 1). There were no differences observed in the root (4.4 ± 0.51 g) or shoot (4.5 ± 0.27 g) dry mass across stratified and conventional substrates; therefore, it is assumed herein that root dry mass across different substrate treatments did not have any effect on infiltration, porosity, and subsequent hydraulic conductivity. The entire non-stratified and stratified systems’ particle distributions is displayed in Figure 3.

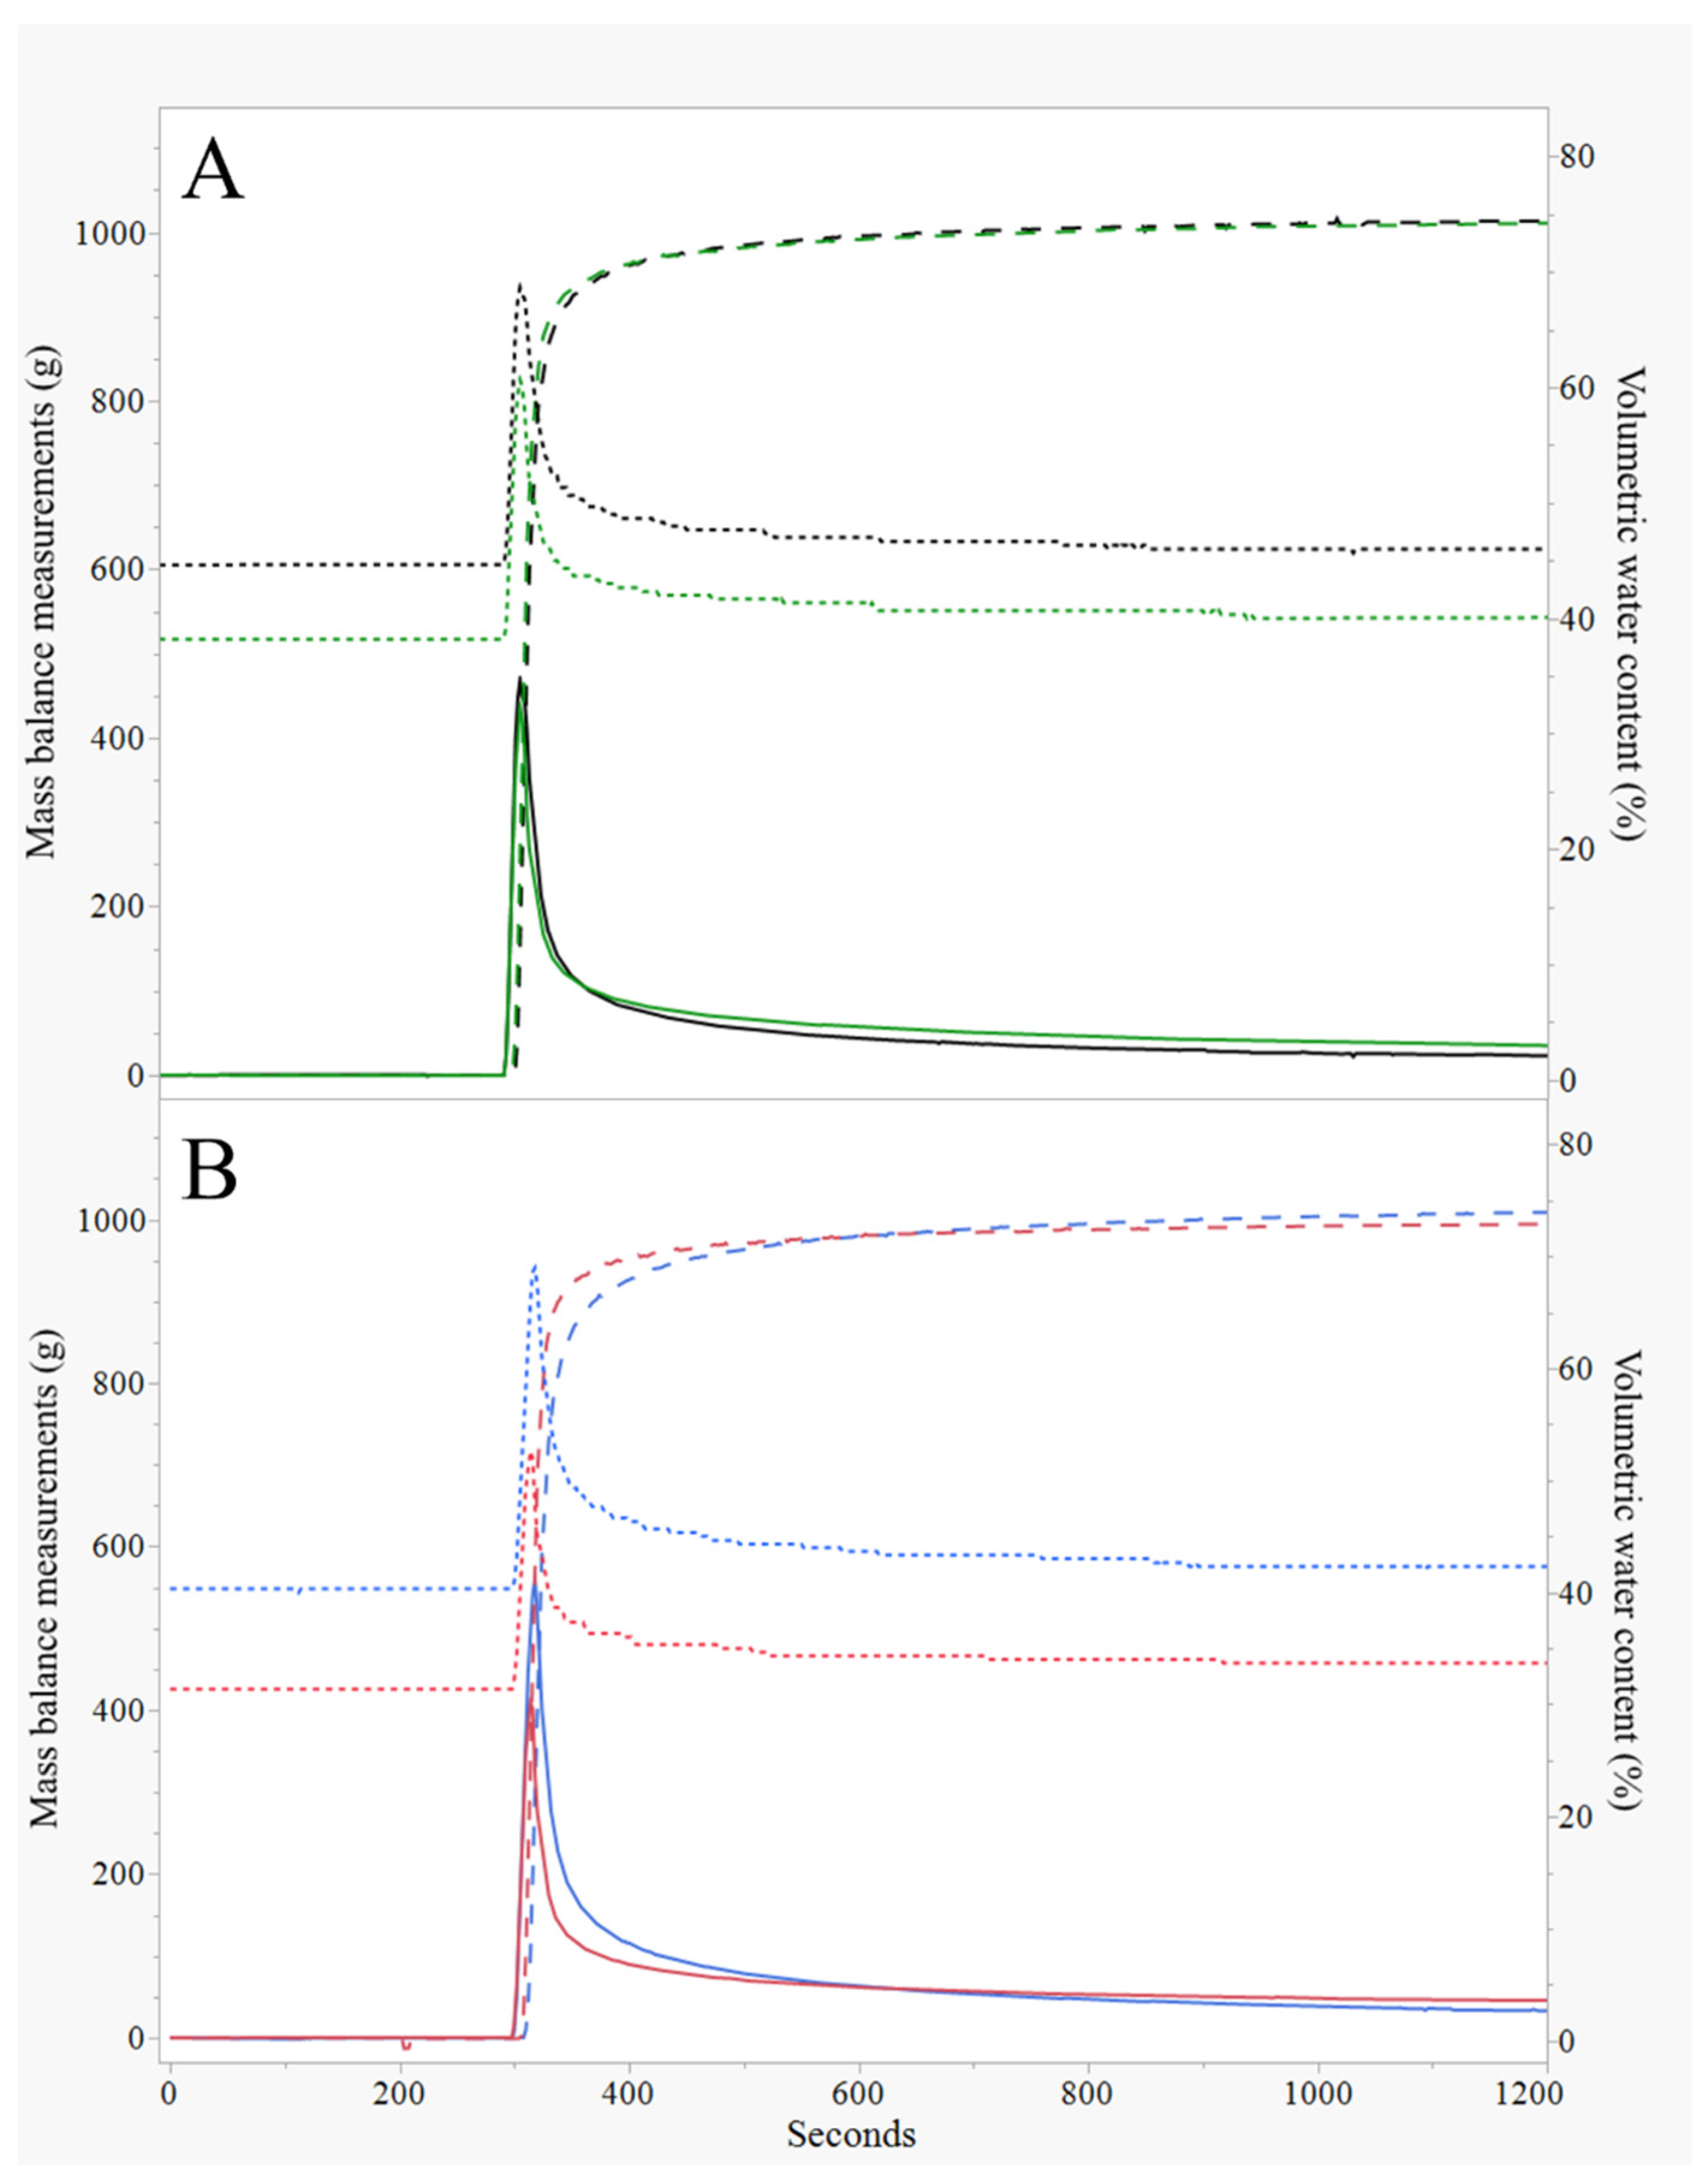
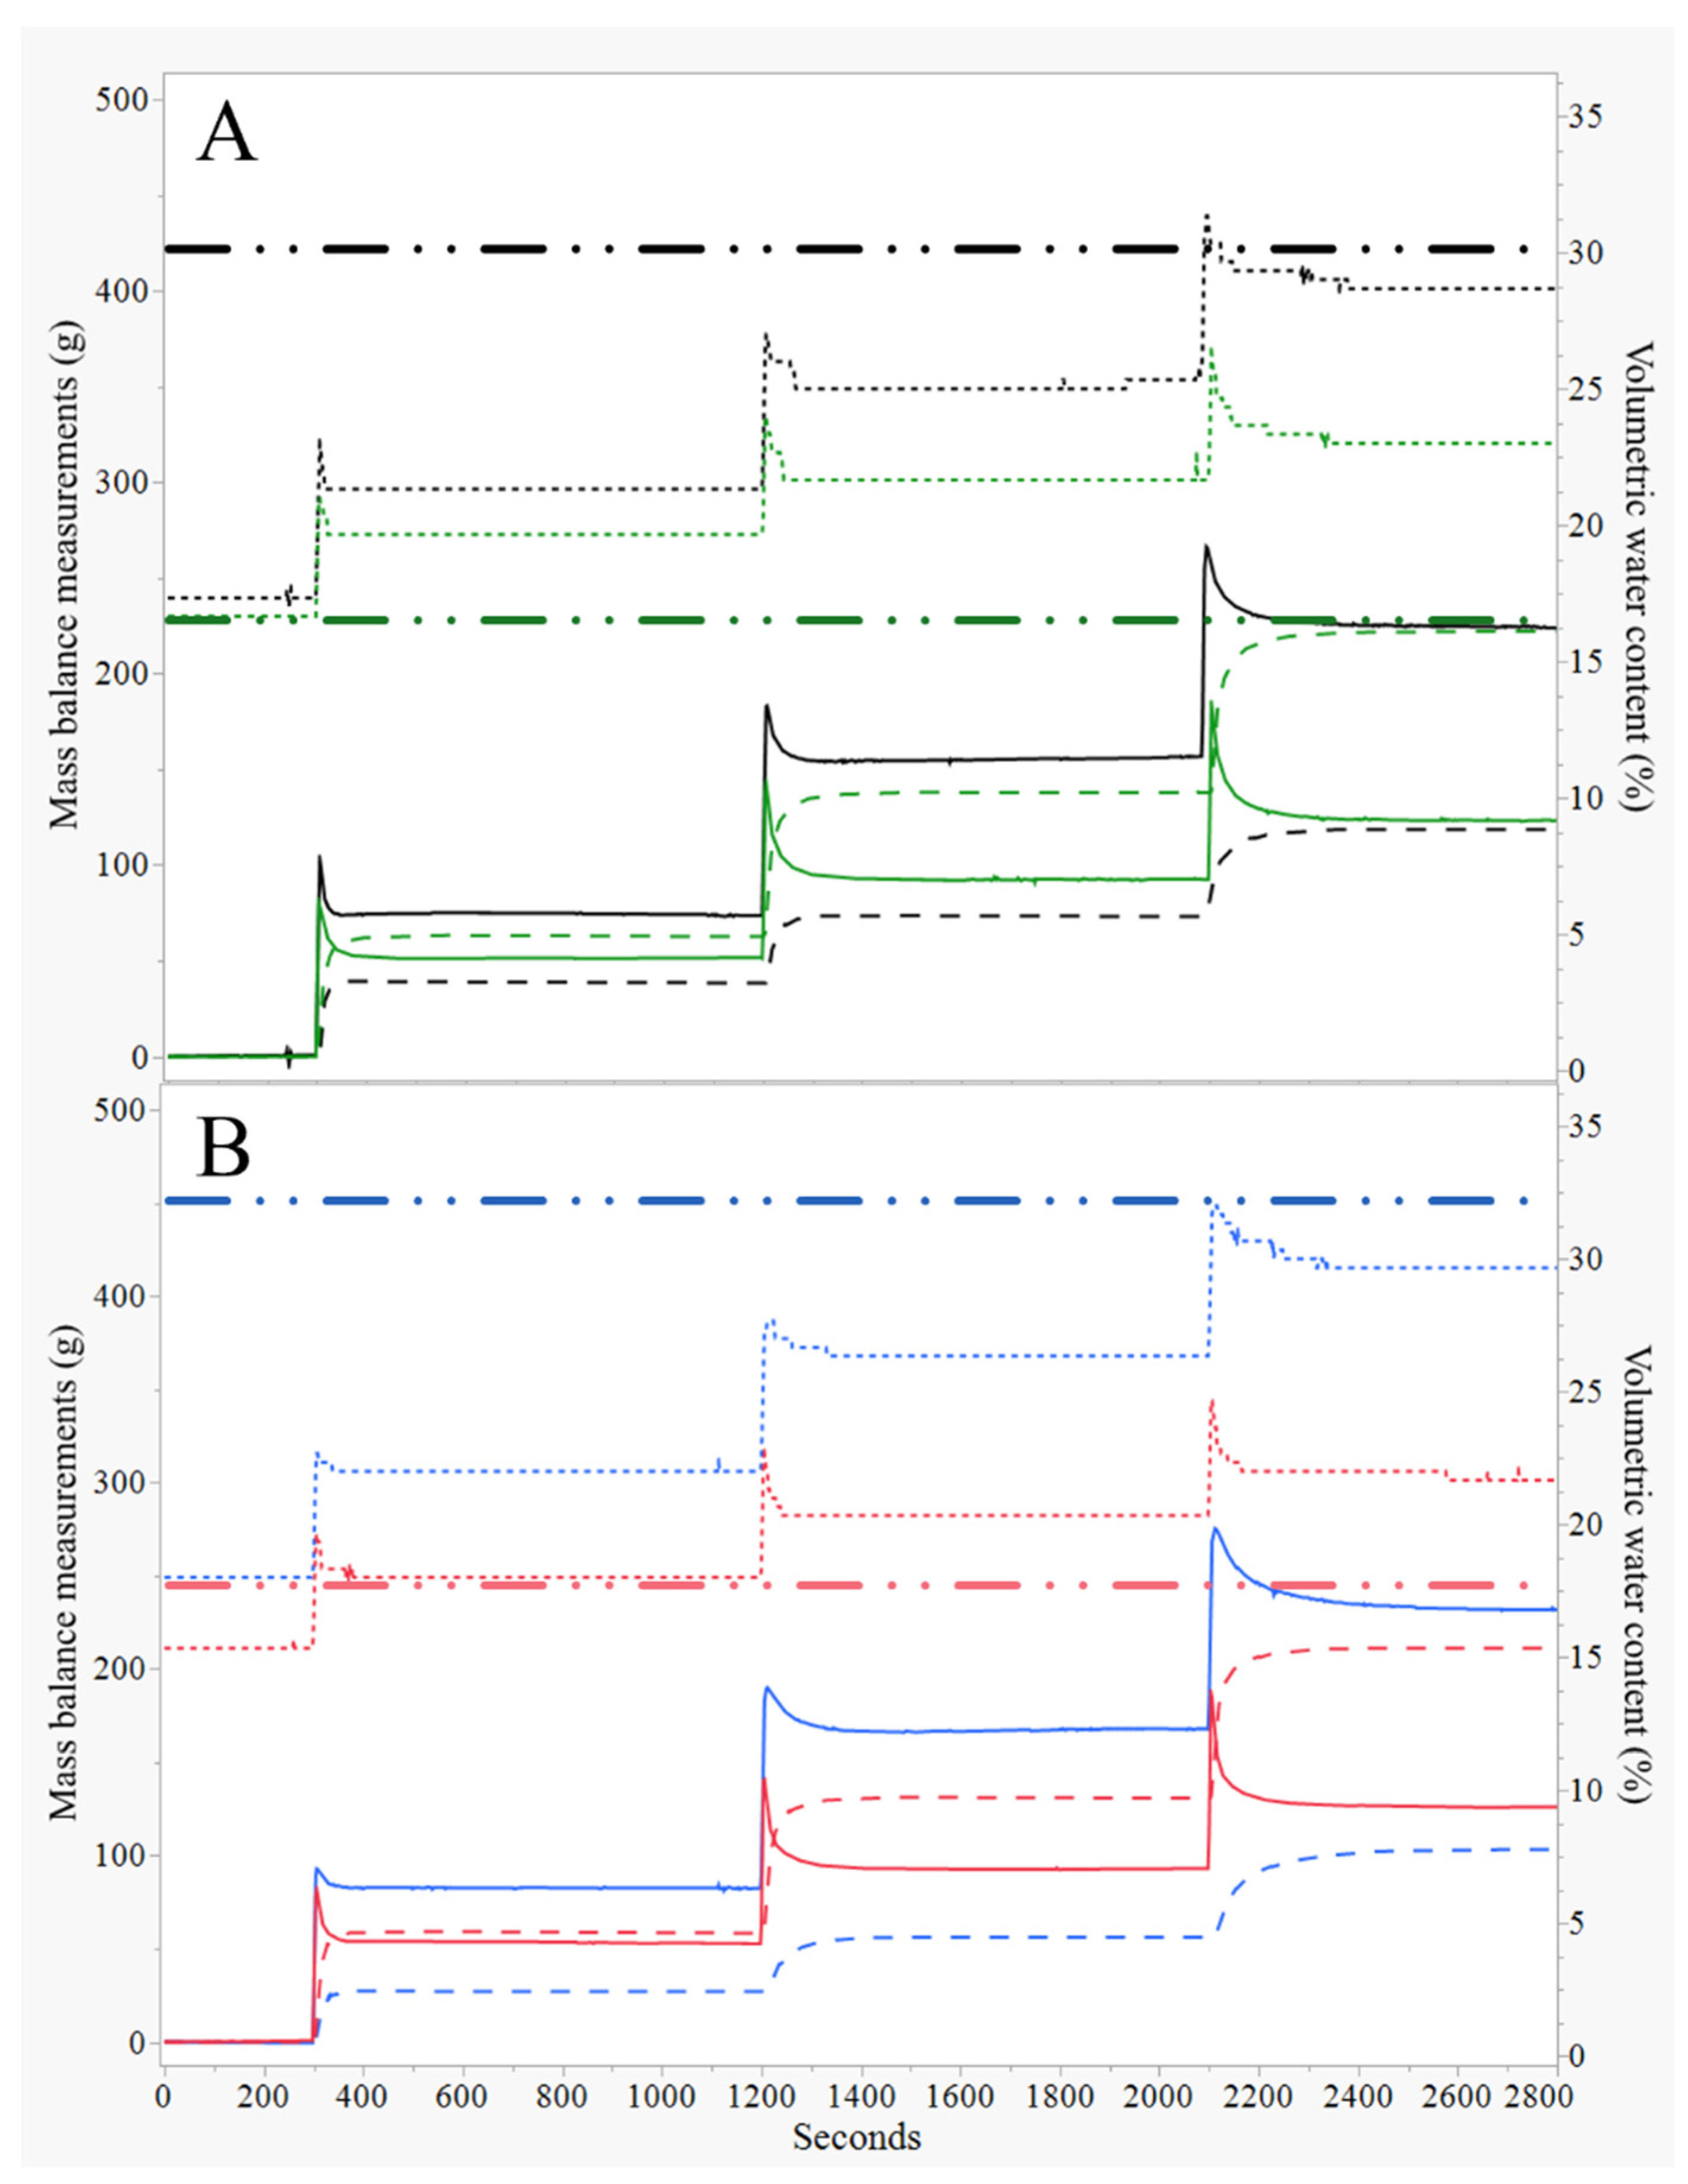
3.2. Experiment 1, eCC Initial Moisture Conditions

The substrates were initiated while already at their eCC and irrigated with a large pulse of water to identify differences in maximum water-holding capacities. Greater hydration rates signified a quicker increase in mass (i.e., water) per unit of time (sec), previously described as pore water velocity [30]. There were no differences observed in the hydration rates among the substrate (p = 0.1408) and root-explored (p = 0.5365) treatments. The water took the longest to exit in the stratified fallow substrates than all other substrate treatments (p = 0.0007; Table 2), indicating stratified substrates took longer to vacate gravitational pore water, likely due to a smaller pore diameter in the upper portions (Table 3; Figure 4).
After the large irrigation, there were minimal shifts in the substrate’s initial VWC to RC values (Table 2). The fallow substrates, regardless of substrate treatment, held more water than their respective rooted profiles (p = 0.0003; Table 2). There were no differences in the hydration rate (i.e., slope) across treatments (p = 0.5012; Table 3). There were no differences observed in substrate maximum weight (p = 0.4891) and hydration peaks (p = 0.4693) across treatments; however, stratified rooted profiles retained more water than non-stratified fallow profiles and had greater water application efficiency (WAE; water retained/total water applied) values (p = 0.0060 and p < 0.0191, respectively; Table 4).

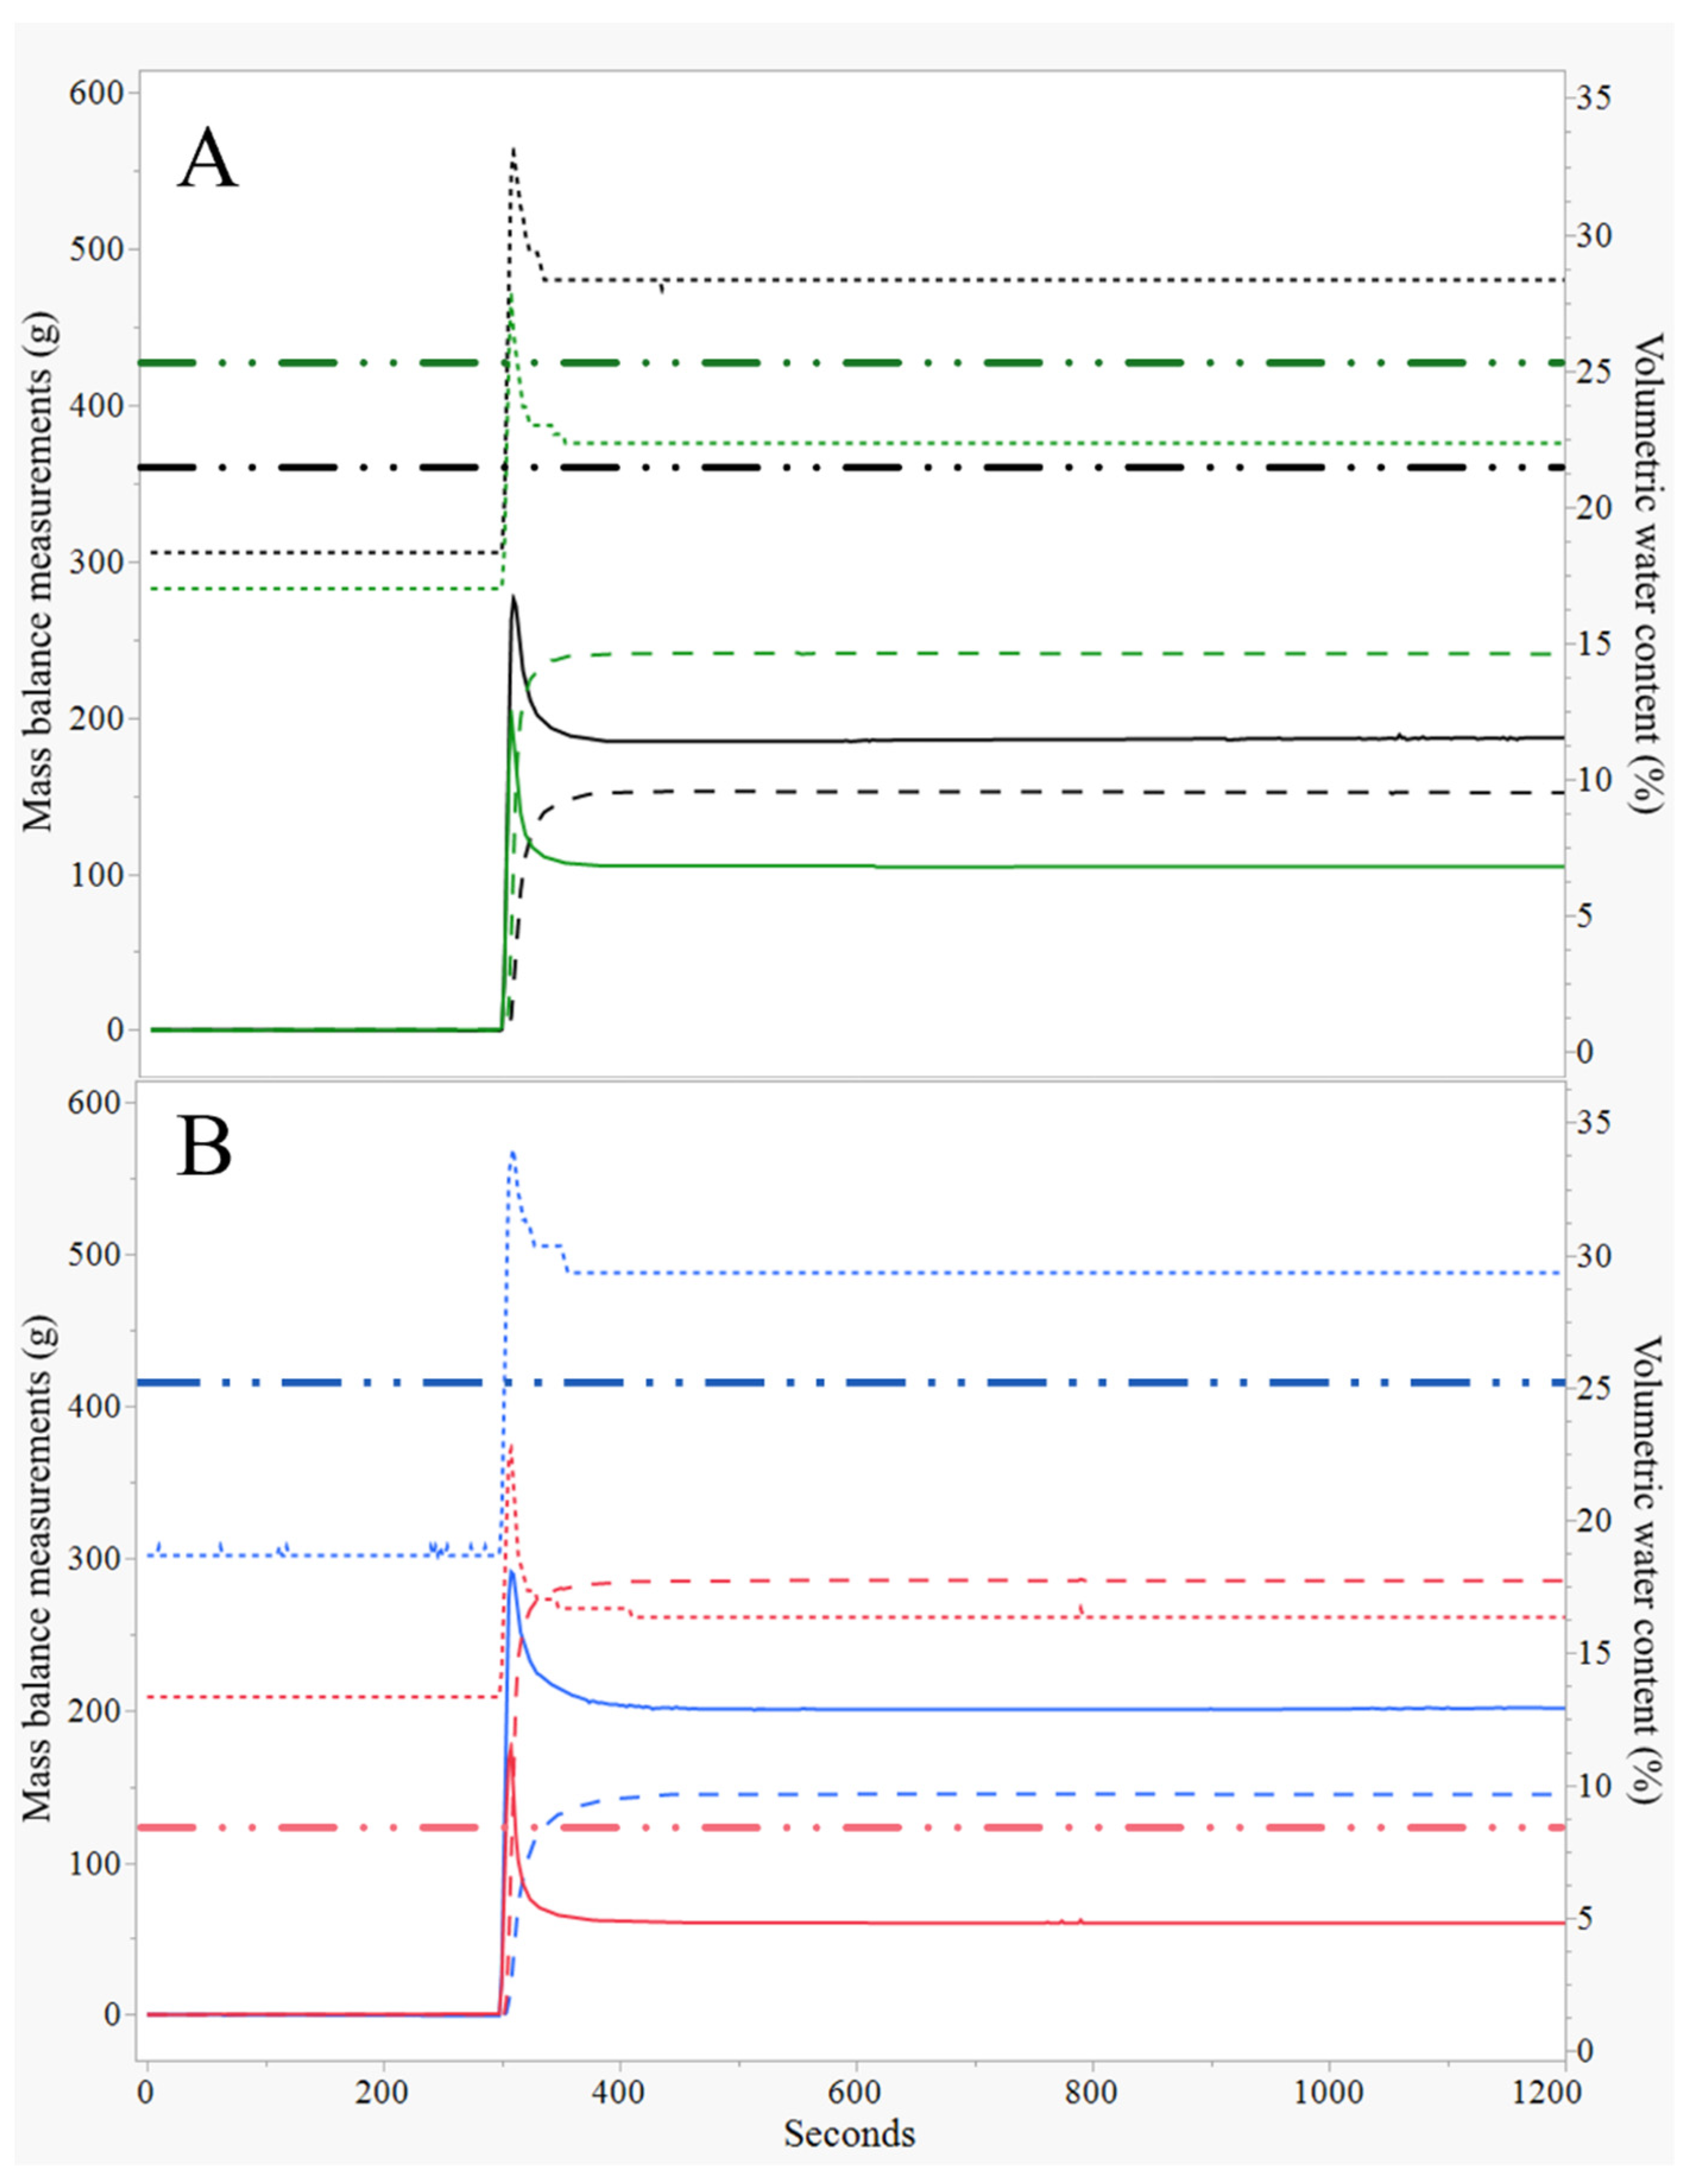
3.3. Experiment 2, Flagging Initial Moisture Conditions; (20% VWC)

3.3.1. Single Application

Data was collected on substrates initiated at approximately 20% VWC and irrigated with a single application. Comparing across the single-application irrigated treatments, there were no differences in the hydration rates across the substrate (p = 0.8833) and root-explored versus fallow profiles (p = 0.0692). Under a single application, all substrate treatments had greater RC and ECC values than the stratified rooted profiles (p < 0.0001; Table 2). However, stratified rooted substrates were considerably drier than all of the other profiles (p < 0.0001), which likely had an effect on water entry rates and retention (Table 2). Water traveled (entry to exit) at similar velocities across substrate treatments (Table 2).
In non-stratified profiles, there was an approximately 10% and 5% increase in substrate RC after the single application in both fallow and rooted systems, respectively (Table 2; Figure 5A). The non-stratified fallow substrates had a HI of 0.74, being closer to reaching their eCC than non-stratified rooted substrates (HI = 0.70; Table 2). The stratified fallow substrates had an 11% increase in VWC after the irrigation application, whereas stratified rooted profiles had a 3% VWC increase (Table 2). When comparing across fallow and rooted systems, stratified rooted profiles had a greater HI (0.78) and were closer (73.7 mL; p < 0.0001) to attaining their eCC, whereas stratified fallow substrates had a lower HI (0.72) and a remaining potential water-holding capacity of 202.0 mL (Table 2). There were no differences in substrate RC values across substrate treatments (p = 0.4461); however, with regards to fallow and rooted profiles, fallow profiles had significantly greater RC than rooted (p < 0.0001; Table 2). The fallow substrates in both non-stratified and stratified treatments were similar in their hydration peak, water retention, cumulative leached, WAE, and eCC (Table 4). This was similar in the rooted profiles except for in eCC values, where the stratified rooted held >100 mL less water than the non-stratified profile (Table 4).

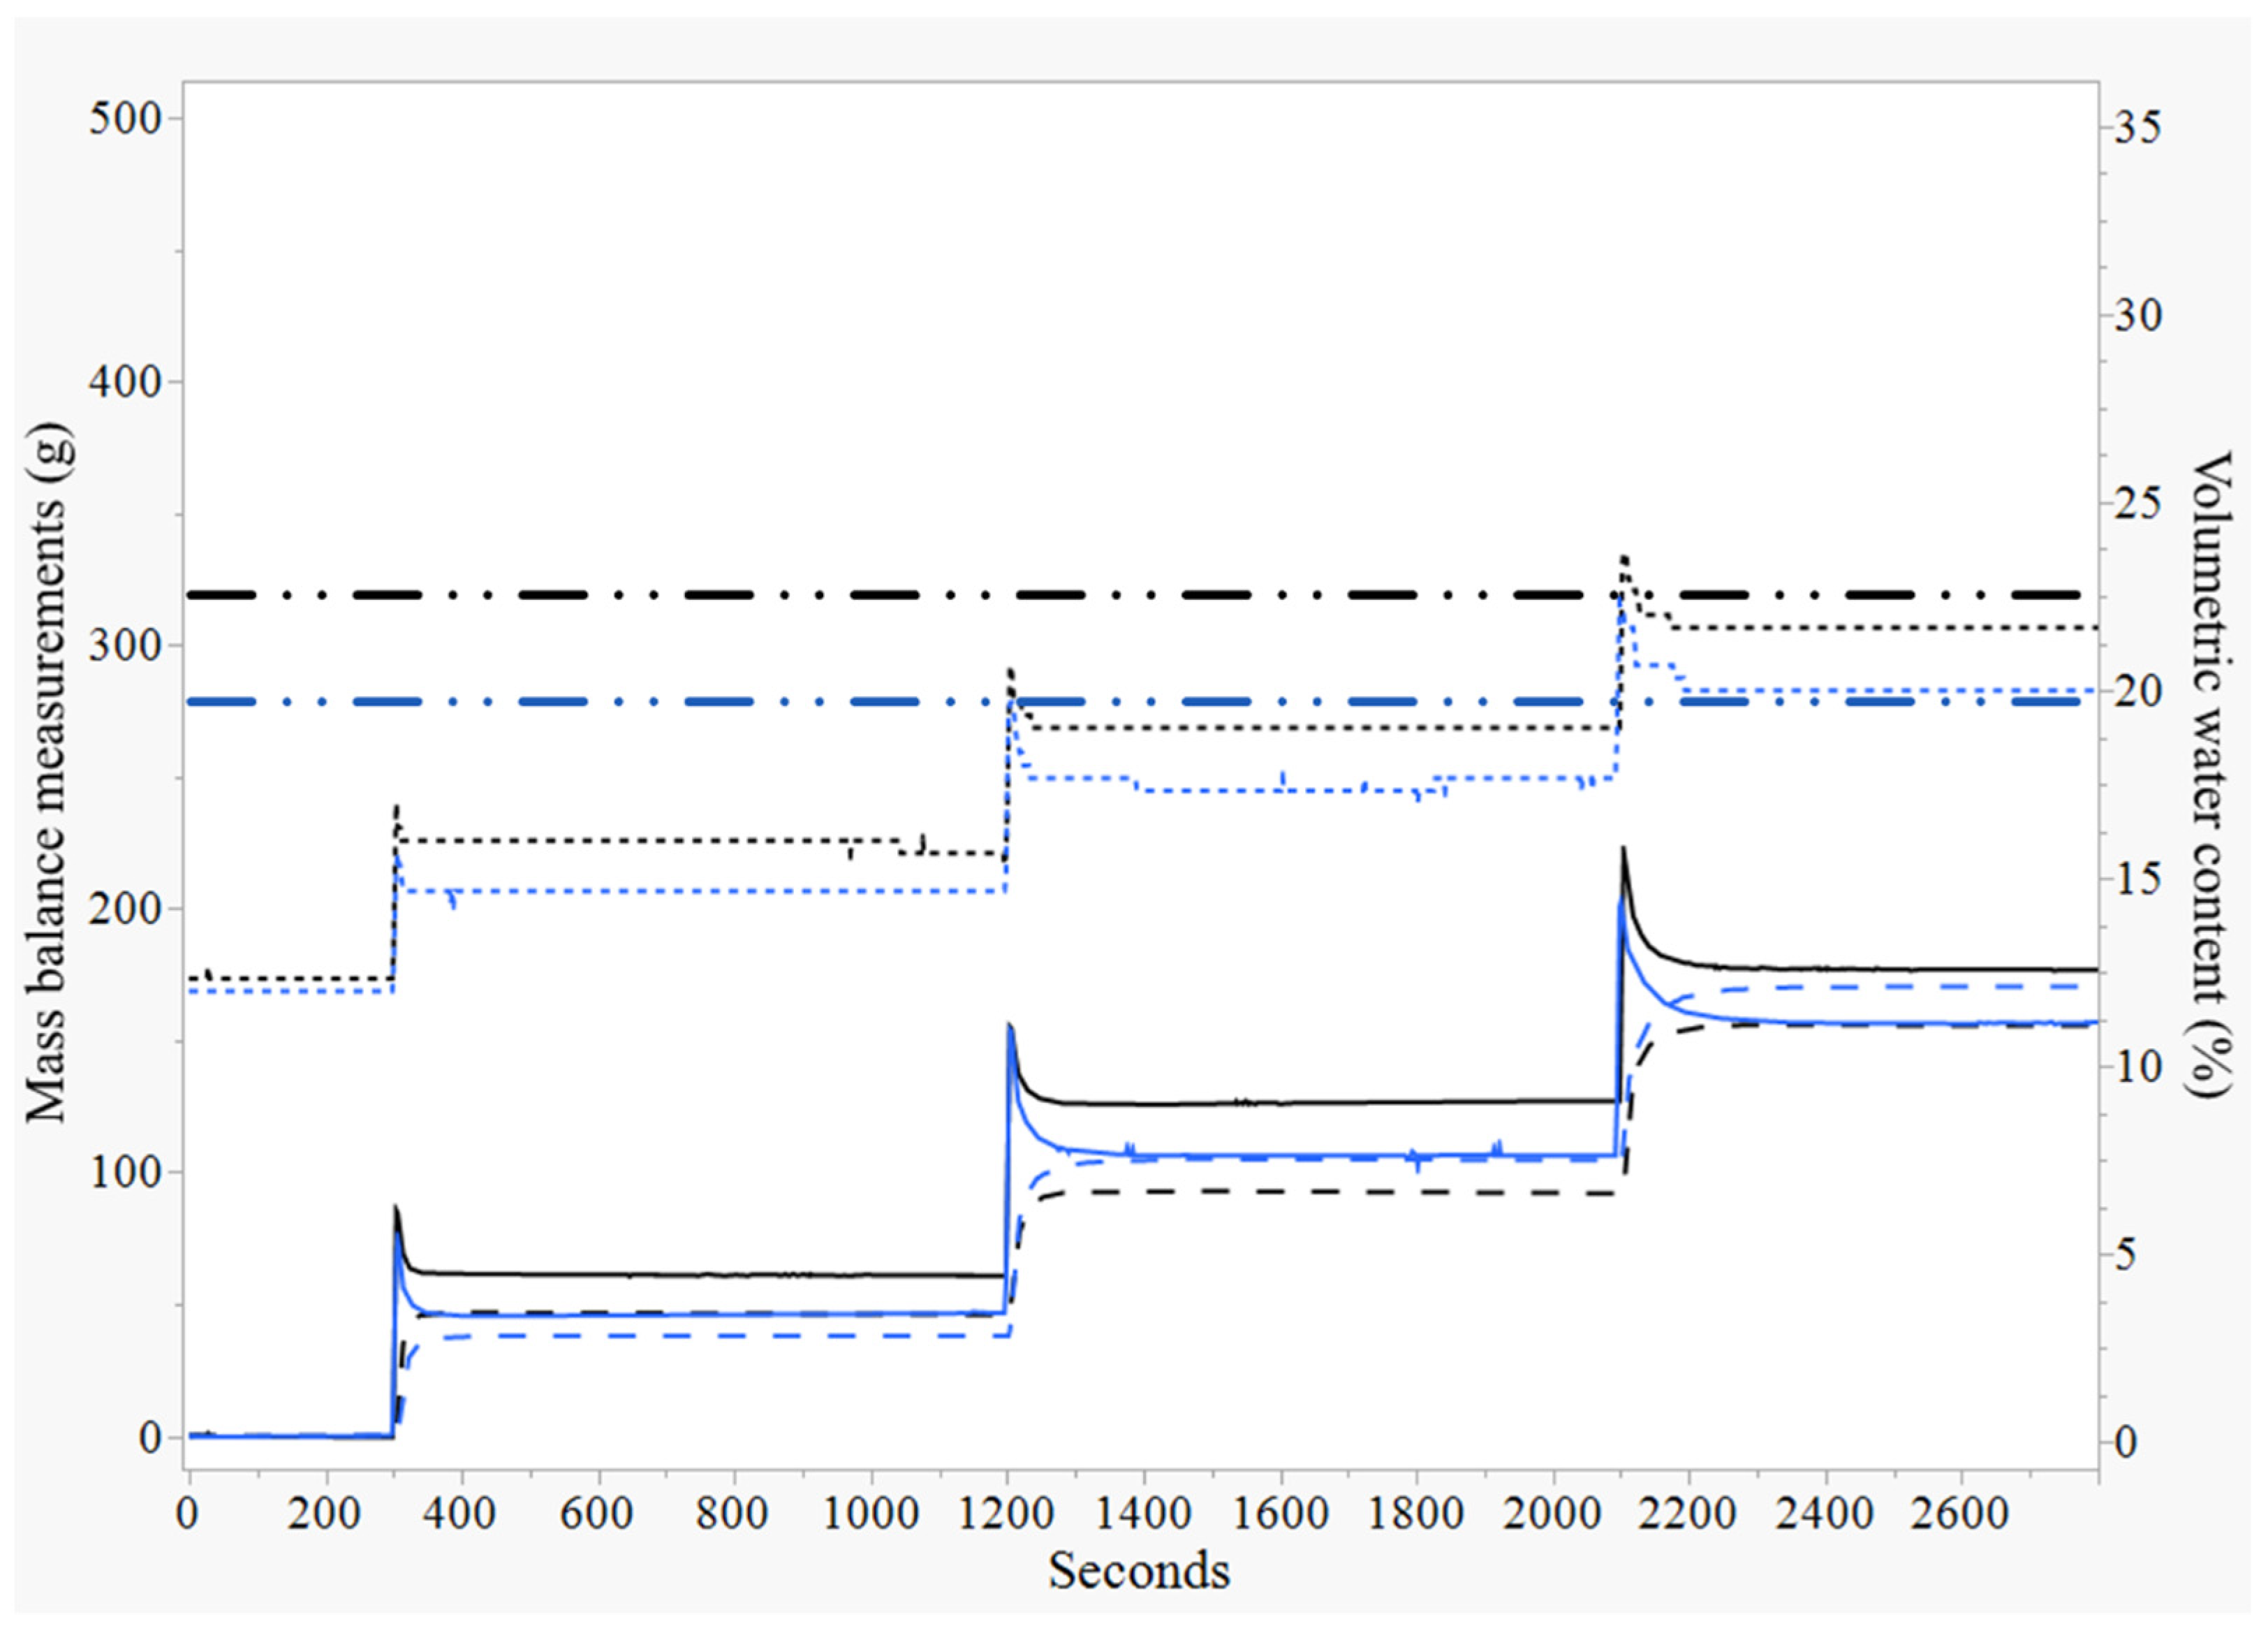
3.3.2. Cyclic Application

Treatments received three pulses of water while the substrates’ initial moisture condition was at approximately 20% VWC. In all substrate systems, the pore water velocity (entry to exit) continued to decrease with each subsequent pulse of water (p < 0.0001; Table 2; p < 0.0001; Table 3). There were no differences in an increase in mass per time across profiles (Table 3), and no differences observed in the rate of water entry to exit (i.e., leaching) in treatments under cyclic irrigation (Table 2). Additionally, the water had relatively constant velocities during all irrigation pulses, with the exception of stratified fallow profiles, where water traveled significantly slower after the first irrigation pulse (p < 0.0001; Table 2). Comparing only the cyclic irrigation pulses, water traveled the fastest during the first irrigation pulse in both fallow (p = 0.0138) and rooted (p = 0.0387) treatments. Substrate treatment had no influence on water entry to exit rates (p = 0.1101); however, root-explored profiles had a strong effect (p <0.0001).
Pooling across substrate treatments, all fallow and rooted profiles had similar initial VWC with the exception of stratified rooted treatments (p < 0.0001; Table 2). Substrate RC demonstrated there was generally more water retained after three irrigation pulses (p < 0.0001; Table 2). Pooling only in cyclic irrigation treatments, there was no substrate treatment effect on substrate RC (p = 0.3639), though the root-explored profiles had lower RC values (p < 0.0001). The non-stratified rooted substrates were 6% below their eCC, with an HI of 0.79 after the final irrigation pulse, whereas the RCs of the non-stratified fallow substrates were 10% below eCC with a HI of 0.75 (Table 2; Figure 6).
These results were similar in the stratified systems. With each subsequent pulse of water, all rooted substrates were closer to reaching their eCC than fallow substrates (Table 2). Furthermore, non-stratified and stratified fallow substrates were similar in their hydration peak, water retention, cumulative leached, WAE, and eCC (Table 4). Cyclic irrigation had no impact on hydration peak values of substrate treatments; however, cyclic irrigation facilitated stratified rooted substrates to retain significantly more water (p < 0.0001), leach less water (p < 0.0001), be more efficient (WAE; p < 0.0001), and have a greater proportion of eCC (p < 0.0001; Table 4) when compared to a single application.

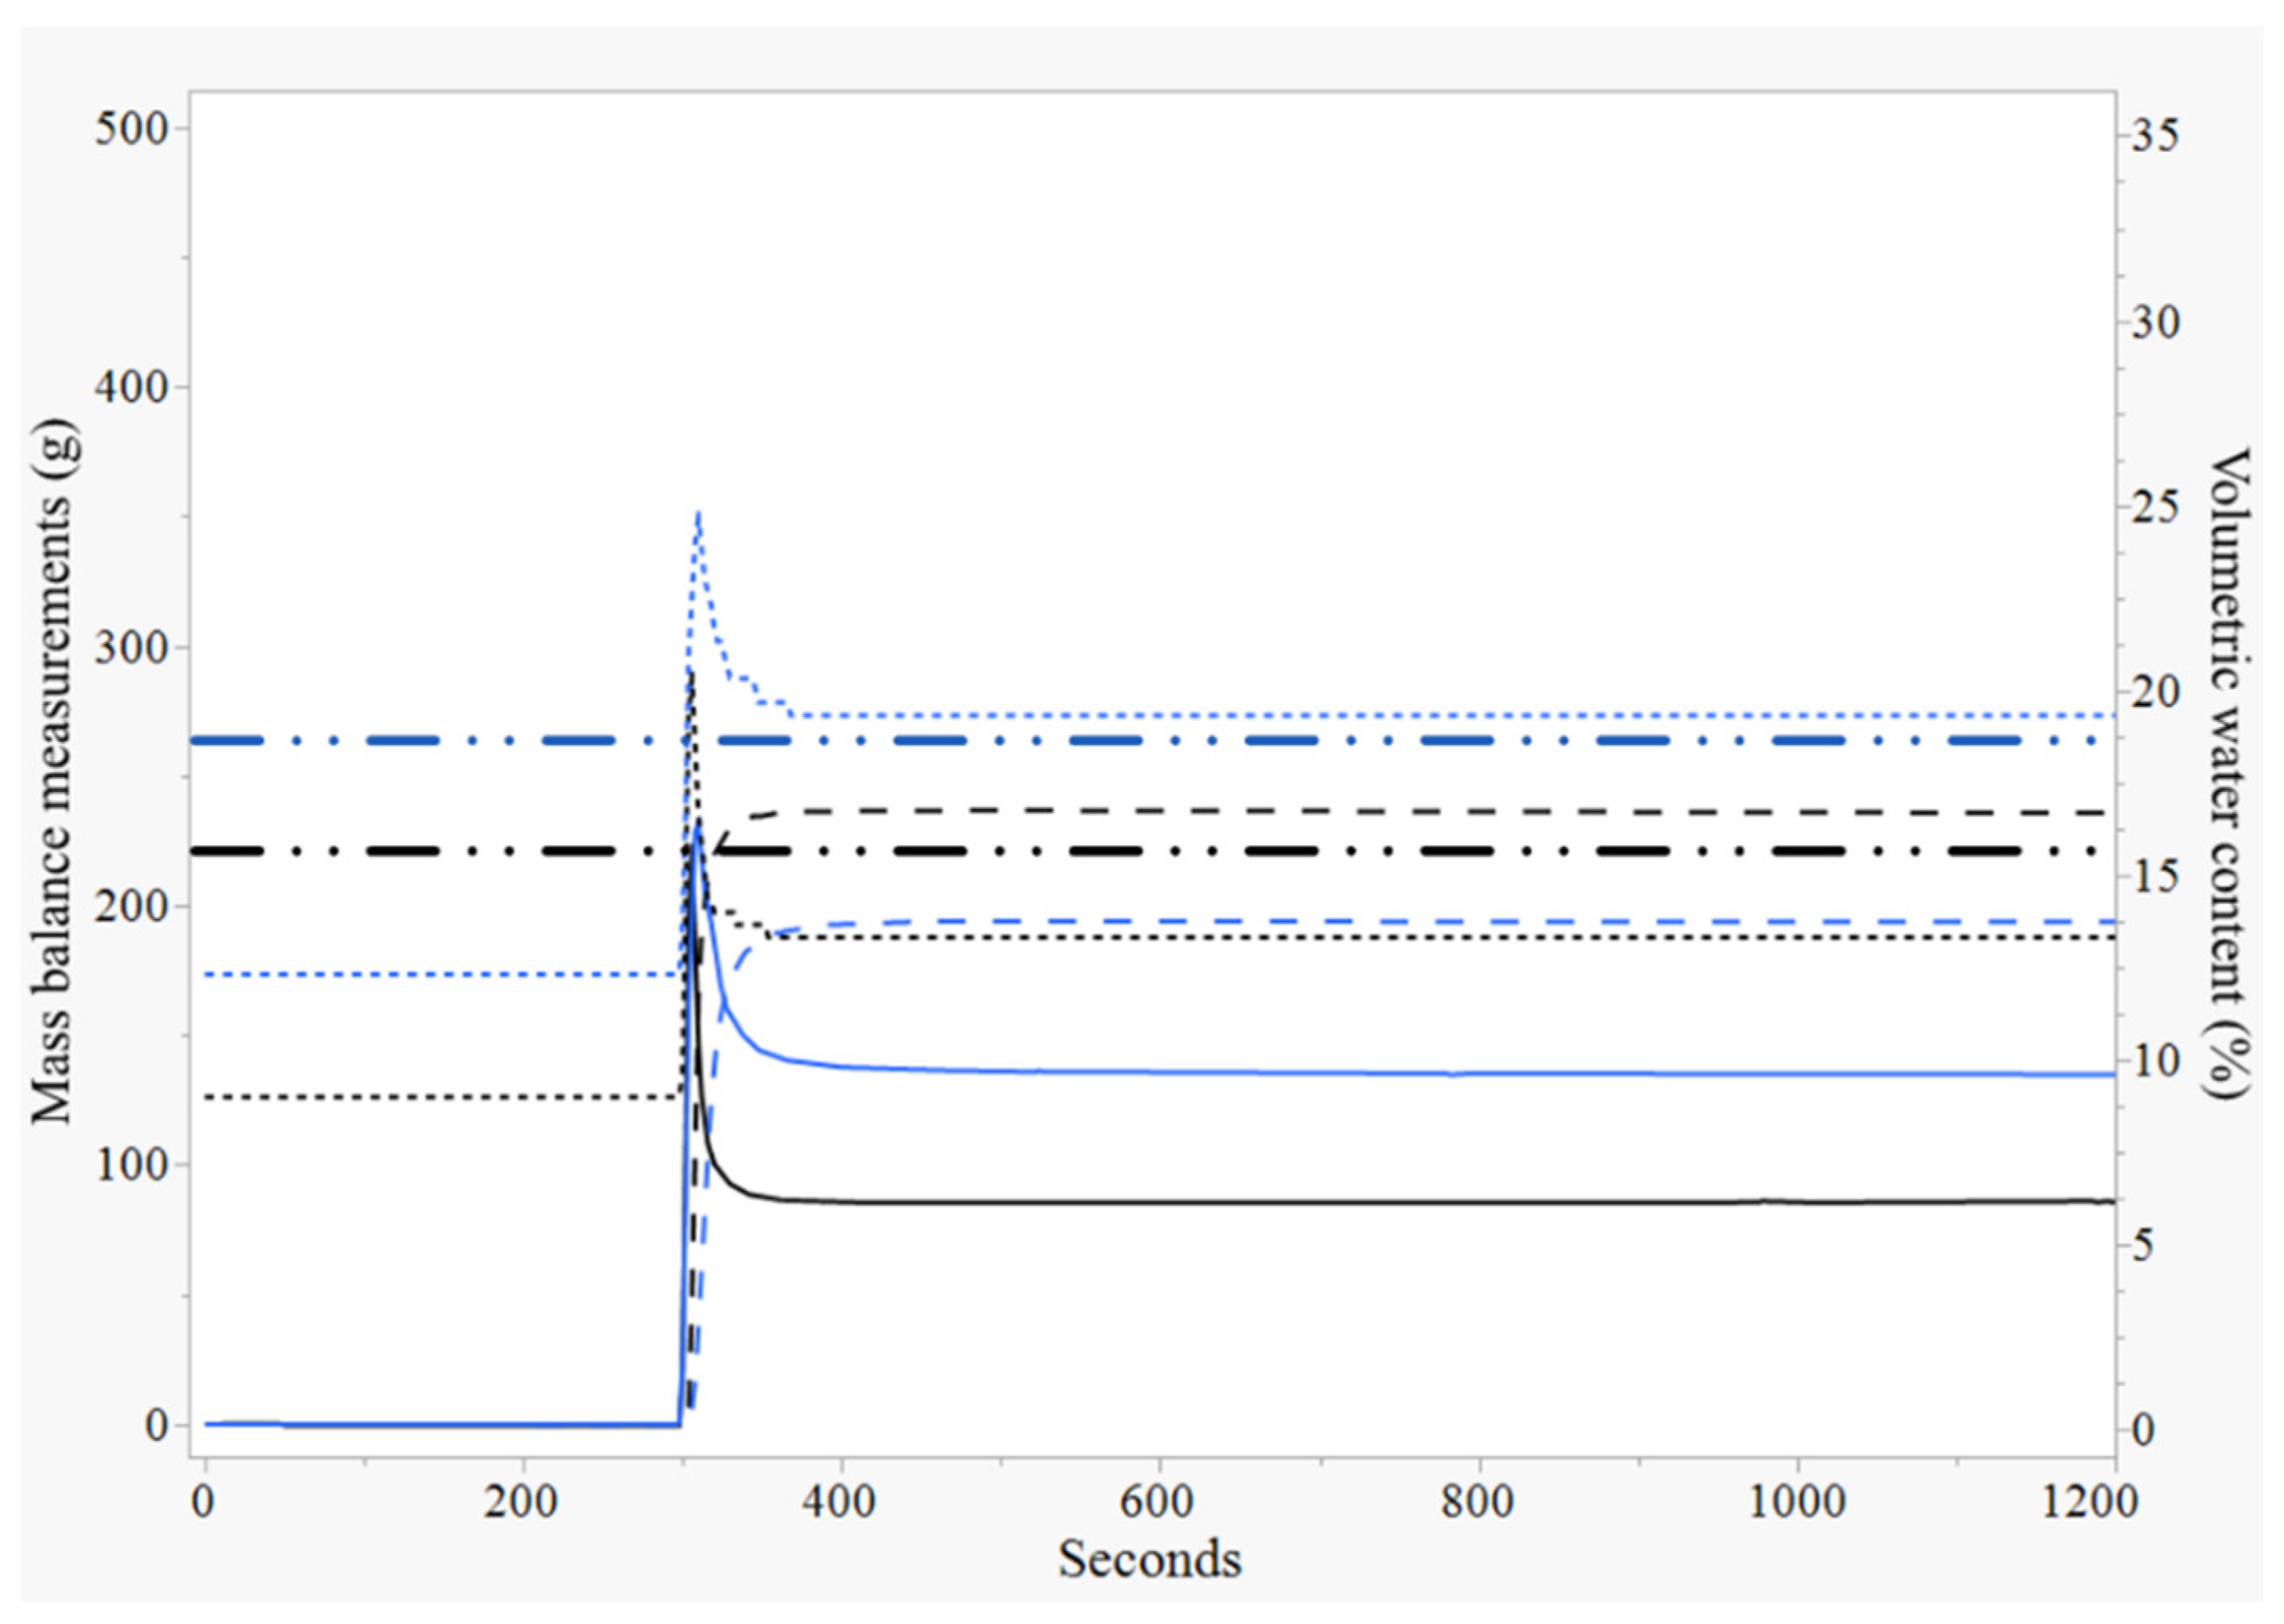
3.4. Experiment 3, Dry Initial Moisture Conditions; (10% VWC)

3.4.1. Single Application

Substrates were irrigated with an approximately 10% VWC as their initial moisture condition. Only fallow profiles (non-stratified and stratified) were examined in the dry treatments. All substrates within their respective irrigation treatment were initiated at similar VWC (Table 2). There were no differences observed in water entry to exit rates across substrate treatments under a single irrigation application (Table 2). The stratified substrates had a 7% increase in VWC after the irrigation application versus a 5% increase in VWC compared to non-stratified profiles, with resulting HI of 0.75 versus 0.75, respectively (Table 2; Figure 7). Both substrate treatments had similar RC values (p = 0.0840; Table 2). Both substrate treatments had similar hydration rates (Table 3). Additionally, there were no statistical differences in the hydration peaks, water retention, cumulative leached, WAE, and eCC among the non-stratified and stratified profiles (Table 4).

3.4.2. Cyclic Application

Treatments received three pulses of water while the substrates were initiated at approximately 10% VWC initial moisture condition. Water entry to exit rates did not change with each subsequent irrigation pulse among the substrate treatments (p = 0.3025). There were no differences observed across substrate treatments in water entry to exit rates in the first (p = 0.0789) and second (p = 0.6130) irrigation pulse. Water generally moved faster after each irrigation pulse in both substrate treatments (Table 2). Both substrate treatments had a similar increase in VWC (8 to 9%) after all cyclic pulses were applied (Table 2; Figure 8), resulting in no differences observed in substrate RC (p = 0.0840; Table 2). The non-stratified and stratified substrate VWC were 7% short of reaching eCC, with an approximate HI of 0.75, after the final irrigation pulse (Table 2). However, non-stratified profiles retained significantly more water (>2×) when cyclic application was delivered (p = 0.0492), and their water application efficiency improved (Table 4).
There were no statistical differences in the hydration peaks (p = 0.1422), cumulative leached (p = 0.1022), and eCC (p = 0.4670; Table 4). Cyclic irrigation allowed the non-stratified substrates to retain more water and have greater WAE values than in a single application (Table 4).

4. Discussion

4.1. Non-Stratified versus Stratified

Water movement through substrates are extensively influenced by pore space and their connectivity between each other [31]. Drzal et al. [17] identified the pore space variations in substrates, reporting substrate pores range in size from 416 μm (macro) to less than 0.2 μm (ultramicro). In soils, the relationship between particle size distribution strongly influencing pore size distribution has been well documented [32]. In soilless substrates, Nkongolo and Caron [33] demonstrated the same relationship of particle size to pore size, reporting that fine bark particles increased the proportions of smaller diameter pores. Soil systems therefore provide the conceptual basis for pore distribution and water movement for application in soilless substrate systems. Hoskins et al. [22] utilized these long-held soil-based concepts as a foundation for explaining their findings in which water movement was more restricted through micropores (more ubiquitous in fine bark; upper strata) of a bark-based substrate; whereas water movement through macropores between bark particles (more present in coarse bark; lower strata) was less restrictive.
Selker [34] describes three mechanisms of water flow through varied soil textures: (1) fingered or channeling (i.e., narrow vertical movement through profile), (2) funnel or expanding finger flow (i.e., increasing array of channels when moving vertically through the profile), and (3) macropore flow (i.e., non-capillary or gravitational pores) that again provide a conceptualization of water movement through the soilless substrate profile during irrigation or rain events; specifically preferential flow patterns. Both traditional (i.e., heterogeneous pore/particle distribution) and stratified (i.e., two different homogeneous pore/particle distributions atop one another) substrates of different textures may experience various forms of water flow and infiltration/percolation due to varying pore size distributions. For example, we hypothesize that fine bark particles, and consequently, small pores, may result in greater funnel flow. Fine particles create a stronger capillary effect [32] than coarse particles and may uniformly and laterally spread the wetting front. Coarse substrates may promote mechanisms such as fingered or macropore water flow due to the increased proportions of larger diameter pores. In the stratified system, the fine bark above a coarse-textured pine bark may impede and well distribute water before arriving at the stratum interface, allowing for a more funnel-like or distributed water entry and subsequent macropore flow movement in the coarse pine bark than the expected fingered flow. However, the velocity of water moving through the vertical profile of the coarse substrate reduced retardation until reaching the transient water table (i.e., the bottom of the container).
To better understand water movement, the tortuosity of a given soilless substrate must also be considered. Typically, longer infiltration rates can be due to greater distances that water has to travel through a porous media. These longer paths, often defined as tortuous paths, can be quantified as the ratio of the average roundabout path to the flow route [32], or in other words, the ratio of the path (length) water moves through a porous media to length with respect to the substrate. Tortuosity has been positively related to soil porosity, and the influence that particle arrangement has on soil tortuosity has been empirically considered [35]. It was observed that tortuosity decreases as particle size increases [35]. Fine bark particles have significantly smaller particle diameters than coarse bark particles (Table 1). Therefore, it is possible that the top strata experience more lateral water redistribution and contains more tortuous paths than unscreened bark, even if the pore distribution is more uniform.
In this research, water entered and exited at similar rates when irrigated at 20% VWC when comparing the finer upper strata and coarse lower strata versus the highly porous unscreened bark (Table 2 and Table 3). However, the water took longer to enter and exit stratified systems when the entire profile was at eCC (Figure 4). This can be due to two primary reasons: (1) combined tortuosity in the substrate profiles (i.e., coarse versus fine texture) and (2) homogeneous pore distribution. Thus, the upper portion of the stratified system is believed to have more tortuous paths than the upper portion of non-stratified, more heterogeneous bark profiles; water possibly takes longer to travel in the top layer than conventional systems; however, the lower stratified fraction comprised of coarse (i.e., large particle) and consequently, large pores likely have m less tortuous paths than the lower half of the non-stratified profiles that are comprised of conventional bark. The result is that bulk gravitational water may quickly drain from the stratified substrate. Whereas in non-stratified profiles comprised of an entire system comprised of heterogeneous-sized particles and pores, the tortuous path may be constant throughout the column, which ultimately results in longer percolation distances than in the stratified systems. However, due to the increased water retention and more lateral water distribution, stratified substrates did take a longer amount of time than non-stratified substrates to fully vacate gravitational water (Figure 4).
Furthermore, homogeneous pores may have initially allowed water to quickly travel through both strata. The stratified bark particles are of similar bark diameters (a result of the screening process), attributing to a more uniform and homogeneous pore distribution [6]. Growers attempt to combat this occurrence of quick water infiltration and subsequent leaching by two methods: (1) increasing the proportion of sand or fine particles in their growing substrates and (2) increasing irrigation frequency and decreasing irrigation load (i.e., cyclic irrigation). This can decrease the infiltration rate because the longer it takes for water to move through a substrate, the more thorough the wetting that can be achieved [36]. Under dry conditions, non-stratified profiles retained greater than 2× their RC value under a cyclic application compared to a single application (Table 4). This can be attributed to the heterogeneity of substrate particles and pores when preferential flow occurs. The varying pore size distribution in non-stratified systems may have resulted in increased water retention when water channels downward through the profile, whereas in the stratified systems, preferential flow may be more prominent in the hydrophobic conditions due to the increased pore uniformity.
Over all of the treatments, the stratified substrates had longer water entry to exit rates than non-stratified systems (p = 0.0266). The stratified profiles had slightly lower RC values after the single irrigation application than non-stratified systems when irrigated at 20% VWC (Figure 5). Large pores spaces can support rapid infiltration of water and subsequently increase air-filled porosity [19]. The reduced water storage in the bottom stratum of stratified substrates can be attributed to the slightly lower VWC (Figure 5). The initial purpose when first proposing stratified substrates was not to hold more water (i.e., have greater VWC) but rather to have a more optimal and uniform moisture gradient through the vertical profile a given container. This would allow producers to address a continual challenge with traditional container systems (non-stratified) in which there is a transient water table present at the container bottom [8] and a drier or lower VWC at the top of the container. This moisture gradient in the container is counterproductive when establishing an easily water-stressed plug or seed in the driest portion (i.e., the top one-third of the container profile). The high VWC or saturated bottom of the container can reduce root exploration and its subsequent health. The stratified substrates present an opportunity to invert where the water is held in the container profile (from the bottom to the top of the substrate profile).

4.2. Single Application versus Cyclic Application

Two widely used irrigation regimes employed in nursery production are single (or continuous) and cyclic applications. A single application involves applying the required irrigation in a ‘single’ event [37], while cyclic application comprises fractionating the required irrigation load and irrigating shallower, yet more frequent applications to continuously replace the reservoir of available water lost throughout the day [13]. The shallower irrigation loads that are accompanied with cyclic irrigation intermittently refill the continually emptying substrate pores, enabling the bark particles to retain a larger portion of applied water. Single applications typically occur within an hour period; however, cyclic applications would be, for example, applied in three 20 min intervals over a 6 h period. Additionally, the decrease in hydrophobic occurrences in the substrate aids in improved water distribution when entering the substrate surface and slowing downward movement [36]. This not only allows the profile to maintain substrate moisture content throughout the day [15] but also has been shown to reduce water from quickly leaching out of the container bottom [38]. Conversely, the large irrigation loads from single irrigation applications that fall upon a dry or hydrophobic substrate surface are more likely to channel and thus exceed the substrates’ absorbing rate. Therefore, water quickly infiltrates through the profile and leaches out [39].
The authors hypothesized that stratified substrates, with a similar or lower eCC, would be more efficient at retaining and delivering available water when more frequent and shallow irrigations are applied (i.e., cyclic) over hours than if large volume, single irrigation applications are applied over a short period of time (e.g., minutes). Cyclic irrigation had multiple effects on the stratified rooted substrates with regards to a single application. The cyclic application resulted in longer water entry to exit rates through substrate profiles than in a single application under wetter conditions (p = 0.0305). However, in drier conditions, cyclic irrigation did not have an influence on water entry to exit rates (p = 0.5621). The irrigation schedule enabled the substrate to retain significantly more water and, conversely, leach less when compared to single, large irrigation (Table 4; Figure 5 and Figure 6). Furthermore, cyclic irrigation improved stratified rooted treatments’ water application efficiency and increased the treatment eCC after all irrigation pulses were applied (Table 4; Figure 6). These results (i.e., reduction in leaching) parallel the results observed by Yeary et al. [38]. The findings of this study further support that pairing cyclic irrigation and stratified substrate systems promotes better irrigation and substrate efficiency by altering the distribution of water and decreasing water movement due to more tortuous paths in the upper strata. Slowing down water movement allows for greater lateral distribution, wetting a larger portion of the upper stratum volume, thus, allowing gravitational water to better distribute before potentially draining.
In both substrate treatments under cyclic irrigation, slope equations (hydration rate) showed there was a slower infiltration rate in the final pulse of water than the initial pulse (Table 3). Additionally, the hydraulic retention time of water (i.e., the amount of time for water to enter, percolate, and leach) for both substrate profiles increased with each successive irrigation (Table 3). Perhaps during the first irrigation, there was channeled flow [34], and water quickly infiltrated through the profile. During the second irrigation pulse, water may have quickly traveled down identical paths, and the wetter tunnel slowed movement down (Table 2).
However, after two irrigation pulses, initially inaccessible pores due to fingered flow became more accessible, filling over time. Moreover, the substrate had 30 min to redistribute water even though the profile and the final pulse of irrigation further slowed the flux of water, which is thus attributed to lower hydration rates and an increase in the hydraulic retention time (Table 2 and Table 3). Hoskins et al. [30] demonstrated that irrigation water can quickly channel through dry sections of the profile, which can result in uneven redistribution patterns. This quick channeling can be the cause of the rapid and large quantity of leaching, as seen in single applications (Table 3).
With each subsequent irrigation, all substrate treatments increased in VWC under cyclic application (Table 2). The wetter bark particles and an increasing number of water-filled pores after each irrigation enabled longer retention times, which is confirmation that cyclic irrigation can allow for more uniform wetting fronts with each successive pulse. In the final irrigation pulse, a more uniform wetting front through the upper profile enabled the water to push out existing more quickly with less retardation. Thereafter, in the lower half, the coarse particles allowed for rapid preferential flow [36] due to larger diameters and more homogenous pores [6]. This is further validation that water follows a common tendency to move more gradually, slower, and more uniformly in wetter regions than in dryer regions [30,40,41]. Therefore, our results demonstrate that pairing both cyclic irrigation and stratified substrate systems can improve overall efficiency through more conservative irrigation management and increased substrate efficacy. However, real-world conditions in which water is lost between pulses, decreasing VWC, may affect water movement and decrease its overall efficiency. Additional trials under nursery and greenhouse conditions are needed to refine and validate the findings herein.

4.3. Fallow versus Rooted

Altland et al. [42] and Hoskins et al. [30] stated that plant roots can modify the substrates’ physical properties, which will consequently influence water movement through a porous media. As plant roots explore the substrate, the AS and CC decrease and increase, respectively, due to roots occupying pore spaces [42] and subsequently altering pore distribution. Fields et al. [10] observed similar shifts in substrate physical properties for both stratified and non-stratified systems as crepe myrtle roots explored the profile. Additionally, crepe myrtle roots and possibly aging or decomposition of the bark-based substrate generally increased substrate CC, decreased AS, and changed PSD over the course of approximately 18 weeks of the production period [10]. Moreover, roots grown in the stratified substrates versus non-stratified, conventional bark-based substrate had significantly greater dry masses in the upper half than what was observed in the lower half of the container [10], which can influence water movement and retention.
The fallow substrates held more water and leached less water than the rooted substrates in every case (Table 2 and Table 4). Moreover, in every case, water leached quicker and more in root-explored containers than in fallow containers. Plant roots likely occupied larger substrate pores when exploring the profile, thus, increasing more restrictive paths and creating more homogeneous pore pathways for water to quickly infiltrate [30,43].

4.4. Initial Moisture Conditions

One of the primary influences of moisture retention is the substrate’s moisture content at the moment of irrigation, otherwise known as the initial moisture content [20,44]. Fields et al. [21] observed that the substrates’ initial moisture content has a significant impact on the hydration efficiency of horticultural substrates, especially in bark-based media, where after several hydration events (i.e., 10), dry pine bark substrates (i.e., 25% moisture content) never fully reached their CC values, whereas, in wetter pine bark substrates (i.e., 50% moisture content), substrates reached CC values after the first hydration event. Yap et al. [45] found that bark particles < 6.3 mm retained significantly more water than particles >6.3 mm after the first hydration. Many have reported that dry substrates can experience hydrophobicity (organic molecules repelling liquid water) [46] and can resist water entry/absorbance ranging from seconds to hours [47,48], which may require sufficient applications or time to rewet [19,20].
Water moved quicker under dry conditions than wet in non-stratified substrates (Table 2). This has been observed in sandy soils; drier conditions enable water to flow more rapidly than in wetter conditions [40,41]. Additionally, Hoskins et al. [30] observed similar trends in soilless substrates. In dry bark-based media, preferential flow can be observed to a greater degree, especially during hydrophobic conditions, and can contribute to fast infiltration rates (Table 3), as observed in Hoskins et al. [30]. While in the wetter substrates, lateral distribution likely occurred due to cohesion and the water adsorbed to the substrate particles/pores aided in retaining the infiltrating water.
It was apparent that substrates irrigated with the greater initial VWC allowed for water to be redistributed and diffuse more evenly through the system [36] as opposed to quick channeling and water exit than when dryer or having a low VWC. With regards to substrate treatments, the water took longer to progress through the stratified profile than in non-stratified systems under dryer conditions, which may have attributed to the greater final VWC value (Table 2 and Table 3; Figure 7). This is imperative for the nursery industry as this may demonstrate that in times of drought or lack of rain, irrigation maintenance, or high temperatures where the substrate could potentially dry, stratified systems may be able to mitigate long periods of not being irrigated and still efficiently hydrate after irrigation by retaining moisture over greater lengths of time. Criscione et al. [9] reported continual growth in the stratified substrate profiles when employing deficit irrigation as compared to crops grown in a traditional nursery, the non-stratified bark-based substrate with decreased growth as irrigation volume and frequency decreased. When irrigating a single application, regardless of substrate treatment, we observed a greater increase in VWC under initially wetter conditions than when dry prior to irrigation. When cyclically irrigated, greater differences in initial versus final VWC were observed within non-stratified systems than in the stratified (Table 2).
It was examined that cyclic irrigation promoted the non-stratified substrates to hydrate significantly more than they did under a single irrigation application within dry conditions (Table 4; Figure 7 and Figure 8). However, cyclic irrigation did not appear to influence the stratified systems’ ability to hydrate under dry conditions (Table 4). Under these dry conditions, the non-stratified system released more water after the first cyclic irrigation pulse than the stratified profile did possibly due to preferential flow [34] (Table 2; Figure 8). However, this was inverted after the second pulse, in which the stratified system began to leach more water than the non-stratified system, likely due to the maximized drainage and pore distribution uniformity (Table 3; Figure 8).

5. Conclusions

The stratified substrates took longer to leach gravitational pore water than the non-stratified systems, indicating that stratified systems can hold water longer than the non-stratified systems. Fallow substrates held more water and leached less than the rooted substrates in almost every case. The stratified rooted substrates were able to significantly store more and consequently leach less water with cyclic irrigation than they did under a single irrigation application when irrigated at greater initial moisture contents. Cyclic irrigation did not influence water retention or release parameters under dry conditions of stratified systems. However, non-stratified systems’ water retention significantly increased with regard to a single application. It is likely that preferential flow dominated the system herein in this study due to increased irrigation rates. In future studies, it will be beneficial to reduce the rate of water application.
In all, pairing cyclic irrigation with stratified substrate systems supports better water capture and retention when compared to single irrigation applications. Cyclic irrigation slows water movement through the substrate profile after several irrigations, which results in better water retention and leaching reductions. When growers choose to utilize traditional substrate systems, and there are dry substrate conditions, cyclic irrigation may provide better water retention over time when compared to a single, large irrigation application.

Author Contributions

Conceptualization, K.S.C., J.S.F. and J.S.O.J.; formal analysis, K.S.C., J.S.F. and J.S.O.J.; funding acquisition, J.S.F.; investigation, K.S.C. and J.S.F.; methodology, K.S.C. and J.S.F.; project administration, J.S.F.; writing—original draft, K.S.C.; writing—review and editing, K.S.C., J.S.F. and J.S.O.J. All authors have read and agreed to the published version of the manuscript.

Funding

Funding for this research was provided in part by the Louisiana Nursery and Landscape Foundation for Scholarship and Research and through Hatch Funds LAB-94458.

Institutional Review Board Statement

Not applicable.

Informed Consent Statement

Not applicable.

Data Availability Statement

Not applicable.

Acknowledgments

We appreciate the in-kind support from John A. Criscione for material donation and guidance of device construction.

Conflicts of Interest

The authors declare no conflict of interest.

References

  1. Elliot, J.; Deryng, D.; Müller, C.; Frieler, K.; Konzmann, M.; Gerten, D.; Glotter, M.; Flörke, M.; Wada, Y.; Best, N.; et al. Constraints and potentials of future irrigation water availability on agricultural production under climate change. Proc. Nat. Acad. Sci. USA 2014, 111, 3239–3244. [Google Scholar] [CrossRef] [PubMed]
  2. Whitehead, P.G.; Wilby, R.L.; Battarbee, R.W.; Kernan, M.; Wade, A.J. A review of the potential impacts of climate change on surface water quality. Hydrol. Sci. J. 2009, 54, 101–123. [Google Scholar] [CrossRef]
  3. Lal, R.; Delgado, J.A.; Gulliford, J.; Nielsen, D.; Rice, C.W.; Van Pelt, R.S. Adapting agriculture to drought and extreme events. J. Soil Water Conserv. 2012, 67, 162A–166A. [Google Scholar] [CrossRef]
  4. Liu, W.; Sun, F.; Lim, W.H.; Zhang, J.; Wang, H.; Shiogama, H.; Zhang, Y. Global drought and severe drought-affected populations in 1.5 and 2 °C warmer worlds. Earth Syst. Dynam. 2018, 9, 267–283. [Google Scholar] [CrossRef]
  5. Fulcher, A.; Fernandez, T. Sustainable Nursery Irrigation Management Series: Part I. Water Use in Nursery Production; Bulletin W287; University of Tennessee: Knoxville, TN, USA, 2013. [Google Scholar]
  6. Fields, J.S.; Owen, J.S., Jr.; Altland, J.E. Substrate stratification: Layering unique substrates within a container increases resource efficiency without impacting growth of shrub rose. Agron. J. 2021, 11, 1454. [Google Scholar] [CrossRef]
  7. Milks, R.R.; Fonteno, W.C.; Larson, R.A. Hydrology of horticultural substrates: II. Predicting physical properties of substrate in containers. J. Amer. Soc. Hort. Sci. 1989, 114, 53–56. [Google Scholar] [CrossRef]
  8. Owen, J.S.; Altland, J.E. Container height and Douglas fir bark texture affect substrate physical properties. Hort. Sci. 2008, 43, 505–508. [Google Scholar] [CrossRef]
  9. Criscione, K.S.; Fields, J.S.; Owen, J.S., Jr.; Fultz, L.; Bush, E. Evaluating Stratified Substrates Effect on Containerized Crop Growth under Varied Irrigation Strategies. Hort. Sci. 2022, 57, 400–413. [Google Scholar] [CrossRef]
  10. Fields, J.S.; Criscione, K.S.; Edwards, A. Single-screen bark particle separation can be utilized to engineer stratified substrate systems. Hort. Tech. 2022, 32, 7. [Google Scholar] [CrossRef]
  11. Khamare, Y.; Marble, S.C.; Altland, J.E.; Pearson, B.J.; Chen, J.; Devkota, P. Effect of substrate stratification on growth of common nursery weed species and container-grown ornamental species. Hort. Tech. 2022, 32, 74–83. [Google Scholar] [CrossRef]
  12. Criscione, K.S.; Fields, J.S.; Owen, J.S. Exploring Water Movement through Stratified Substrates. Comb. Proc. IPPS 2021, 71, 116–124. [Google Scholar]
  13. Lamack, W.F.; Niemiera, A.X. Application method affects water application efficiency of spray stake-irrigated containers. Hort. Sci. 1993, 28, 625–627. [Google Scholar] [CrossRef]
  14. Fare, D.C.; Gilliam, C.H.; Keever, G.J.; Olive, J.W. Cyclic irrigation reduces container leachate nitrate-nitrogen concentration. Hort. Sci. 1994, 29, 1514–1517. [Google Scholar] [CrossRef]
  15. Taylor, A.J.; Fernandez, R.; Nzokou, P.; Cregg, B. Carbon Isotope Discrimination, Gas Exchange, and Growth of Container-grown Conifers Under Cyclic Irrigation. Hort. Sci. 2013, 48, 848–854. [Google Scholar] [CrossRef]
  16. Raviv, M.; Leith, J.H. Soilless Culture Theory and Practice; Elsevier: San Diego, CA, USA, 2008. [Google Scholar]
  17. Drzal, M.S.; Fonteno, W.C.; Cassel, D.K. Pore fraction analysis: A new tool for substrate testing. Acta Hort. 1999, 481, 43–54. [Google Scholar] [CrossRef]
  18. Airhart, D.L.; Natarella, N.J.; Pokorny, F.A. Influence of initial moisture content on the wettability of a milled pine bark medium. Hort. Sci. 1978, 13, 432–434. [Google Scholar]
  19. Valat, B.; Jouany, C.; Riviere, L.M. Characterization of the wetting properties of air dried peats and composts. Soil Sci. 1991, 152, 100–107. [Google Scholar] [CrossRef]
  20. Michel, J.C.; Riviere, M.; Bellon-Fontaine, M.N. Measurement of wettability of organic materials in relation to water content by the capillary rise method. Eur. J. Soil. Sci. 2001, 52, 459–467. [Google Scholar] [CrossRef]
  21. Fields, J.S.; Fonteno, W.C.; Jackson, B.E. Hydrophysical properties, moisture retention, and drainage profiles of wood and traditional components for greenhouse substrates. Hort. Sci. 2014, 49, 336–342. [Google Scholar] [CrossRef]
  22. Hoskins, T.C.; Owen, J.S.; Fields, J.S.; Altland, J.E.; Easton, Z.M.; Niemiera, A.X. Solute Transport through a Pine Bark-based Substrate under Saturated and Unsaturated Conditions. J. Amer. Soc. Hort. Sci. 2014, 139, 634–641. [Google Scholar] [CrossRef]
  23. Beeson, R.C. Weighing lysimeter systems for quantifying water use and studies of controlled water stress for crops grown in low bulk density substrates. Agri. Water Manag. 2011, 98, 967–976. [Google Scholar] [CrossRef]
  24. Fields, J.S.; Owen, J.S., Jr.; Altland, J.; van Iersel, M.; Jackson, B.E. Soilless substrate hydrology can be engineered to influence plant water status for an ornamental containerized crop grown within optimal water potentials. J. Amer. Soc. Hort. Sci. 2018, 143, 268–281. [Google Scholar] [CrossRef] [Green Version]
  25. McCauley, D.; Levin, A.; Nackley, L. Reviewing Mini-lysimeter Controlled Irrigation in Container Crop Systems. Hort. Tech. 2021, 31, 634–641. [Google Scholar] [CrossRef]
  26. Prehn, A.E.; Owen, J.S.; Warren, S.L.; Bilderback, T.E.; Albano, J.P. Comparison of water management in container-grown nursery crops using leaching fraction or weight-based on demand irrigation control. J. Environ. Hort. 2010, 28, 117–123. [Google Scholar] [CrossRef]
  27. O’Meara, L.; van Iersel, M.W.; Chappell, M.R. Modeling daily water use of Hydrangea macrophylla and Gardenia jasminoides as affected by environmental conditions. Hort. Sci. 2013, 48, 1040–1046. [Google Scholar] [CrossRef]
  28. Niu, G.; Rodrigues, D.S.; Cabrera, R.; McKenney, C.; Mackay, W. Determining water use and crop coefficients of five woody landscape plants. J. Environ. Hort. 2006, 24, 160–165. [Google Scholar] [CrossRef]
  29. Fonteno, W.C.; Harden, C.T. North Carolina State University Horticultural Substrates Lab Manual; North Carolina State University: Raleigh, NC, USA, 2010. [Google Scholar]
  30. Hoskins, T.C.; Owen, J.S.; Niemiera, A.X. Water movement through a pine-bark substrate during irrigation. Hort. Sci. 2014, 49, 1432–1436. [Google Scholar] [CrossRef]
  31. Ma, L.N.; Selim, H.M. Physical nonequilibrium modeling approaches to solute transport in soils. Adv. Agron. 1997, 58, 95–150. [Google Scholar]
  32. Hillel, D. Introduction to Environmental Soil Physics; Elsevier Academic Press: San Deigo, CA, USA, 2004. [Google Scholar]
  33. Nkongolo, N.V.; Caron, J. Bark particle sizes and the modification of the physical properties of peat substrates. Can. J. Soil Sci. 1999, 79, 111–116. [Google Scholar] [CrossRef]
  34. Selker, J.S. Applying preferential flow concepts to horticultural water management. Hort. Tech. 1996, 6, 107–110. [Google Scholar] [CrossRef]
  35. Zhang, S.; Yan, H.; Teng, J.; Sheng, D. A mathematical model of tortuosity in soil considering particle arrangement. Vadose Zone 2020, 19, e20004. [Google Scholar] [CrossRef]
  36. Bilderback, T.E.; Jones, R.K. Horticultural practices for reducing disease development. In Disease of Woody Ornamentals and Trees in Nurseries; Jones, R.K., Benson, D.M., Eds.; American Phytopathological Society (APS Press): St Paul, MN, USA, 2001; pp. 387–400. [Google Scholar]
  37. Witcher, A.L. Evaluation of Fertilizer and Irrigation Production Systems for Large Nursery Containers. Masters Thesis, Louisiana State University, Baton Rouge, LA, USA, 2003. [Google Scholar]
  38. Yeary, W.; Fulcher, A.; Leib, B. Nursery Irrigation: A Guide for Reducing Risk and Improving Production; University of Tennessee Extension: Knoxville, TN, USA, 2016. [Google Scholar]
  39. Warsaw, A.L.; Fernandez, R.; Cregg, B.M.; Andresen, J.A. Water Conservation, Growth, and Water Use Efficiency of Container-grown Woody Ornamentals Irrigated Based on Daily Water Use. Hort. Sci. 2009, 44, 1308–1318. [Google Scholar] [CrossRef]
  40. Liu, Y.P.; Steenhuis, T.S.; Parlange, J.Y. Formation and persistence of fingered flow-fields in coarse-grained soils under different moisture contents. J. Hydrol. 1994, 159, 187–195. [Google Scholar] [CrossRef]
  41. Bauters, T.W.J.; DiCarlo, D.A.; Steenhuis, T.S.; Parlange, J.Y. Soil water content dependent wetting front characteristics in sands. J. Hydrol. Amst. 2000, 231, 244–254. [Google Scholar] [CrossRef]
  42. Altland, J.E.; Owen, J.S.; Gabriel, M.Z. Influence of pumice and plant roots on substrate physical properties over time. Hort. Tech. 2011, 21, 554–557. [Google Scholar] [CrossRef]
  43. Nash, V.E.; Laiche, A.J. Changes in the characteristics of potting media with time. Commun. Soil Sci. Plant Anal. 1981, 12, 1011–1020. [Google Scholar] [CrossRef]
  44. de Jonge, L.W.; Jacobsen, O.H.; Moldrup, P. Soil water repellency: Effects of water content, temperature, and particle size. Soil Sci. Soc. Amer. J. 1999, 63, 437–442. [Google Scholar] [CrossRef]
  45. Yap, T.C.; Jackson, B.E.; Fonteno, W.E. Water retention of processed pine wood and pine bark and their particle size fractions. Comb. Proc. Intl. Plant Prop. 2014, 64, 467–472. [Google Scholar] [CrossRef]
  46. Blok, C.; De Kreij, C.; Baas, R.; Wever, G. Analytical Methods Used in Soilless Cultivation, Chapter 7. In Soilless Culture Theory and Practice; Elsevier: San Diego, CA, USA, 2008. [Google Scholar]
  47. King, P.M. Comparison of methods for measuring severity of water repellence of sandy soils and assessment of some factors that affect its measurement. Aust. J. Soil. Res. 1981, 19, 275–285. [Google Scholar] [CrossRef]
  48. Dekker, L.W.; Ritsema, C.J. How water moves in a water repellant sandy soil: 1. Potential and actual water repellency. Water Resour. Res. 1994, 30, 2507–2517. [Google Scholar] [CrossRef]
Figure 1. Unscreened conventional pine bark (left), screened pine bark with a 6.3 mm aperture (middle) and screened pine bark with a 6.3 mm aperture (right).
Horticulturae 08 00826 g001
Figure 2. Mass balance device constructed by installation of two lysimeters (1) a S-type load cell to measure container weight and water infiltration and (2) a cantilever load cell to measure leachate. Containers were suspended in air only connected to the S-type load cell. There is a water basin on top of the compression load cell placed on the table to collect the drained water. A beaker is placed above to serve as a reservoir and irrigate into the diffuser, so water is spread uniformly above the substrate surface.
Horticulturae 08 00826 g002
Figure 3. Particle size distribution curve of (A) individual substrate components that include fine and coarse bark particles (i.e., screened with a 6.3 mm aperture) and an unscreened conventional bark, and (B) entire non-stratified and stratified profiles. Each error bar is constructed using a 95% confidence interval of the mean.
Horticulturae 08 00826 g003
Figure 4. Monitoring water movement via dual-lysimetry while being irrigated at effective container capacity (eCC). There are four substrate treatments that consisted of three individual containers, each of either a (A) non-stratified or (B) stratified system. The non-stratified fallow and rooted systems are colored black and green, respectively. The stratified fallow and rooted systems are colored blue and red, respectively. The lines presented are represented by solid [; water retention (g)], dotted [---; leached volume (g)], and dotted [···; volumetric water content (%)].
Horticulturae 08 00826 g004
Figure 5. Monitoring water movement via dual-lysimetry at flagging moisture contents (targeted volumetric water content of 20%) under a single application (1×). There are four substrate treatments that consisted of three individual containers, each of either (A) non-stratified or (B) stratified systems. The non-stratified fallow and rooted systems are colored black and green, respectively. The stratified fallow and rooted systems are colored blue and red, respectively. The lines presented are represented by solid [; water retention (g)], dotted [---; leached volume (g)], and dotted [···; volumetric water content (%)]. Effective container capacity (eCC) is represented by a dash and two dots (••−) where the substrates were irrigated with a large pulse of water to determine maximum water storage.
Horticulturae 08 00826 g005
Figure 6. Monitoring water movement via dual-lysimetry at flagging moisture contents (targeted volumetric water content of 20%) under a cyclic application (3×). There are four substrate treatments that consisted of three individual containers, each of either (A) non-stratified or (B) stratified systems. The non-stratified fallow and rooted systems are colored black and green, respectively. The stratified fallow and rooted systems are colored blue and red, respectively. The lines presented are represented by solid [; water retention (g)], dotted [---; leached volume (g)], and dotted [···; volumetric water content (%)]. Effective container capacity (eCC) is represented by a dash and two dots (••−), where the substrates were irrigated with a large pulse of water to determine maximum water storage.
Horticulturae 08 00826 g006
Figure 7. Monitoring water movement via dual-lysimetry at dry moisture contents (targeted volumetric water content of 10%) under a single application (1×). The non-stratified fallow systems are colored black. The stratified fallow systems are colored blue. There were three individual containers examined per treatment. The lines presented are represented by solid [; water retention (g)], dotted [---; leached volume (g)], and dotted [···; volumetric water content (%)]. Effective container capacity (eCC) is represented by a dash and two dots (••−). The substrates were irrigated with a large pulse of water to determine maximum water storage.
Horticulturae 08 00826 g007
Figure 8. Monitoring water movement via dual-lysimetry at dry moisture contents (targeted volumetric water content of 10%) under a cyclic application (3×). The non-stratified fallow systems are colored black. The stratified fallow systems are colored blue. There were three individual containers examined per treatment. The lines presented are represented by solid [; water retention (g)], dotted [---; leached volume (g)], and dotted [···; volumetric water content (%)]. Effective container capacity (eCC) is represented by a dash and two dots (••−). The substrates were irrigated with a large pulse of water to determine maximum water storage.
Horticulturae 08 00826 g008
Table 1. Static physical properties and particle size distribution of the three different pine bark substrates utilized in this study. Conventional bark was fractioned by being processed through a 6.3 mm screen to create two unique substrates. The particles that remained on the screen were considered coarse bark (>6.3 mm), and the particles that passed through the screen were considered fine bark (<6.3 mm).
Static Physical Properties z Particle Size Distribution y
SubstrateContainer Capacity
(% vol.)
Air Space
(% vol.)
Total Porosity
(% vol.)
Bulk Density
(% vol.)
Extra Large
(>6.3 mm; % Dry Mass)
Large
(6.3 mm–2.0 mm; % Dry Mass)
Medium
(2.0-0.7 mm; % Dry Mass)
Fine
(<0.7 mm; % Dry Mass)
Conventional bark43 b a35 b77 b17 a27 b43 b17 b14 a
Fine bark50 a33 b83 ab17 a0 c50 a33 a17 a
Coarse bark38 b47 a85 a15 b45 a42 b6 c7 b
p-value b0.00230.00410.03200.0037<0.0001<0.0001<0.0001<0.0001
z Measured via porometer analysis. Total porosity = minimum air space (AS; minimum air-filled porosity after free drainage) + maximum water-holding (container capacity; CC; maximum water-holding capacity after free drainage). y Percent of particle dry weight occupying extra-large > 6.3 mm, large > 2.00 mm, medium > 0.71 mm, and fine < 0.71 mm. a Letters (i.e., a, b, c) denote detected differences among means of three substrates (conventional bark, fine bark, and coarse bark) utilizing Tukey’s HSD (α = 0.05). b Measures of overall treatment effects utilizing ANOVA analysis with a significance value of (α = 0.05).
Table 2. Differentials in substrate volumetric water content (VWC) within two substrate treatments. (1) Non-stratified and (2) stratified that were (3) rooted or (4) fallowed and were irrigated by two irrigation schedules: (1) single application (one single irrigation) and (2) cyclic application (three, shallow irrigations). The substrates were irrigated at three different initial moisture contents, where (1) eCC (effective container capacity) was irrigated heavily three times and, thereafter, was irrigated by a large pulse of water (1066 mL). (2) “Flag” represented flagging weights, where treatments were targeted to have an initial moisture content of 20% VWC. (3) “Dry” represents dry initial moisture contents, targeted to have a moisture content of 10% VWC.
Initial Moisture Status zSubstrateContainer System yIrrigation xIrrigation Pulses (CA Only) wInitial
VWC
(%) v
Retention Capacity
(%) u
Effective Container Capacity
(%) t
Difference in Actual CC to eCC
(mL) s
Difference in Time from Water Entry to Exit
(sec) r
eCCNon-StratifiedFallowSANA44.6% ± 1.2 a ab45.8% ± 1.2 a45.8% ± 1.2 a-8.0 ± 0.0 b
eCCNon-StratifiedRootedSANA39.3% ± 1.2 b41.1% ± 0.9 b41.1% ± 0.9 b-6.0 ± 0.0 b
eCCStratifiedFallowSANA40.5% ± 2.6 ab42.2% ± 2.6 ab42.2% ± 2.6 ab-10.7 ± 1.2 a
eCCStratifiedRootedSANA32.4% ± 1.4 c34.8% ± 1.7 c34.8% ± 1.7 c-7.3 ± 1.6 b
p-value c----0.00020.00030.0003-0.0007
FlagNon-StratifiedFallowSANA18.6% ± 0.5 ab28.2% ± 3.4 abc40.5% ± 1.3 a239.3 ± 42.6 c7.3 ± 2.3 bc
FlagNon-StratifiedRootedSANA18.9% ± 1.6 ab23.1% ± 3.8 bcde30.8% ± 4.3 b148.8 ± 11.4 def4.0 ± 2.0 c
FlagStratifiedFallowSANA17.9% ± 0.5 ab29.3% ± 0.5 a39.7% ± 1.9 a202.0 ± 29.6 cd4.7 ± 2.3 c
FlagStratifiedRootedSANA13.8% ± 0.1 d16.9% ± 1.0 f20.7% ± 1.1 c73.7 ± 13.5 f4.7 ± 1.2 c
FlagNon-StratifiedFallowCAPulse117.4% ±1.9 bc21.2% ± 2.5 def-338.0 ± 42.0 ab7.3 ± 1.2 bc
Pulse2-25.5% ± 2.9 abcd-255.0 ± 33.1 c8.0 ± 0.0 bc
Pulse3-29.0% ± 0.3 ab38.6% ± 4.5 a186.3 ± 27.1 cde10.7 ± 3.1 ab
FlagNon-StratifiedRootedCAPulse114.3% ± 1.8 cd16.9% ± 1.7 f-178.1 ± 31.9 cde3.3 ± 1.2 c
Pulse2-19.0% ± 1.9 ef-137.1 ± 28.8 def5.3 ± 1.2 bc
Pulse3-20.6% ±2.1 def26.1% ± 3.3 bc106.7 ± 24.7 ef5.3 ± 1.2 bc
FlagStratifiedFallowCAPulse121.6% ± 1.0 a22.0% ± 0.3 cdef-343.3 ± 22.3 a6.7 ± 1.2 bc
Pulse2-26.4% ± 0.2 abcd-258.0 ± 23.5 bc14.7 ± 3.1 a
Pulse3-29.7% ± 0.5 a39.7% ± 1.5 a193.7 ± 18.6 cd14.7 ± 1.2 a
FlagStratifiedRootedCAPulse115.7% ± 0.2 bcd18.4% ± 0.5 ef-184.5 ± 21.24.0 ± 0.0 c
Pulse2-20.5% ± 0.7 def-143.9 ± 19.8 def7.33 ± 2.3 bc
Pulse3-22.2% ± 0.9 def27.9% ± 1.4 b110.5 ± 16.7 ef6.7 ± 3.1 bc
p-value----<0.0001<0.0001<0.0001<0.0001<0.0001
DryNon-StratifiedFallowSANA9.0% ± 0.8 b13.5% ± 1.4 a20.9% ± 2.9 a144.0 ± 28.6 ab5.3 ± 1.2 ab
DryStratifiedFallowSANA12.4% ± 0.8 ab19.4% ± 1.3 a25.9% ± 3.3 a126.7 ± 37.9 ab8.7 ± 4.2 ab
DryNon-StratifiedFallowCAPulse112.5% ± 2.6 ab15.6% ± 3.4 a-247.2 ± 61.1 a6.0 ± 0.0 ab
Pulse2-19.0% ± 4.5 a-180.9 ± 39.5 ab4.0 ± 0.0 b
Pulse3-21.5% ± 5.1 a28.3% ± 6.4 a131.7 ± 28.3 ab6.0 ± 0.0 ab
DryStratifiedFallowCAPulse112.0% ± 1.6 a14.4% ± 2.2 a-226.7 ± 37.9 b8.7 ± 4.2 ab
Pulse2-17.4% ± 3.0 a-182.4 ± 41.0 ab11.3 ± 5.0 a
Pulse3-20.1% ± 3.7 a26.8% ± 5.1 a131.6 ± 28.0 ab4.7 ± 1.2 ab
p-value----0.04840.08400.16830.00910.0374
z Substrates were initiated at a particular point of moisture content. Where effective container capacity (eCC) had no targeted moisture content, Ɵf were air-dried down to a targeted 20% VWC and Ɵd were further air-dried down to a targeted 10% VWC. VWC was calculated by (substrate wet weight − substrate dry weight/substrate volume). y Substrate profiles were either root-explored (rooted) or contained no roots (fallow). x Two irrigation treatments, where a single application (SA) was a singular, large pulse of water (1×, 360 mL for Ɵf and Ɵd; 1066 mL for eCC) and a cyclic application (CA; 3×, 120 mL). w Cyclic application irrigation received three, shallow pulses, whereas a single application only received one pulse. v Actual substrate initial moisture content immediately prior to study initiation. u Substrate VWC 15 min after each irrigation. VWC was calculated by (substrate wet weight—substrate dry weight/substrate volume). t Effective container capacity (eCC) represents the VWC after a large pulse of water (effective pulse; 1750 mL) after irrigation treatments were completed. VWC was calculated by (substrate wet weight—substrate dry weight/substrate volume). s The difference (in mL) from substrate container capacity (CC) 15 min after each irrigation application (or pulse) and 15 min after the effective pulse. r This depicts how long the water took to move throughout the substrate profile. a The standard deviation among the three samples per SD value. b Letters (i.e., a, b, c, etc.) denote detected differences among means of a full factorial including four substrates (non-stratified fallow, non-stratified rooted, stratified fallow, stratified rooted) utilizing Tukey’s HSD (α = 0.05). c Measures of overall treatment effects utilizing ANOVA analysis utilizing a significance level (α = 0.05).
Table 3. Slope (hydration rate) equation and regression line R2 values among the two substrate treatments. (1) Non-stratified and (2) stratified that were (3) rooted or (4) fallowed and were irrigated by two irrigation schedules: (1) single application (one single irrigation) and (2) cyclic application (three shallow irrigations). The substrates were irrigated at three different initial moisture contents, where (1) eCC (effective container capacity) was irrigated heavily three times and thereafter, was irrigated by a large pulse of water (1066 mL). (2) “Flag” represented flagging weights, where treatments were targeted to have an initial moisture content of 20% VWC. (3) “Dry” represents dry initial moisture contents, targeted to have a moisture content of 10% VWC.
Initial Moisture Status zSubstrateContainer System yIrrigation xIrrigation Pulses (CA Only) wHydration Rate: HANGING vn uR2 tHydration Rate: Basin sn rR2 q
eCCNon-StratifiedFallowSANA47.7 ± 18.6 a a b6.0 ± 0.0 ab0.99 ± 0.00 a54.6 ± 17.2 a7.7 ± 3.1 a0.97 ± 0.03 a
eCCNon-StratifiedRootedSANA43.5 ± 8.7 a4.0 ± 0.0 c0.99 ± 0.00 a52.4 ± 17.0 a8.0 ± 3.5 a0.97 ± 0.03 a
eCCStratifiedFallowSANA38.6 ± 0.5 a6.3 ± 0.6 a0.99 ± 0.00 a44.9 ± 8.2 a7.7 ± 2.9 a0.98 ± 0.02 a
eCCStratifiedRootedSANA35.0 ± 3.0 a4.3 ± 1.2 bc0.98 ± 0.02 a53.6 ± 13.3 a8.0 ± 3.5 a0.97 ± 0.03 a
p-value c----0.50120.00460.56730.84310.99840.9842
FlagNon-StratifiedFallowSANA38.2 ± 6.6 ab5.0 ± 1.0 a0.97 ± 0.00 a12.2 ± 5.9 b4.0 ± 1.0 b0.99 ± 0.01 a
FlagNon-StratifiedRootedSANA34.2 ± 6.6 ab3.7 ± 0.6 c0.98 ± 0.01 a28.1 ± 3.1 a4.0 ± 1.0 b0.99 ± 0.01 a
FlagStratifiedFallowSANA46.1 ± 15.2 a4.3 ± 1.2 bc0.98 ± 0.02 a10.9 ± 1.6 bc3.7 ± 0.6 b0.99 ± 0.00 a
FlagStratifiedRootedSANA28.1 ± 6.9 bc3.3 ± 0.6 c0.95 ± 0.07 a26.5 ± 3.4 a4.7 ± 0.6 b0.99 ± 0.01 a
FlagNon-StratifiedFallowCAPulse110.6 ± 1.0 d4.7 ± 0.6 bc0.79 ± 0.02 a3.6 ± 1.6 d4.0 ± 1.0 b0.99 ± 0.00 a
Pulse212.4 ± 4.6 cd4.3 ± 0.6 bc0.85 ± 0.07 a1.4 ± 0.5 d8.3 ± 3.1 b0.86 ± 0.03 a
Pulse38.1 ± 2.3 d6.3 ± 1.5 ab0.71 ± 0.09 a0.9 ± 1.9 d16.7 ± 3.5 a0.94 ± 0.02 a
FlagNon-StratifiedRootedCAPulse113.4 ± 2.3 cd3.0 ± 0.0 c0.82 ± 0.15 a3.3 ± 1.3 d5.3 ± 2.5 b0.99 ± 0.03 a
Pulse216.2 ± 1.6 cd3.3 ± 0.6 c0.92 ± 0.08 a4.1 ± 1.2 d5.0 ± 2.6 b0.97 ± 0.03 a
Pulse312.7 ± 1.6 cd3.7 ± 0.6 bc0.81 ± 0.04 a4.1 ± 1.0 d5.0 ± 2.6 b0.97 ± 0.03 a
FlagStratifiedFallowCAPulse111.5 ± 2.2 cd4.3 ± 0.6 bc0.81 ± 0.08 a1.9 ± 0.9 d3.3 ± 0.6 b0.94 ± 0.05 a
Pulse25.6 ± 2.21 d8.7 ± 1.5 a0.65 ± 0.10 a0.6 ± 0.1 d9.0 ± 0.0 b0.98 ± 0.02 a
Pulse35.2 ± 1.43 d8.7 ± 1.5 a0.65 ± 0.08 a0.7 ± 0.1 d15.0 ± 0.0 a0.97 ± 0.02 a
FlagStratifiedRootedCAPulse114.5 ± 6.2 cd3.0 ± 0.0 c0.85 ± 0.12 a4.2 ± 2.2 d5.3 ± 3.2 b0.98 ± 0.01 a
Pulse210.6 ± 6.1 d4.7 ± 1.2 bc0.66 ± 0.34 a3.8 ± 1.4 d5.7 ± 2.1 b0.98 ± 0.01 a
Pulse311.0 ± 5.6 cd4.3 ± 1.5 bc0.68 ± 0.30 a5.1 ± 2.4 cd5.3 ± 2.5 b0.98 ± 0.01 a
p-value----<0.0001<0.00010.0218<0.0001<0.00010.0761
DryNon-StratifiedFallowSANA37.1 ± 2.3 a3.7 ± 0.6 a0.96 ± 0.05 a28.3 ± 1.2 a3.3 ± 0.6 a0.99 ± 0.01 a
DryStratifiedFallowSANA33.5 ± 2.3 ab3.7 ± 0.6 a0.98 ± 0.02 a14.7 ± 4.3 b4.7 ± 1.2 a0.97 ± 0.03 a
DryNon-StratifiedFallowCAPulse112.5 ± 1.1 bc4.0 ± 0.0 a0.82 ± 0.09 ab4.5 ± 1.4 c3.3 ± 0.6 a0.99 ± 0.01 a
Pulse211.8 ± 6.7 c4.3 ± 1.5 a0.74 ± 0.16 ab3.4 ± 1.4 c4.0 ± 0.0 a0.99 ± 0.0 a
Pulse310.4 ± 0.8 c4.0 ± 0.0 a0.71 ± 0.09 ab3.9 ± 0.7 c3.0 ± 0.0 a0.99 ± 0.00 a
DryStratifiedFallowCAPulse16.6 ± 4.16 c5.3 ± 1.5 a0.66 ± 0.26 ab3.6 ± 2.7 c3.6 ± 1.2 a0.95 ± 0.06 a
Pulse211.1 ± 4.38 c4.3 ± 1.2 a0.74 ± 0.13 ab3.9 ± 0.1 c4.3 ± 1.5 a0.98 ± 0.02 a
Pulse30.5 ± 0.43 c6.3 ± 0.6 a0.48 ± 0.05 b2.7 ± 1.2 c5.0 ± 1.0 a0.97 ± 0.01 a
p-value----0.00030.18180.0059<0.00010.15630.4823
z Substrates were initiated at a particular point of moisture content. Where effective container capacity (eCC) had no targeted moisture content, Ɵf were air-dried down to a targeted 20% VWC and Ɵd were further air-dried down to a targeted 10% VWC. VWC was calculated by (substrate wet weight − substrate dry weight/substrate volume). y Substrate profiles were either root-explored (rooted) or contained no roots (fallow). x Two irrigation treatments, where a single application (SA) was a singular, large pulse of water (1×, 360 mL for Ɵf and Ɵd; 1066 mL for eCC) and a cyclic application (CA; 3×, 120 mL). w Cyclic application irrigation received three shallow pulses, whereas a single application only received one pulse. v Calculated slope from the hanging lysimeter values. Slope equation was attained through Microsoft Excel. u Quantity of values used to attain hanging lysimeter slope equation. The number of values were visually selected until the hanging lysimeter showed signs of initial decent in weight. Each n value equates to 2 s (retention time). t Computed regression line R2 value from the same values used from the hanging lysimeter slope equation. s Calculated slope from the basin lysimeter values. The slope equation was attained through Microsoft Excel. r Quantity of values used to attain basin lysimeter slope equation. A number of values were visually selected until the hanging lysimeter showed signs of initial decent in weight. q Computed regression line R2 value from the same values used from the basin lysimeter slope equation. a The standard deviation among the three samples per SD value. b Letters (i.e., a, b, c, etc.) denote detected differences among means of a full factorial including four substrates (non-stratified fallow, non-stratified rooted, stratified fallow, stratified rooted) utilizing Tukey’s HSD (α = 0.05). c Measures of overall treatment effects utilizing ANOVA analysis utilizing a significance level (α = 0.05).
Table 4. Summarized parameters of water infiltration and exit measured via a mass balance. There were two substrate treatments (1) non-stratified and (2) stratified, irrigated with either two different irrigation schedules: (1) single application (SA; 1×) and, (2) cyclic application (CA; 3×) under three different moisture conditions. (1) Effective container capacity (eCC), (2) 20% VWC (Flag), and (3) 10% VWC (Dry).
Initial Moisture StatusSubstrate SystemContainer ProfileIrrigation zHydration Peak (g) yWater Retention (g) xCumulative Leached (g) wWater Application Efficiency (g) vMax Weight after Effective Pulse (g) u
eCC tNon-StratifiedFallowSA527.0 a a23.3 b1013.3 a2.3 b527.0 a
eCCNon-StratifiedRootedSA456.7 ab35.0 ab1011.0 a3.3 ab456.7 a
eCCStratifiedFallowSA546.0 a32.6 ab1009.0 ab3.3 ab403.3 a
eCCStratifiedRootedSA426.0 abc45.7 a995.0 b4.3 a426.0 a
p-Value b---0.46030.00600.0157<0.01910.4891
Flag sNon-StratifiedFallowSA291.3 a187.3 ab152.0 c55.3 a426.7 a
FlagNon-StratifiedRootedSA217.3 b104.7 cd241.0 ab30.7 bc253.7 b
FlagStratifiedFallowSA303.7 a201.0 a145.0 c58.0 a403.3 a
FlagStratifiedRootedSA176.0 b60.0 d284.7 a17.3 c134.3 c
FlagNon-StratifiedFallowCA266.7 a223.7 a118.7 c65.3 a417.0 a
FlagNon-StratifiedRootedCA183.7 b123.3 c222.0 b35.7 b230.0 bc
FlagStratifiedFallowCA275.3 a231.7 a170.3 c69.3 a445.7 a
FlagStratifiedRootedCA186.7 b126.7 bc211.0 b37.7 b237.0 b
p-Value---<0.0001<0.0001<0.0001<0.0001<0.0001
Dry rNon-StratifiedFallowSA221.0 a86.3 b235.7 a26.7 b230.0 a
DryStratifiedFallowSA272.3 a135.0 ab193.3 a41.0 ab261.0 a
DryNon-StratifiedFallowCA227.7 a176.7 a155.3 a53.3 a308.7 a
DryStratifiedFallowCA203.0 a157.0 ab103.0 a48.0 ab294.0 a
p-Value---0.14220.04920.10220.05650.4670
z Type of irrigation used. SA—single application. CA—cyclic application. y Measured peak values. x The quantity of water retained by the substrate. w The quantity of water leached by the substrate. v Water application efficiency. Water retained/total water applied. u Maximum substrate weight after effective pulse was applied. t Ecc—Effective container capacity. s Flagging moisture status has a targeted initial VWC of 20%. r Dry moisture status has a targeted initial VWC of 10%. a Letters (i.e., a, b, c, etc.) denote detected differences among means of a full factorial including four substrates (non-stratified fallow, non-stratified rooted, stratified fallow, and stratified rooted) utilizing Tukey’s HSD (α = 0.05). b Measures of overall treatment effects utilizing ANOVA analysis utilizing a significance level (α = 0.05).
Publisher’s Note: MDPI stays neutral with regard to jurisdictional claims in published maps and institutional affiliations.

