Article

Changes in Fruit Quality and Sugar Components of Wild Actinidia eriantha of Different Varieties (Lines) at the Ripening Stage

1
College of Agronomy, Jiangxi Agricultural University, Nanchang 330045, China
2
Institute of Kiwifruit, Jiangxi Agricultural University, Nanchang 330045, China
*
Author to whom correspondence should be addressed.
Horticulturae 2022, 8(9), 824; https://doi.org/10.3390/horticulturae8090824
Submission received: 6 August 2022 / Revised: 5 September 2022 / Accepted: 5 September 2022 / Published: 8 September 2022

Abstract

:
In order to better understand the changes in fruit quality and soluble sugar components in wild Actinidia eriantha at the soft ripening stage, this study explored the fruit quality indexes, soluble sugar components, sucrose metabolism-related enzyme activities and the expression of sucrose metabolism-related enzyme genes in wild A. eriantha germplasm resources. The results showed that the fruit quality of wild A. eriantha at the soft ripening stage was quite different, and the coefficient of variation of fructose content was the largest, followed by sucrose and glucose. Principal component analysis and systematic clustering analysis showed that the comprehensive performance of fruit quality indexes of M28 and M10 was the most prominent. The accumulation and composition of soluble sugar components in different wild A. eriantha varieties (lines) were not consistent. The activities of sucrose metabolism enzymes among wild A. eriantha varieties (lines) were different to some extent. The sucrose metabolism-related enzyme genes among wild A. eriantha germplasm resources had different expression patterns. The results will contribute to understanding the fruit quality changes and the mechanism of sugar metabolism in wild A. eriantha at the soft ripening stage, and lay a foundation for the protection and utilization of wild A. eriantha germplasm resources.

1. Introduction

Actinidia eriantha Benth., which belongs to the Actinidia genus of Actinidiaceae, is a perennial deciduous woody liana that is native to China [1]. The inflorescence and fruit surface of A. eriantha are densely covered with white or grayish-white short hairs, and is the most important morphological feature of A. eriantha that distinguishes it from other Actinidia species [2]. The fruit of A. eriantha is usually long and cylindrical, with dark green flesh that is easy to peel when the fruit is ripe [3]. Among the plants of the genus Actinidia, the size of A. eriantha fruit is only smaller than that of the main varieties of A. chinensis and A. deliciosa. The fruit of A. eriantha is rich in nutrition; the ascorbic acid (AsA) content is especially high. The AsA content in 100 g fresh flesh of the fruit is as high as 500–1379 mg, which is 3–4 times higher than that of commercial cultivars of A. chinensis [4]. In addition to its edible value, A. eriantha also has certain medicinal value. For example, its root extract has been shown to have anti-tumor, anti-oxidative and immune regulatory effects, and is used in traditional Chinese folk medicine [5,6]. In addition, compared with A. chinensis and A. deliciosa, A. eriantha has stronger adaptability, stress resistance, moisture resistance and heat resistance, with especially better resistance than the other varieties to Pseudomonas syringae PV. actinidiae (PSA) [7,8,9,10]. These excellent comprehensive characteristics indicate that A. eriantha is a kind of characteristic health fruit worthy of development and utilization.
A recent study has shown that A. eriantha originated from the hilly region of Zhejiang-Fujian, China. After repeated expansion and differentiation, the range of A. eriantha was expanded to the vast hilly areas south of the Yangtze River, such as Jiangxi, Hunan, Guizhou, Guangdong, Guangxi and Yunnan [11]. The wild A. eriantha population has been shown to have high genetic diversity, and contains abundant genetic variation [11,12,13], which can provide rich and valuable candidate materials for A. eriantha breeding. Therefore, the collection and evaluation of wild A. eriantha germplasm resources will be able to breed new varieties (lines) with excellent quality, and will also be beneficial to the protection and utilization of A. eriantha germplasm resources. At present, many studies have conducted a comprehensive evaluation of the fruit quality (including fruit appearance and flavor qualities) of wild A. eriantha germplasm resources [14,15,16,17,18]. On this basis, a number of new varieties (lines) of A. eriantha with excellent comprehensive quality have been screened and cultivated from wild A. eriantha germplasm resources, such as ‘Bidan’ [19], ‘White’ [20], ‘Ganmi 6’ [21] and ‘Ganlv 1’ [22].
Sugar is an important component of fruit flavor quality and nutrients, and also an important factor that affects fruit post-ripening quality. The fruit of A. eriantha is a typical respiratory climacteric fruit, and its photosynthetic products are mainly stored and accumulated in the fruit in the form of starch, which will gradually decompose and convert into soluble sugars during the process of post-harvest ripening [23]. Sucrose, fructose and glucose are the three main soluble sugars in fruit, which are the main components of fruit quality and sugar composition. Among them, sucrose is necessary to maintain cell metabolism and cell wall biosynthesis, and can be converted into starch for storage and subsequent use [24]. The main form of the photosynthetic product of most fruit trees (including Actinidia species) is sucrose, which is transported into the fruit through the phloem, and participates in the metabolism and accumulation of substances in fruit growth and development [24,25,26]. Sucrose metabolism is an important link in fruit sugar accumulation, and the activities of enzymes that are related to sucrose metabolism directly affect the accumulation, transportation and transformation of sugar in fruits, mainly including sucrose invertases and sucrose synthases. Sucrose invertases, including vacuolar acid invertase (VIN), neutral invertase (NI) and cell wall-bound invertase (CWIN), catalyze the degradation of sucrose to glucose and fructose; meanwhile, sucrose synthases, including sucrose synthase (SS) and sucrose phosphate synthase (SPS), catalyze the synthesis of sucrose [27]. Sucrose metabolism-related enzyme genes in plants usually exist in the form of gene families, and the number of gene family members varies in different species. For example, seven SS genes were identified in A. deliciosa ‘Hayward’, while only six SS genes were identified in A. chinensis ‘Hongyang’ and A. eriantha ‘White’ [28,29]. In addition, six and three SPS genes were also identified in ‘Hongyang’ and ‘White’, respectively [29].
In our previous study, we investigated the dynamic changes in fruit quality and sugar component content during fruit development in A. eriantha ‘Ganlv 1’ with high sucrose content [30]. In this study, ‘Ganlv 1’ was used as the control to further study the fruit quality characteristics, sugar content, sucrose metabolism-related enzyme activities and related gene expression patterns in different varieties (lines) of wild A. eriantha at the soft ripening stage. The results of this study will lay a solid foundation for the breeding of excellent A. erianha varieties (lines), as well as for the protection and utilization of wild A. eriantha germplasm resources.

2. Materials and Methods

2.1. Materials and Sample Collection

The experimental materials were wild A. eriantha varieties (lines) collected in Jiangxi Province, China, with relatively good comprehensive characters. These materials were grafted and preserved in a kiwifruit germplasm resource nursery in Fengxin County, Jiangxi Province, China. The excellent strain ‘Ganlv 1’ of A. eriantha, growing in the same germplasm resource nursery, was used as the control (CK). The fruits were sampled during the picking period in November 2020, and 15 to 20 pest- and disease-free fruits of the same size were randomly picked from each variety or line. The fruits were placed in the laboratory under normal temperature conditions until they were naturally soft-ripened. After soft ripening, the outer pericarp was removed, then the inner pericarp was chopped and quick-frozen with liquid nitrogen; finally, the chopped inner pericarp was stored at −80 °C for later use.

2.2. Determination of Fruit Quality

The single fruit weight, fruit vertical diameter, fruit horizontal diameter, fruit lateral diameter and fruit shape index were determined immediately after the fruit samples were picked. The determination of other fruit quality indexes was carried out when the fruit firmness reached 1.0~1.2 kg·cm−2 after ripening and softening at room temperature. Fruit firmness was determined using a TA-XT Plus texture analyzer. The single fruit weight was weighed using an electronic balance. The fruit vertical diameter, fruit horizontal diameter and fruit lateral diameter were measured using electronic digital calipers, and the ratio of vertical diameter to horizontal diameter was the fruit shape index. The dry matter content (DM) was determined by the drying-weighing method. Thin slices of peeled flesh were taken from the middle part of the fruit and laid flat in a dry petri dish. Fresh weight was weighed and dried at 65 °C until the weight was constant. The dry matter content is the percentage of dry weight to fresh weight. The content of soluble solids (SSC) was measured by an ATAGO (PAL-1) handheld digital glucometer. The content of titratable acid was determined by the acid-base neutralization titration method, and the ASA content was determined by the 2,6-dichloroindophenol method. The specific operation methods were referenced from the experimental manual [31].

2.3. Determination of Soluble Sugar and Sugar Components

The total soluble sugar content of the fruit was determined by the anthrone colorimetric method, and the specific operation protocols were shown in the operation manual [31]. The sugar components were determined by a modified HPLC method, and the sample preparation and chromatographic conditions were the same as described in the previous study [30].

2.4. Determination of Sucrose Metabolism-Related Enzyme Activities

Each sample was weighed for about two grams of flesh and ground with liquid nitrogen, then used for the determination of sucrose metabolism-related enzyme activities. The activities of sucrose metabolism-related enzymes, including VIN, NI, SS, SPS and CWIN, were determined using the plant enzyme-linked immunosorbent assay (ELISA) kits (MEIMIAN, Yancheng, China). The VIN was determined using a plant acid invertase kit (KT5045-B), NI by a plant neutral invertase kit (KT8107-B), SS by a plant sucrose synthase kit (KT5043-B), SPS by a plant sucrose phosphate synthase kit (KT5044-B) and CWIN using a plant cell wall invertase kit (KT50250-B). Each specific determination method was carried out in accordance with its respective manufacturer’s instructions.

2.5. Expression Analysis of Genes Related to Sucrose Metabolism

The sequences of sucrose metabolism enzyme-related genes (VIN, NI, SS, SPS and CWIN) were downloaded from the Kiwifruit Genome Database [32], and the qRT-PCR primers were designed using Primer 3 (v 0.4.0) and synthesized by Tsingke Biological Technology (Beijing, China). The kiwifruit Actin gene was used as an internal reference gene. The primer sequence information was the same as that used in the previous study [30]. Fruit RNA extraction and qRT-PCR procedures were also referred to from the previous study [30].

2.6. Data Processing and Analysis

Data processing and analysis were performed using Microsoft Excel 2010 (Redmond, DC, USA) and SPSS v23.0 (Chicago, IL, USA). Analyses of variance (one-way ANOVA and Duncan’s new complex range method) and principal component analysis were performed using SPSS software v23.0. The data were normalized by using the membership function method before the principal component analysis [33]. The comprehensive Dn score was calculated according to the previous calculation method [33].

3. Results

3.1. Analysis of Fruit Appearance Quality of Wild A. eriantha with Different Varieties (Lines)

The measurement results of fruit appearance indexes in wild A. eriantha of different varieties (lines) are shown in Table 1. The single fruit weight was distributed in the range of 7.37 g (M8) to 30.00 g (CK), with a mean value of 17.67 g and a coefficient of variation of 37.13% (Table 2). The single fruit weight of CK was the largest (Table 1). Compared with the control, the single fruit weight of wild A. eriantha was lower than that of CK. Among these wild A. eriantha, the single fruit weights of the three varieties (lines) of M10, M11 and M12 all exceeded 20.00 g, which were 23.34 g, 22.50 g and 21.82 g, respectively, and all were higher than the average (Table 1 and Table 2). The single fruit weights of other wild-type varieties (lines) were all less than 20.00 g. The fruit shape index ranged from 1.48 (M6) to 2.43 (M28). The fruit shape indexes were all greater than 1, with the average value being 1.83, and the coefficient of variation was 14.21% (Table 2). M10 and M28 were higher than the control (1.99), and were 2.08 and 2.43, respectively. The fruit shape indexes of other wild-type varieties (lines) were all lower than that of the control (Table 1). Based on indexes such as single fruit weight and fruit shape index, M10 performed better and was suitable to be reserved as a dominant resource. The appearance quality indexes of other varieties (lines) of wild A. eriantha showed no special performance.

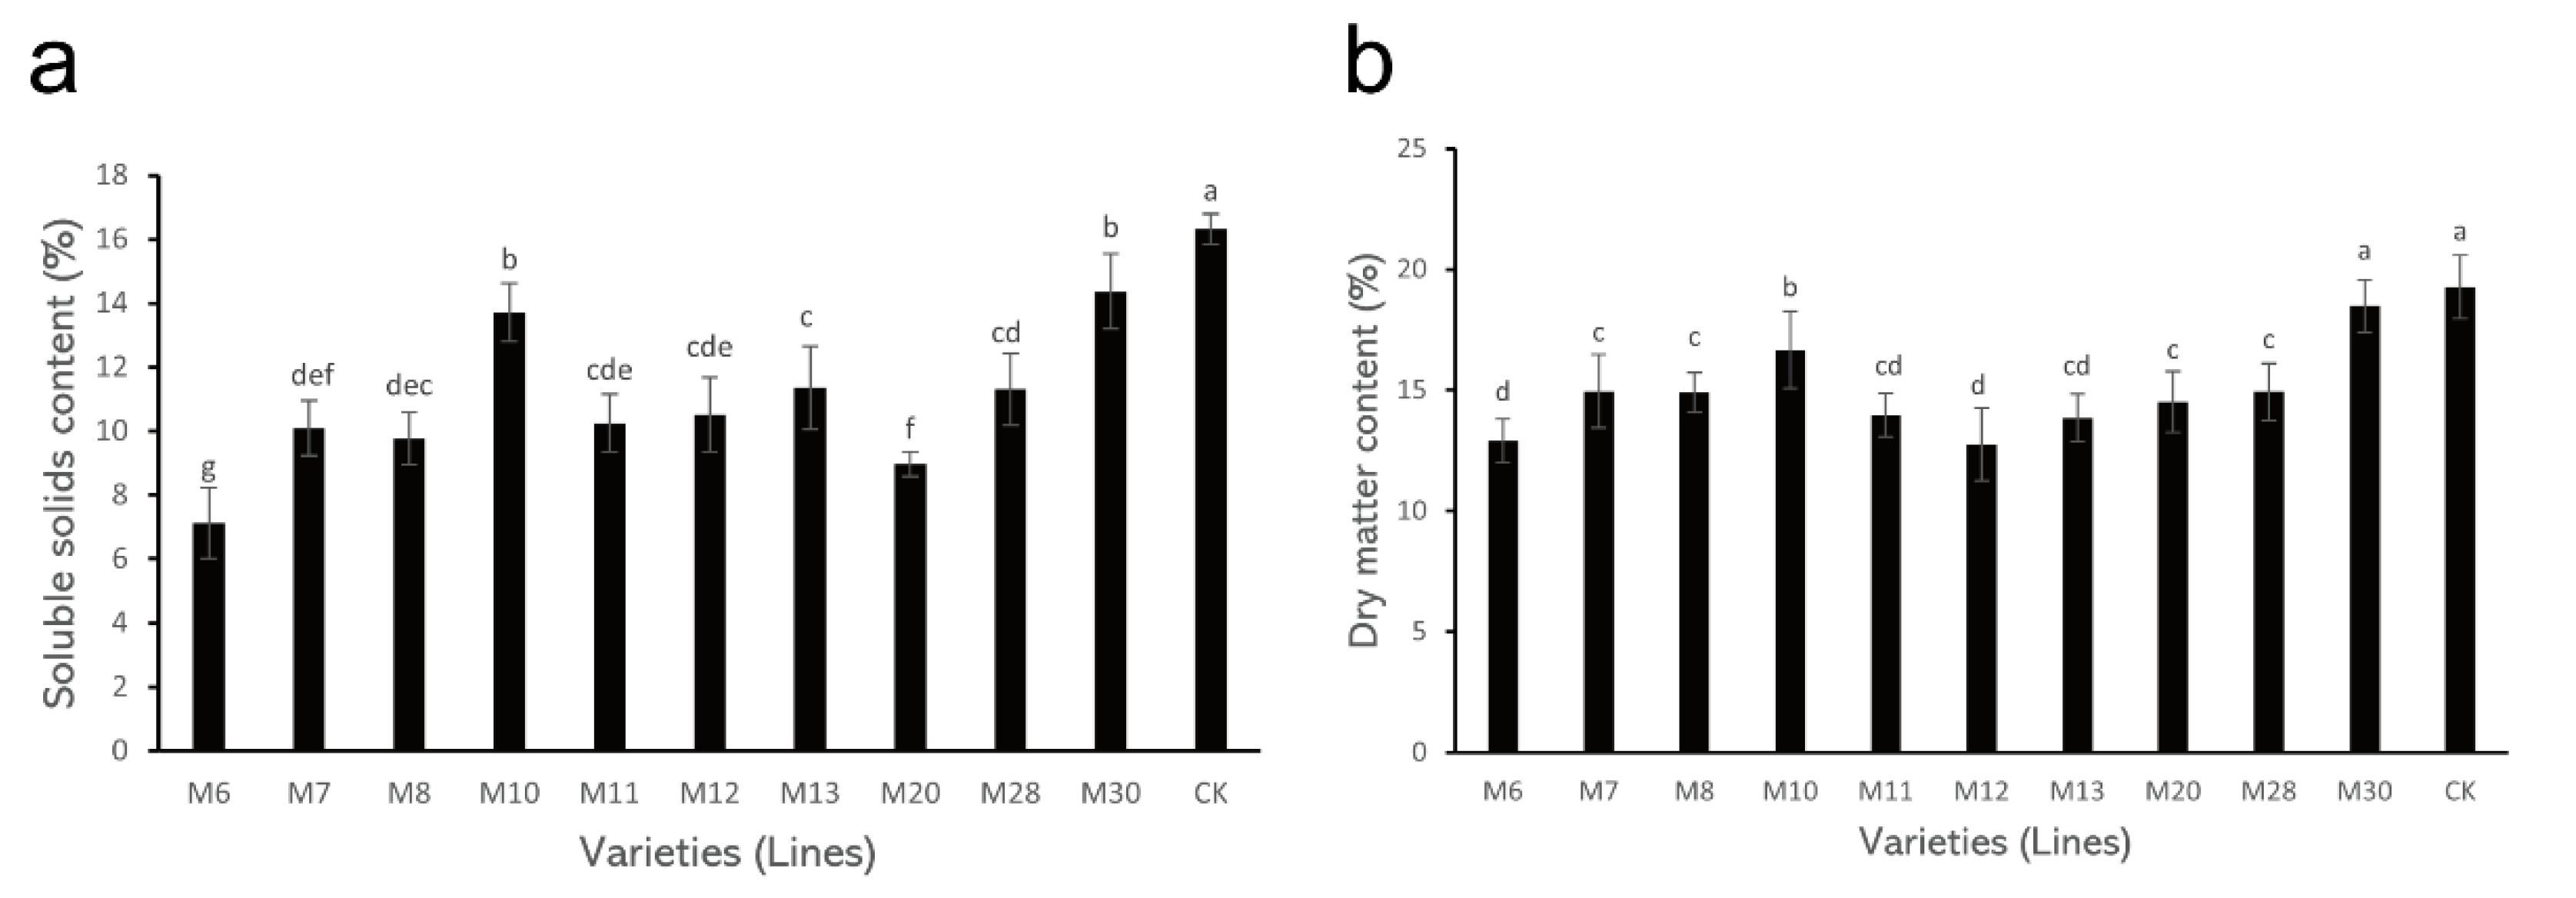
3.2. Changes in SSC and DM Content in Different Wild A. eriantha Varieties (Lines)

The determination results of SSC and DM content in different varieties (lines) of A. eriantha are shown in Figure 1. In these A. eriantha varieties (lines), the SSC ranged from 7.12% (M6) to 16.31% (CK), with an average of 11.25% and a coefficient of variation of 23.29% (Table 2). Compared with the control, the SSC of the wild A. eriantha varieties (lines) was lower than that of the control. Among them, the SSC in both M10 and M30 was higher than those of other varieties (lines), while its content in M6 and M20 was relatively low (Figure 1a). In addition, the SSC content in other varieties (lines) showed little difference (Figure 1a).
The variation trends in DM for different varieties (lines) of wild A. eriantha were similar to those for SSC. The DM content of these varieties (lines) varied from 12.75% (M12) to 19.27% (CK), with an average of 15.20% and a coefficient of variation of 13.95% (Table 2). The DM content of the control was still the highest (19.27%), followed by the M10 and M30 varieties, and the DM content in M6 and M20 was still low (Figure 1b). The DM content in other varieties (lines) was similar (Figure 1b).

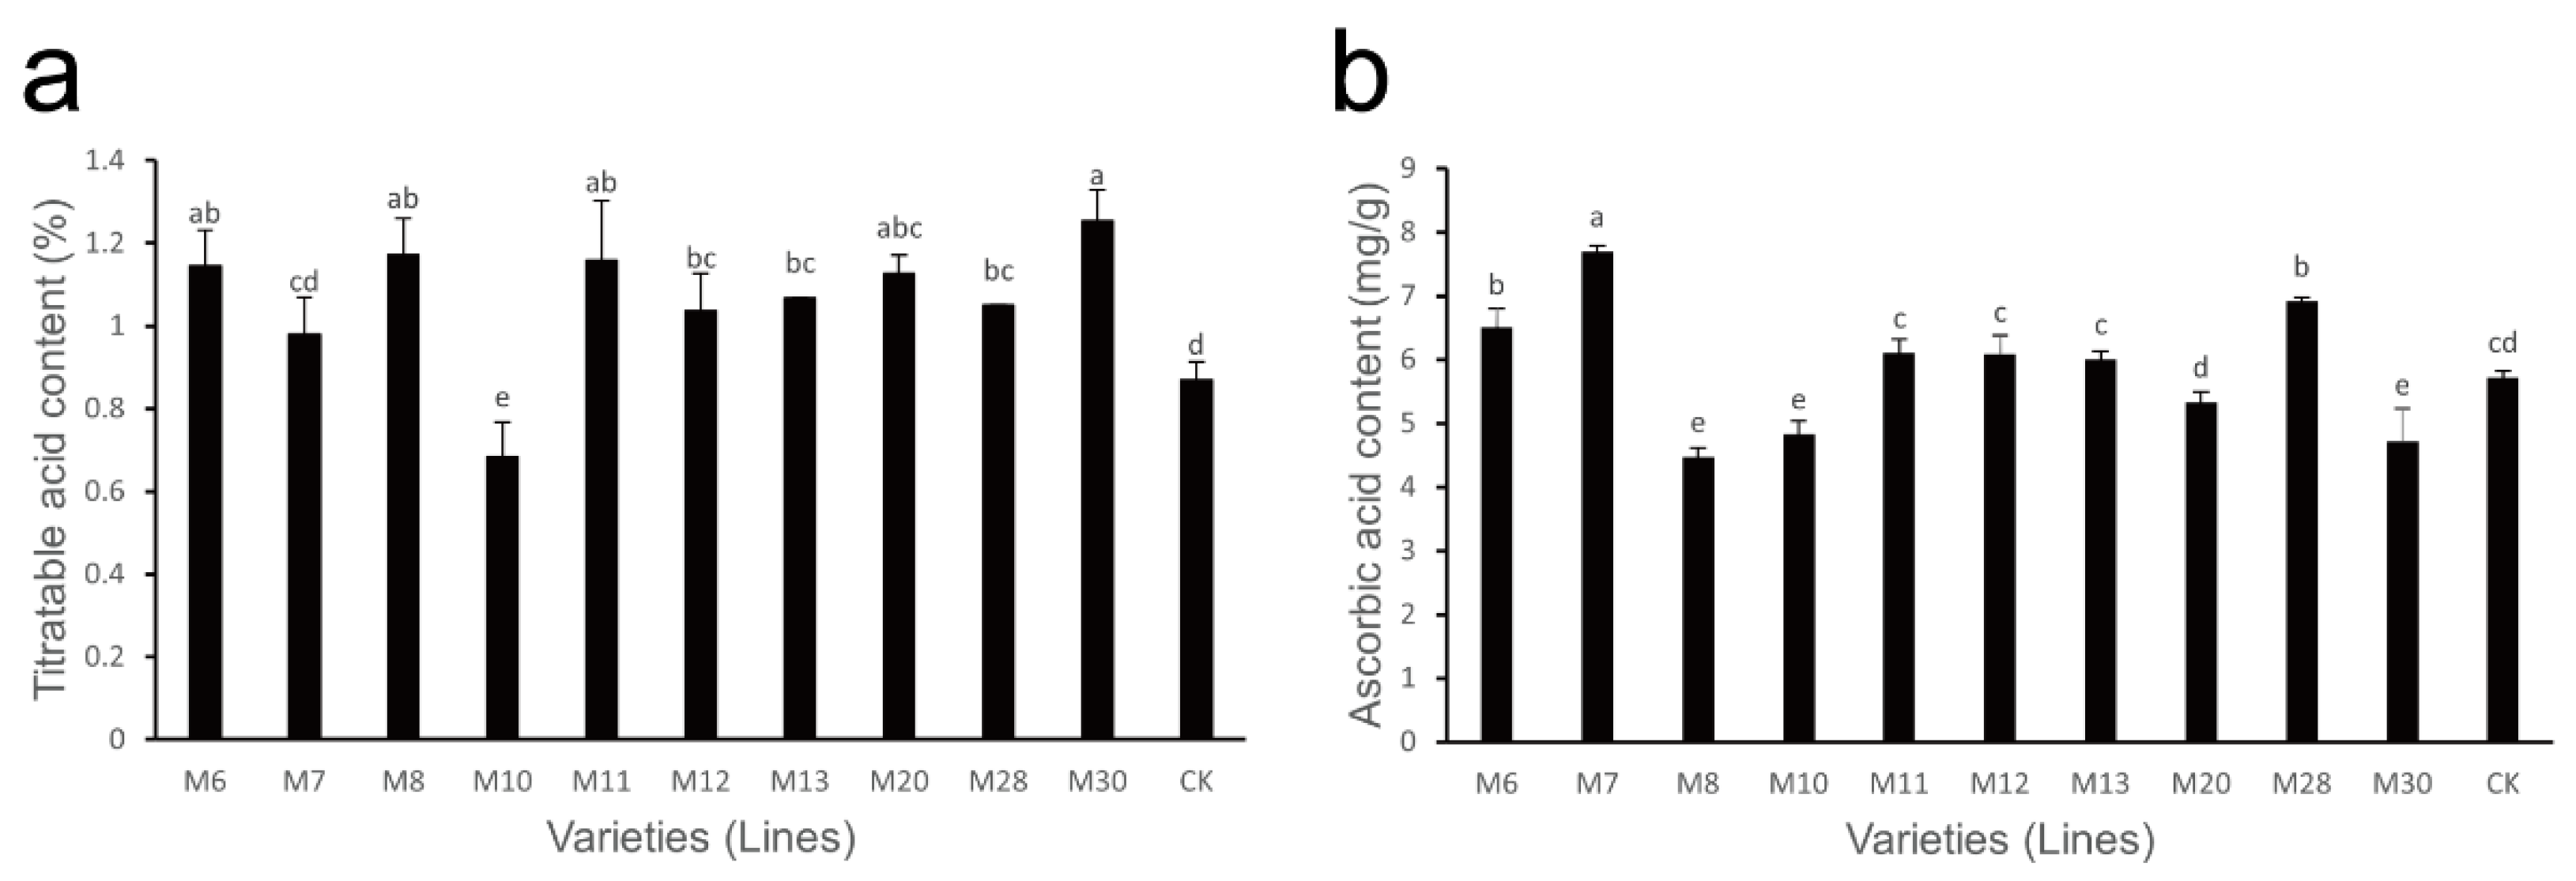
3.3. Changes in Titratable Acid and AsA Content in Wild A. eriantha Fruit of Different Varieties (Lines)

The variations in titratable acid content in wild A. eriantha of different varieties (lines) at the soft ripe stage are shown in Figure 2a. The titratable acid content in these varieties (lines) varied from 0.68% (M10) to 1.25% (M30), with an average of 1.05% and a coefficient of variation of 15.24% (Table 2). The titratable acid content in the M10 and M24 varieties was relatively low, while its content in M6, M8, M11 and M30 was relatively high; the titratable acid content in other varieties (lines) was relatively consistent.
The variations in AsA content in the soft ripe fruit of wild A. eriantha varieties (lines) are shown in Figure 2b. The content of AsA ranged from 4.47 mg/g (M8) to 7.70 mg/g (M7), with a mean value of 5.85 mg/g and a coefficient of variation of 16.75% (Table 2). Compared with the control, the AsA content in M8, M10 and M30 was relatively lower, while its content in M6, M7 and M28 was higher. The AsA content in the other samples was similar to that of the control.

3.4. Changes in Sugar Components in Wild A. eriantha of Different Varieties (Lines)

The changes in sugar components for wild A.eriantha of different varieties (lines) at the soft ripe stage are shown in Figure 3a. The content of fructose in the A. eriantha samples ranged from 12.12 mg/g (M6) to 116.81 mg/g (M28), with an average content of 52.02 mg/g and a coefficient of variation of 56.94% (Table 2). The fructose content in M6, M8 and M30 was relatively low, while the fructose content in the M10 and M28 varieties was relatively high. The variation range in glucose content was 8.70 mg/g (M6) to 63.53 mg/g (M10), with an average of 37.69 mg/g and a coefficient of variation of 38.95% (Table 2). The glucose content in M6, M28 and M30 was relatively low; the glucose content in M10 was the highest; and the glucose content of the remaining samples was similar. The sucrose content in the A. eriantha samples varied from 13.13 mg/g (M10) to 71.53 mg/g (M8), with an average value of 35.27 mg/g and a coefficient of variation of 54.27% (Table 2). The sucrose content in the M10, M11 and M28 varieties was relatively low, while that in M7 and M8 was relatively high. The two samples with the highest sum of the three main soluble sugar contents (fructose, glucose and sucrose) were M28 and M10, which were 160.23 mg/g and 159.58 mg/g, respectively, while M6 and M30 had the lowest total soluble sugar contents of 42.53 mg/g and 80.59 mg/g, respectively (Figure 3a). The soluble sugar content levels in the other samples were relatively close, all exceeding l10 mg/g (Figure 3a).
Distributions in the proportions of sugar components to the total soluble sugar content in the fruit of different wild A. erianth samples are shown in Figure 3b. The proportion of fructose to total soluble sugar ranged from 13% to 73%, among which M8 fructose had the lowest proportion (13%), while M28 fructose accounted for the highest proportion (73%). The proportion of fructose in the total soluble sugar of M10, M11, M12, M20, M28 and CK exceeded that of glucose and sucrose. The proportion of glucose in total soluble sugar ranged from 18% to 38%, with M28 (18%) being the lowest and M13 (38%) the highest. Only M13 had more glucose than fructose and sucrose. The proportion of sucrose in total soluble sugar ranged from 8% to 53%, with the lowest and highest values being M10 and M8, respectively. The proportion of sucrose in four samples (M6, M7, M8 and M30) exceeded that of fructose and glucose (Figure 3b).

3.5. Principal Component Analysis and Comprehensive Evaluation of Different Varieties (Lines) of Wild A. eriantha at the Soft Ripening Stage

Principal component analysis of fruit quality index data for different varieties (lines) of wild A. eriantha at the soft ripening stage was carried out after normalization by membership function. The results showed that the initial eigenvalues of the first three components were all greater than one, and their cumulative variance contribution rate reached 74.491%; that is, the information contained in the first three principal components reflected most of the information for fruit quality traits (Table 3). Among them, the contribution rate of the first principal component was 40.543%, and the main representative indexes were single fruit weight, fruit shape index, soluble solids content, dry matter, fructose and titratable acid. The contribution rate of the second principal component was 18.107%, and the main index was AsA. The contribution rate of the third principal component was 15.841%, and the third principal component was determined by glucose and sucrose (Table 3).
The contribution rate of each principal component was taken as the weight, and then the cumulative sum of the scores of the first three principal components for each sample and the product of the corresponding weight was calculated; finally, the comprehensive score value Dn was obtained. The higher the Dn value, the better the comprehensive quality performance. The comprehensive Dn score and ranking results of each wild A. eriantha sample are shown in Table 4. Among them, M28, M10 and CK ranked as the top three in the comprehensive score (Dn > 0.5) (Table 4), indicating that these three samples had better comprehensive fruit quality.

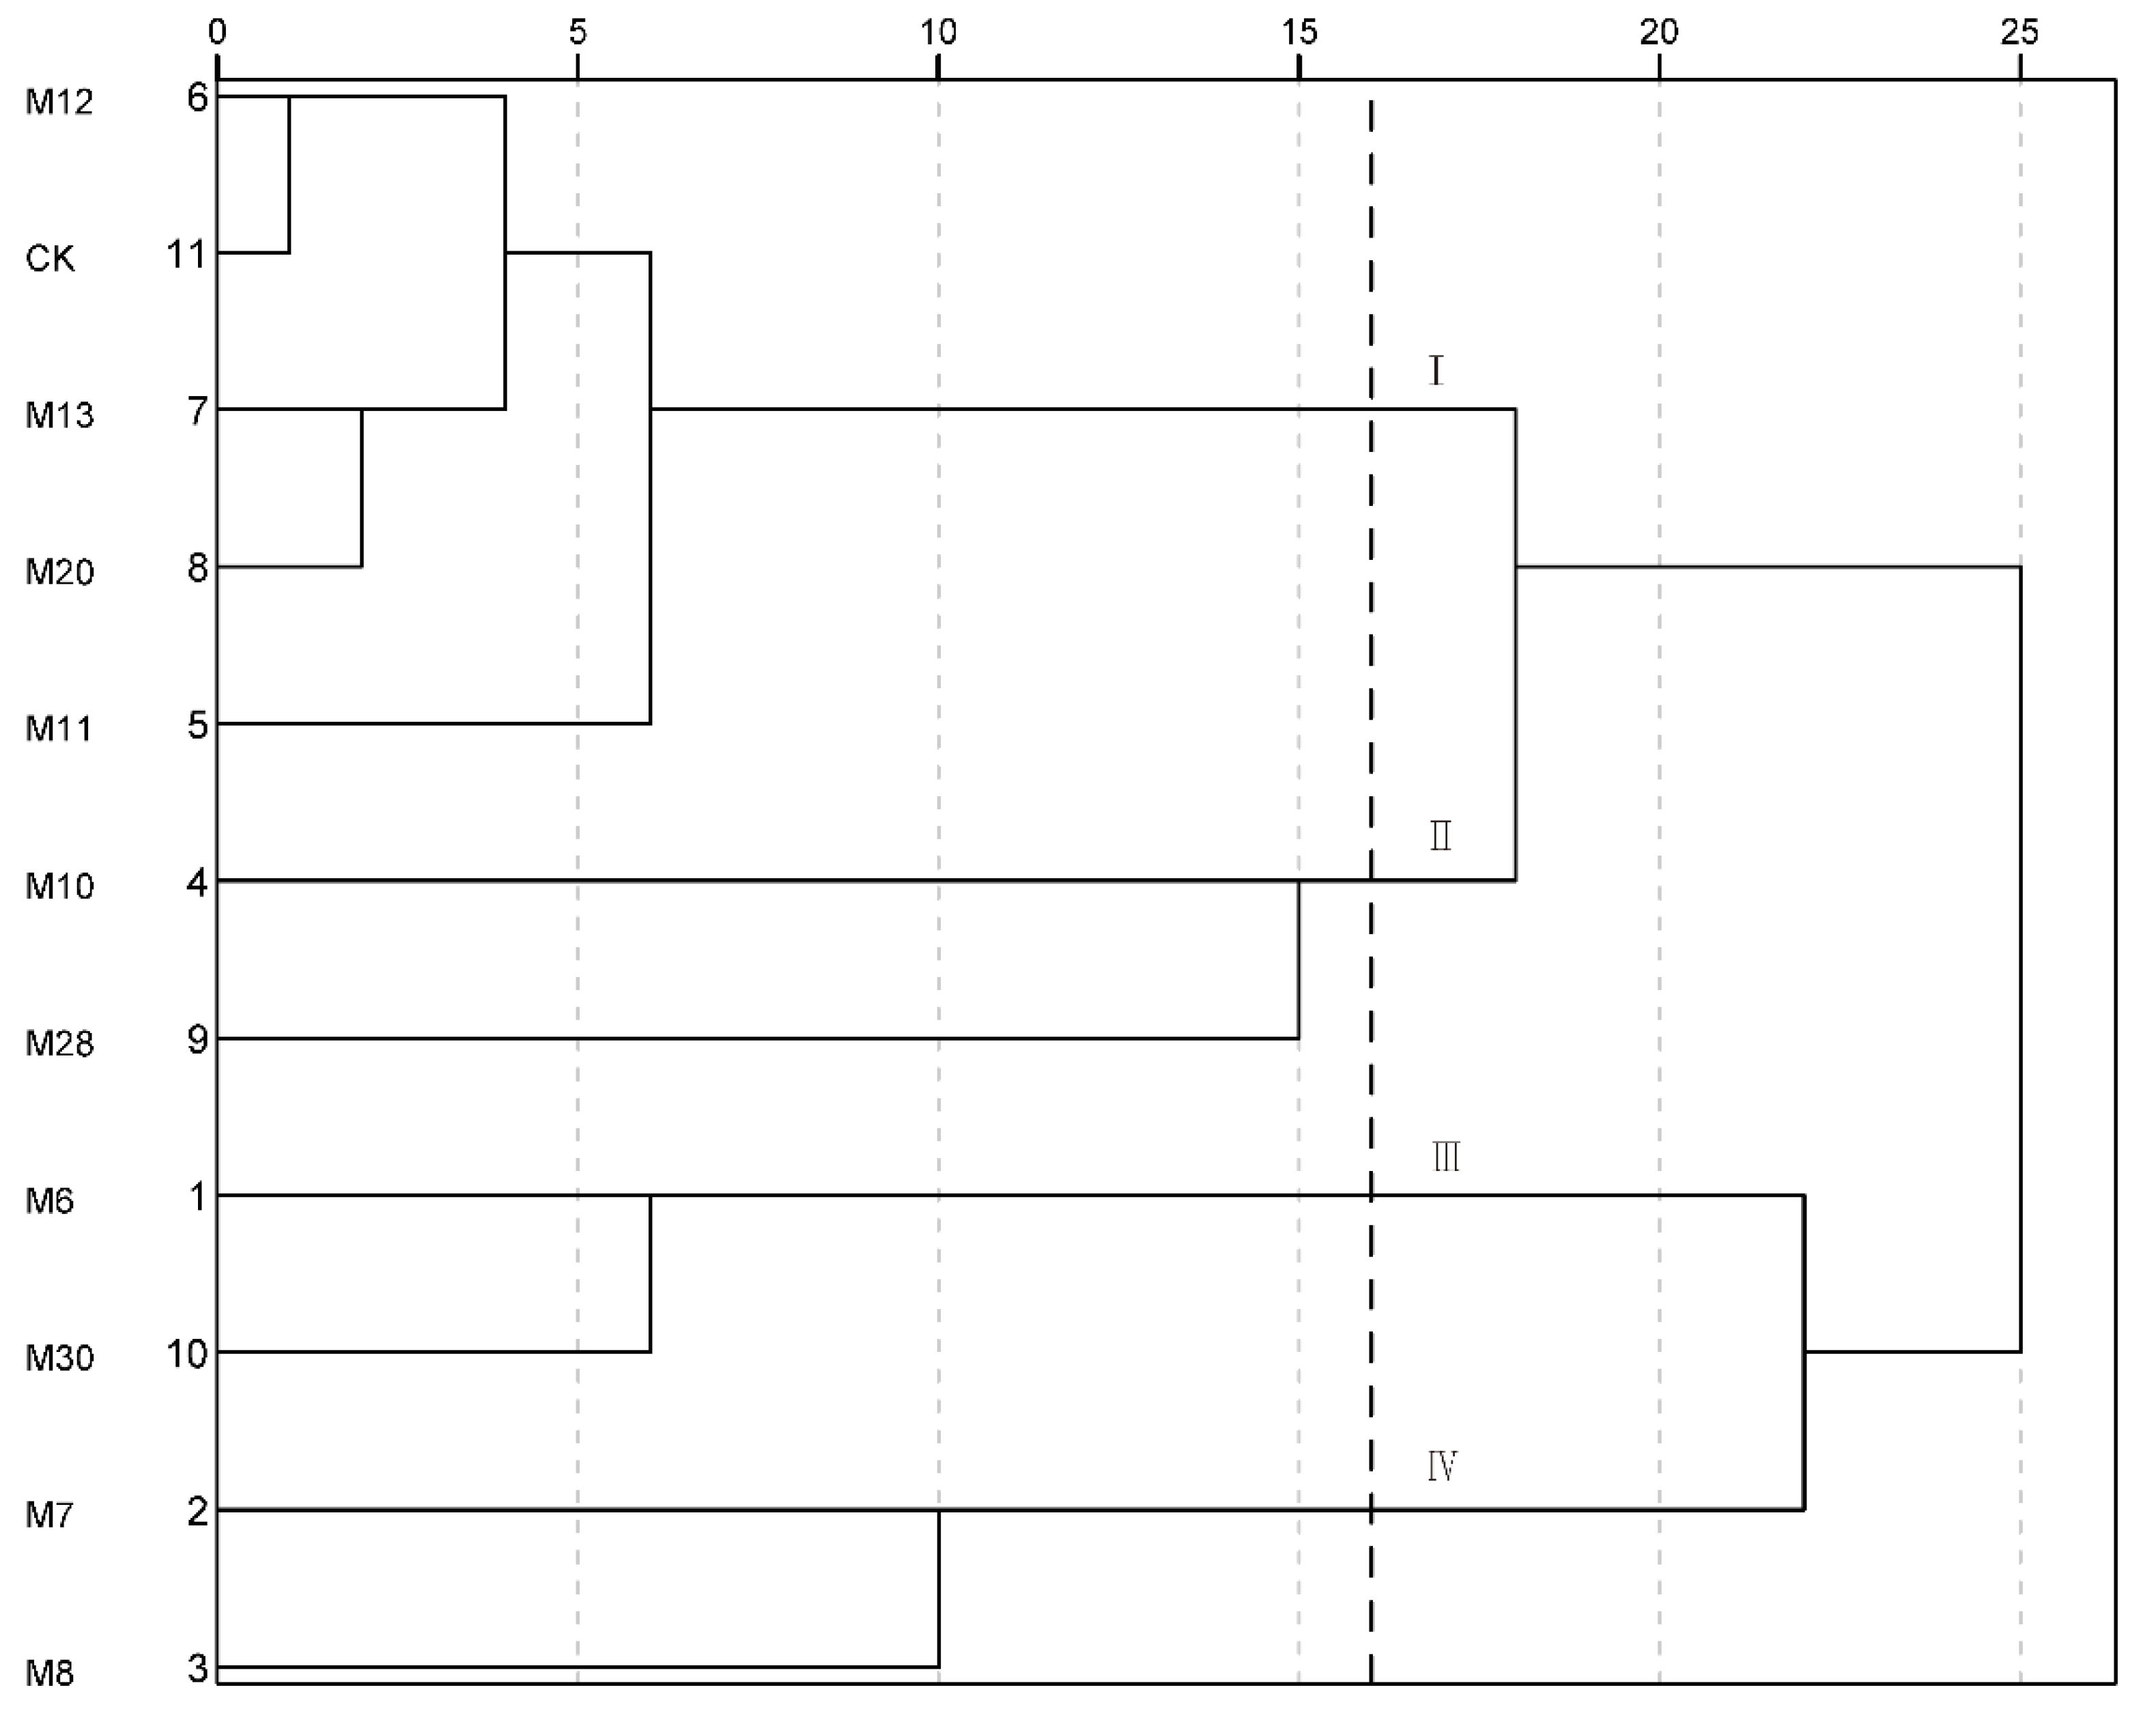
3.6. Systematic Cluster Analysis of Fruit Quality of Wild A. eriantha Samples

The fruit quality traits of the 11 wild A. eriantha samples were analyzed by systematic cluster analysis. The samples could be divided into four categories when the Euclidean distance was 16 (Figure 4). And the first category (I) mainly included CK, M11, M12, M13 and M20, which had higher single fruit weight, similar AsA content and higher sucrose content. The second category (II) mainly included M10 and M28, which had the most prominent comprehensive fruit quality traits. The third category (III) mainly included M6 and M30, which had lower single fruit weight and higher titratable acid content, with the comprehensive quality being poor. The fourth category (IV) mainly included M7 and M8, which had the highest sucrose content (Figure 4).

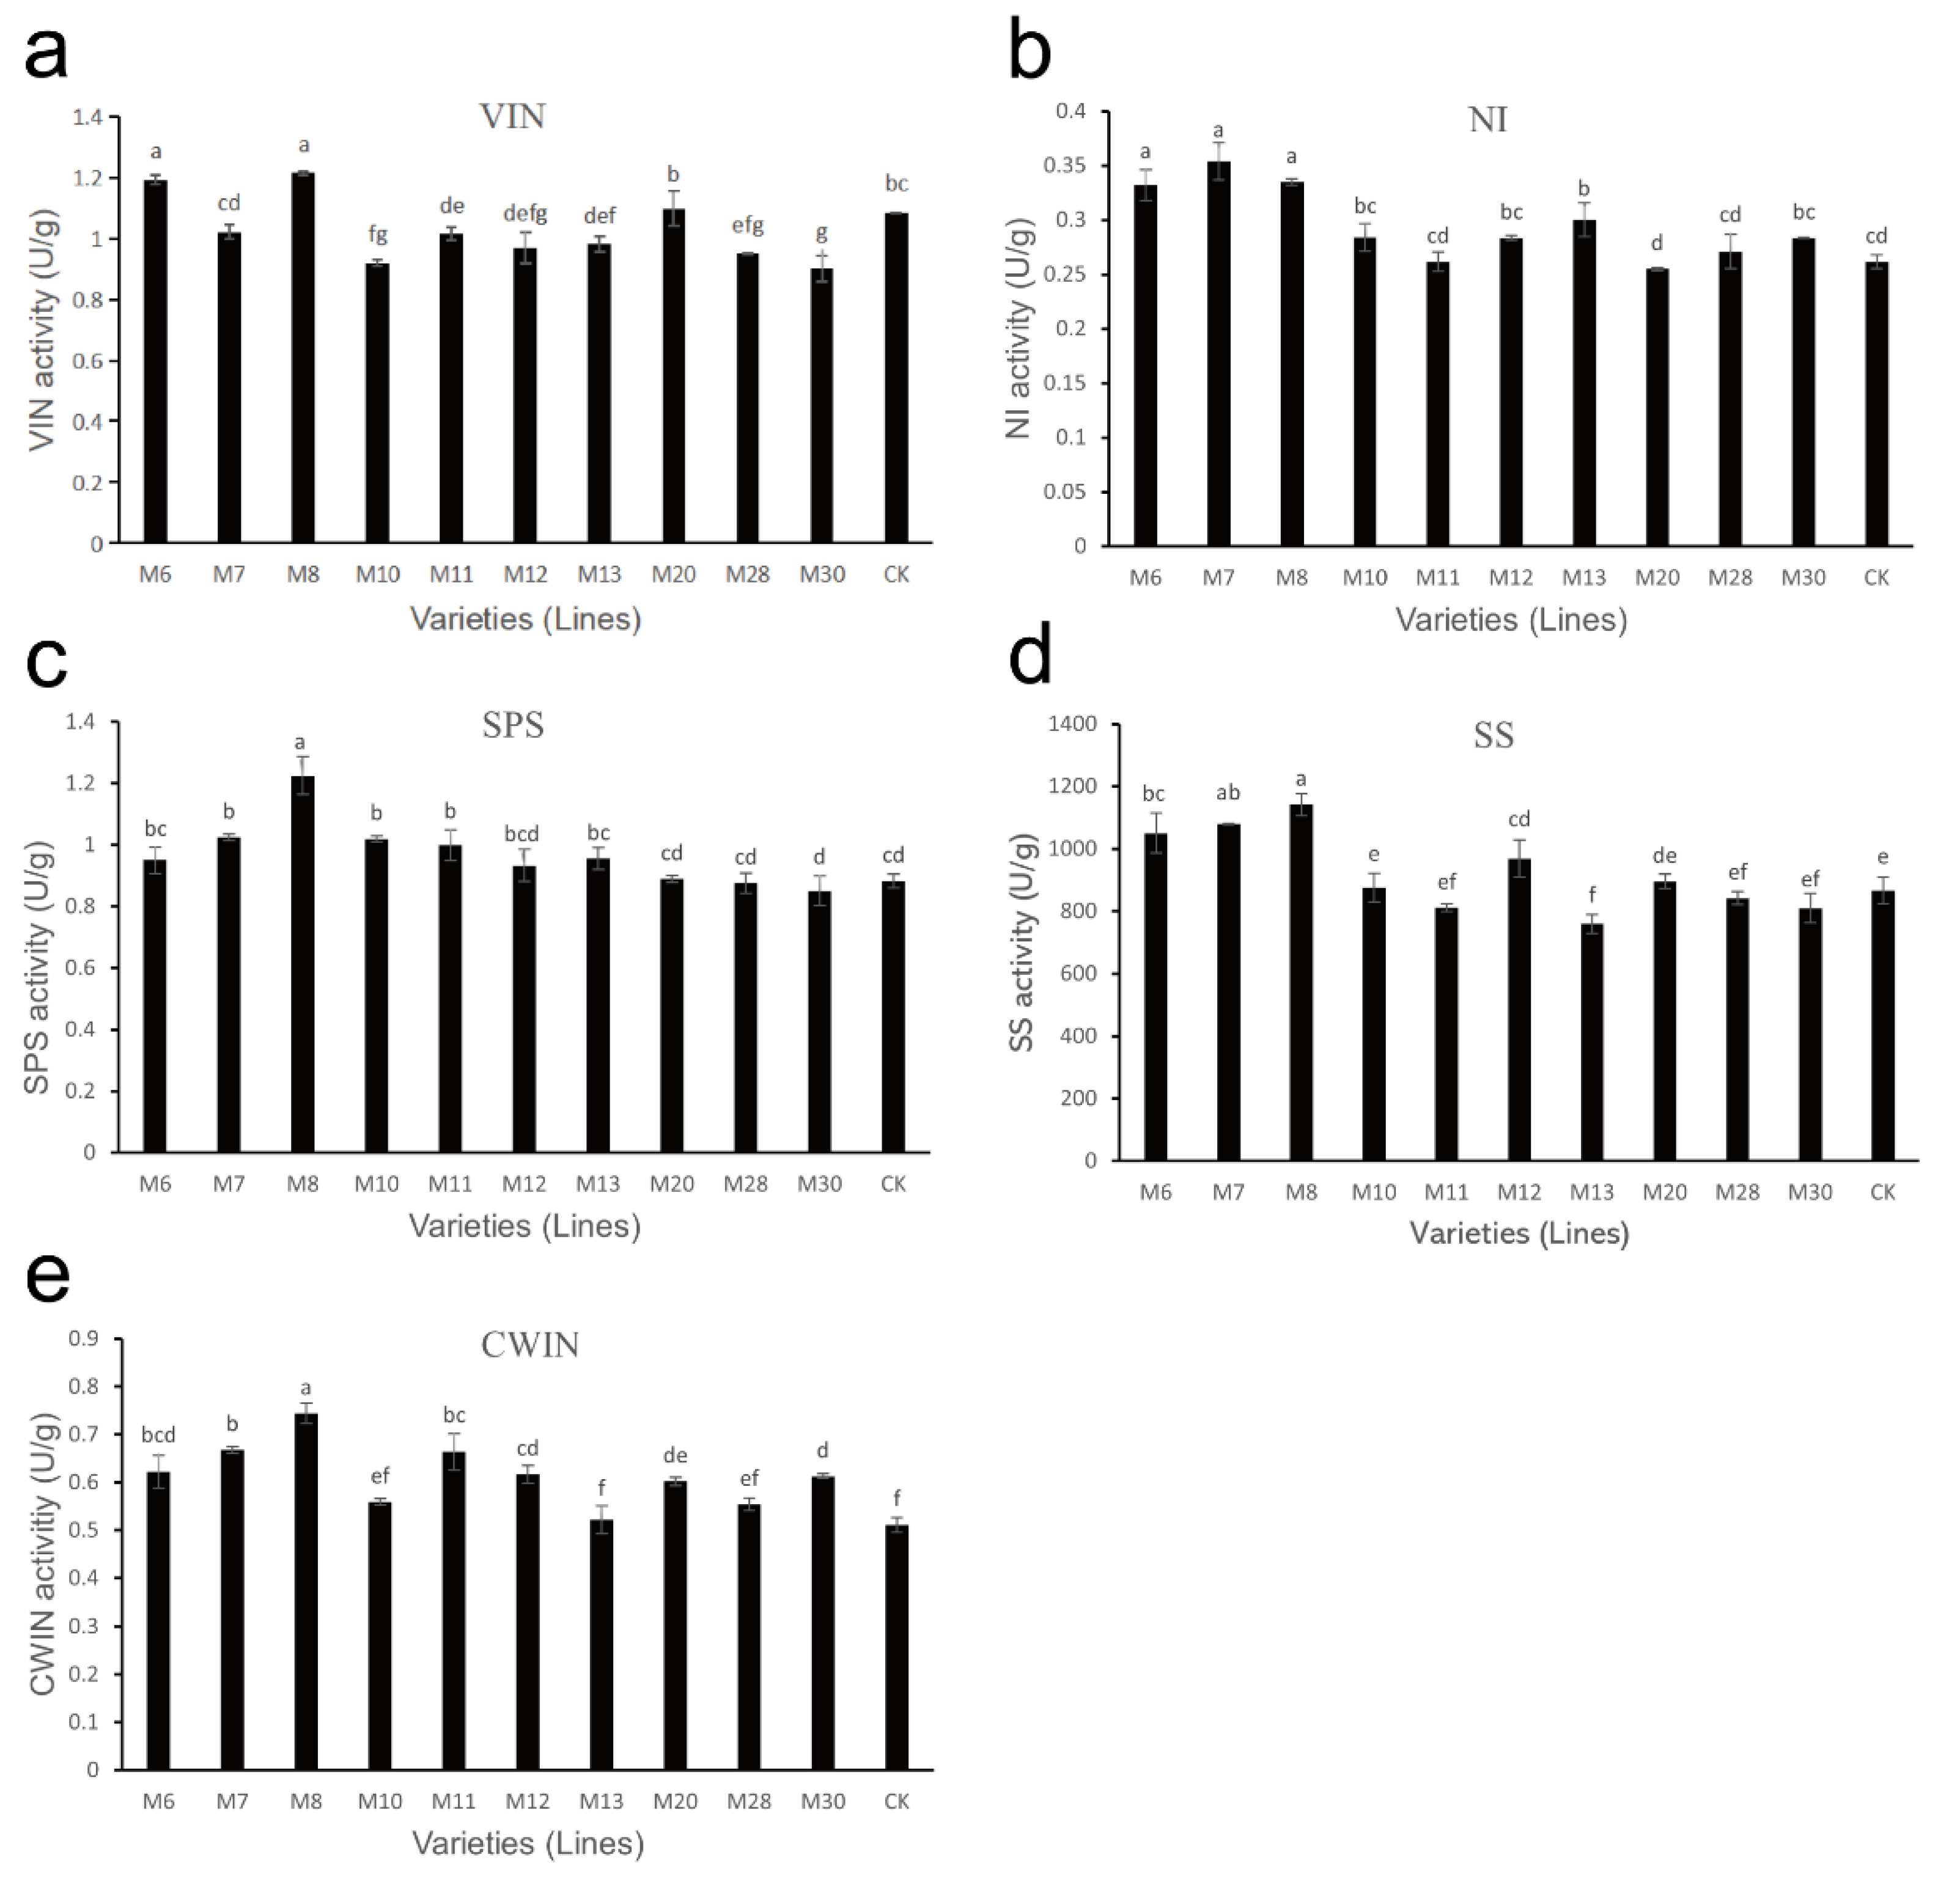
3.7. Analysis of Sucrose Metabolism-Related Enzyme Activities in Wild A. eriantha of Different Varieties (Lines)

The detection results of sucrose metabolism-related enzyme activities in different varieties (lines) of wild A. eriantha at the soft ripening stage are shown in Figure 5. For the VIN enzyme, the enzyme activities in M6 and M8 were higher, followed by M20, CK and M7, while the enzyme activities in other samples showed little difference (Figure 5a). The NI enzyme activities of the A. eriantha samples were generally low (enzyme activity was less than 0.4 U/g), among which M6, M7 and M8 enzyme activities were higher, followed by M13; M20 enzyme activity was the lowest, and the rest of the samples were relatively close (Figure 5b). The activity of M8 SPS enzyme was the highest, while that for other samples was basically the same (Figure 5c). The SS enzyme activity for different A. eriantha samples are shown in Figure 5d, from which it can be seen that the overall content of SS enzyme activity was high. Among them, the SS enzyme activities in M8, M7, M6 were relatively higher, while that in M13 was the lowest. The SS enzyme activity in other samples remained basically stable (Figure 5d). It can be seen from Figure 5e that the CWIN enzyme activity in A. eriantha samples was relatively low (all enzyme activities were lower than 0.8 U/g), in which M8 enzyme activity was the highest, while that in the M13 and CK varieties was the lowest.

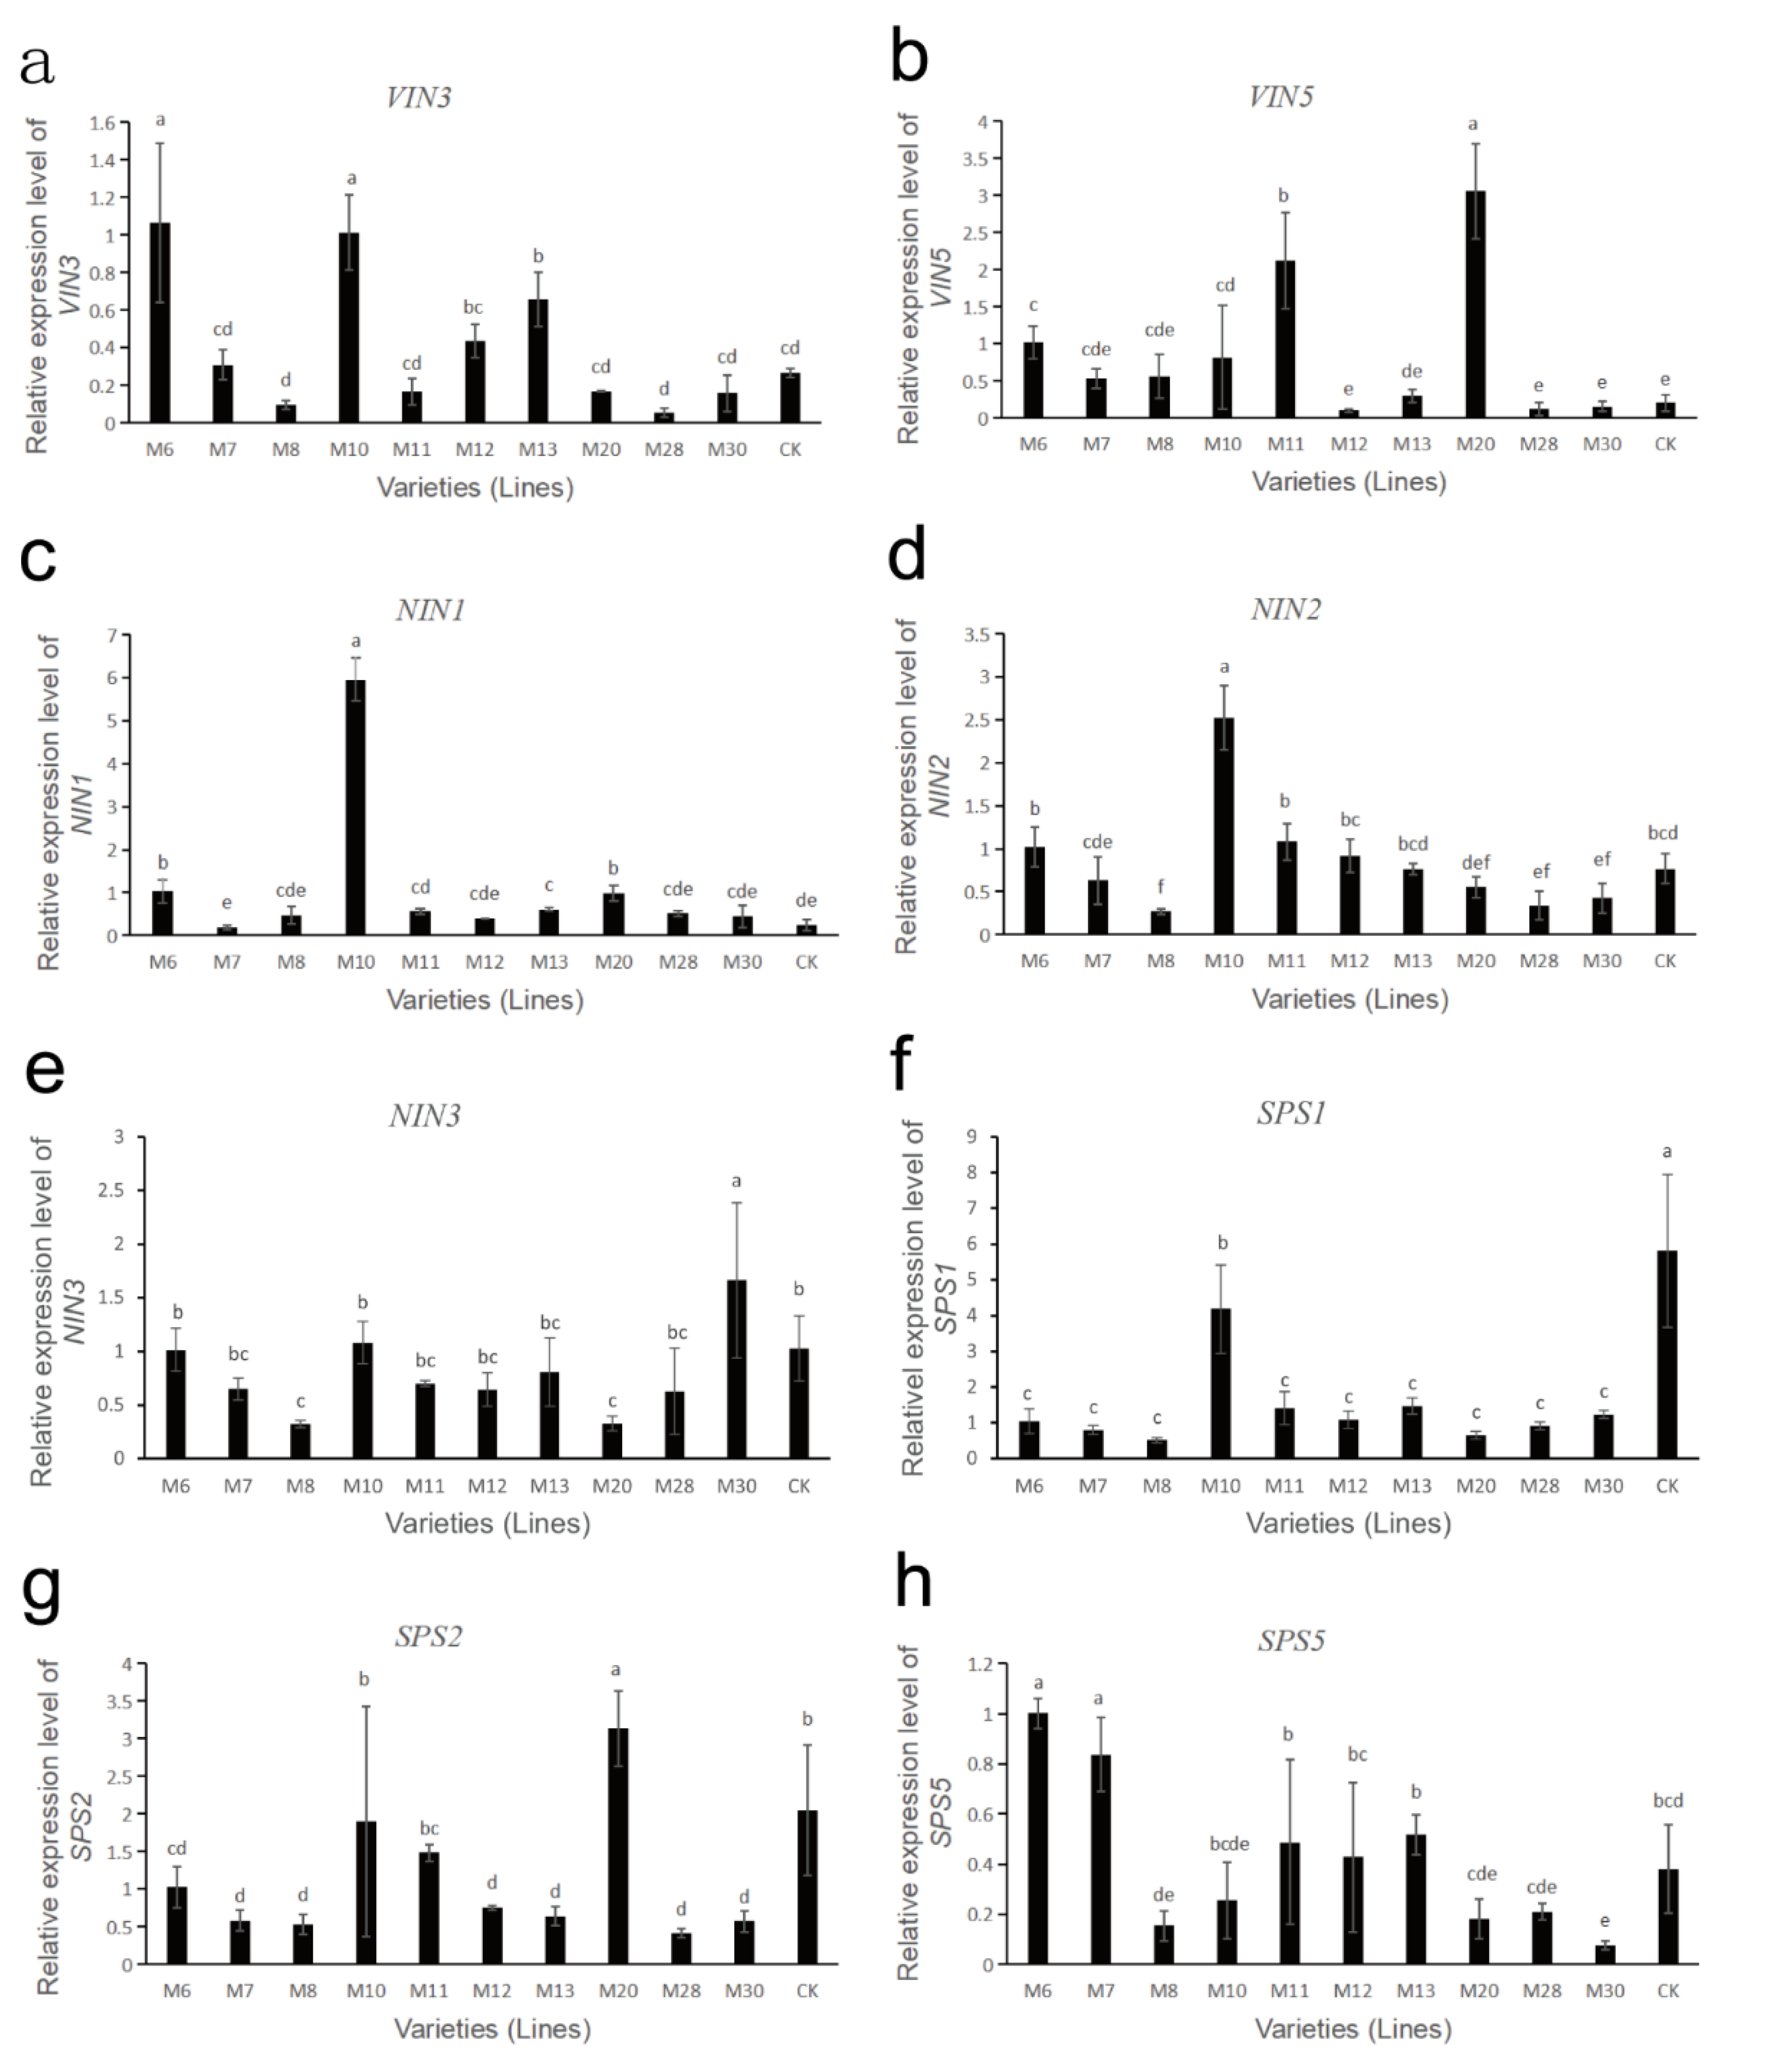
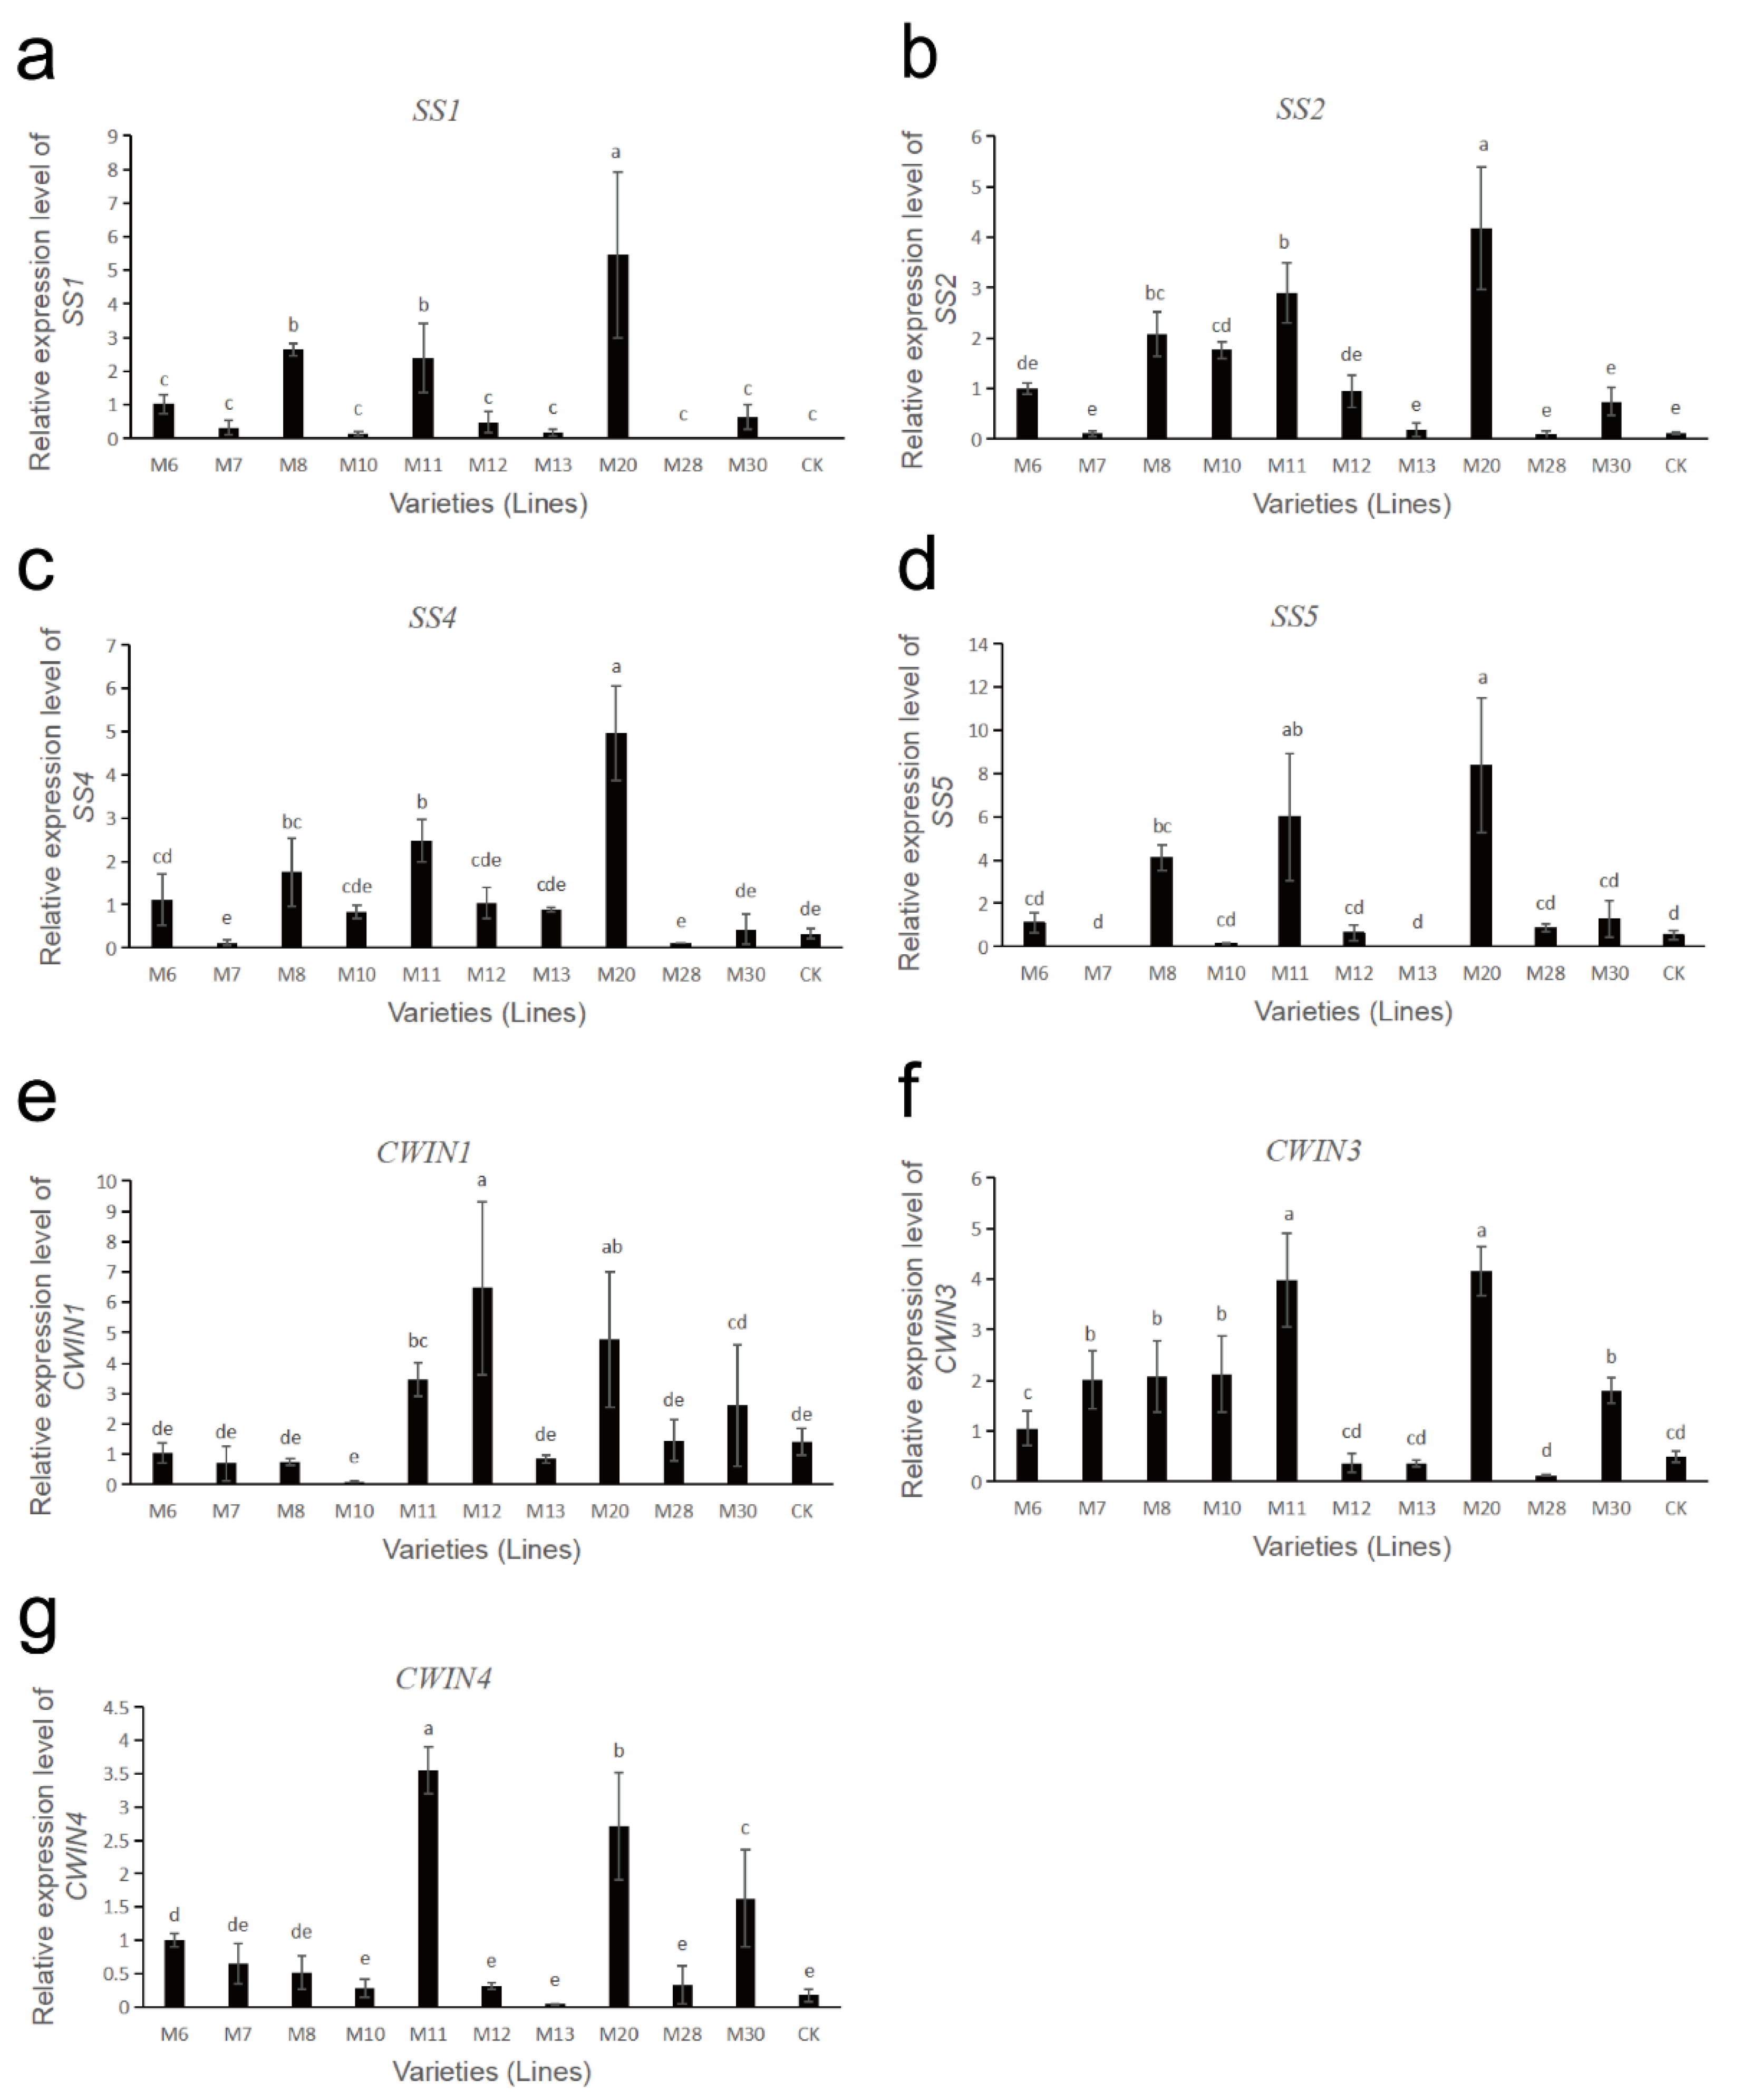
3.8. Expression Analysis of Sucrose Metabolism-Related Enzyme Genes in Wild A. eriantha of Different Varieties (Lines)

The gene expressions of sucrose metabolism-related enzymes in fruits of different wild A. eriantha cultivars (lines) at the soft ripening stage are shown in Figure 6 and Figure 7. As shown in Figure 6a, the expression levels of the VIN3 gene in M6 and M10 were relatively high, followed by M13, while the expression levels in M8 and M28 were the lowest. The expression levels of VIN3 in other samples were relatively low and close. The expression level of the VIN5 gene in M20 was the highest, followed by M11 and M6, and the expression levels of the VIN5 gene in other samples remained at a relatively low level (Figure 6b). Both NIN1 and NIN2 genes had the highest expression levels in sample M10, while the expression levels of these two genes were lower in other samples (Figure 6c,d). The expression level of the NIN3 gene was the highest in M30, and the lowest in M8 and M20, and the expression level of this gene was more consistent in other samples (Figure 6e). The expression level of the SPS1 gene was the highest in CK, followed by M10, and was relatively low and consistent in the other samples (Figure 6f). The expression level of the SPS2 gene was the highest in M20, followed by M10 and CK, and the expression level was lower in the other samples (Figure 6g). The expression level of the SPS5 gene was higher in M6 and M7, followed by M13, M11, M12 and CK, while its expression level was lower in the remaining samples (Figure 6h). The four SS genes (SS1, SS2, SS4, SS5) had similar expression patterns. These four SS genes were all expressed at the highest level in the M20 sample, followed by M8 and M11, while their expression levels were lower in the remaining samples (Figure 7a–d). The expression of the CWIN1 gene was the highest in M12, followed by M20, M11 and M30, while the expression of the gene was lower in other samples (Figure 7e). The expression of the CWIN3 gene was the highest in M11 and M20, followed by M7, M8 and M10, and the expression of the CWIN3 gene was low in other samples (Figure 7f). The expression level of the CWIN4 gene was the highest in M11, followed by M20 and M30, while its expression was low in other samples (Figure 7g).

4. Discussion

A. eriantha has special economic properties and nutritional values such as extremely high AsA content, strong disease resistance, easy peeling and long shelf life, and has great potential for development and utilization. A. eriantha naturally originated and was distributed in China, with abundant germplasm resources. In recent years, through the exploitation and utilization of wild A. eriantha germplasm resources, a number of new varieties of A. eriantha with outstanding characteristics have been bred. For example, ‘White’, with its easy-to-peel large fruit, has been widely used in commercial cultivation [34], along with ‘Ganmi 6’ with its easy peeling fruit and ‘Ganlv 1’ with its high sucrose content fruit [21,22]. However, most of the wild A. eriantha fruit are small, low in sugar and high in acid, and the appearance quality of the fruit is poor. It is possible to select the varieties (lines) of A. eriantha that have excellent comprehensive characters through resource exploration and comprehensive evaluation of wild A. eriantha germplasm resources. In this study, different varieties (lines) of wild A. eriantha and the variety ‘Ganlv 1’ with its high sucrose content were used to study the fruit quality and sugar metabolism characteristics of different wild A. eriantha varieties (lines). The results will provide a reference for the selection and breeding of excellent wild A. eriantha varieties.
The coefficient of variation reflects the dispersion degree of traits, and is the concrete embodiment of the genetic diversity of traits. The larger the coefficient of variation of the trait, the greater the dispersion degree of the trait, indicating that the genetic background of the trait is richer, and that the selection space during breeding is also greater. On the contrary, the smaller the coefficient of variation, the smaller the discrete degree of the trait is, indicating that the stability of the trait is better [35]. The previous results of fruit quality determination and variation analysis of wild A. eriantha germplasm resources showed that the coefficients of variation among different fruit traits were quite different [15,16,17]. In this study, the variation coefficients of the 12 fruit traits of the selected wild A. eriantha varieties (lines) were all above 10.0%, with a variation of 11.74–56.94%, indicating that the fruit quality of these different A. eriantha varieties (lines) also had great variation. Among these fruit traits, the fructose content had the largest coefficient of variation, reaching 56.94%, followed by sucrose and glucose, which were 54.27% and 38.95%, respectively. The single fruit weight and soluble solids also had relatively large coefficients of variation, which were 37.13% and 23.29%, respectively. The coefficients of variation of other varieties were all less than 20%. The high coefficient of variation indicates that these wild A. eriantha germplasms have rich genetic diversity, which provides rich selection materials for the exploration of excellent germplasm resources, and could be expected to yield new varieties with excellent comprehensive traits through breeding.
The principal component analysis is a multivariate statistical analysis method that converts multiple indicators into a few irrelevant comprehensive indicators. Principal component analysis can be used to analyze important influencing factors from among multiple factors, which is suitable for the comprehensive analysis of multiple indicators [36]. At present, principal component analysis is widely used in the comprehensive evaluation of fruit quality [15,17,33,37,38]. In this study, principal component analysis was performed on nine fruit qualities. The principal component analysis results of the data transformed by the membership function method showed that the cumulative contribution rate of the first three principal components (eigenvalue > 1) was 74.491%, which basically reflects all the data. The first three principal components were transformed by the weighting method, and a comprehensive Dn score was obtained that could objectively reflect the fruit quality for different varieties (lines) of wild A. eriantha. The results showed that the samples with a Dn greater than 0.5 were M28, M10 and CK, indicating that the comprehensive fruit quality of these samples was excellent; this was consistent with the actual taste evaluation, and some characteristics of these samples were particularly prominent. For example, M28 had the highest fruit shape index of 2.43, and the highest fructose content of 93.79 mg/g. M10 had the lowest titratable acid and sucrose content (0.68% and 13.13 mg/g, respectively), while it had the highest glucose content (63.53 mg/g). The comprehensive quality of CK fruit was excellent in this study, which was consistent with previous results [22]. In addition, the wild A. eriantha samples in this study were divided into four categories by cluster analysis, and the clustering results may reflect the differences in fruit traits among different cultivars (lines) to a certain extent. Both principal component analysis and systematic cluster analysis indicated that M28 and M10 had excellent comprehensive traits, and could be used as breeding materials for continuous observation and evaluation.
Soluble sugar is an important component of fruit flavor quality and nutritional composition. The accumulation of sugar components in fruits has various types. For example, glucose content was the highest, followed by fructose and sucrose content being the lowest in A. eriantha ‘White’ after harvest [39]. The sucrose content of A. chinensis ‘Hort16A’ was the highest during the fruit ripening process, followed by fructose and glucose [40], while the A. deliciosa ‘Hayward’ mainly contained fructose and glucose, followed by sucrose in the later stage of fruit development [41]. Previous studies on pear [42], peach [43], wolfberry [44] and other fruits showed that the accumulation of soluble sugar components in fruits of different cultivated varieties was different to some extent. In this study, the results of the detection of soluble sugar components in the fruits for different varieties (lines) of wild A. eriantha at the soft ripe stage showed that the accumulation and composition of sugar components in the fruits of different varieties (lines) were not consistent. For example, M6, M7 and M8 mainly accumulated sucrose, followed by fructose and glucose; M10, M11 and M20 mainly accumulated fructose, followed by glucose and sucrose; and M13 mainly accumulated glucose, followed by fructose and sucrose (Figure 3).
Sucrose is an important nutrient element in fruit, and is also the main factor affecting fruit quality. The dynamic changes in sucrose content that occur during the fruit development in A. eriantha ‘Ganlv 1’ have been detected in previous research [30]. In this study, the changes in sucrose content for different varieties (lines) of wild A. eriantha were invested at the soft ripening stage. The results showed that M8 and M7 had the highest sucrose content, followed by M12, CK, M20 and M13. Sucrose content is closely related to the activity of sucrose-related metabolic enzymes. For example, the difference in SS enzyme activity during pear fruit development leads to differences in sucrose content among different cultivars of pear [42]. The activities of SS and SPS enzymes played a key role in sucrose accumulation in peach fruits [45]. Sucrose metabolism in apple fruit was mainly regulated by VIN and SS [46]. The activities of major enzymes (VIN, NI, SPS, SS and CWIN) involved in sucrose metabolism were examined in this study, and the results showed that these enzymes all had the highest activity in M8. Except for VIN, the enzyme activities of other enzymes in M7 were higher. The higher sucrose metabolism enzyme activity may be related to the high sucrose content of these two varieties. In addition, the activity of the SS enzyme was much higher than that of other enzymes, indicating that the SS enzyme may be an important enzyme in sucrose metabolism.
The expression levels of sucrose metabolism-related genes in different varieties (lines) of wild A. eriantha had certain differences. Previous studies have shown that kiwifruit begin to accumulate large amounts of sucrose, glucose and fructose at the late stage of fruit development. During this process, sugar metabolism-related enzyme genes showed different expression patterns [29,30,47]. This study examined the expression of sucrose metabolism-related enzyme genes in different wild A. eriantha cultivars (lines) at the soft ripening stage. The results showed that the expression patterns of sucrose metabolism-related enzyme genes were different in different varieties (lines). For example, the VIN3 gene was expressed at higher levels in M6 and M10, while the VIN5 gene was expressed at higher levels in M20 and M11. The expression levels of NIN1 and NIN2 in M10 were both high, while the expression level of NIN3 in M30 was high. The SPS1 gene was highly expressed in CK and M10, SPS was highly expressed in M20, CK and M10, and SPS5 was highly expressed in M6 and M7. The four SS genes (SS1, SS2, SS4 and SS5) had similar expression patterns, and all had higher expression levels in M20, M11 and M8. The expression level of CWIN1 was higher in M12 and M20, while the expression levels of CWIN3 and CWIN4 were higher in M11 and M20. The differences in gene expression levels of sucrose metabolism-related enzymes may be one of the reasons for the differences in sucrose accumulation in different wild A. eriantha fruits. The sucrose metabolism-related enzyme genes usually exist as gene families [28,29], but this study only analyzed the expression of some members of the gene family. Therefore, the expression patterns of all family members should be detected in future research, so that it is possible to identify the key genes affecting sucrose metabolism. In addition, the level of fruit sucrose accumulation involves the synergy of multiple pathways such as sucrose cleavage, resynthesis and transport [43]. In view of this, systematic identification and analysis of these pathway genes will improve the comprehensive understanding of sucrose metabolism in A. eriantha.

5. Conclusions

In conclusion, through the study of the fruit quality indexes for different varieties (lines) of wild A. eriantha at the soft ripening stage, it was found that the fruit quality of wild A. eriantha germplasm had rich diversity, and there were certain differences in fruit quality of different varieties (lines). The samples M10 and M28 with outstanding comprehensive characters were identified by principal component and comprehensive evaluation analyses, and these two samples were suitable for preservation for further research as high-quality wild planting resources. The contents of soluble sugar and the three main soluble sugar components (fructose, glucose and sucrose) were different among different varieties (lines) of wild A. eriantha. The detection of sucrose metabolism-related enzyme activity showed that the SS enzyme had higher activity, and may play an important role in sucrose metabolism. Different varieties (lines) of wild A. eriantha had different expression patterns of sucrose metabolism-related enzyme genes. The results of this study are of great significance to understanding fruit quality variation, soluble sugar accumulation characteristics, sucrose metabolism-related enzyme activity changes and related gene expression characteristics of wild A. eriantha resources at the soft ripening stage. These findings provide references for the analysis of fruit quality and identification of excellent germplasms of wild A. eriantha resources.

Author Contributions

Conceptualization, J.T. and C.H.; methodology, J.T. and C.H.; software, J.T., M.W. and X.J.; validation, M.W., W.Z., X.J. and S.C.; formal analysis, J.T., M.W. and X.J.; investigation, D.J. and X.J.; resources, X.J., S.C. and D.J.; data curation, M.W., W.Z. and X.J.; writing—original draft preparation, J.T.; writing—review and editing, J.T. and C.H.; visualization, J.T., X.J. and H.J.; supervision, C.H.; project administration, C.H.; funding acquisition, C.H. and J.T. All authors have read and agreed to the published version of the manuscript.

Funding

This research was funded by the National Natural Science Foundation of China, grant numbers 31960588 and 31760567, and the Science and Technology Research Project of the Education Department of Jiangxi Province (GJJ210403).

Institutional Review Board Statement

Not applicable.

Informed Consent Statement

Not applicable.

Data Availability Statement

The data presented in this study are available on request from the corresponding author.

Conflicts of Interest

The authors declare no conflict of interest.

References

  1. Huang, H.W. Actinidia Germplasm Resources in China; China Forestry Publishing House: Beijing, China, 2013. [Google Scholar]
  2. Huang, H.W. The Genus Actinidia, a World Monograph; Science Press: Beijing, China, 2014. [Google Scholar]
  3. Atkinson, R.G.; Sharma, N.N.; Hallett, I.C.; Johnston, S.L.; Schröder, R. Actinidia eriantha: A parental species for breeding kiwifruit with novel peelability and health attributes. N. Z. J. For. Sci. 2009, 39, 207–216. Available online: https://www.researchgate.net/publication/285686139 (accessed on 20 June 2022).
  4. Zhong, C.H.; Zhang, P.; Jiang, Z.W.; Wang, S.M.; Han, F.; Xu, L.Y.; Huang, H.W. Dynamic changes of carbohydrate and vitamin C in fruit of Actinidia chinensis and A. eriantha during growing season. Plant Sci. J. 2011, 29, 370–376. [Google Scholar] [CrossRef]
  5. Xu, H.S.; Wu, Y.W.; Xu, S.F.; Sun, H.X.; Chen, F.Y.; Yao, L. Antitumor and immunomodulatory activity of polysaccharides from the roots of Actinidia eriantha. J. Ethnopharmacol. 2009, 125, 310–317. [Google Scholar] [CrossRef]
  6. Du, J.; Chen, X.F.; Wang, C.Y.; Sun, H.X. Pathway analysis of global gene expression change in dendritic cells induced by the polysaccharide from the roots of Actinidia eriantha. J. Ethnopharmacol. 2018, 214, 141–152. [Google Scholar] [CrossRef]
  7. Wang, Z.P.; Liu, Y.F.; Li, L.; Li, D.W.; Zhang, Q.; Guo, Y.T.; Wang, S.B.; Zhong, C.H.; Huang, H.W. Whole transcriptome sequencing of Pseudomonas syringae pv. actinidiae-infected kiwifruit plants reveals species-specific interaction between long non-coding RNA and coding genes. Sci. Rep. 2017, 7, 491. [Google Scholar] [CrossRef]
  8. Wang, Z.M.; Zhang, Q.Y.; Liu, X.M. Observed the adaptability and resistibility of Actinidia chinensis and A. eriantha. J. Fruit Sci. 1996, 13, 29–30. [Google Scholar] [CrossRef]
  9. Zhong, M.; Zhang, W.B.; Zou, L.F.; Huang, Q.; Chen, L.; Huang, C.H.; Tao, J.J.; Xu, X.B. Diurnal variation of photosynthesis and chlorophyll fluore-scence characteristics in kiwifruit under high temperature condition. Acta Agric. Univ. Jiangxiensis 2018, 40, 472–478. [Google Scholar] [CrossRef]
  10. Wang, F.M.; Mo, Q.H.; Ye, K.Y.; Gong, H.J.; Qi, B.B.; Liu, P.P.; Jiang, Q.S.; Li, J.W. Evaluation of the wild Actinidia germplasm for resistance to Pseudomonas syringae pv. actinidiae. Plant Pathol. 2020, 69, 979–989. [Google Scholar] [CrossRef]
  11. Guo, R.; Zhang, Y.H.; Zhang, H.J.; Landis, J.B.; Zhang, X.; Wang, H.C.; Yao, X.H. Molecular phylogeography and species distribution modelling evidence of ‘oceanic’ adaptation for Actinidia eriantha with a refugium along the oceanic-continental gradient in a biodiversity hotspot. BMC Plant Biol. 2022, 22, 89. [Google Scholar] [CrossRef]
  12. Liu, Y.F.; Liu, Y.L.; Huang, H.W. Genetic variation and natural hybridization among sympatric Actinidia species and the implications for introgression breeding of kiwifruit. Tree Genet. Genomes 2010, 6, 801–813. [Google Scholar] [CrossRef]
  13. Guo, R.; Landis, J.B.; Moore, M.J.; Meng, A.; Jian, S.; Yao, X.; Wang, H. Development and application of transcriptome-derived microsatellites in Actinidia eriantha (Actinidiaceae). Front. Plant Sci. 2017, 8, 1383. [Google Scholar] [CrossRef] [PubMed] [Green Version]
  14. Tang, J.L.; Huang, C.H.; Wu, H.; Lang, B.B.; Qu, X.Y.; Xu, X.B. Genetic diversity of wild Actinidia eriantha germplasm based on fruit traits and SSR markers. Acta Hortic. Sin. 2014, 41, 1198–1206. [Google Scholar] [CrossRef]
  15. Qu, X.Y.; Lang, B.B.; Zhong, M.; Zhu, B.; Tao, J.J.; Huang, C.H.; Xu, X.B. Principal component analysis and comprehensive evaluation of fruit quality of Actinidia eriantha. Chin. Agric. Sci. Bull. 2016, 32, 92–96. [Google Scholar] [CrossRef]
  16. Lang, B.B.; Zhu, B.; Xie, M.; Zhang, W.B.; Seyrek, U.A.; Huang, C.H.; Xu, X.B. Variation and probability grading of the main quantitative characteristics of wild Actinidia eriantha germplasm resources. J. Fruit Sci. 2016, 33, 8–15. [Google Scholar] [CrossRef]
  17. Wang, Y.Z.; Pan, Z.M. Comprehensive evaluation of 22 Actinidia eriantha germplasm resources based on principal components analysis. Acta Agric. Zhejiangensis 2021, 33, 825–830. [Google Scholar] [CrossRef]
  18. He, Y.; Li, Z.Y.; Liao, G.L.; Chen, L.; Zhong, M.; Huang, C.H.; Jia, D.F.; Qu, X.Y.; Xu, X.B. Variation in fruit quality within wild Actinidia eriantha germplasm. N. Z. J. Crop Hortic. Sci. 2020, 48, 153–163. [Google Scholar] [CrossRef]
  19. Jo, Y.S.; Cho, H.S.; Park, M.Y.; Bang, G.P. Selection of a sweet Actinidia eriantha, “Bidan”. Acta Hortic. 2007, 753, 253–258. [Google Scholar] [CrossRef]
  20. Xie, M.; Wu, Y.J.; Jiang, G.H.; Zhang, Q.Z.; Zhang, H.Q.; Peng, S.L.; Liu, K.M. A new big fruit Actinidia eriantha Benth. cultivar “White”. Acta Hortic. Sin. 2008, 35, 1555. [Google Scholar] [CrossRef]
  21. Xu, X.B.; Huang, C.H.; Qu, X.Y.; Chen, M.; Zhong, M.; Lang, B.B.; Chen, C.J.; Xie, M.; Zhang, W.B. A new easy peeling Actinidia eriantha cultivar “Ganmi 6”. Acta Hortic. Sin. 2015, 42, 2539–2540. [Google Scholar] [CrossRef]
  22. Xu, X.B.; Liao, G.L.; Huang, C.H.; Zhong, M.; Jia, D.F.; Qu, X.Y.; Liu, Q.; He, Y.Q.; Li, Y.Q. Differences of sucrose accumulation concentration and related genes expression between two sucrose accumulation types of Actinidia eriantha. Sci. Rep. 2020, 10, 20474. [Google Scholar] [CrossRef]
  23. MacRae, E.; Quick, W.P.; Benker, C.; Stitt, M. Carbohydrate metabolism during postharvest ripening in kiwifruit. Planta 1992, 188, 314–323. [Google Scholar] [CrossRef] [PubMed]
  24. Yao, D.Y.; Gonzales-Vigil, E.; Mansfield, S.D. Arabidopsis sucrose synthase localization indicates a primary role in sucrose translocation in phloem. J. Exp. Bot. 2020, 71, 1858–1869. [Google Scholar] [CrossRef] [PubMed]
  25. Chen, C.; Yuan, Y.L.; Zhang, C.; Li, H.X.; Ma, F.W.; Li, M.J. Sucrose phloem unloading follows an apoplastic pathway with high sucrose synthase in Actinidia fruit. Plant Sci. 2017, 255, 40–50. [Google Scholar] [CrossRef]
  26. Klages, K.; Donnison, H.; Boldingh, H.; Macrae, E. myo-Inositol is the major sugar in Actinidia arguta during early fruit development. Funct. Plant Biol. 1998, 25, 61–68. [Google Scholar] [CrossRef]
  27. Ruan, Y.L. Sucrose metabolism: Gateway to diverse carbon use and sugar signaling. Annu. Rev. Plant Biol. 2014, 65, 33–67. [Google Scholar] [CrossRef]
  28. Chen, C.; Wang, Y.; Yang, Y.; Yan, Y.Q. Identification of Sucrose Synthase Gene Family in Kiwifruit and Their Expression during Fruit Development. Mol. Plant Breed. 2021. Available online: http://kns.cnki.net/kcms/detail/46.1068.S.20210422.1703.010.html (accessed on 17 April 2022).
  29. Liao, G.L.; Li, Y.Q.; Wang, H.L.; Liu, Q.; Zhong, M.; Jia, D.F.; Huang, C.H.; Xu, X.B. Genome-wide identification and expression profiling analysis of sucrose synthase (SUS) and sucrose phosphate synthase (SPS) genes family in Actinidia chinensis and A. eriantha. BMC Plant Biol. 2022, 22, 215. [Google Scholar] [CrossRef]
  30. Tao, J.J.; Wu, M.T.; Jiao, X.D.; Chen, S.S.; Jia, D.F.; Xu, X.B.; Huang, C.H. Dynamic changes of fruit physiological quality and sugar components during fruit growth and development of Actinidia eriantha. Horticulturae 2022, 8, 529. [Google Scholar] [CrossRef]
  31. Cao, J.K.; Jiang, W.B.; Zhao, Y.M. Experiment Guidance of Postharvest Physiology and Biochemistry of Fruits and Vegetables; China Light Industry Press: Beijing, China, 2007. [Google Scholar]
  32. Yue, J.Y.; Liu, J.C.; Tang, W.; Wu, Y.Q.; Tang, X.F.; Li, W.; Yang, Y.; Wang, L.H.; Huang, S.X.; Fang, C.B.; et al. Kiwifruit Genome Database (KGD): A comprehensive resource for kiwifruit genomics. Hortic. Res. 2020, 7, 117. [Google Scholar] [CrossRef]
  33. Liu, K.P.; Huang, C.H.; Leng, J.H.; Chen, k.; Yan, Y.P.; Gu, Q.Q.; Xu, X.B. Principal component analysis and comprehensive evaluation of the fruit quality of ‘Jinkui’ kiwifruit. J. Fruit Sci. 2012, 29, 867–871. [Google Scholar] [CrossRef]
  34. Wu, Y.J.; Xie, M.; Zhang, Q.C.; Jiang, G.H.; Zhang, H.Q.; Long, Q.J.; Han, W.J.; Chen, J.W.; Shong, G.H. Characteristics of ‘White’: A new easy-peel cultivar of Actinidia eriantha. N. Z. J. Crop Hortic. Sci. 2009, 37, 369–373. [Google Scholar] [CrossRef]
  35. Cheng, B.X.; Yu, C.; Fu, H.L.; Zhou, L.J.; Luo, L.; Pan, H.T.; Zhang, Q.X. Evaluation of the morphological diversity of tea roses (Rosa x odorata) based on phenotypic traits. Plant Genet. Resour. 2020, 18, 149–158. [Google Scholar] [CrossRef]
  36. Tang, Q.Y. DPS Data Processing System: Experimental Design, Statistical Analysis and Data Mining; Science Press: Beijing, China, 2010. [Google Scholar]
  37. Melgarejo-Sánchez, P.; Martínez, J.J.; Legua, P.; Martínez, R.; Hernández, F.; Melgarejo, P. Quality, antioxidant activity and total phenols of six Spanish pomegranates clones. Sci. Hortic. 2015, 182, 65–72. [Google Scholar] [CrossRef]
  38. Byeon, S.E.; Lee, J. Differential responses of fruit quality and major targeted metabolites in three different cultivars of cold-stored figs (Ficus carica L.). Sci. Hortic. 2020, 260, 108877. [Google Scholar] [CrossRef]
  39. Qi, W.Y.; Zhou, C.H.; Song, L.J.; Zhong, Y.; Zheng, X.L. Study on sugar metabolism of Actinidia eriantha Benth ‘White’ during storage. J. Fruit Sci. 2016, 33, 744–751. [Google Scholar] [CrossRef]
  40. Richardson, A.C.; Boldingh, H.L.; McAtee, P.A.; Gunaseelan, K.; Luo, Z.; Atkinson, R.G.; David, K.M.; Burdon, J.N.; Schaffer, R.J. Fruit development of the diploid kiwifruit, Actinidia chinensis “Hort16A”. BMC Plant Biol. 2011, 11, 182. [Google Scholar] [CrossRef] [PubMed]
  41. Moscatello, S.; Famiani, F.; Proietti, S.; Farinelli, D.; Battistelli, A. Sucrose synthase dominates carbohydrate metabolism and relative growth rate in growing kiwifruit (Actinidia deliciosa, cv Hayward). Sci. Hortic. 2011, 128, 197–205. [Google Scholar] [CrossRef]
  42. Wang, D.F.; Yang, Z.J.; Sun, J.M.; Cao, Y.F.; Huang, X.S.; Zhang, S.L.; Wu, J. Difference in soluble sugar accumulation and related enzyme activity of fruits among different pear cultivars. J. Fruit Sci. 2014, 31, 30–38. [Google Scholar] [CrossRef]
  43. Vimolmangkang, S.; Zheng, H.Y.; Peng, Q.; Jiang, Q.; Wang, H.L.; Fang, T.; Liao, L.; Wang, L.; He, H.P.; Han, Y.P. Assessment of sugar components and genes involved in the regulation of sucrose accumulation in peach fruit. J. Agric. Food Chem. 2016, 64, 6723–6729. [Google Scholar] [CrossRef]
  44. Zheng, G.Q.; Zheng, Z.Y.; Xu, X.; Hu, Z.H. Variation in fruit sugar composition of Lycium barbarum L. and Lycium chinense Mill. of different regions and varieties. Biochem. Syst. Ecol. 2010, 38, 275–284. [Google Scholar] [CrossRef]
  45. Lombardo, V.A.; Osorio, S.; Borsani, J.; Lauxmann, M.A.; Bustamante, C.A.; Budde, C.O.; Andreo, C.S.; Lara, M.V.; Fernie, A.R.; Drincovich, M.F. Metabolic profiling during peach fruit development and ripening reveals the metabolic networks that underpin each developmental stage. Plant Physiol. 2011, 157, 1696–1710. [Google Scholar] [CrossRef]
  46. Wang, Y.Z.; Zhang, D.P. A study on the relationships between acid invertase, sucrose synthase and sucrose metabolism in ‘Red Fuji’ apple fruit. Acta Hortic. Sin. 2001, 28, 259–261. [Google Scholar] [CrossRef]
  47. Zhang, H.Q.; Xie, M.; Zhang, C.; Yang, L.Q.; Zhang, Z.; Xiao, J.P.; Zhou, L.Q. Difference in starch accumulation and characterization of sugar metabolism during fruit development of kiwifruit. Sci. Agric. Sin. 2014, 47, 3453–3464. [Google Scholar] [CrossRef]
Figure 1. Changes in soluble solid content (a) and dry matter content (b) in wild A. eriantha varieties (lines) at the ripening stage. The different letters in each figure indicate significant differences (p < 0.05), and the same letters indicate no significant difference (p > 0.05).
Horticulturae 08 00824 g001
Figure 2. Changes in titratable acid content (a) and ascorbic acid (b) content in wild A. eriantha varieties (lines) at the ripening stage. The different letters in each figure indicate significant differences (p < 0.05), and the same letters indicate no significant difference (p > 0.05).
Horticulturae 08 00824 g002
Figure 3. Changes in soluble sugar components (a) and the proportion of sugar components (b) in wild A. eriantha varieties (lines) at the ripening stage. The different letters shown in (a) indicate significant differences (p < 0.05), and the same letters indicate no significant difference (p > 0.05).
Horticulturae 08 00824 g003
Figure 4. Cluster analysis of fruit quality for wild A. eriantha samples.
Horticulturae 08 00824 g004
Figure 5. Changes in sucrose metabolism-related enzyme activities in wild A. eriantha of different varieties (lines) at the ripening stage, including VIN (a), NI (b), SPS (c), SS (d) and CWIN (e). The different letters in each figure indicate significant differences (p < 0.05), and the same letters indicate no significant difference (p > 0.05).
Horticulturae 08 00824 g005
Figure 6. Expression analysis of sucrose metabolism-related enzyme genes in wild A. eriantha of different varieties (lines) at the soft ripening stage, including VIN3 (a), VIN5 (b), NIN1 (c), NIN2 (d), NIN3 (e), SPS1 (f), SPS2 (g) and SPS5 (h). The different letters in each figure indicate significant differences (p < 0.05), and the same letters indicate no significant difference (p > 0.05).
Horticulturae 08 00824 g006
Figure 7. Expression analysis of sucrose metabolism-related enzyme genes in wild A. eriantha of different varieties (lines) at the soft ripening stage, including SS1 (a), SS2 (b), SS4 (c), SS5 (d), CWIN1 (e), CWIN3 (f) and CWIN4 (g). The different letters in each figure indicate significant difference (p < 0.05), and the same letters indicate no significant difference (p > 0.05).
Horticulturae 08 00824 g007
Table 1. Fruit appearance quality indexes of wild A. eriantha of different varieties (lines).
VarietyLongitudinal (mm)Transverse Diameter (mm)Lateral Diameter (mm)Single Fruit Weight (g)Fruit Shape Index
M636.11 g24.41 c22.11 def11.15 f1.48 g
M744.50 e25.17 c23.85 cd15.06 d1.77 e
M833.75 h20.2 e19.05 f7.37 g1.68 ef
M1055.08 b26.51 b24.69 bcd23.34 b2.08 b
M1149.67 c28.83 a26.66 abc22.50 b1.72 e
M1250.38 c29.16 a26.94 ab21.82 b1.73 e
M1346.87 d26.64 b29.01 a19.64 c1.76 e
M2040.59 f25.39 bc22.86 de13.80 de1.6 f
M2856.09 b23.09 d21.89 def17.67 c2.43 a
M3040.90 f21.92 d20.70 ef12.04 ef1.87 d
CK58.37 a29.37 a28.19 a30.00 a1.99 c
Note: the different letters in each column indicate significant differences (p < 0.05), and the same letters indicate no significant difference (p > 0.05).
Table 2. The variation analysis of fruit quality indexes of wild A. eriantha.
Quality IndexMinimum ValueMaximum ValueAverage ValueStandard DeviationCoefficient of Variation (%)
Longitudinal (mm)33.7558.3746.578.2017.61
Transverse diameter (mm)20.229.3725.523.0011.76
Lateral diameter (mm)19.0529.0124.183.2113.28
Single fruit weight (g)7.3730.0017.676.5637.13
Fruit shape index1.482.431.830.2614.21
Dry matter (%)12.7519.2715.202.1213.95
Soluble solids content (%)7.1216.3111.252.6223.29
Titratable acid content (%)0.681.251.050.1615.24
AsA (mg/g)4.477.705.850.9816.75
Fructose (mg/g)12.12116.8152.0229.6256.94
Glucose (mg/g)8.7063.5337.6914.6838.95
Sucrose (mg/g)13.1371.5335.2719.1454.27
Table 3. Principal component analysis of fruit quality for different wild A. eriantha varieties (lines).
Quality IndexFactor 1Factor 2Factor 3Factor 4Factor 5Factor 6Factor 7Factor 8Factor 9
Fruit weight0.8310.2260.002−0.090.2380.376−0.1880.0680.109
Fruit shape index0.770.301−0.0030.359−0.353−0.1370.067−0.1350.145
Dry matter0.674−0.303−0.4640.070.313−0.2570.1250.2280.042
Soluble solids content0.741−0.339−0.430.1690.1020.1720.083−0.24−0.133
Titratable acid−0.738−0.004−0.320.428−0.1330.3110.1740.1590.026
AsA−0.0460.8870.115−0.0870.3290.0030.28−0.06−0.022
Fructose0.6950.2410.5280.326−0.103−0.011−0.0550.19−0.156
Glucose0.449−0.5290.543−0.302−0.1560.1420.2910.0380.037
Sucrose−0.361−0.3960.5790.4250.425−0.033−0.019−0.1050.061
Eigenvalues3.6491.631.4260.7390.6310.3740.2590.210.083
Contribution rate (%)40.54318.10715.8418.2157.0134.1552.8762.3280.922
Cumulative contribution rate (%)40.54358.6574.49182.70689.71993.87496.7599.078100
Table 4. The principal component scores, comprehensive scores and ranking of fruit quality for wild A. eriantha.
Varieties (Lines)Factor 1Factor 2Factor 3Comprehensive ScoreRank
M280.7661.8090.3350.9281
M101.617−0.8140.7860.8502
CK1.659−0.394−0.8310.6303
M8−0.0931.0090.0220.1994
M12−0.1310.3870.4600.1205
M13−0.0420.0190.1940.0236
M11−0.1830.3480.061−0.0027
M20−0.977−1.1271.870−0.4088
M30−0.095−0.946−1.976−0.7019
M6−1.6021.005−0.672−0.77110
M7−0.920−1.296−0.249−0.86911
Publisher’s Note: MDPI stays neutral with regard to jurisdictional claims in published maps and institutional affiliations.

