1. Introduction
Lettuce (
Lactuca sativa L.) is one of the most commonly grown and important food crops in the United States and around the world. Lettuce is the 10th ranked produced vegetable by weight, with a total of 29 million tons harvested worldwide. Within the United States, lettuce is the third most consumed fresh vegetable [
1,
2]. Lettuce contains a high number of key dietary vitamins and minerals, including fiber, vitamins A, C, K, calcium, magnesium, iron, and zinc [
3].
The growth of many greenhouse crops given optimal fertilizer, light, and water are limited by atmospheric carbon dioxide (CO
2). Increasing the CO
2 concentration ambient concentrations allows for increased productivity in many greenhouse crops including lettuce, tomatoes, cucumbers, and roses [
4,
5]. An increase in harvestable fresh weight of 19% for tomatoes and 29% to 40% for lettuce has been demonstrated with CO
2 enrichment [
6,
7]. Not only can yields be improved, an additional energy and carbon footprint saving can be achieved. Greenhouses can be maintained at a lower temperature while supplementing CO
2 with the potential of increasing lettuce weight, while reducing heating requirements [
8]. Supplemental CO
2 also allows a grower to reach the same yield with a lower daily light integral (DLI) target. As lettuce is best grown with a DLI of 17 mol·m
−2·day
−1 under ambient CO
2 conditions, supplementing CO
2 up to 1600 ppm reduces the need for lighting while maintaining yield with as little as 11 mol·m
−2·day
−1 [
9]. However, the impacts on plant nutrition were not evaluated [
9]. Since supplemental lighting is often used in greenhouses to maintain production, supplementing CO
2 further reduces the amount of energy needed for healthy, productive plants. The CO
2 supplementation can increase the crop yield and lower the energy demands, allowing for a more profitable and energy-efficient solution for growers.
Plants regulate intercellular CO
2 at high concentrations, mainly by controlling the aperture of their stomata. With increased carbon dioxide, the stomata exhibit reduced gas exchange, which in turn can decrease transpiration rate. Decreases in transpiration due to increased carbon dioxide concentrations can thereby decrease levels of mineral uptake, and increase water-use efficiency, and leaf temperature [
4].
While CO
2 enrichment increases the productivity of many crops, it is also known that carbon dioxide affects the protein and micronutrient concentrations in many agricultural crops. Rice grown under elevated CO
2 had lower concentrations of iron and zinc within the edible portion of rice plants, in comparison to plants grown under ambient CO
2 concentrations [
10]. For Indian mustard, the seeds contained a lower concentration of protein, calcium, zinc, iron, magnesium, and sulfur under elevated CO
2 [
11]. Wild goldenrod pollen exhibited decreases in protein content over time due to increasing atmospheric CO
2 [
12]. For lettuce, increased CO
2 has been shown to increase amino acid content [
13]. Increasing CO
2 from ambient to 800 ppm reduced chlorophyll, nitrogen, and phosphorus concentration in hydroponically grown lettuce [
7]. More work is needed for lettuce to determine the effects on mineral nutrient content at multiple CO
2 concentrations.
Despite the increases in overall biomass, less is known about the impact of increased concentrations of CO
2 on carotenoid content. In tomatoes, no differences were observed in the carotenoids, β-carotene, or lycopene, under various concentrations of CO
2 [
14]. Flavonoid glycosides and chlorogenic acid concentrations generally increased in lettuce under higher CO
2 concentration [
15,
16]. The overall impact of CO
2 on carotenoids and anthocyanins, bioactive compounds of importance to human health, is not well characterized.
Lettuce is an excellent source of vitamins, minerals, dietary fiber, and antioxidant compounds [
17]. Carotenoids and anthocyanins stand out among the most important nutritional compounds available with lettuce and other leafy greens [
3,
18]. Carotenoids are divided into oxygen-containing compounds called xanthophylls and oxygen-free compounds known as carotenes [
19]. Lutein and zeaxanthin are xanthophylls that when consumed become concentrated within the fovea centralis within the eyes. These compounds play an important role for humans in preventing photo-oxidative stress, protecting the retina of the eye from damage caused by blue light absorption via quenching of excited triplet states of photosensitizers and singlet oxygen [
20]. Regular consumption of lutein and zeaxanthin is associated with the prevention of age-related macular degeneration (AMD) disease. Mammals cannot synthesize xanthophylls and therefore, to prevent ocular diseases, the recommended consumption of lutein and zeaxanthin is 6 to 20 mg per day, respectively [
21,
22].
Within plants, the xanthophylls participate in non-photochemical quenching, a mechanism shielding photosystems from intense light by conversion of excess energy into heat [
23]. Three different compounds participate in the xanthophyll cycle, violaxanthin, antheraxanthin, and zeaxanthin. Violaxanthin is converted to antheraxanthin, then to zeaxanthin in environments with high light intensity. The overall level of irradiance will determine the ratio of violaxanthin to zeaxanthin. High xanthophyll concentrations are generally associated with plants growing in high light; however, they are necessary in shaded plants as sun flecks can induce high light stress which would elicit de-epoxidation to zeaxanthin in understory crops [
4]. Currently there is no information in the literature on the xanthophyll responses of lettuce to CO
2 concentration.
Red leaf lettuce can add a different color to salads in comparison to traditional leafy greens. These plants obtain their distinct color through the production of anthocyanins [
24]. Anthocyanins play several key roles within plants. Anthocyanins protect leaves from UV damage, cold temperatures, and water stress [
25,
26]. They absorb ultraviolet radiation (UV) and protect plants from oxidative stress. They are also associated with ameliorating stressors including cold, heavy metals, desiccation, and wounds [
27]. Despite these advantages, plants must expend a metabolic cost in the production of anthocyanins [
26]. There is some evidence that anthocyanins may benefit human health as well [
28]. Anthocyanins are antioxidants and are thought to be involved in scavenging of free radicals and sequestering of metal ions [
29]. Anthocyanins are more chemically active than many other flavonoids and are easily degraded during thermal processing or storage of leafy greens [
30]. Under fluorescent and red: blue: white LED light, higher anthocyanin content in lettuce has been observed with increasing CO
2, although this was not evident under white LED light treatment [
31].
Understanding the impact of CO2 supplementation on the growth and nutritional content of crops within controlled environments will be useful for both growers and consumers. While lettuce is a common CEA crop that is routinely subject to enriched CO2, very little information is available in the literature on the impact of CO2 enrichment on the vitamin and nutrient content of leafy greens. The objective of this study was to determine the impact of elevated CO2 on yield and nutritional content (chlorophyll, xanthophyll, anthocyanin, and mineral elements) of selected lettuce plants.
2. Materials and Methods
2.1. Plant Materials and Growth Conditions
Two cultivars of lettuce plants, ‘Rex’ and ‘Rouxai’ were selected for this experiment. ‘Rex’, a green butterhead lettuce, was chosen as it is one of the most common cultivars of butterhead lettuce in CEA and ‘Rouxai’, a red oak leaf lettuce, was chosen for red pigmentation expression within the leaves. The plants were germinated in 1” rockwool cubes and watered with clear water in a glass greenhouse under ambient CO
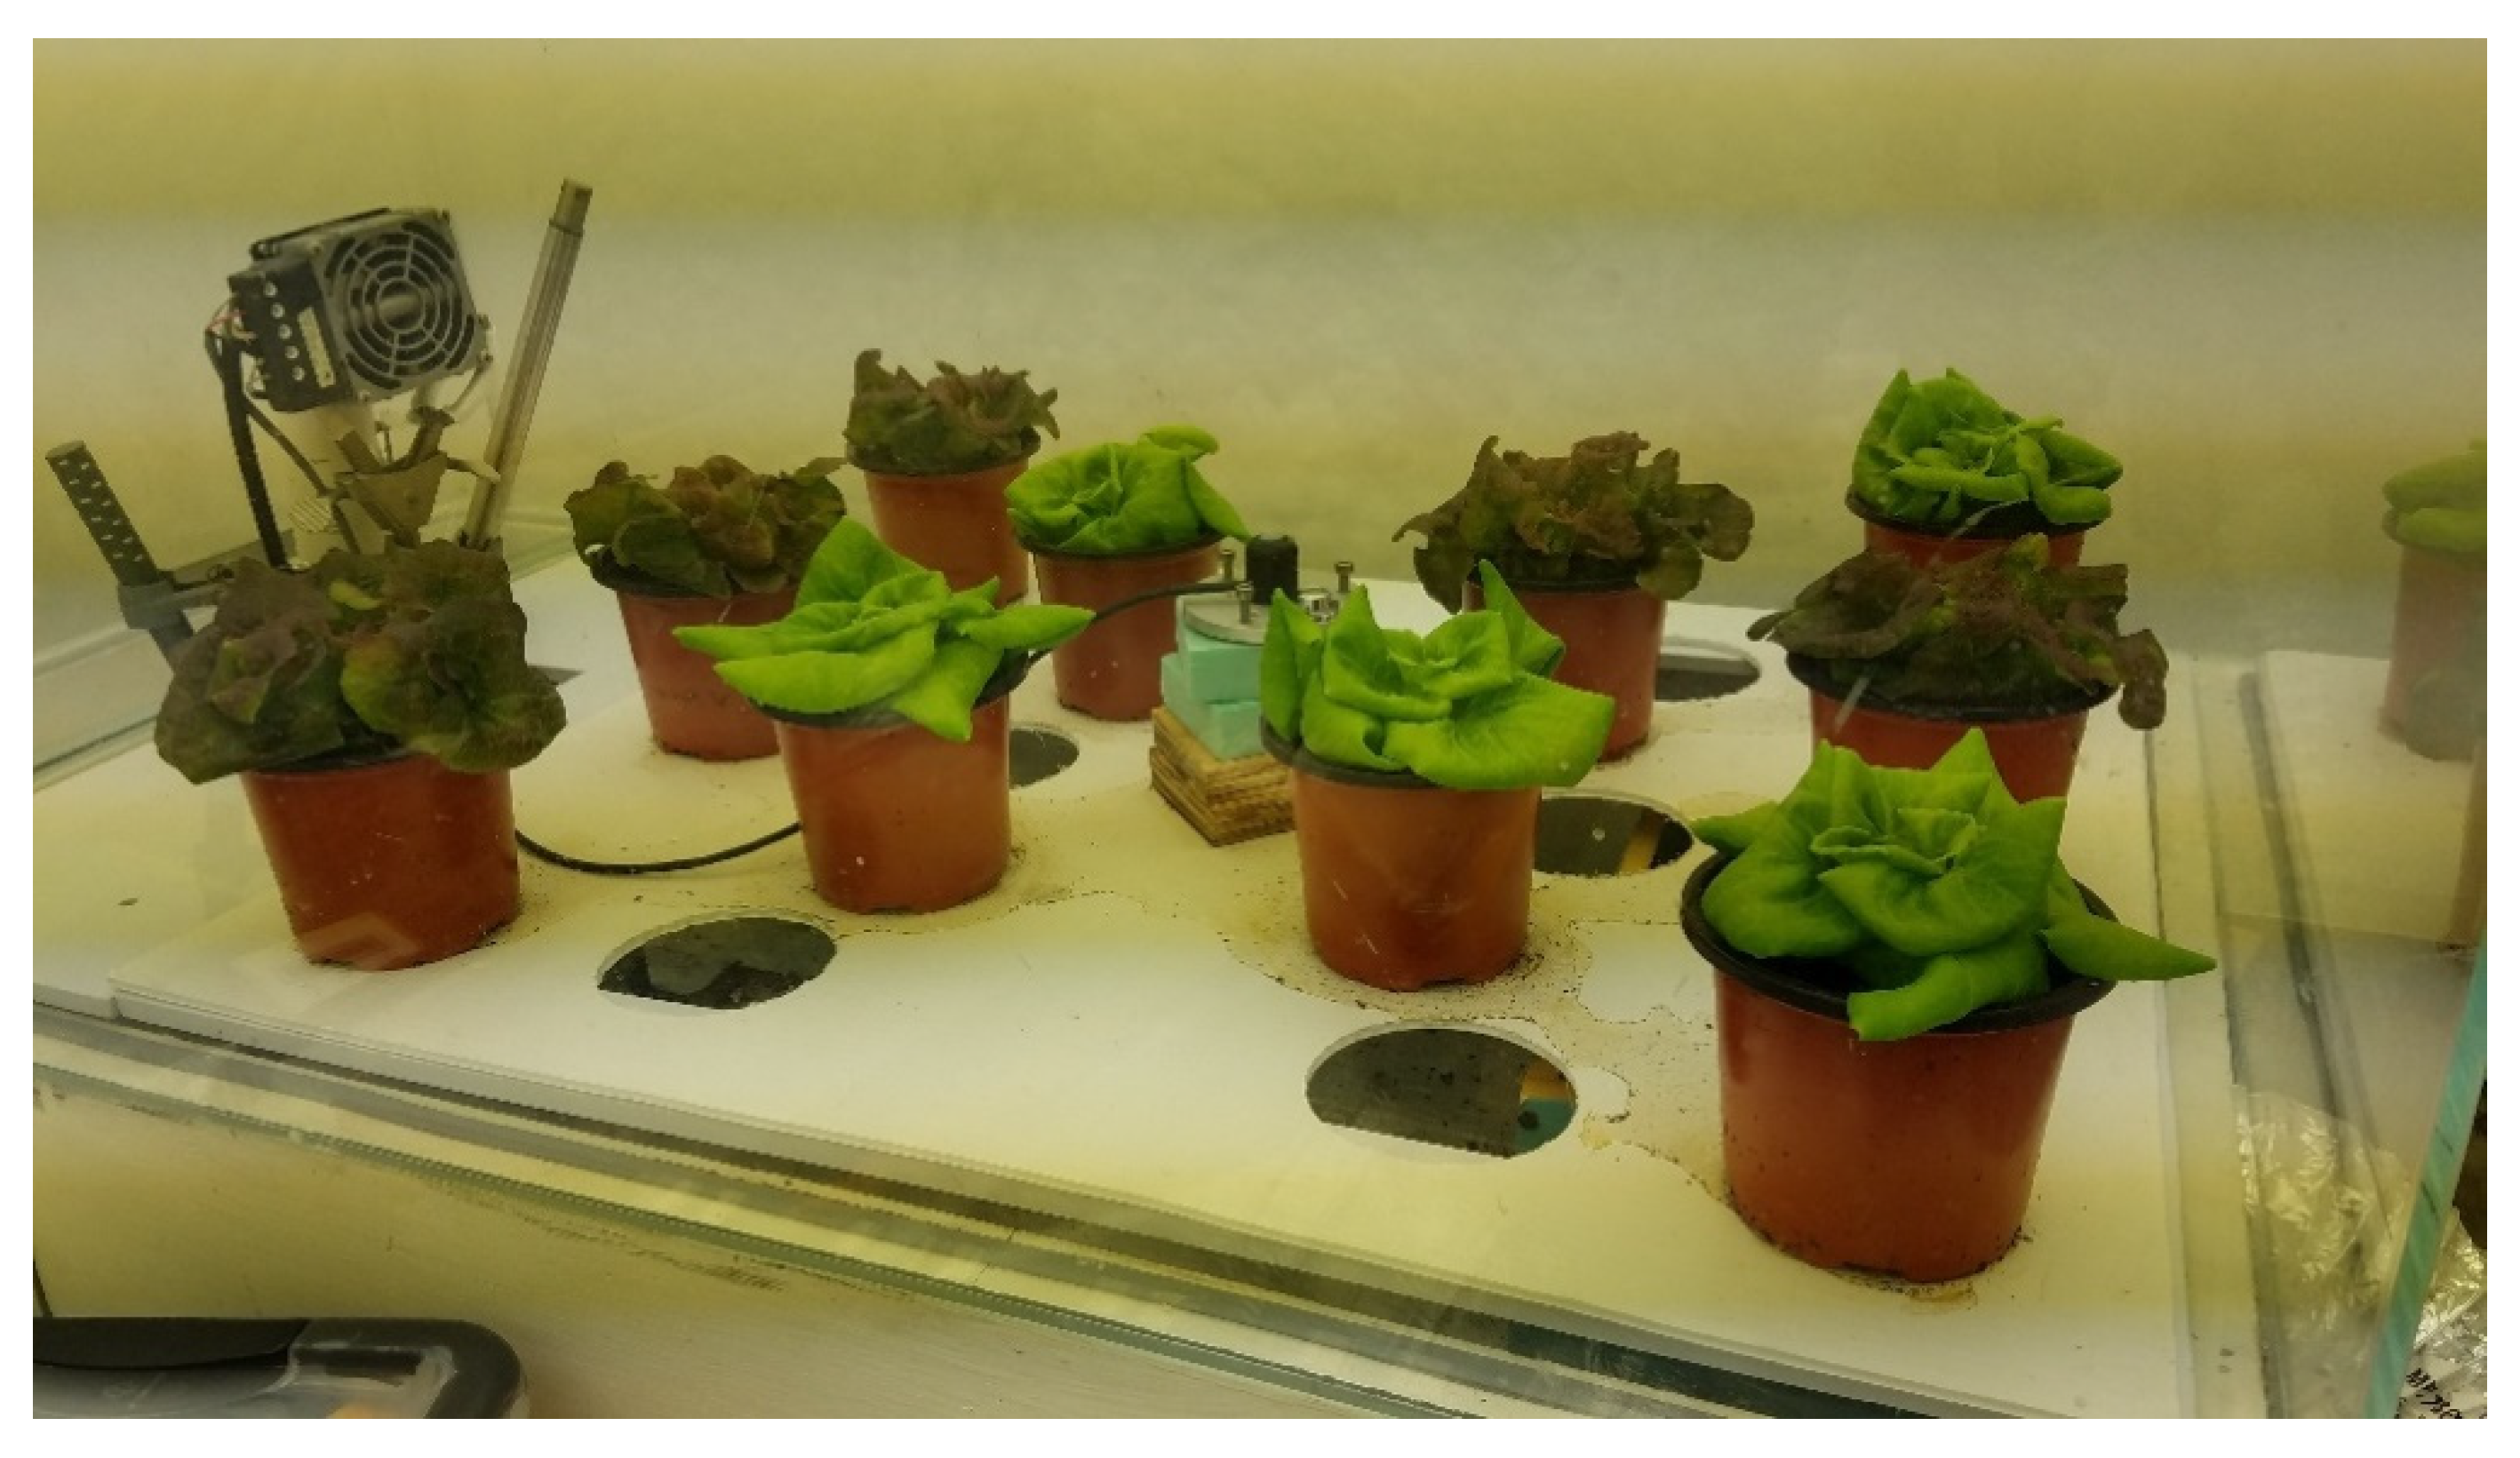
2 without supplemental lighting and temperature set points at 25 °C day/20 °C night for eight days. Plants were then transplanted to 3.5-inch pots with commercial potting mix (LM-111; Lamber Peat Mass, Rivière-Ouelle, QC, Canada) and placed into four acrylic controlled atmosphere chambers (CACs) (100 cm × 68 cm × 46 cm L × W × H) contained within two larger walk-in growth chambers (M1 Walk-in; Environmental Growth Chambers, Chagrin Falls, OH, USA), resulting in two CACs in each walk-in growth chamber (
Figure 1). Plants were randomly placed onto ten equally spaced positions. Each chamber provided one of four treatments of CO
2 concentrations set to 400, 800, 1200, and 1600 ± 50 ppm. The temperature inside was maintained at 22.5 ± 0.5 °C using an electric radiator controlled by an Argus control system. Average light intensity of 250 µmol·m
−2·s
−1 with a duration of 17 h (DLI of 15.3 mol·m
−2·day
−1) was supplied using T5 High Output (HO) fluorescent bulbs (Philips Lighting Company, Amsterdam, Netherlands). Light intensity was measured at each plant location using a quantum sensor (LI-190R; LI-Cor Inc., Lincoln, NE, USA). A randomized complete block design was used, with CO
2 concentrations randomly assigned to each of the four CACs. Ten plants were grown in each chamber, five plants of each variety, that were randomly assigned within the chamber. The experiment was repeated for a total of 4 crop cycles (with CO
2 treatment randomized by chamber for each crop cycle).
Plants were fertigated daily (or as needed) with liquid fertilizer (Jack’s 5-12-26 Part A, J.R. Peter’s Inc., Allentown, PA, USA and YaraLiva Calcium Nitrate, Yala International ASA, Oslo, Norway) and buffered with 1M sulfuric acid to achieve an electrical conductivity (EC) of 1.8 mS/cm and pH of 5.8.
Plants were grown for three weeks in chambers before harvest (
Figure 2). Prior to destructive harvest, the lettuce height to tallest leaf, and two diameters taken perpendicular to one another were taken to calculate volume. Volume was calculated assuming a cylindrical shape with the following equation:
where
V = volume (cm
3);
dave = average diameter (cm); and
h = height (cm).
Plants were then cut at the substrate surface and weighed for fresh weight. A subset of plants was cut in half and flash frozen in liquid nitrogen for anthocyanin, xanthophyll, and chlorophyll analysis (n = 3 samples, per block per replicated crop cycle). Plants were then dried for 48 h at 70 °C and weighed to determine dry weight. For the plants that were sampled for nutritional content, the plants were reweighed after sampling, then dried and total plant dry weight was adjusted based on percent removed during sampling. Mineral nutrient analysis was conducted by a commercial laboratory using dry ashing and ICP-MS measurement (J.R. Peter’s Laboratory, Allentown, NJ, USA).
2.2. Carotenoids and Total Anthocyanin Determination
To analyze chlorophyll and xanthophylls, after gathering fresh weight measurements and plant morphology data, the lettuce heads were cut in half and immediately frozen using liquid nitrogen. Plants were ground and homogenized using a mortar and pestle under liquid nitrogen. Two replicate samples of the powdered plant material weighing 50 mg each were placed into 1.5 mL polypropylene microcentrifuge tubes (VWR International, Radnor, PA, USA). The extraction solvent was comprised of 80% acetone and 20% deionized (DI) water and 1000 µL of solution was added to the centrifuge tubes and vortexed. Samples were vortexed until solid material was white and stored at 4 °C. Samples were centrifuged at 14,800 RPM for 5 min at 4 °C. Supernatant was filtered through a 0.45 µm nylon syringe filter (VWR International, Radnor, PA, USA). Afterwards, 600 µL of supernatant was taken and combined with 900 µL of extraction solvent to bring the total volume to 1.5 mL.
Samples were then analyzed using a High-Performance Liquid Chromatograph (HPLC). The HPLC system consisted of a Prominence auto-sampler (SIL 20AC HT), UV–Vis detector (SPD-10A VP), two pump systems (LC-10AT VP), and SPD-10A detector (Shimadzu Scientific Instruments, Kyoto, Japan). The column used was a YMC C-30 Carotenoid column with a 4.6 × 250 mm I.D., 5 µm particle size (YMC America, Allentown, PA, USA). The mobile phase was composed of isocratic 81:15:4 (v/v/v) methanol: methyl tert-butyl ether (MTBE): and DI water. Flow rate was set at 1 mL·min−1 with a 30 µL injection volume. Detection wavelength for carotenoids and chlorophylls was 450 nm.
Concentration and retention time of plant pigments were determined using authentic external standards. Lutein and zeaxanthin standards were obtained from ChromaDex (Irvine, CA, USA). Chlorophyll a and b standards were purchased from Sigma Aldrich (St. Louis, MO, USA). Concentration of selected pigments was determined based on calibration curve of external standards using peak area method. All of the samples and pigment standards were analyzed twice using the HPLC system and average area values were used to obtain the unknown concentrations.
Frozen tissue, as described above, was used to determine anthocyanin concentrations. Plants were ground using a mortar and pestle in liquid nitrogen. Two replicate samples of the powdered plant material weighing 50 mg each were placed into 1.5 mL polypropylene microcentrifuge tubes (VWR International, Radnor, PA, USA). Next, 300 µL of acidified methanol (1% HCl) was placed in each of the centrifuge tubes. Samples were vortexed, then stored for at least 24 h at 4 °C. To each centrifuge tube, 200 µL of H
2O and 500 µL of chloroform were added and centrifuged at 12,000 RPM for 4 min. Then, 400 µL of the aqueous supernatant was taken and added to 2600 µL of acidified methanol in a quartz cuvette (1-cm path length). Absorbance at 530 and 675 nm wavelength was measured using Shimadzu UV 1800 UV Visible Scanning Spectrophotometer (Shimadzu Scientific Instruments, Kyoto, Japan) [
32].
2.3. Statistical Analysis
A linear mixed-effect model (package lmer, R, Version 1.3.959, Ames, IA, USA) was used to analyze the data. Random effects included replicate, treatment location, and replicate of light position. Fixed effects included variety, CO2 concentration, and light intensity at each plant position. Mean separations comparisons were conducted using Tukey HSD with an alpha = 0.05.
3. Results
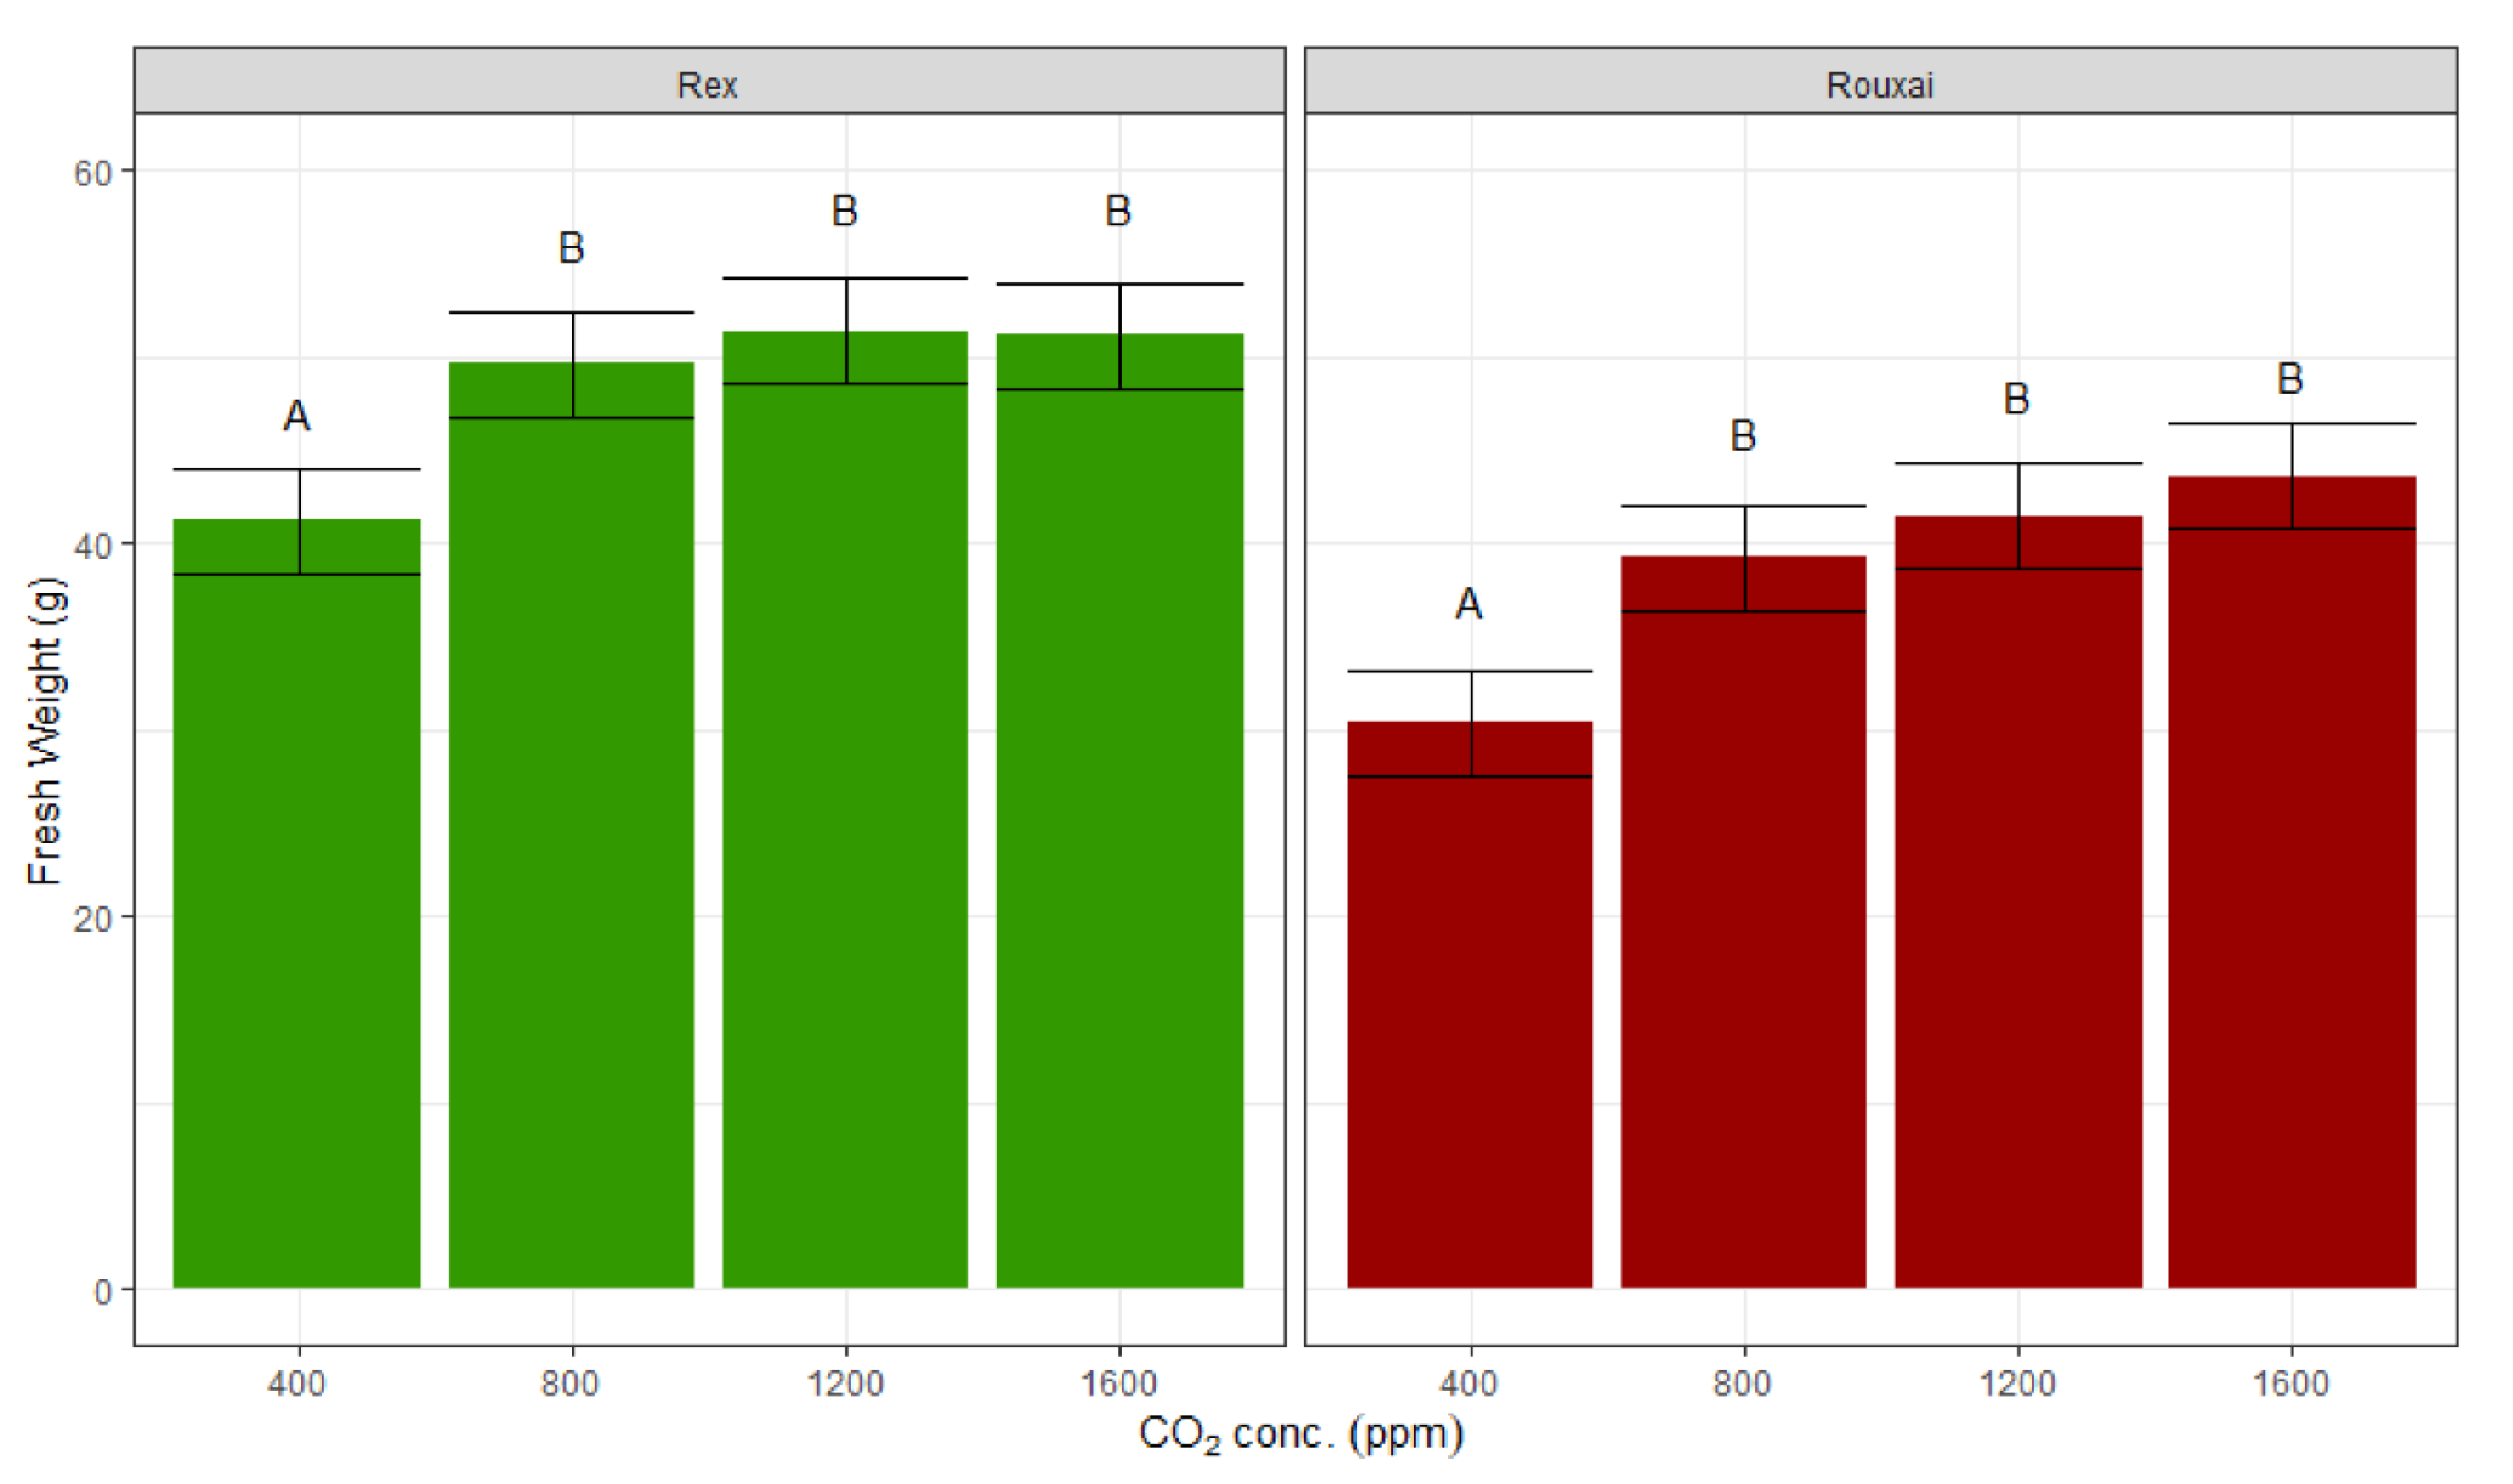
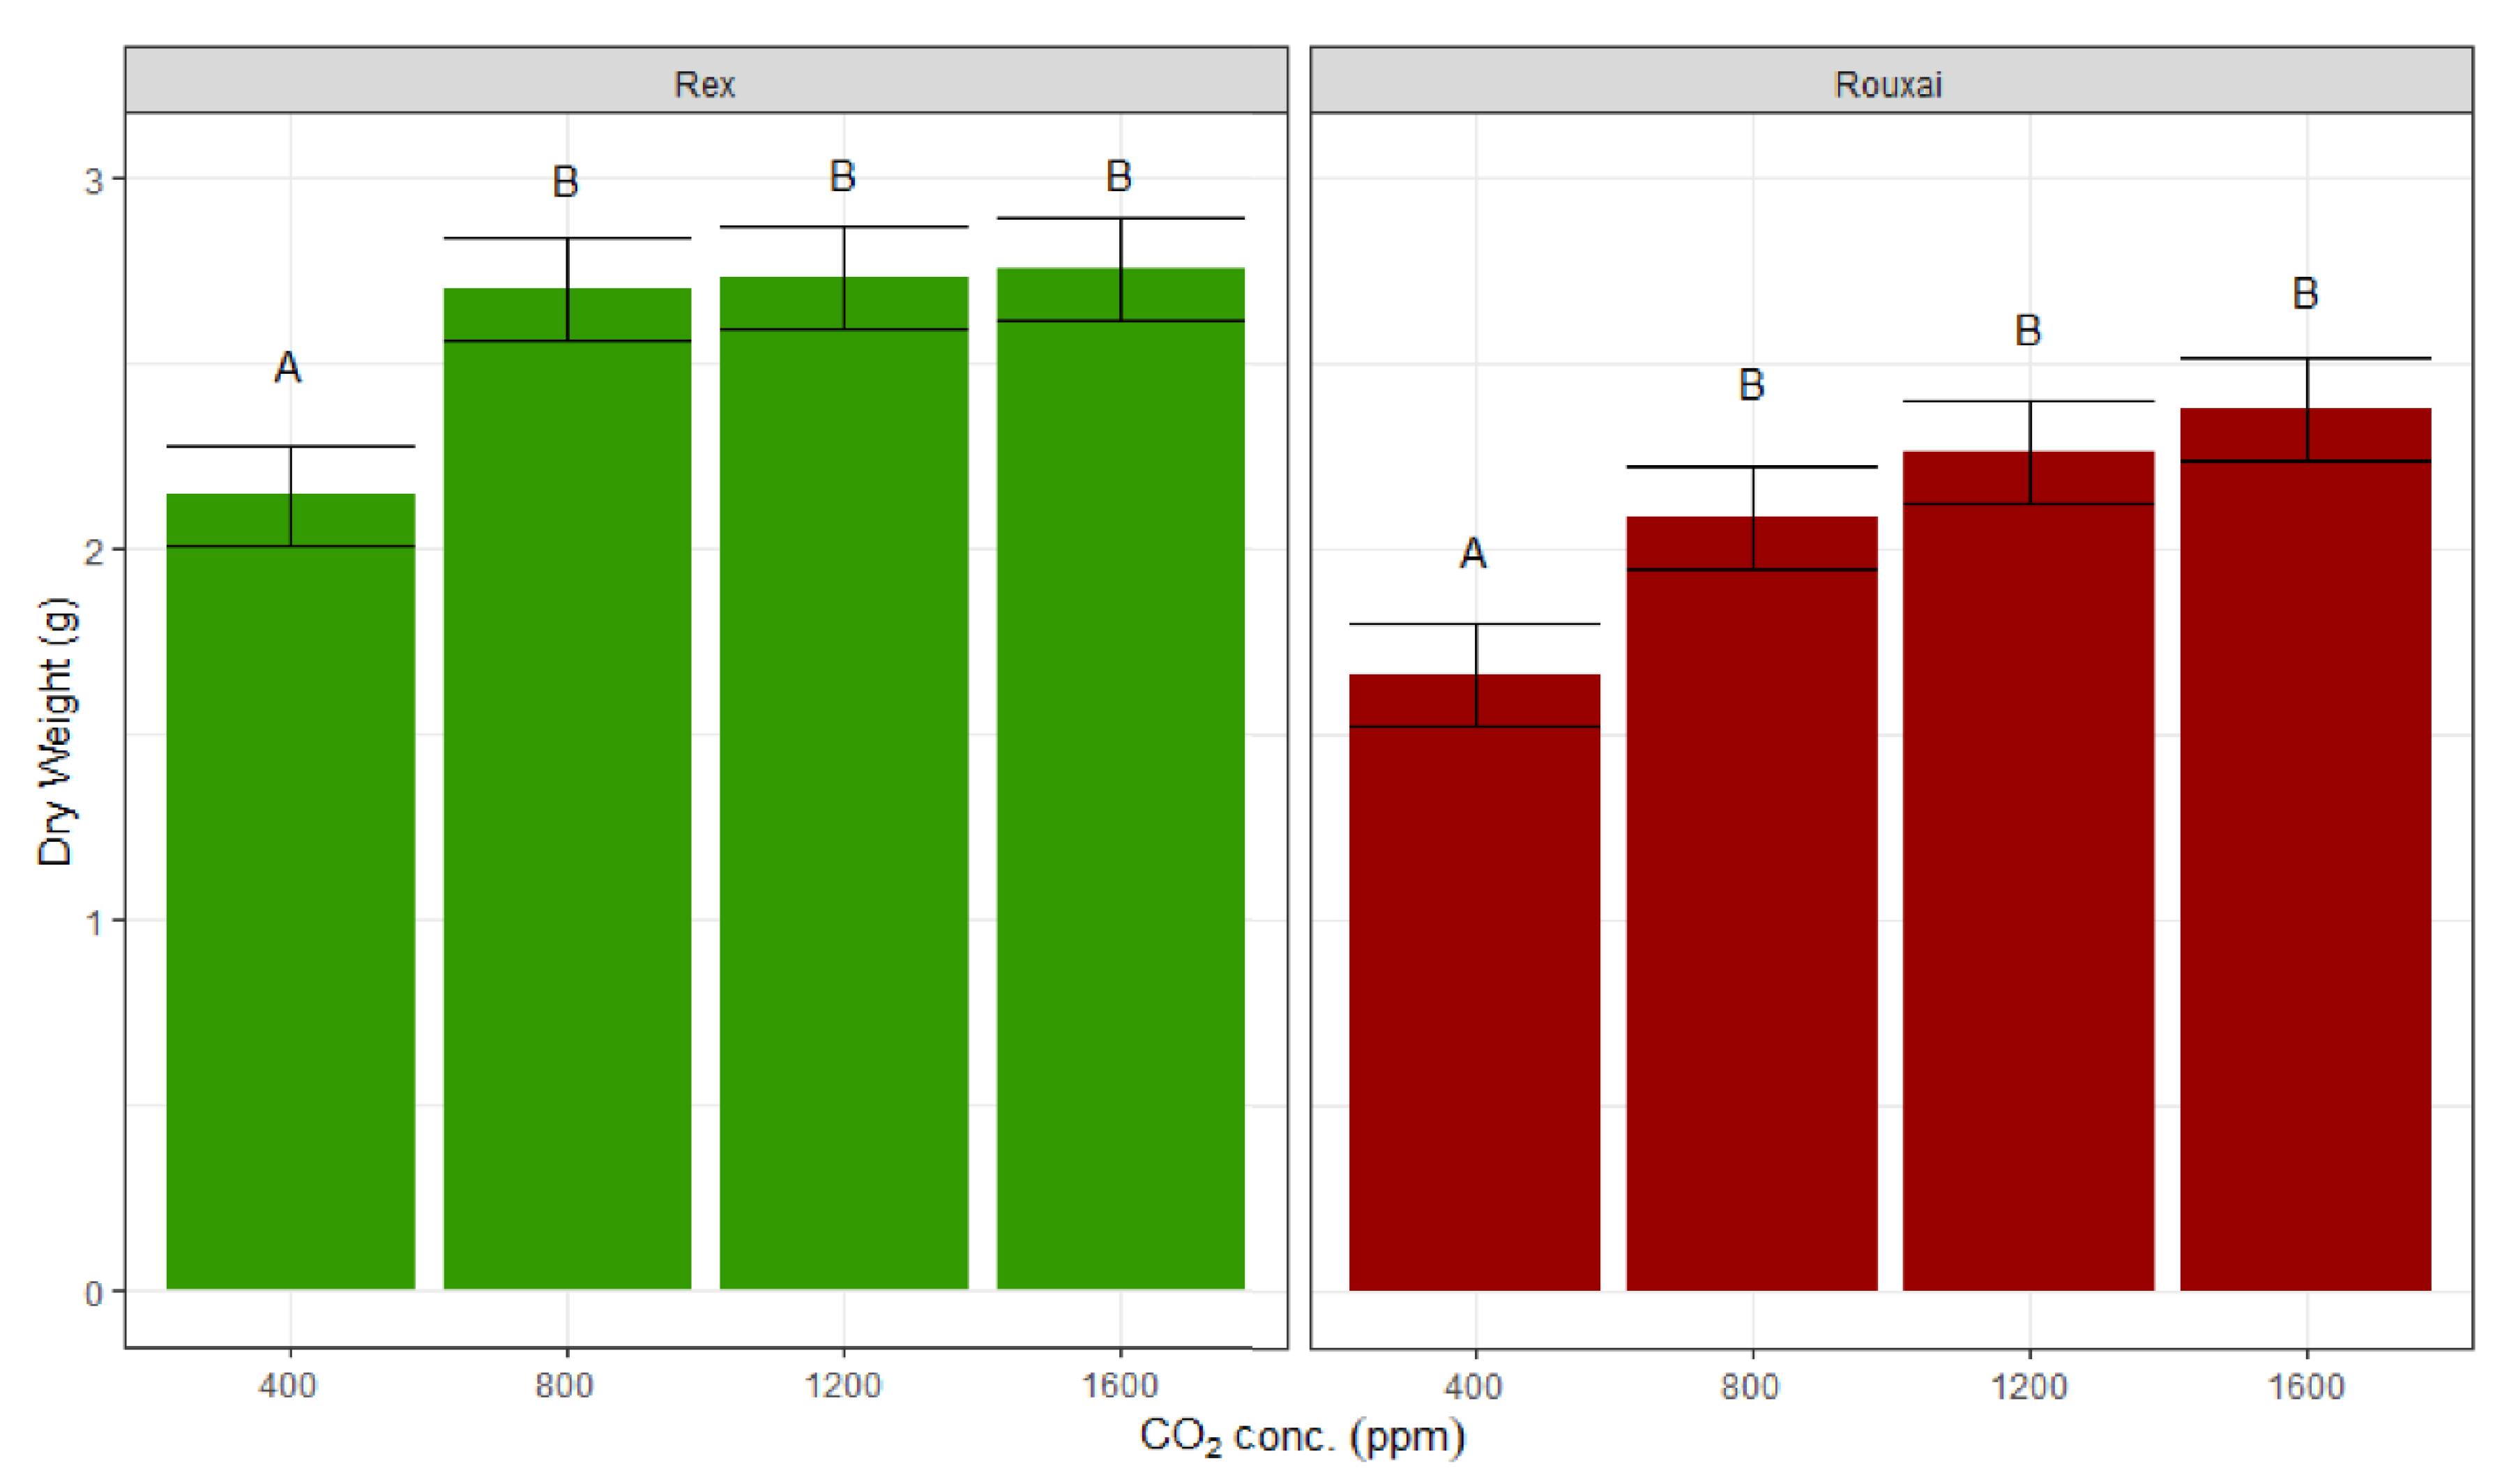
The lettuce biomass in terms of fresh and dry weight increased with a higher CO
2 concentration, with a large increase from 400 ppm to 800 ppm, and insignificant gains thereafter (
Figure 3 and
Figure 4). The lettuce fresh weight increased by 20% and 28% under CO
2 treatments of 800 ppm compared to 400 ppm for ‘Rex’ and ‘Rouxai’, respectively, but only an additional 3% and 11% increments were observed, when the CO
2 concentration increased from 800 to 1600 ppm for ‘Rex’ and ‘Rouxai’, respectively. Similarly, in terms of plant dry weight, the increase between 400 ppm to 800 ppm was 26% for both of the varieties, while the increase from 800 ppm to 1600 ppm was only 2% and 14% for ‘Rex’ and ‘Rouxai’, respectively.
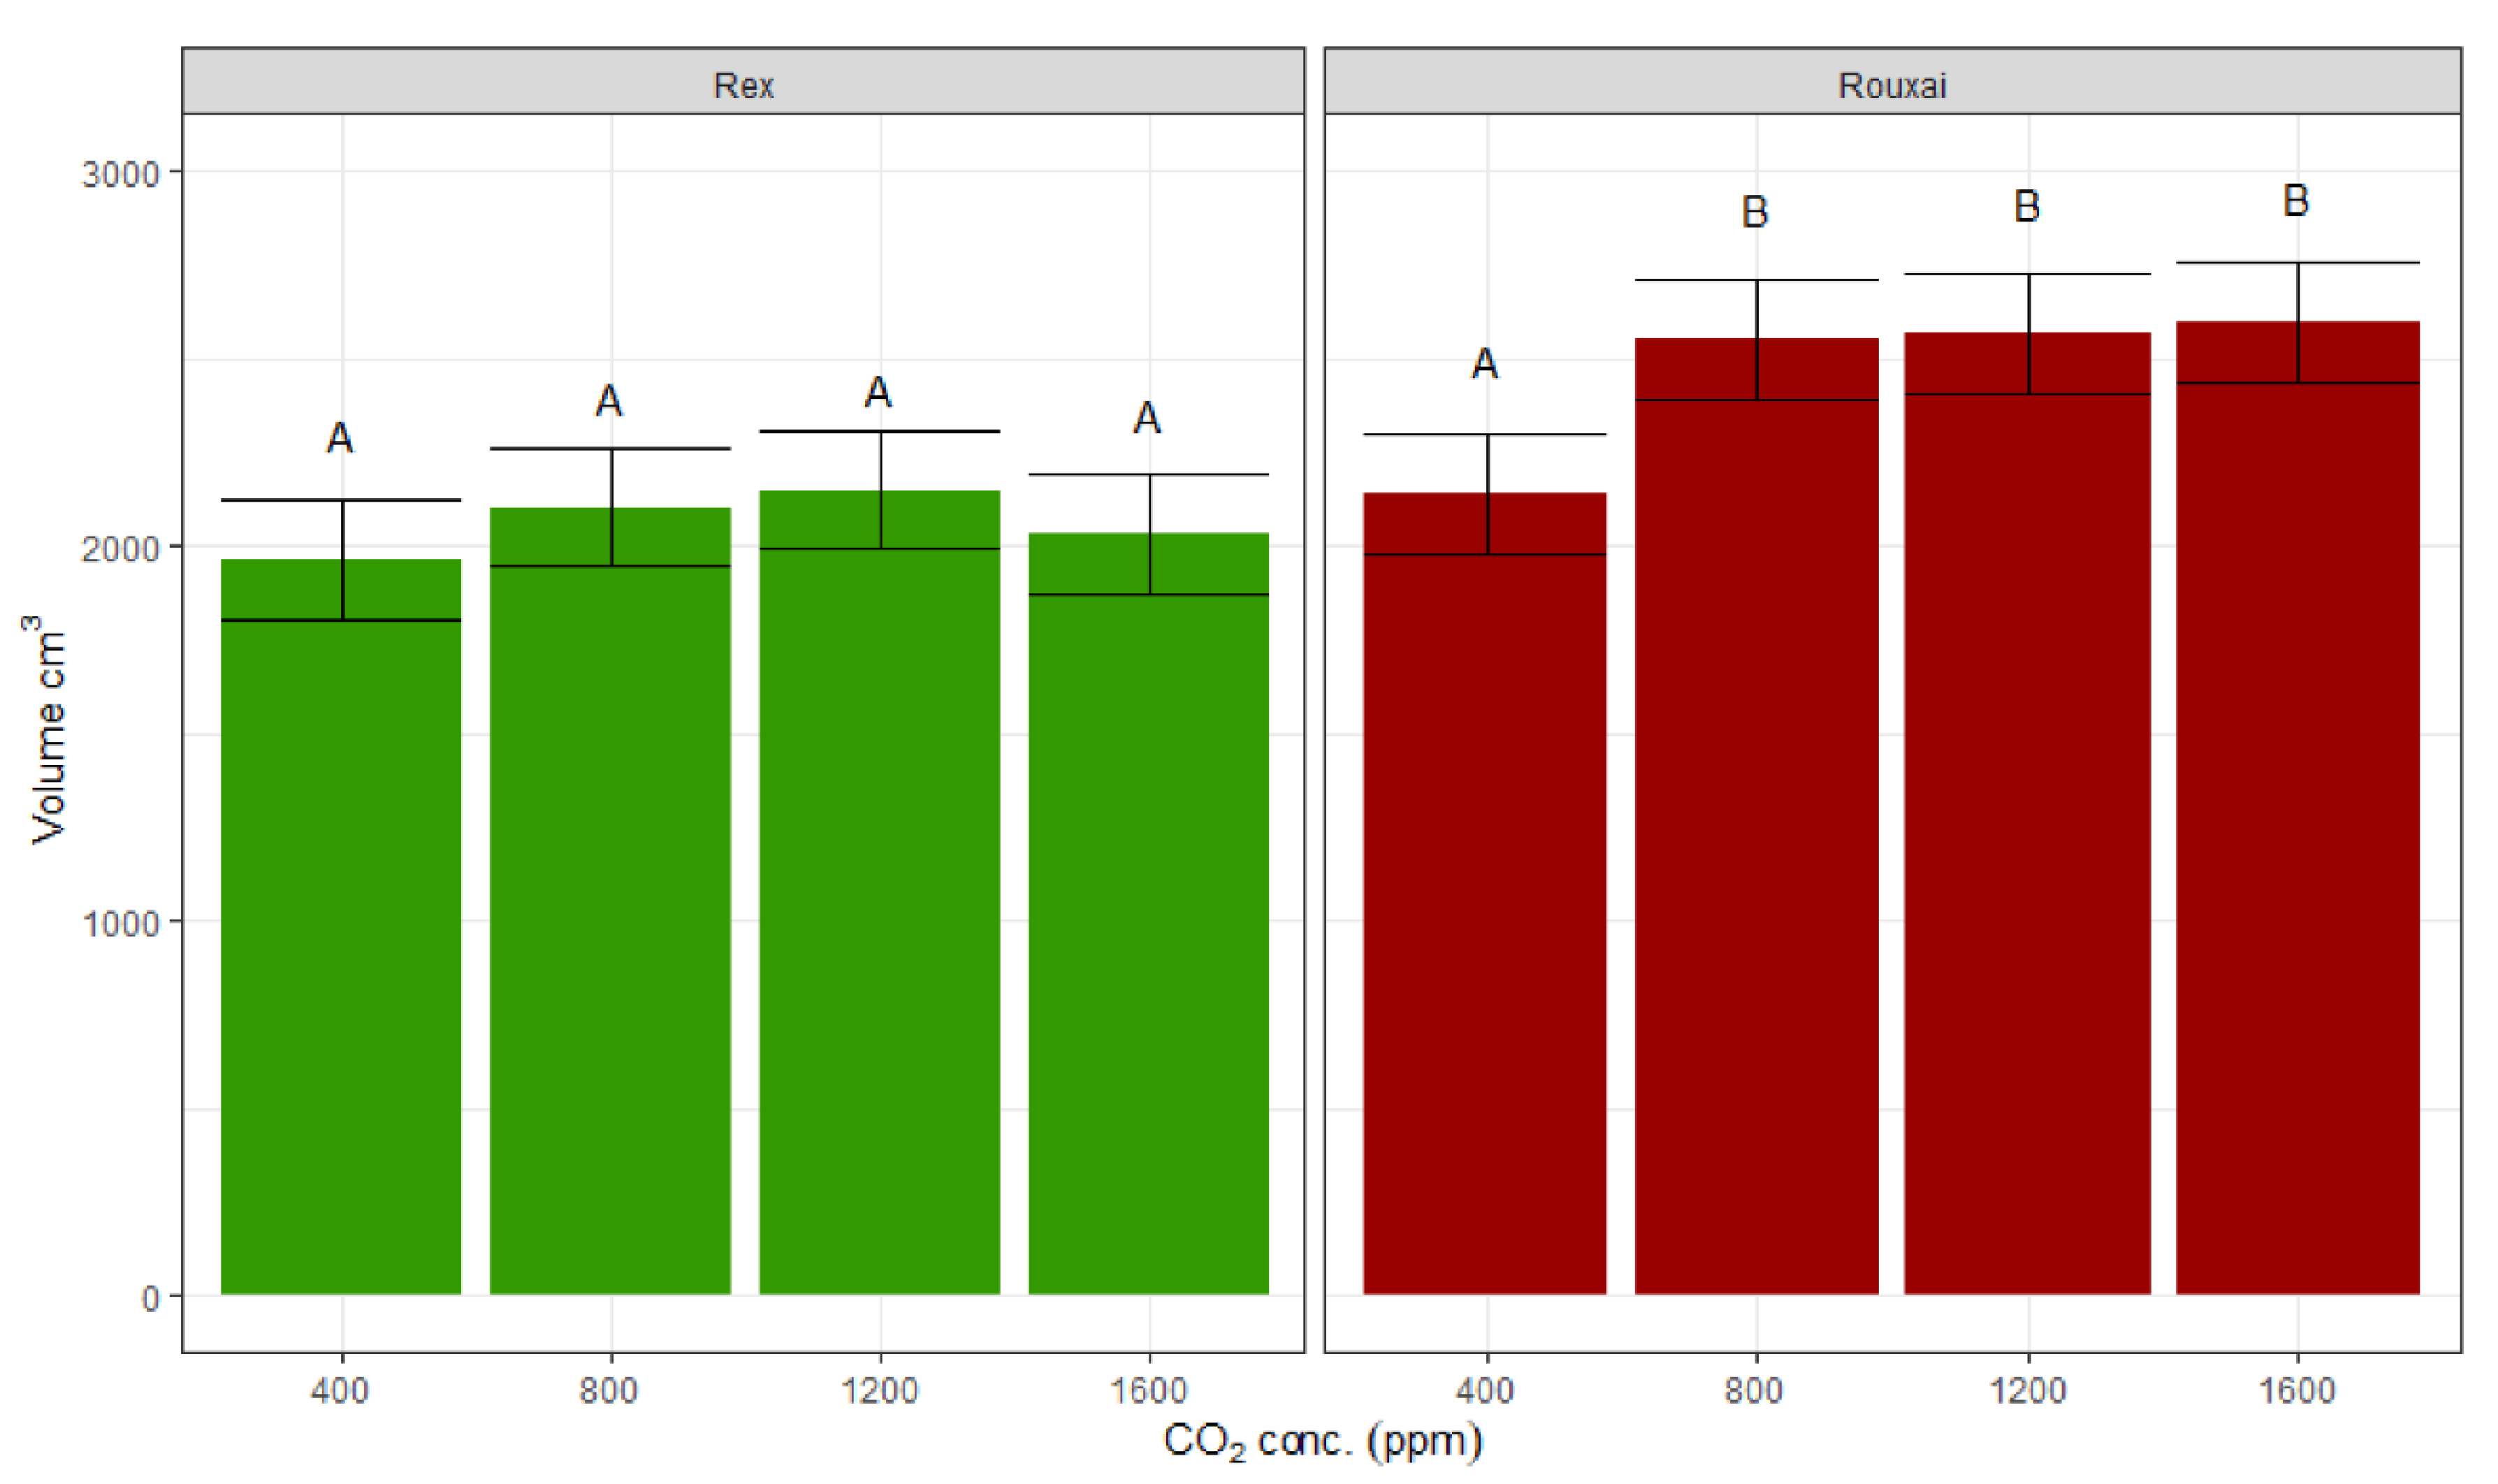
The lettuce volume increased 17% for ‘Rouxai’ between 400 ppm and all higher concentrations of CO
2, but was not significantly different between 800 ppm, 1200 ppm, and 1600 ppm. For ‘Rex’, there was no significant differences between volumes under any CO
2 treatments (
Figure 5).
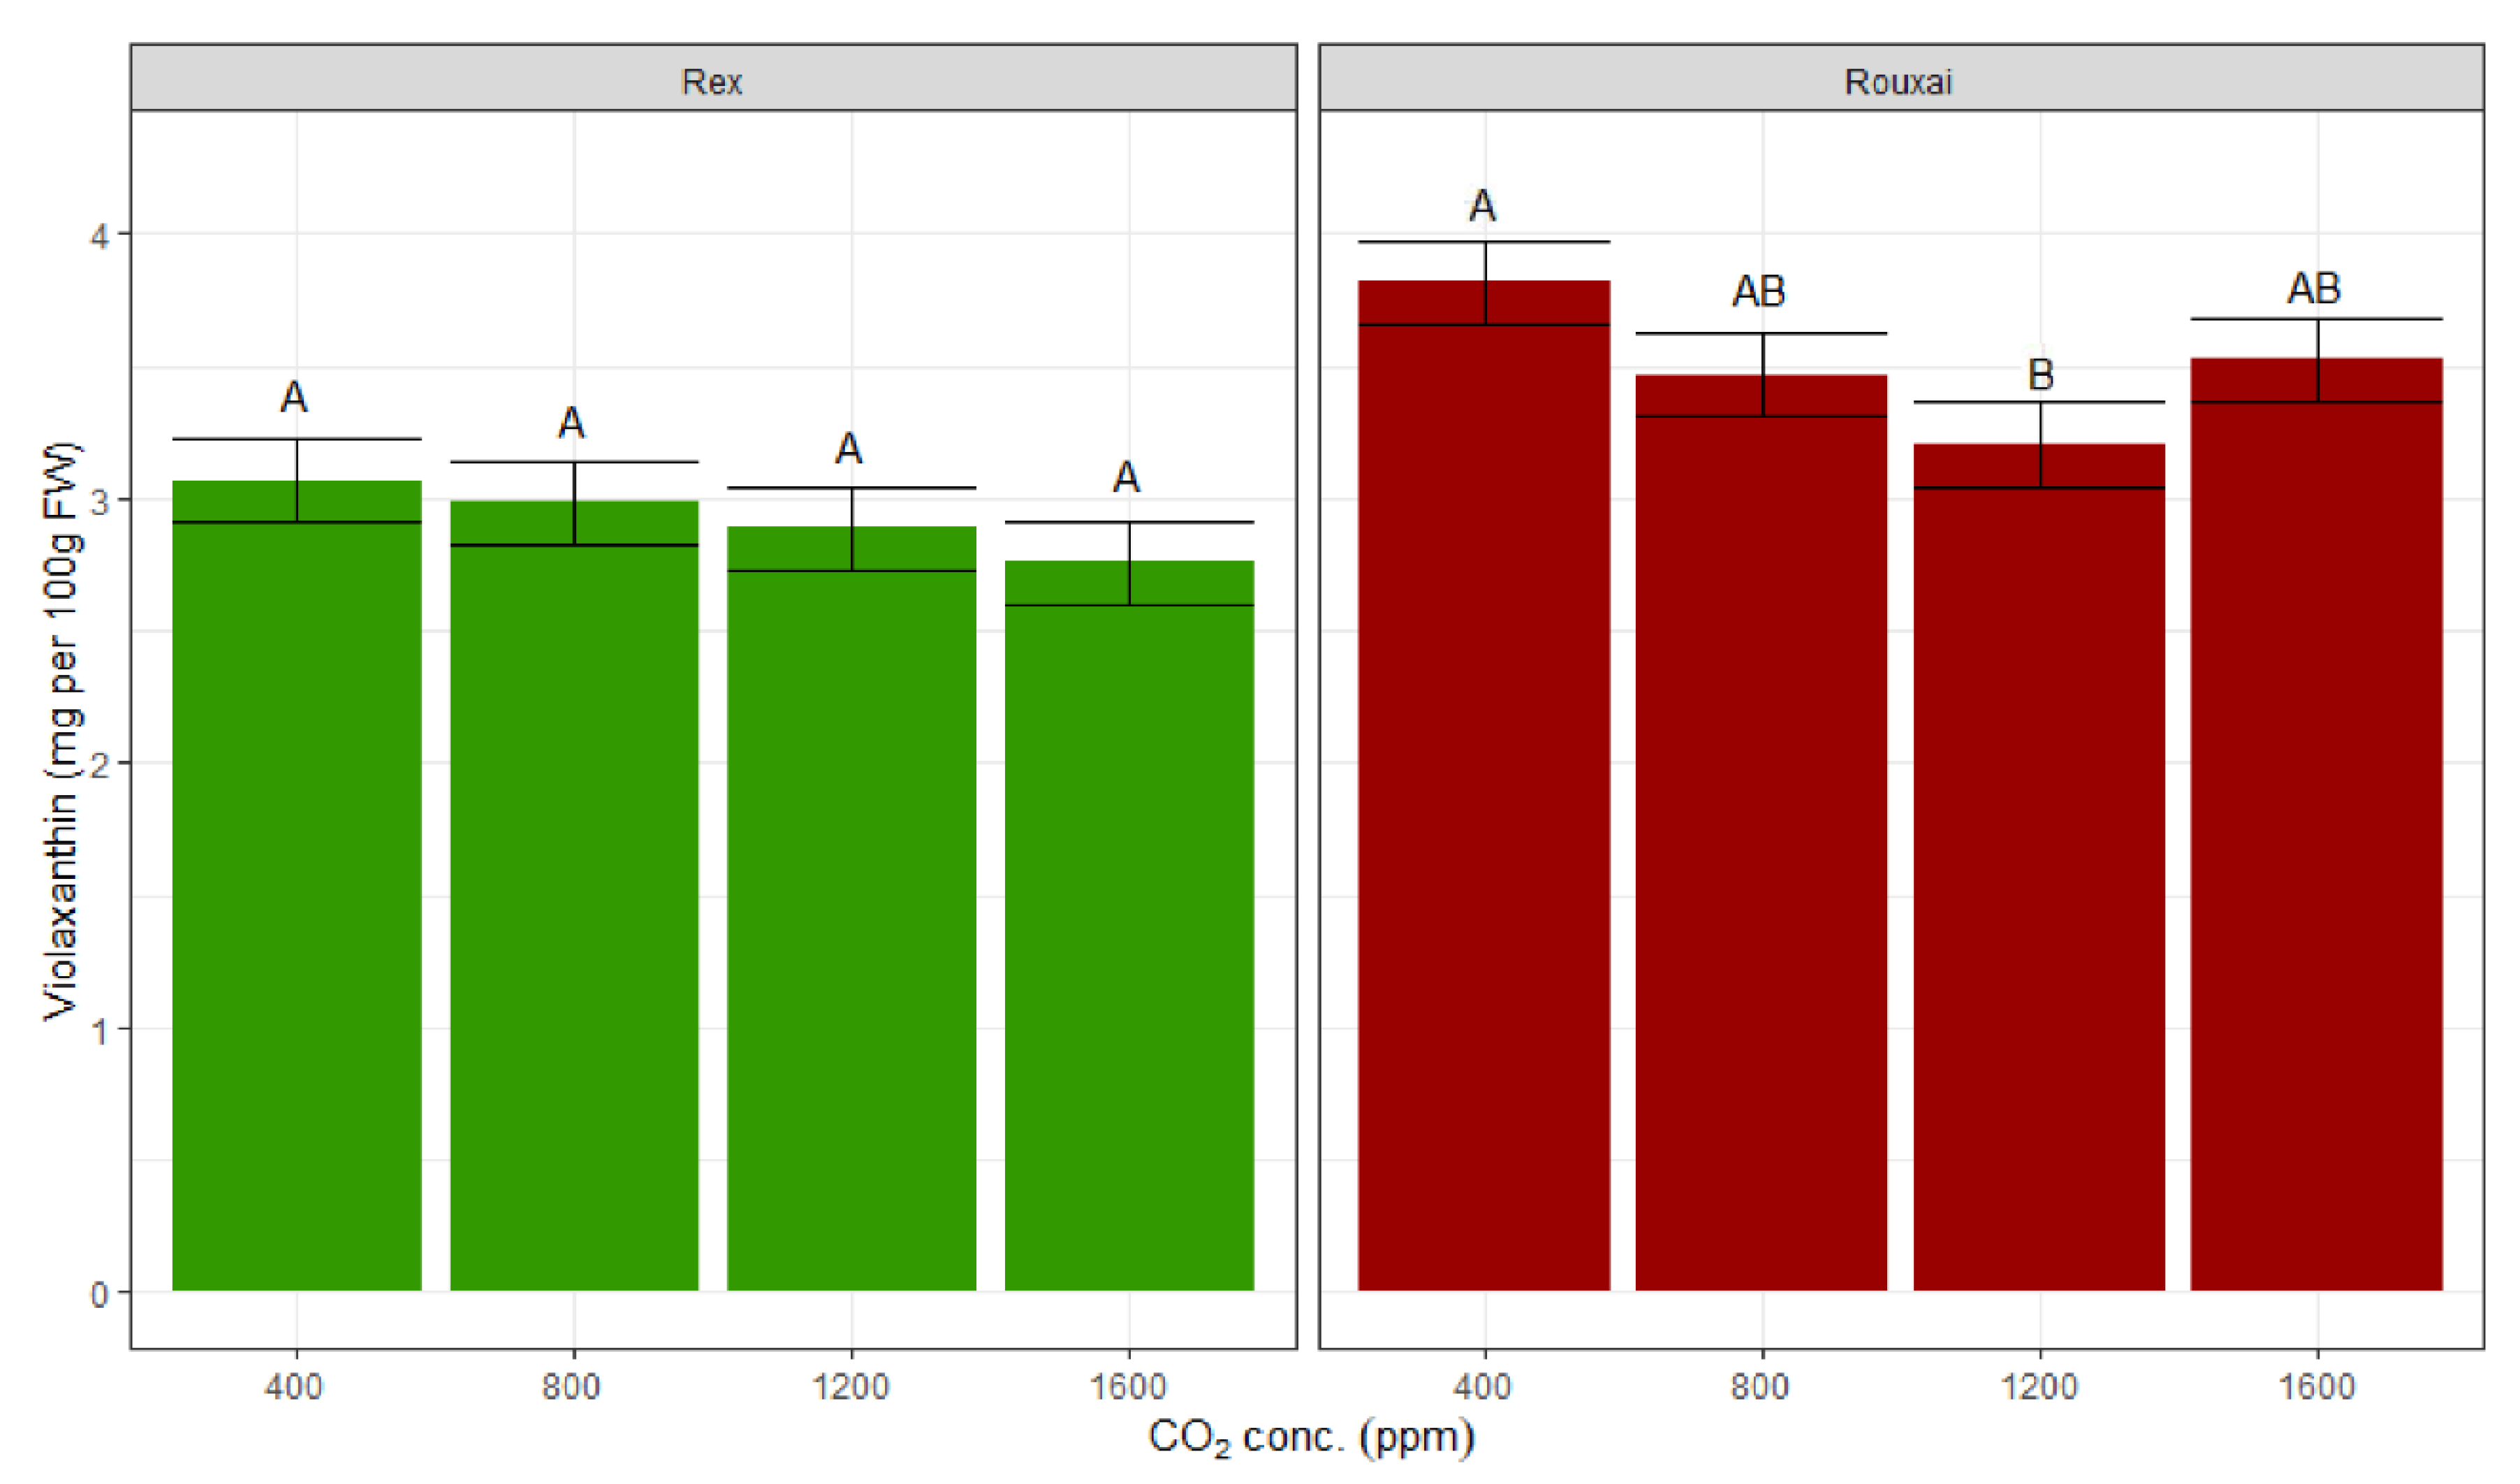
Despite a decreasing trend of nutritional content with higher CO
2 concentrations, the only significant difference in the photosynthetic pigments was observed with violaxanthin between the 400 ppm and 1200 ppm treatments in ‘Rouxai’ with violaxanthin concentrations higher at 400 ppm by 19% (
Figure 6). There were no significant differences observed within anthocyanins, lutein, chlorophyll
a, or chlorophyll
b (
Table 1 and
Figure 6). For xanthophylls, only violaxanthin and lutein were quantified, and zeaxanthin was not detected in the leaf samples. The highest concentration of lutein and violaxanthin were observed in the treatment group with 400 ppm CO
2. However, CO
2 treatment did not significantly impact lutein in either variety. Similarly, anthocyanin concentration did not significantly differ between different CO
2 treatments in ‘Rouxai’ lettuce (
Table 1). Anthocyanins were not measured in the ‘Rex’ variety.
The violaxanthin decreased significantly between the treatments of 400 to 1200 ppm CO
2 for the variety ‘Rouxai’. The trend of decreasing violaxanthin content was also observed within the ‘Rex’ plants, but was not significant. An increase in total violaxanthin per plant was observed from 400 to 800 ppm CO
2 concentration (
Figure 7), but the differences were not significant.
No significant differences were found in the concentrations of macronutrients (N, P, K, Ca, Mg, and S) (See
Supplementary Materials; Figure S1) and micronutrients (B, Cu, Fe, Mn, and Zn) (See
Supplementary Materials; Figure S2) across selected CO
2 concentrations. A pattern of slightly declining mineral nutrient concentration in response to increasing CO
2 concentration was evident across many of the mineral nutrients, however, none were found to be significant. ANOVA analysis showed the effect of rising CO
2 concentrations to be a significant predicting factor for nitrogen concentration, despite no significance with Tukey HSD analysis between treatments.
4. Discussion
The trends in plant morphology correspond well with the previous work with CO
2 enrichment. The fresh and dry biomass of both of the cultivars in this study increased by 25 to 44% for ‘Rex’ and ‘Rouxai’, respectively, when CO
2 increased from 400 ppm to 1600 ppm, while previous literature reports a 20–40% increase in lettuce biomass with CO
2 enrichment of 800 ppm for lettuce [
7]. The results corroborate past findings that most of the CO
2 benefits are obtained with supplementation up to 800 ppm, and diminishing returns thereafter [
9]. The similar results to past research validates our methodology and lends support that the findings with nutritional components will be replicable.
For ‘Rouxai’ lettuce, the violaxanthin decreased as the CO
2 concentration increased from 400 to 1200 ppm CO
2. For lutein, a slight, but statistically insignificant, trend was observed in which the overall concentrations decreased with increasing CO
2. In the limited literature on leafy greens, the overall effect of increased CO
2 has been little to no effect on flavonoids and carotenoids for lettuce, of which anthocyanins and xanthophylls are included [
18,
33,
34]. ‘Rouxai’ also showed a greater sensitivity to the impact of CO
2 on the xanthophyll content, as the violaxanthin concentrations were significantly lower at 1200 ppm compared to 400 ppm. Overall, the concentrations of violaxanthin were lower in every treatment of ‘Rex’ compared to any treatment of ‘Rouxai’ and may have contributed to the lack of significance observed in ‘Rex’. The greater expression of violaxanthin in ‘Rouxai’ may contribute to the significant differences observed, as differences in violaxanthin may be easier to quantify due to higher concentrations being present. This finding coincides well with previous findings, as crop varieties have different response to elevated CO
2 levels, regarding nutritional content and carotenoids [
35].
One possible explanation for the slight reduction in violaxanthin concentration could be dilution due to growth rate, as plants gain carbohydrate biomass more rapidly under higher CO
2. As the lettuce plants grow faster with increased CO
2, the overall accumulation of xanthophylls may not proceed at the same rate. Dilution has been a major factor that affects the concentration of nutrients within plants [
36].
No measurable quantity of zeaxanthin was detected during this experiment. This may be due to the overall low irradiance level in CEC units (250 µmol·m
−2·s
−1) during growth and at harvest time [
37]. It is possible, in a greenhouse setting, that increases in overall light may increase light stress and thereby produce a greater concentration of zeaxanthin.
No differences in either anthocyanin concentration or total anthocyanins per plant were observed, suggesting CO
2 has no effect on the overall production of anthocyanin. Anthocyanin has been shown to be quickly generated [
38], therefore the growth rate may not have a significant effect since these compounds can be produced quickly. In addition, anthocyanin accumulation only takes place in the presence of light, and the inner part of the plants remain green and relatively free of anthocyanins. As the plants grow bigger, there is a decrease in surface area to volume ratio. This could also account for lack of differences between treatments, as treatments with higher CO
2 concentrations grew with more volume. Despite the larger surface area, this was diluted as total anthocyanins were measured with the whole plant, not simply on the surface of the leaves. Other findings with lettuce have shown that light intensity is far more influential than CO
2, with CO
2 having no effect on anthocyanin production [
18].
Overall, the mineral nutrition showed a slight, but not significant pattern, of decrease in concentration with increasing CO
2. The changes in mineral nutrition have been noted to be insignificant, be slight decreases, or, in some cases, increases in response to CO
2 for lettuce [
34,
35,
36]. Given the small differences and inconsistencies of past research, our results are not surprising in showing a decrease that was not significant. Simply increasing the carbon dioxide alone did not provide consistently similar findings in past research, nor in this project despite plausible explanations such as dilution of nutrients due to faster growth and carbohydrate accumulation, and decreased transpiration resulting in less bulk flow of nutrients from the root zone [
10,
11,
12].
Although patterns of slight decreases in nutrition were observed, these were not found to be significant in most cases. Since light and nutrient content are often related, the combination of these factors with various CO
2 concentrations should be investigated. One of the benefits of using supplemental CO
2 is maintenance of high yield while utilizing less light [
9]. Since the light level was kept constant across treatments, reducing DLI may further reduce nutrition. Since nutritional components, such as anthocyanins and xanthophylls, are often highly correlated with light intensity [
37,
39], reducing DLI would reduce the concentration of these important compounds in plant leaves. In addition, the spectrum of light has been shown to have a significant impact on nutrition in conjunction with CO
2 concentrations [
7]. More research is needed to determine the interactive effects of light and CO
2 on lettuce nutrition.
