Article

Morpho-Agronomic Characterization, Sample Size, and Plot Size for the Evaluation of Capsicum chinense Genotypes

by
Silfran Rogério Marialva Alves
1,
Ricardo Lopes
2,
Carlos Meneses
3,
Magno Sávio Ferreira Valente
4,
Cibele Chalita Martins
5,
Santiago Ferreyra Ramos
6,
Izamara Oliveira
3,
Therezinha de Jesus Pinto Fraxe
1,
Lucifrancy Costa
1 and
Maria Teresa Gomes Lopes
1,*
1
Faculdade de Ciências Agrárias, Universidade Federal do Amazonas, Avenida Rodrigo Otávio Ramos, 3.000, Bairro Coroado, Manaus 69077-000, AM, Brazil
2
Campo Experimental da Embrapa Amazônia Ocidental, Embrapa Amazônia Ocidental, Km 29, AM 010, CP. 319, Manaus 69010-970, AM, Brazil
3
Programa de Pós-Graduação em Ciências Agrárias, Departamento de Biologia, Centro de Ciências Biológicas e da Saúde, Universidade Estadual da Paraíba, Bairro Universitário, Campina Grande 58429-500, PB, Brazil
4
Campo Experimental do Instituto Federal do Amazonas, Instituto Federal do Amazonas, Av. Onça Pintada s/n, Presidente Figueiredo 69735-000, AM, Brazil
5
Faculdade de Ciências Agrárias e Veterinárias, Universidade Estadual Paulista, Rod. Prof. Paulo Donato Castellane, s/n, Jaboticabal 14884-900, SP, Brazil
6
Instituto de Ciências Exatas e Tecnologia, Universidade Federal do Amazonas, Rua Nossa Senhora do Rosário, 3863, Bairro Tiradente, Itacoatiara 69100-000, AM, Brazil
*
Author to whom correspondence should be addressed.
Horticulturae 2022, 8(9), 785; https://doi.org/10.3390/horticulturae8090785
Submission received: 25 July 2022 / Revised: 27 August 2022 / Accepted: 27 August 2022 / Published: 30 August 2022

Abstract

:
The Amazon is a center of diversity for Capsicum chinense Jacq., with wide genetic and morphological variability, but little exploration has been performed there to facilitate their improvement. This study aimed to characterize and evaluate C. chinense genotypes for the development of cultivars by determining the optimal size of the experimental plot and the minimum sample size to ensure a precise estimation of yield. A total of 23 genotypes were evaluated, and in multivariate analyses, the plants were characterized by 21 morphological descriptors and eight quantitative traits related to biometry and yield. The recommended sample size for fruit evaluation was defined based on simulations with subsample resampling and evaluation of the semi-amplitudes of the confidence interval of the mean estimate. The optimal plot size was estimated by the modified maximum curvature method. The similarity coefficients among the genotypes ranged from 0.54 to 0.93, indicating that the established clusters contained important information for future crosses. According to the sample size methodologies, 25 to 40 fruits should be sampled for valid evaluations of biometric traits. Experiments with five to eight plants per plot are recommended to test progenies of the species, ensuring good experimental precision combined with high selection accuracy for yield traits.

1. Introduction

The market for cultivated peppers is a segment with great growth potential, both for fresh consumption as well as for processing. Capsicum is a pepper genus native to tropical and temperate Central and South America and Mexico [1,2,3,4]. Of the domesticated South American peppers, Capsicum chinense Jacq., primarily found in Brazil, is commonly known as “pimenta-de-cheiro” and is sweet and aromatic. It is a species widely appreciated and consumed by the local population [5,6]. The Amazon basin is a center of diversity, where wide genetic variability is observed, mainly regarding the fruit traits [5,6].
The pepper fruits have high levels of phytochemical compounds, high antioxidant capacity [7,8,9,10,11], and characteristic aromas that contribute to their flavor, which is why they are used in the production of condiments [12] for food, nutrition, and other purposes. Germplasm screening in diversity centers shows that distinct local environmental conditions and culture and market opportunities have led to different outcomes in the selection process [13]. A specific variety called “pimenta-de-cheiro” in Brazilian Portuguese belongs to C. chinense [6]. It is usually cultivated on small local farms; as such, it is socially and economically relevant.
Despite the importance of “pimenta-de-cheiro” C. chinense, there is a lack of improved varieties with traits that meet the requirements of both the agro-industrial sector and small producers in Brazil. Most producers of “pimenta-de-cheiro” in the states of northern Brazil plant seeds from the fruits of plants without a defined genetic origin or seeds from fruits purchased in shops or markets. On plantations, great segregation for commercial traits, fruit size, shape, and color is observed, resulting in a lower market value.
For an effective use of genetic resources, genes of interest for genetic breeding, their adequate characterization, evaluation, and documentation are essential, as are studies that elucidate the genetic basis of the selection target trait directed towards the establishment of efficient strategies in breeding programs [14,15,16,17]. The characterization of genotypes with recommended descriptors can provide studies of sampling, selection, and hybridization to define adequate strategies for the conservation and genetic breeding of C. chinense.
In view of the great morphological variability observed in “pimenta-de-cheiro” C. chinense fruits, expressed in multiple shapes, sizes, and colors, an important step is to define the sample sizes recommended to ensure an accurate evaluation of the morpho-biometric fruit traits. The market price of “pimenta-de-cheiro” fruits is defined by certain classifications, which must be applied in the characterization and evaluation of germplasm and requires reliable sampling procedures. Sample size is important because if the sample size is too small, estimates will be inaccurate, thereby affecting the quality of the results and experimental conclusions [18,19,20]. Alternatively, an excessive number of samples may cause the unnecessary expenditure of resources [21,22].
Aside from studying the sample size for analyses of “pimenta-de-cheiro” C. chinense, the defined plot size should allow the experiments to have a good cost/benefit ratio, allowing for the species to improve. Well-designed breeding programs are fundamental, in which the size of the experimental plot is highly relevant when choosing a set of appropriate statistical and experimental techniques for the selection and estimation of genetic parameters [22].
To form a base population for the development of sweet and aromatic “pimenta-de-cheiro”, Embrapa Amazônia Ocidental (Amazonas, Brazil) collected C. chinense accessions from several locations in the northern region of the country. The genotypes were subjected to preliminary selection for the elimination of those with pungency. The next stage consisted of the characterization and evaluation of these genotypes according to established methodologies for the genus Capsicum.
The objectives of this study were to characterize and evaluate “pimenta-de-cheiro” C. chinense genotypes to determine the optimal size of the experimental plot and the minimum sample size necessary to accurately estimate the yield and fruit traits of the species.

2. Materials and Methods

2.1. Plant Material

Twenty-three “pimenta-de-cheiro” (C. chinense) from local farms that supply the local market in northern Brazil were selected. The fruits that provided the seeds were purchased in shops and markets, representing the result of a preliminary selection for elimination of those with medium to high pungency. The fruits from “pimenta-de-cheiro” are consecrated and recognized by the local population for the aroma and are essential for the preparation of regional cuisine. In the first stage of establishing the collection, each fruit obtained spawned a family. When considering the morphological descriptors which presented segregation in the evaluation of families, plants that produced pungent fruits, those with low aroma, and those that presented some phenotypic variations were discarded. One plant from each family was selected based on the vegetative aspects and fruit production. The multiplication of the selected plants was carried out by through self-pollination. To ensure the self-pollination of the seeds produced, the branches of the selected plants were covered with paper bags before the opening of the flowers in order to maintain coverage until the initial phase of fruit formation. The fruits of plants from families that did not show segregation were used in the study of morpho-agronomic characterization. The majority of them were from the state of Amazonas and from the municipalities of Rio Preto da Eva (RPE-V), São Gabriel da Cachoeira (SGC-XI, SGC-XVIII), Tabatinga (TAB-I, TAB-II, TAB-III, TAB-V), Benjamin Constant (BEN-III, BEN-IV), Manacapuru (MPR-III, MPR-V), and Manaus (MAN-I, MAN-II, MAO-III, MAO-VII, MAO-IX, and DBI-I). We also evaluated “pimenta-de-cheiro” genotypes from the municipalities of Pará, Oriximiná (ORX-2, ORX-I, ORX-II, ORX-IV, and ORX-V) and Rondônia, Guajará Mirim (GUA-I). It is noteworthy that each genotype is considered to be an inbred line because C. chinense is an autogamous species (Baba et al., 2016). The “pimenta-de-cheiro” C. chinense is registered in the Manuel de Arruda Câmara herbarium of the Paraiba University State (Campina Grande-Brazil), under the numbers CEN: 21053/ACAM, CEN: 14640/ACAM, CEN: 107259/ACAM, CEN: 26315/ACAM, CEN: 26318/ACAM, CEN:73810/ACAM, CEN: 73817/ACAM, CEN: 73822/ACAM, CEN: 73829/ACAM, CEN: 73832/ACAM, CEN: 73834/ACAM, CEN: 73839/ACAM, CEN: 73840/ACAM, CEN: 73842/ACAM, CEN: 73845/ACAM, CEN: 73851/ACAM, CEN: 73871/ACAM, CEN: 73872/ACAM, CEN:73875/ACAM, CEN: 73877/ACAM, CEN: 73880/ACAM, CEN: 73881/ACAM, and CEN: 73882/ACAM. Each genotype was validated as a “pimenta-de-cheiro” by the herbarium and three traditional local farmers in Manaus (Brazil) with an aroma test on one fruit of each genotype. All farmers attested that 100% of the fruits were “pimenta-de-cheiro” and promising for consumption as they had a strong aroma and were sweet.

2.2. Soil Analysis and Cultural Treatments

The experiment was conducted at the headquarters of the Embrapa Western Amazon, located at km 29 on the highway AM 010, in the rural area of Manaus on an experimental field, in the coordinates of 2°51′ S latitude and 59°52′ W longitude. The soil of the cultivation area is a dystrophic yellow ferrosoil with a clayey texture. The local climate is classified as “Afi” according to Köppen’s system, with an average precipitation of 2450 mm rain year−1 and a dry season from July to September. The soil acidity was corrected to pH 6.0 and based on the results of soil chemical analyses, 2.38 tons ha−1 dolomitic limestone (relative efficiency 80%) were applied 60 days before planting. Planting was performed in 20 cm × 20 cm planting holes with a spacing of 1.0 m between rows and 0.8 m between plants. In the planting pits, 2.0 g urea, 24.0 g triple superphosphate, 6.0 g potassium chloride, and 1.5 kg stored chicken manure were applied. Side dressing was reapplied every 30 days, consisting of 150 g NPK plant−1 (formulation 10-10-10) and biweekly foliar fertilizations of 3 g L−1 of the Yogen 2 fertilizer (Yoorin Fertilizantes). Necessary cultural practices were used, such as manual weeding, irrigation, and pest control according to Filgueira [23].

2.3. Experimental Design

The experiment was arranged in randomized blocks, with 23 treatments (“pimenta-de-cheiro” C. chinense), three replications, and six plants per plot. The crop was harvested weekly for 25 consecutive weeks, with the first harvest 62 days after planting.
To characterize the genotypes, 21 morphological descriptors of the flower, fruit and seed traits were selected, as recommended by IPGRI (the International Plant Genetic Resources Institute) for the genus Capsicum [24]. Some descriptors of the genus proposed by the International Plant Genetic Resources Institute (IPGRI) were excluded as they were unsuitable due to the difficulty of analysis and little specific importance on the species. In doing so, we were able to avoid excessive and meticulous measurements, prolonged evaluation periods and non-discriminative information of the genotypes.

2.4. Morpho-Agronomic Descriptors

The flowers were evaluated by the following descriptors in the first flowering when the flowers were completely open: calyx margin—(1) entire, (2) intermediate, (3) dented; and calyx annular constriction, observed at the junction of the calyx and pedicel at complete fruit maturity—(0) absent, (1) present.
Fruit descriptors measured at the first or second harvest. Fruit color at intermediate maturity—measured shortly before maturation: (1) white, (2) yellow, (3) green, (4) orange, (5) violet, (6) dark violet (purple), (7) greenish yellow, (8) yellowish green, (9) yellowish white, (10) brown, (11) three colors; fruit color at maturity: (1) white, (2) lemon yellow, (3) pale yellow-orange, (4) yellow-orange, (5) pale orange, (6) orange, (7) light red, (8) red, (9) dark red, (10) violet, (11) brown, (12) black, (13) yellow, (14) pale yellow, (15) salmon; fruit shape: (1) elongated, (2) rounded, (3) triangular, (4) campanulate, (5) rectangular (block-shaped), (6) other shape; fruit length (cm)—average length of 10 mature fruits in the second harvest: (1) up to 1, (2) >1 to 2, (3) >2 to 4, (4) >4 to 8, (5) >8 a 1, (6) >12; fruit diameter (cm)—measured at the widest part of 10 mature fruits in the second harvest: (1) up to 1, (2) >1 to 2.5, (3) >2.5 to 5, (4) >5 to 8, (5) above 8; fruit weight (g)—average weight of 10 mature fruits in the second harvest: (1) to 1, (2) >1 to 2, (3) >2 to 4, (4) >4 to 8, (5) >8 to 12, (6) above 12; peduncle length (cm)—average length of 10 peduncles at the second harvest: (1) up to 2, (2) >2 to 4, (3) >4 to 6, (4) above 6; fruit wall thickness (mm)—average of 10 mature fruits in the second harvest, measured at the point of greatest width: (1) up to 1, (2) >1 to 2, (3) >2 to 3, (4) >3 to 4, (5) >4 to 5, (6) above 5; fruit shoulder at pedicle insertion: (1) acute, (2) obtuse, (3) blunt, (4) cordate, (5) lobed; neck at fruit base: (0) absent, (1) present; fruit tip shape: (1) pointed, (2) truncated (blunt), (3) sunken, (4) sunken with tip; appendix at fruit tip: (0) absent, (1) present; corrugation in the fruit cross section: (3) slightly corrugated, (5) intermediate, (7) corrugated; number of locules—taken from 10 fruits: (1), (2), (3), (4), (5); fruit surface: (1) smooth, (2) semi-rough, (3) rough, (4) smooth with stripes, (5) semi-rough with stripes; pungency: (1) sweet, (2) low pungency, (3) medium pungency, (4) high pungency; aroma: (1) low, (2) medium, (3) high.
Seed descriptors: seed size—average of 10 randomly chosen seeds: small (3), intermediate (5), large (7); number of seeds per fruit—average of 10 fruits of 10 randomly selected plants per genotype: (1) <20, (2) 21–50, (3) >51.
The yield parameters were evaluated in 25 weekly harvests and recorded: total fruit weight per plant (TFW), by weighing the fruits on a precision scale (0.01 g); number of fruits per plant (NF) and mean fruit weight (MFW) in grams, calculated as the ratio of TFW/NF. The fruit traits fruit length (FL), fruit diameter (FD), and fruit wall thickness (FWTh) were measured in millimeters with a digital caliper (0.01 mm); length/diameter ratio (LDR) was calculated as the FL/FD ratio and seed size (SS) was measured with a digital caliper in 10 seeds per fruit.

2.5. Phenotypic and Statistical Analyzes

The phenotypic variability was analyzed using the 21 descriptors for the characterization of the 23 genotypes as well as techniques of multivariate analyses unifying the dichotomous (e.g., with or without pungency), multicategory qualitative (e.g., fruit color and shape) and quantitative descriptors (e.g., fruit weight). The similarity between the accessions was calculated by Gower’s general coefficient of similarity [25].
The genotypes were grouped by the unweighted pair-group method based on arithmetic averages (UGPMA) and the graphic of similarity dispersion between them was performed with principal coordinates analysis (PCO) and principal component analysis (PCA), using software Multi-Variate Statistical Package (MVSP) for both analyses [26].
Sample sizing was analyzed based on a 40-fruit sample with subsequent calculation of the statistics: minimum and maximum values, arithmetic mean, standard deviation, coefficient of variation, kurtosis, and weight asymmetry for fruit weight (FW), length (FL), diameter (FD) and length to diameter ratio (DLR) of fruits of three genotypes with different fruit shapes. Data normality was also tested utilizing the Lilliefors test to characterize the database and check its suitability for the sample sizing study for each measured trait, based on the Student’s t-distribution.
The recommended sample size for the evaluation of “pimenta-de-cheiro” C. chinense was determined by two methodologies: simulation, based on resampling of subsamples, and algebraically, evaluating the semi-amplitudes of the confidence interval of the mean estimate.
A simulation method was used, consisting of sub-sample resampling, for which the estimated arithmetic averages of the fruit traits of three genotypes (with different fruit shapes) were analyzed. Reduced sample sizes ranging from 2 to 39 fruits with 100 samplings for each simulated size were analyzed in a sampling with data replacement. The small-size sample (n1) was considered as a reference sample when there was no simulated value outside the 95% confidence interval (CI 95%) for this sample at a probability of 95%.
The sample size (n2) was also calculated based on the semi-amplitudes of the confidence interval of the estimated mean (m) by the expression: n 2 = ( S 2 .   t α / 2 2 ) / ( e 2 . m 2 ) , where S is the standard deviation estimate, t α / 2 is the critical value of Student’s t-distribution whose right-hand area is equal to α/2, with n −1 degrees of freedom, and α = 5% error probability; e is the error in the mean estimate, which was assumed to be 5%; and m is the arithmetic mean of the sample. Afterwards, the estimation error was calculated assuming the use of n = 40 fruits to obtain the estimated mean of each of the traits, by means of the expression: E r r o r   o f   e s t i m a t i o n   ( % ) = 100 ( S . t α / 2 ) / ( m . n ) .
The sample sizing analyses were performed with Genes [27] and Microsoft Office Excel software.
To obtain the experimental variation coefficient from different plot sizes, 100 samplings were performed with data replacement for each analyzed scenario, by taking from 2 to 6 plants within the plots.
The modified maximum curvature method consisted of representing the relationship between the coefficient of variation (CVe) and plot size using a regression equation of type Y = a X b   (where Y represents the coefficient of experimental variation and X corresponds to plot size). From the curvature function given by this model, the value of the abscissa at the point of maximum curvature was determined, given by X m c = [ a 2 b 2 ( 2 b + 1 ) / ( 2 b + 2 ) ] 1 / ( 2 + 2 b ) , which corresponds to the estimate of the optimal size of the experimental plot [28], where a is the regression constant and b the regression coefficient. Analogously, the statistic used for CVe, the modified maximum curvature method was also used to represent the relationship between the selection accuracy and plot size.
Statistical analyses were performed with the program R (R DEVELOPMENT CORE TEAM, 2018) and Microsoft Office Excel.

3. Results and Discussion

3.1. Morpho-Agronomic Characterization Data

Of the 21 descriptors evaluated, only one (seed size) did not vary, indicating that although the genotypes belong to the same morphotype, there is great phenotypic variability among the peppers sold in the regions represented by the study (Table 1, Figure 1).
With regard to the fruit traits generally used to discriminate pepper morphotypes within the same species, the specific classes or values were ripe red fruit (39.1% of the genotypes) or pale orange (34.8% of the genotypes), campanulate (bell-shaped) fruits (60.9%), fruit length between 4.0 and 8.0 cm (95.6%), fruit diameter between 1.0 and 2.5 cm (87.0%), fruit weight between 4 and 8 g (82.6%), surface of the semi-rough (47.8%) or rough fruit (39.1%), fruit wall thickness 1–2 mm (87.0%), and intermediate seed size for all genotypes. As these genotypes had already undergone a pre-selection eliminating very pungent fruits, all genotypes produced sweet fruits (69.6%) or fruits with low pungency (30.4%). In addition, the aroma of more than 90% of these was medium to strong.
The proper variety of colors and shapes observed in fruits of C. chinense plants cultivated in Amazonia illustrates the high phenotypic variability of the species available for exploitation in breeding programs. Studies, records, and dissemination of the phenotypic variability of C. chinense contribute to the valorization and conservation of the species, as well as to define strategies for breeding and the development of sweet pepper cultivars adapted to tropical and subtropical regions [5,11,29]. Although “pimenta-de-cheiro” C. chinense is part of the regional culinary tradition and the scale of production and consumption in the north of the country is significant, the phenotypic variability of the development of cultivars of this morphotype with defined traits is still has been little explored. Many opportunities exist to further screen and evaluate genetic resources. Yet, there is limited information and understanding in all breeding programs, potentially obscuring useful traits and gene pools present in the C. chinense center of diversity [13].
The similarity values among the 23 genotypes ranged from 0.54 to 0.93, indicating that no redundant genotypes were identified by the 21 descriptors. Additionally, the highest similarity (93%) was observed between genotypes DBI-I and BEN-III and the lowest (54%) among genotypes SGC-XI and ORX-V and SGC-XVIII and MAN-II.
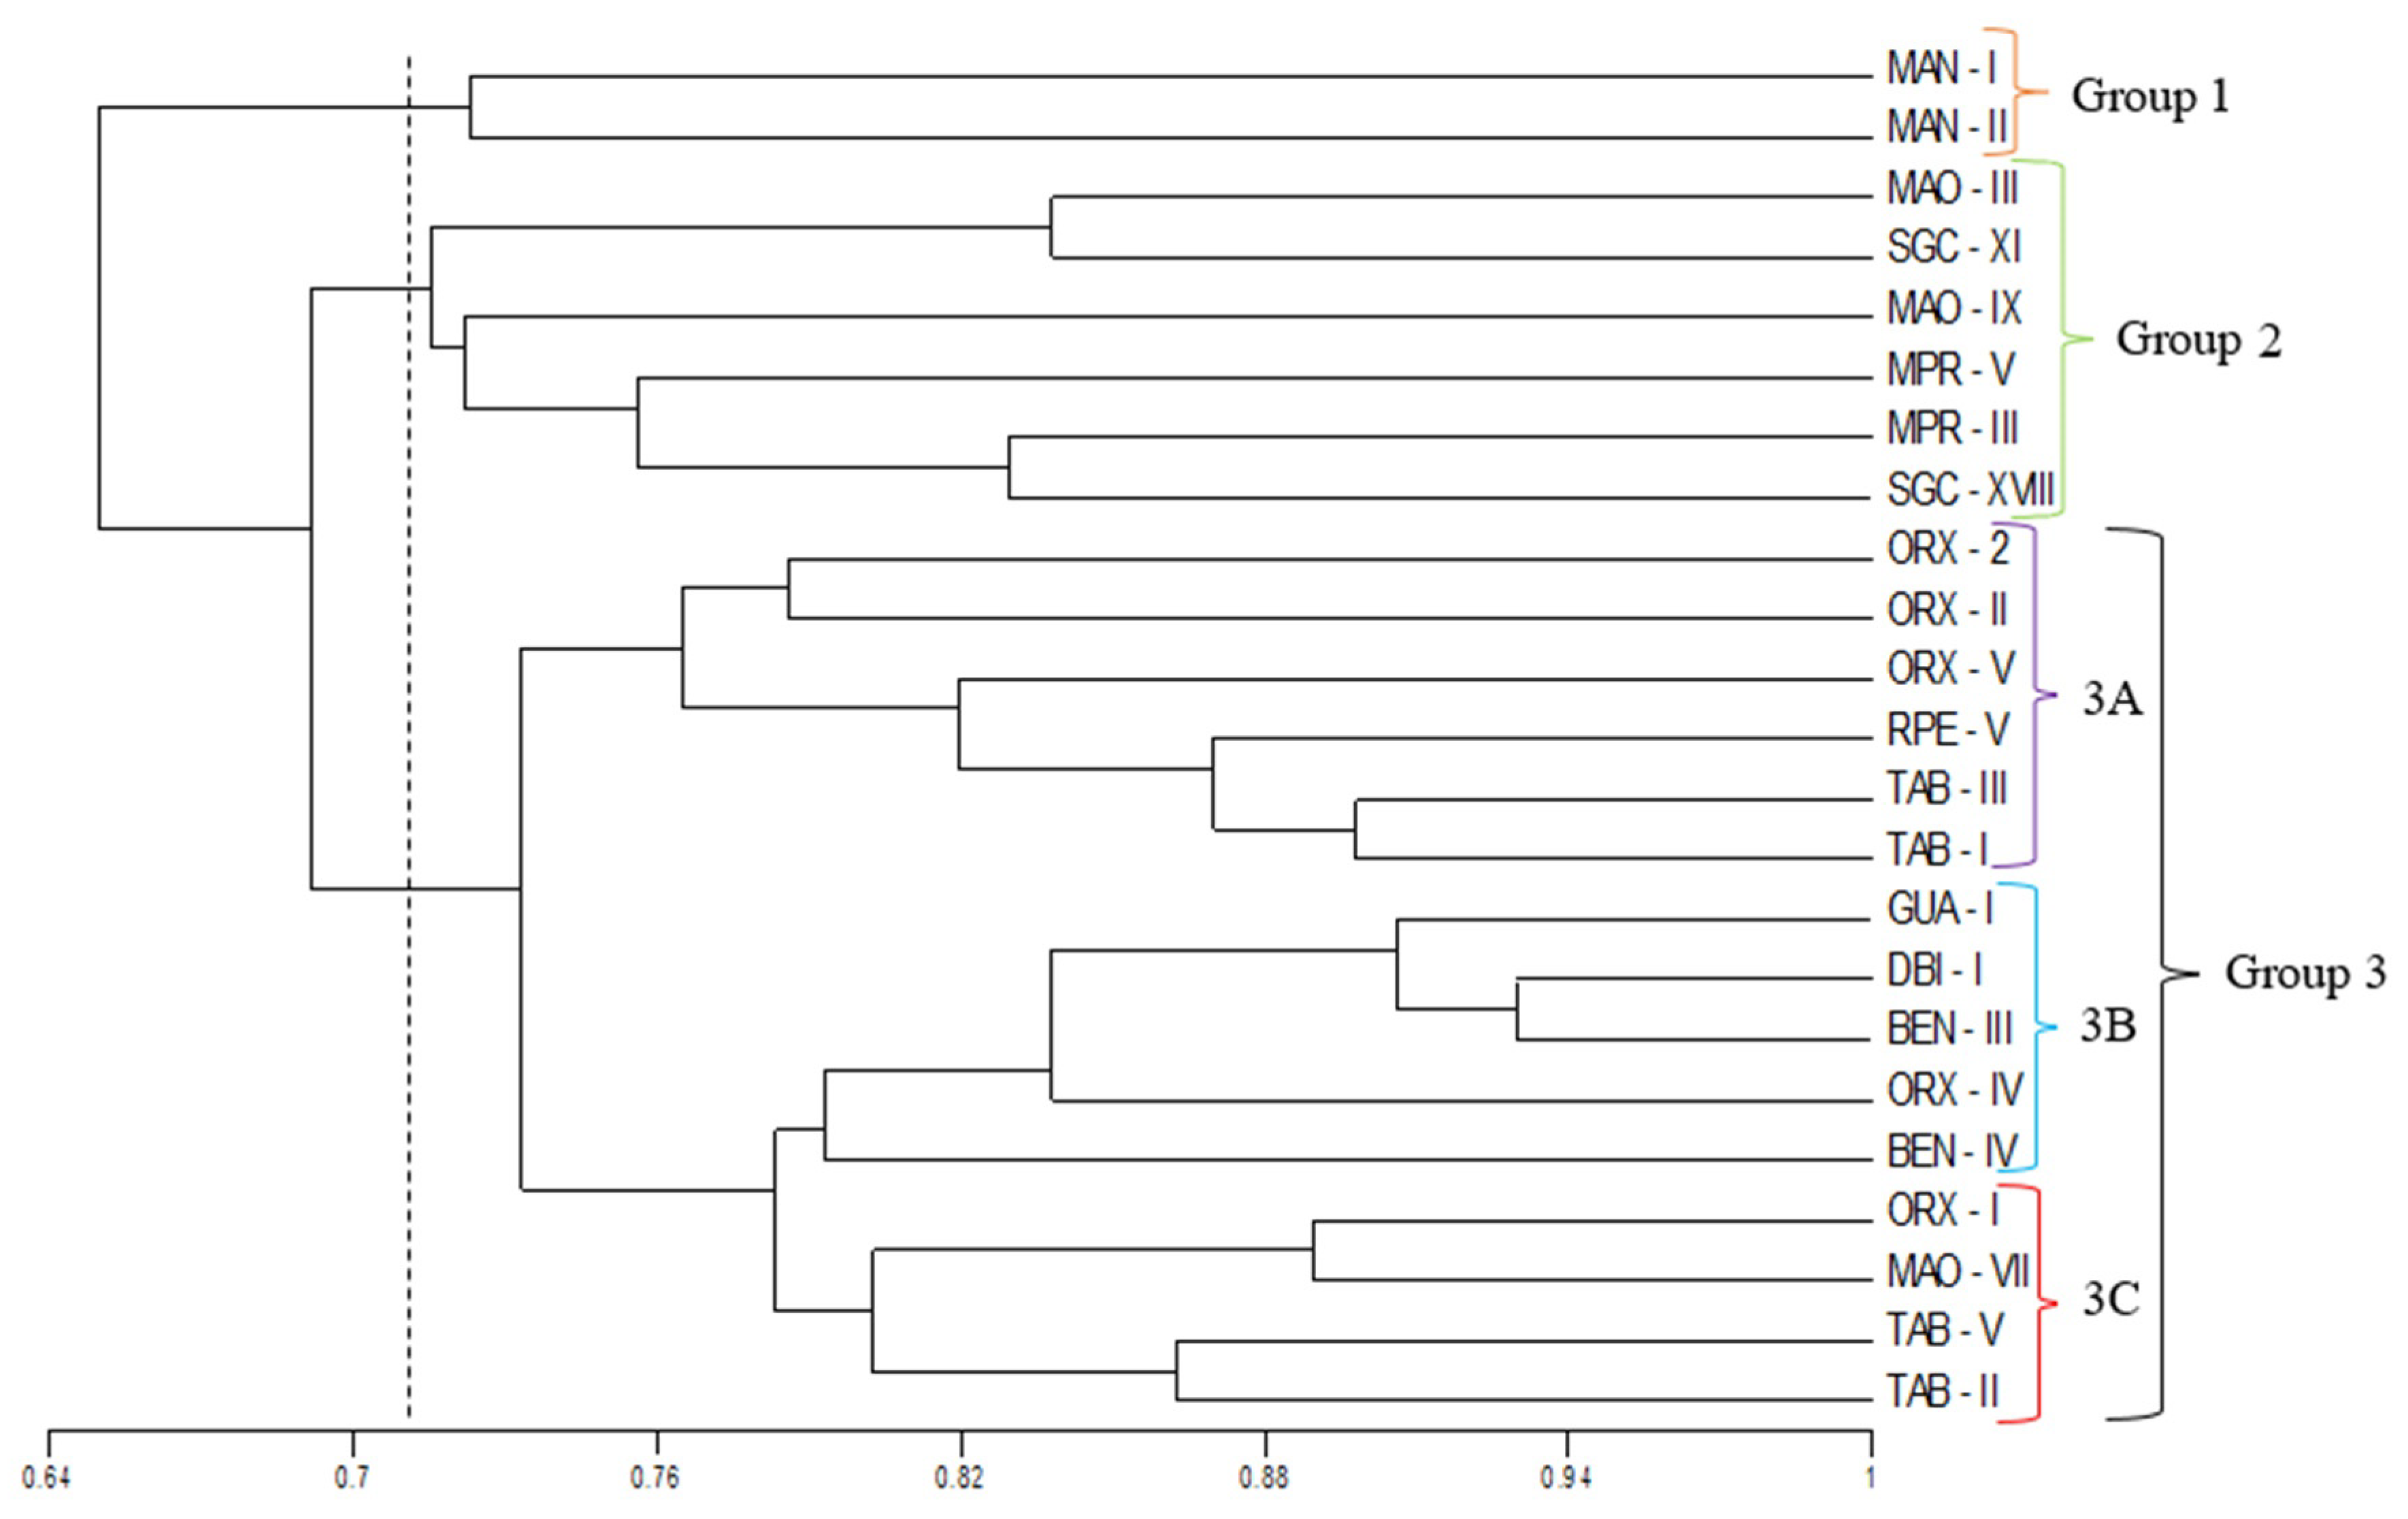
The clustering analysis of the genotypes by the UPGMA method is shown in Figure 2 as the formation of three clusters: group 1—genotypes MAN-I and MAN-II; group 2—genotypes MAO-III, SGC-XI, MAO-IX, MPR-III, MPR-V and SGC-XVIII; and group 3, consisting of three other subgroups (subgroup 3A—genotypes ORX-2, ORX-II, ORX-V, RPE-V, TAB-III and TAB-I; subgroup 3B—GUA-I, DBI-I, BEN-III, ORX-IV and BEN-IV; and subgroup 3C—genotypes ORX-I, MAO-VIII, TAB-V and TAB-II. No genotype appeared separately in the dendrogram (Figure 2).
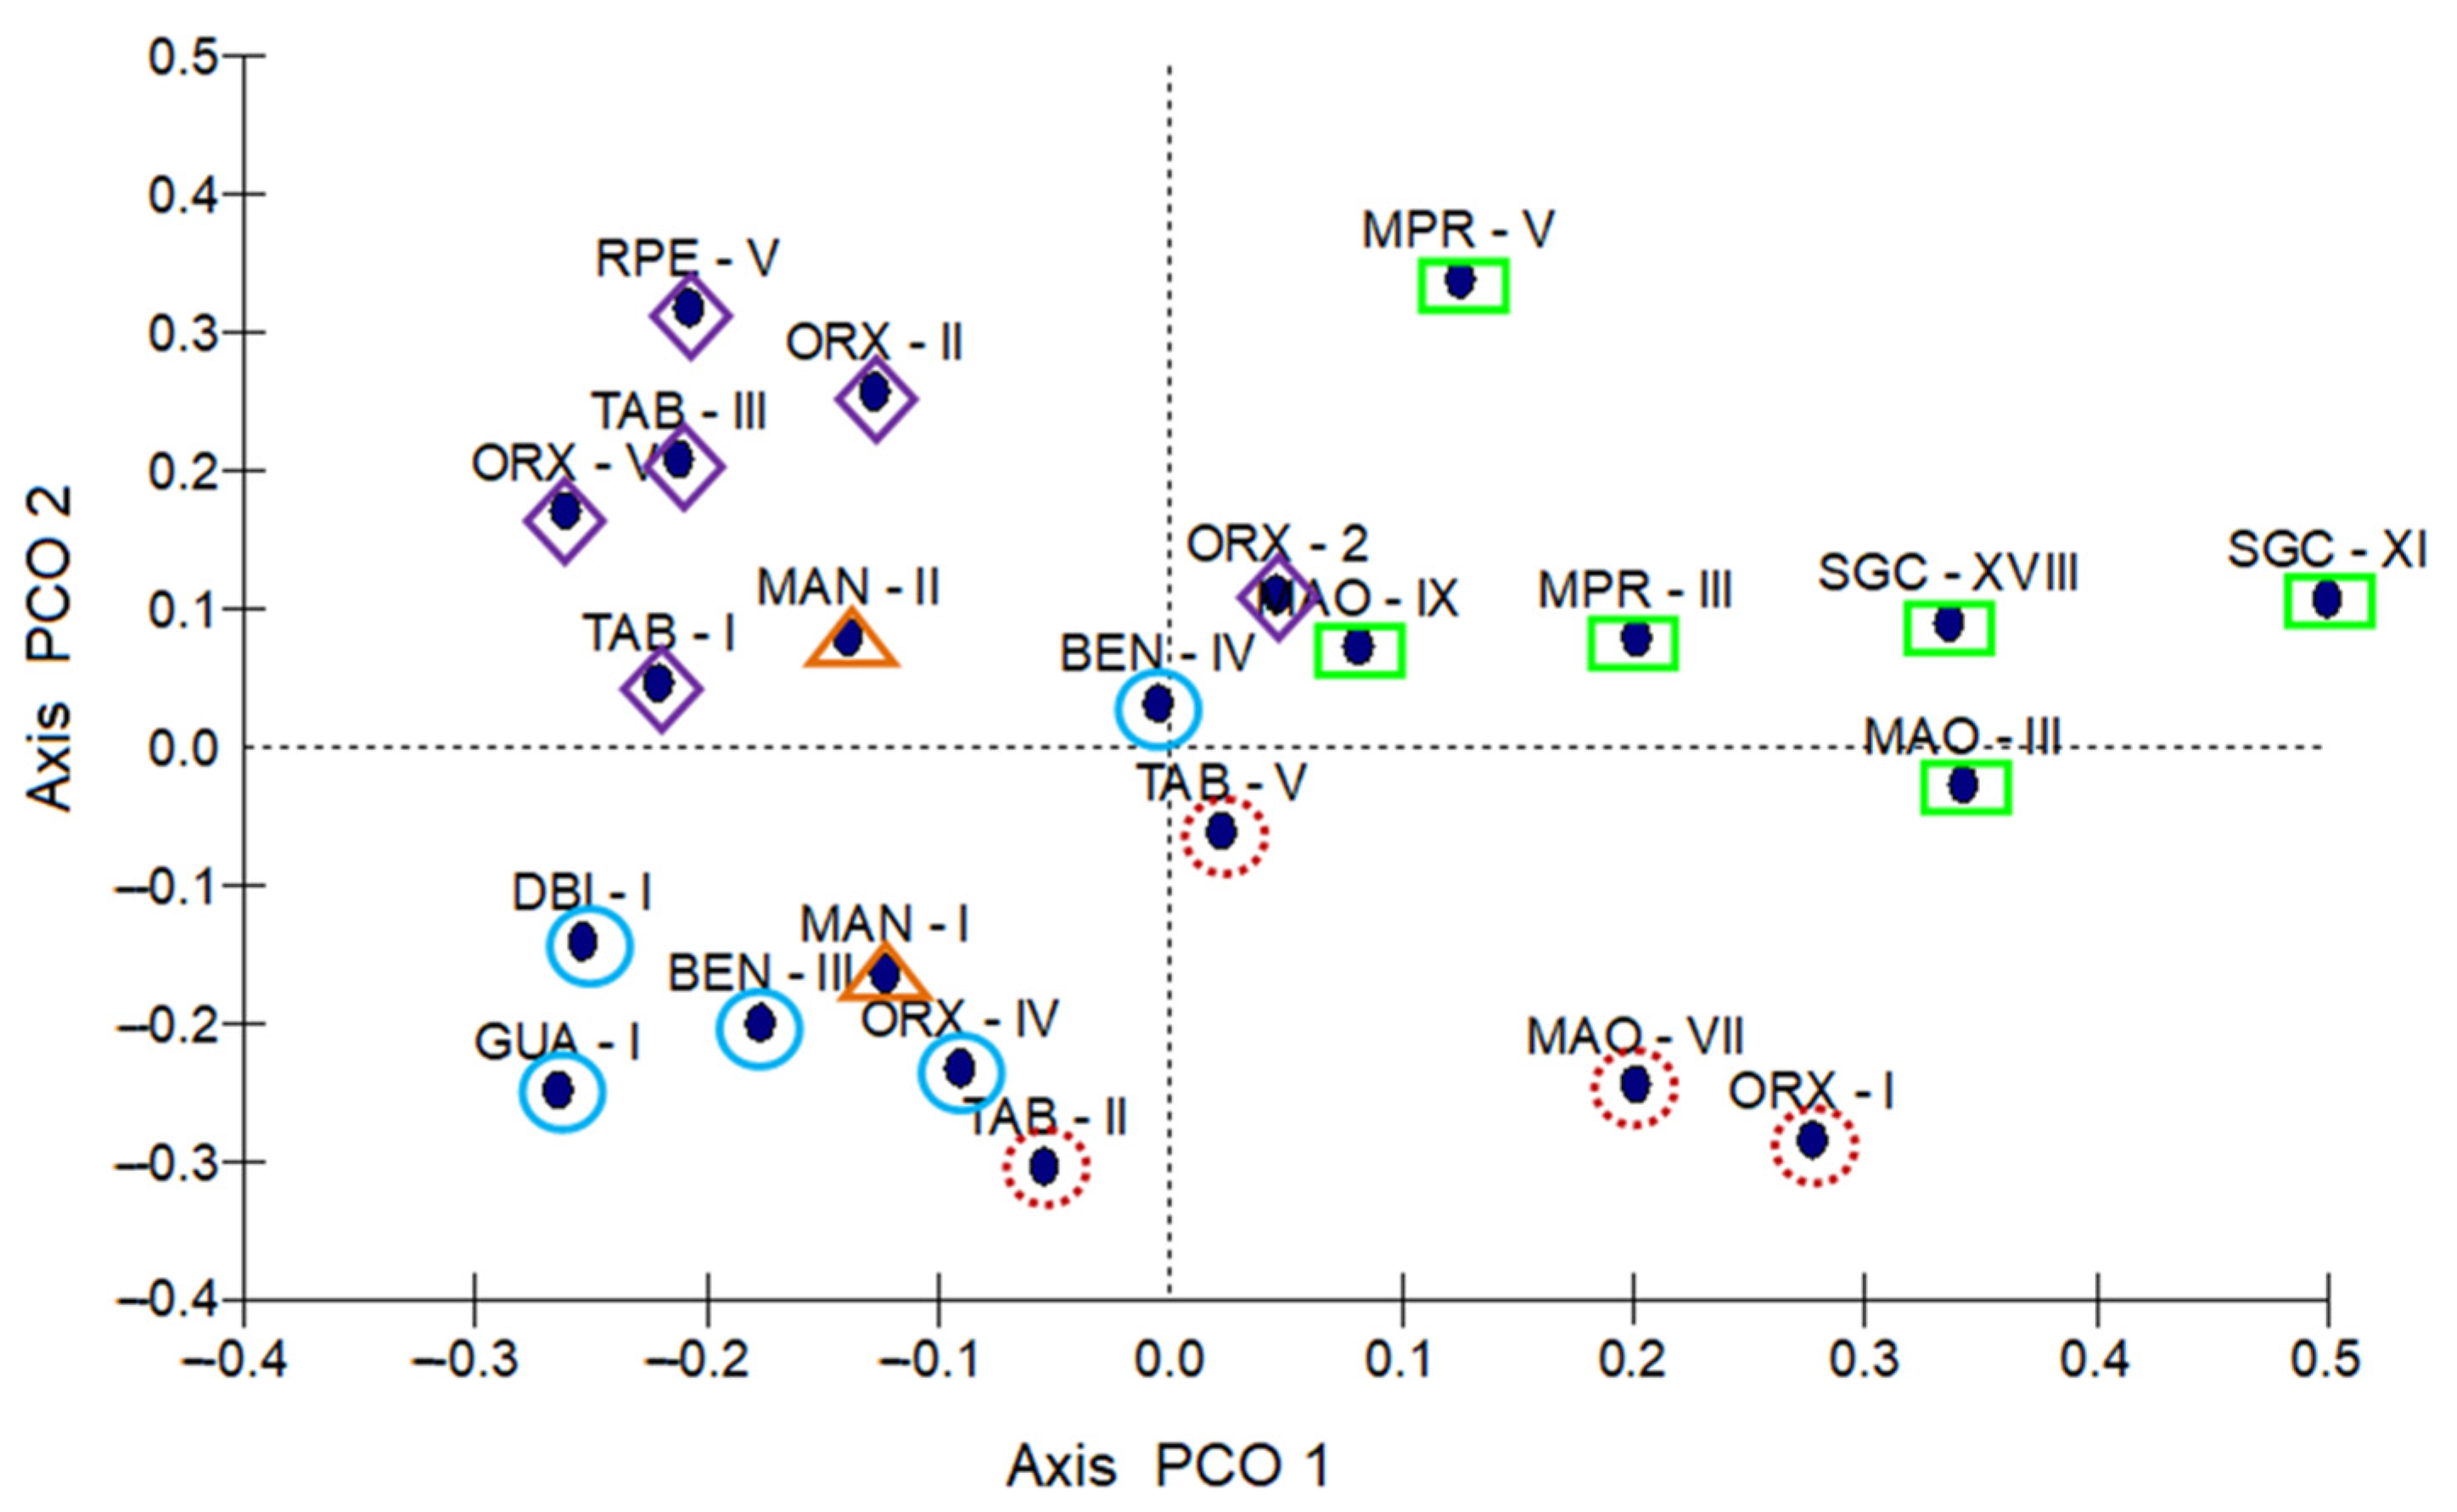
The graphical dispersion analysis using principal coordinate analysis (PCO) (Figure 3) showed good agreement with the hierarchical cluster analysis (UGPMA). However, by plotting the PCO method with projection of distances on two Cartesian axes, the genetic diversity among the evaluated genotypes was visualized in a more direct and simpler way. The two-dimensional dispersion showed a large dispersion area in the space of the genotypes from the state of Pará, evidencing more genetic variability within these genotypes than in the others. However, one must bear in mind that these genotypes were the best represented of the evaluated (five genotypes).
The PCA results showed that among the variables analyzed those with the most significance greater than 5% were FTSh (6.32%), MFC (7.41%), FSH (10.51%), CCS (11.56%) and IFC (49.49%). For Capsicum breeding, crosses between genetically divergent genotypes are recommended and it is desirable that both parents are high yielding and complementary in terms of fruit quality traits [15,30]. In this case, the characterization of “pimenta-de-cheiro” C. chinense genotypes and their allocation in different clusters, based on multivariate analyses will be important to guide future crosses.
The mean test (Table 2) showed that among the 23 genotypes, ORX-II, MPR-V, MPR-III, GUA-I, SGC-XI and SGC-XVIII had the highest means for TFW and NF, also evidencing a direct positive relation between number of fruits and yield (r = 0.99). These genotypes produced over 600 fruits and 5.3 kg fruits per plant during the 25 weeks of evaluating weekly harvests. Genotype MAO III also stood out in terms of TFW, being in the most productive group and having a statistically lower NF (469) than the other genotypes.
For MFW, the genotypes were grouped into two clusters. The high MFW group comprised of 12 and the lower MFW group of 11 genotypes. Among the genotypes allocated in the higher MFW group, six also stood out with respect to TFW: MAO III (11.2 g), MPR III (9.4) g), MPR V (8.6 g), ORX II, 3 g), SGC XI (8.6 g), and SGC XVIII (8.8 g).
A greater differentiation of the genotypes was observed in the traits FL and DLR, discriminating the genotypes statistically in six groups, with means ranging from 32.1 mm to 75.1 mm for FL and from 1.0 to 3.25 for DLR. For fruit diameter, the variation was less expressive, ranging from 19.6 mm to 32.5 mm and the means of the genotypes were divided into three groups. The length/diameter ratio (DLR) is an indicator of the fruit shape (i.e., the higher the DLR value, the longer the fruit) since long fruits have a ratio greater than one and round fruits a ratio close to one.
“Pimenta-de-cheiro” C. chinense genotypes fruits are considered to be medium in weight (5.4 to 11.2 g, mean = 8.2 g) in relation to that found by Moreira et al. [2] (5.34 to 19.05 g) and Bianchi et al. [5] (1.04 to 18.61 g). The variables diameter (19.6 to 26.5 mm) and length (32.1 to 75.1 mm) of fruits also have a wide variation among the genotypes. The results were within the limits obtained by Bianchi et al. [5] for accessions of C. chinense which presented variation from 8.99 to 34.44 mm for diameter and from 7.85 to 84.93 mm for fruit length. Moreira et al. [2] reported 35–99.4 mm for fruit length and 17.3–41.0 mm for fruit diameter.
Although there are significant variabilities in the weight, length, and diameter of the fruit in the Brazilian Amazon, larger and more elongated sweet “pimenta-de-cheiro” C. chinense are preferred by consumers. Consequently, the producer can benefit from better prices with the appropriate fruit pattern. As commercialization is based on weight, larger and heavier fruits achieve a better return for the producer. Thus, it is noteworthy to identify genotypes with a higher TFW and larger fruits that are more elongated and have a higher MFW.
A thicker fruit wall improves the resistance to damage during transportation or handling, since crushed or cracked fruits lose their value. Therefore, FWTh is also a desirable trait for selection. The genotypes SGC-XI, MAO-III, and MAO-IX were highlighted in relation to fruit wall thickness, being the only ones with values above 2 mm. For seed size, no significant difference was detected among the genotypes, with an average value of 3.54 mm.
The results of the fruit yield and traits of the plants showed that it is possible to select more productive genotypes with better quality fruits. This represents improved income for the producer due to the increased production volume and the potentially higher price of fruits classified as better quality according to the market’s preference. For yield and fruit traits, the genotypes MAO III and ORX II seem the most promising for selection and release of future cultivars. Other genotypes also have both high yield and good fruit traits, enabling the establishment of a base population of the species for breeding with sufficient variability for continuous gains with selection. The genotypic and phenotypic characterization of variability to select promising accessions has been reported in other C. chinense studies [2,5,6,17,31,32,33].
“Pimenta-de-cheiro” C. chinense has distinctive aroma in different environments, from the most rustic to those grown in the Amazon. It is considered a rustic species that survives in different conditions. Bianchi et al. [5] features raise the hypothesis that sweet peppers have great potential for use in the mitigation of the effects of ongoing climate changes, whether in breeding programs for gene introgression or for immediate use because plants lose their leaves during the time they are flooded. Hence, when the soil dries, there is regrowth, thereby characterizing them as perennials, which differentiates them from peppers from other Brazilian regions.
The “pimenta-de-cheiro” C. chinense of different varieties is an important quality for consumer’s choice in selecting what fruits to buy. The changes in aroma concentration in the fruits of C. chinense have not been measured, as with capsaicin and capsaicinoids contents. Additionally, a gap could be filled in future studies with geographical expansion of the genotypes on different environments in Brazil. Estimation of the concentration and composition of aroma at different experimental locations is the most vital information for the prediction of the site for future commercial cultivation of the species [12].

3.2. Plot Size for Evaluations off “Pimenta-de-Cheiro” C. chinense Fruits

To reduce both labor costs and the time needed to characterize “pimenta-de-cheiro” C. chinense fruits without waiving reliable estimates, sample sizing analyses for fruits of the species were carried out. In general, the measures of central tendency, variability, asymmetry, and the Lilliefors test showed good adherence of the data to the normal distribution for the evaluated traits, reinforcing the credibility of the study of sample sizing (Table 3). Generally, it may be inferred that the database offers reliability for the proposed study, and the sample sizes determined serve as reference for the culture [34]. The only exception was DLR in accession MAN-I. In this case, only the number of samples indicated by the simulation analysis with data reset should be taken into consideration, of which is little sensitivity due to the lack of data normality.
Estimates of minimum sample sizes varied between the traits and between genotypes with different fruit forms for the same trait (Table 3). The environmental variations and phenotypic variability observed among the genotypes could explain these results, as Schmildt et al. [35] observed in a study of four cultivars of papaya. For the authors, the optimal size required differs among cultivars, between variables, and between planting seasons, with the largest number of plants required for the variable number of fruits per plant and yield per plant. In different passionfruit varieties during the same planting time, different plot size requirements among the variables and genotypes have also been found [36]. On evaluations of maize, the sample size required for estimating the direct effects varied between hybrids and harvests [37]. Aside from the above factors, the use of different estimation methodologies, types of path analysis, explanatory variables, and accuracy levels led to different recommendations of sample sizes [37,38].
Considering that the mean sample size generally contemplates a greater number of cases, one can choose the highest average number of sample sizes among the observed traits. Thus, samples of 25 fruits adequately represent the genotypes for evaluations of their weight, length, diameter, and shape (by the length to diameter ratio) based on the methodology of resampling of subsamples. These values are higher than those recommended by Da Silva et al. [39] for species of the genus Capsicum, who recommended about 22 sample fruits for estimating the mean of pepper fruit traits, whereas 24 fruits should be sufficient to estimate the standard deviation.
The definition of the number of samples recommended by the algebraic methodology (of semi-amplitudes of the confidence interval of the mean) is more sensitive to changes in coefficients of variation (CV) observed in the different genotypes and traits. Thus, features estimated with less precision will require a larger sample size for evaluation [34]. The CV varied from 6.25% for fruit diameter in genotype TAB-V to 20.83% for fruit weight in genotype MAN-I. For these traits and genotypes, the recommended number of samples is 6 and 71 fruits respectively, more dissimilar values than those indicated in the previous methodology (by simulation). However, when observing the errors associated with 40 fruits to evaluate morphological traits, if the researcher is willing to accept an estimation error of up to 6.6%, then 40 fruits would be a good indication of sample size.
In general, based on the two study methodologies, the use of 25 to 40 fruits can be recommended for their biometric characterization, with error estimates close to 5% for most of the evaluated scenarios. Different sample sizes are expected due to the variability between the traits evaluated and researchers should evaluate the appropriate sample sizing according to the availability of time, resources, and tolerable error limit [37,38].
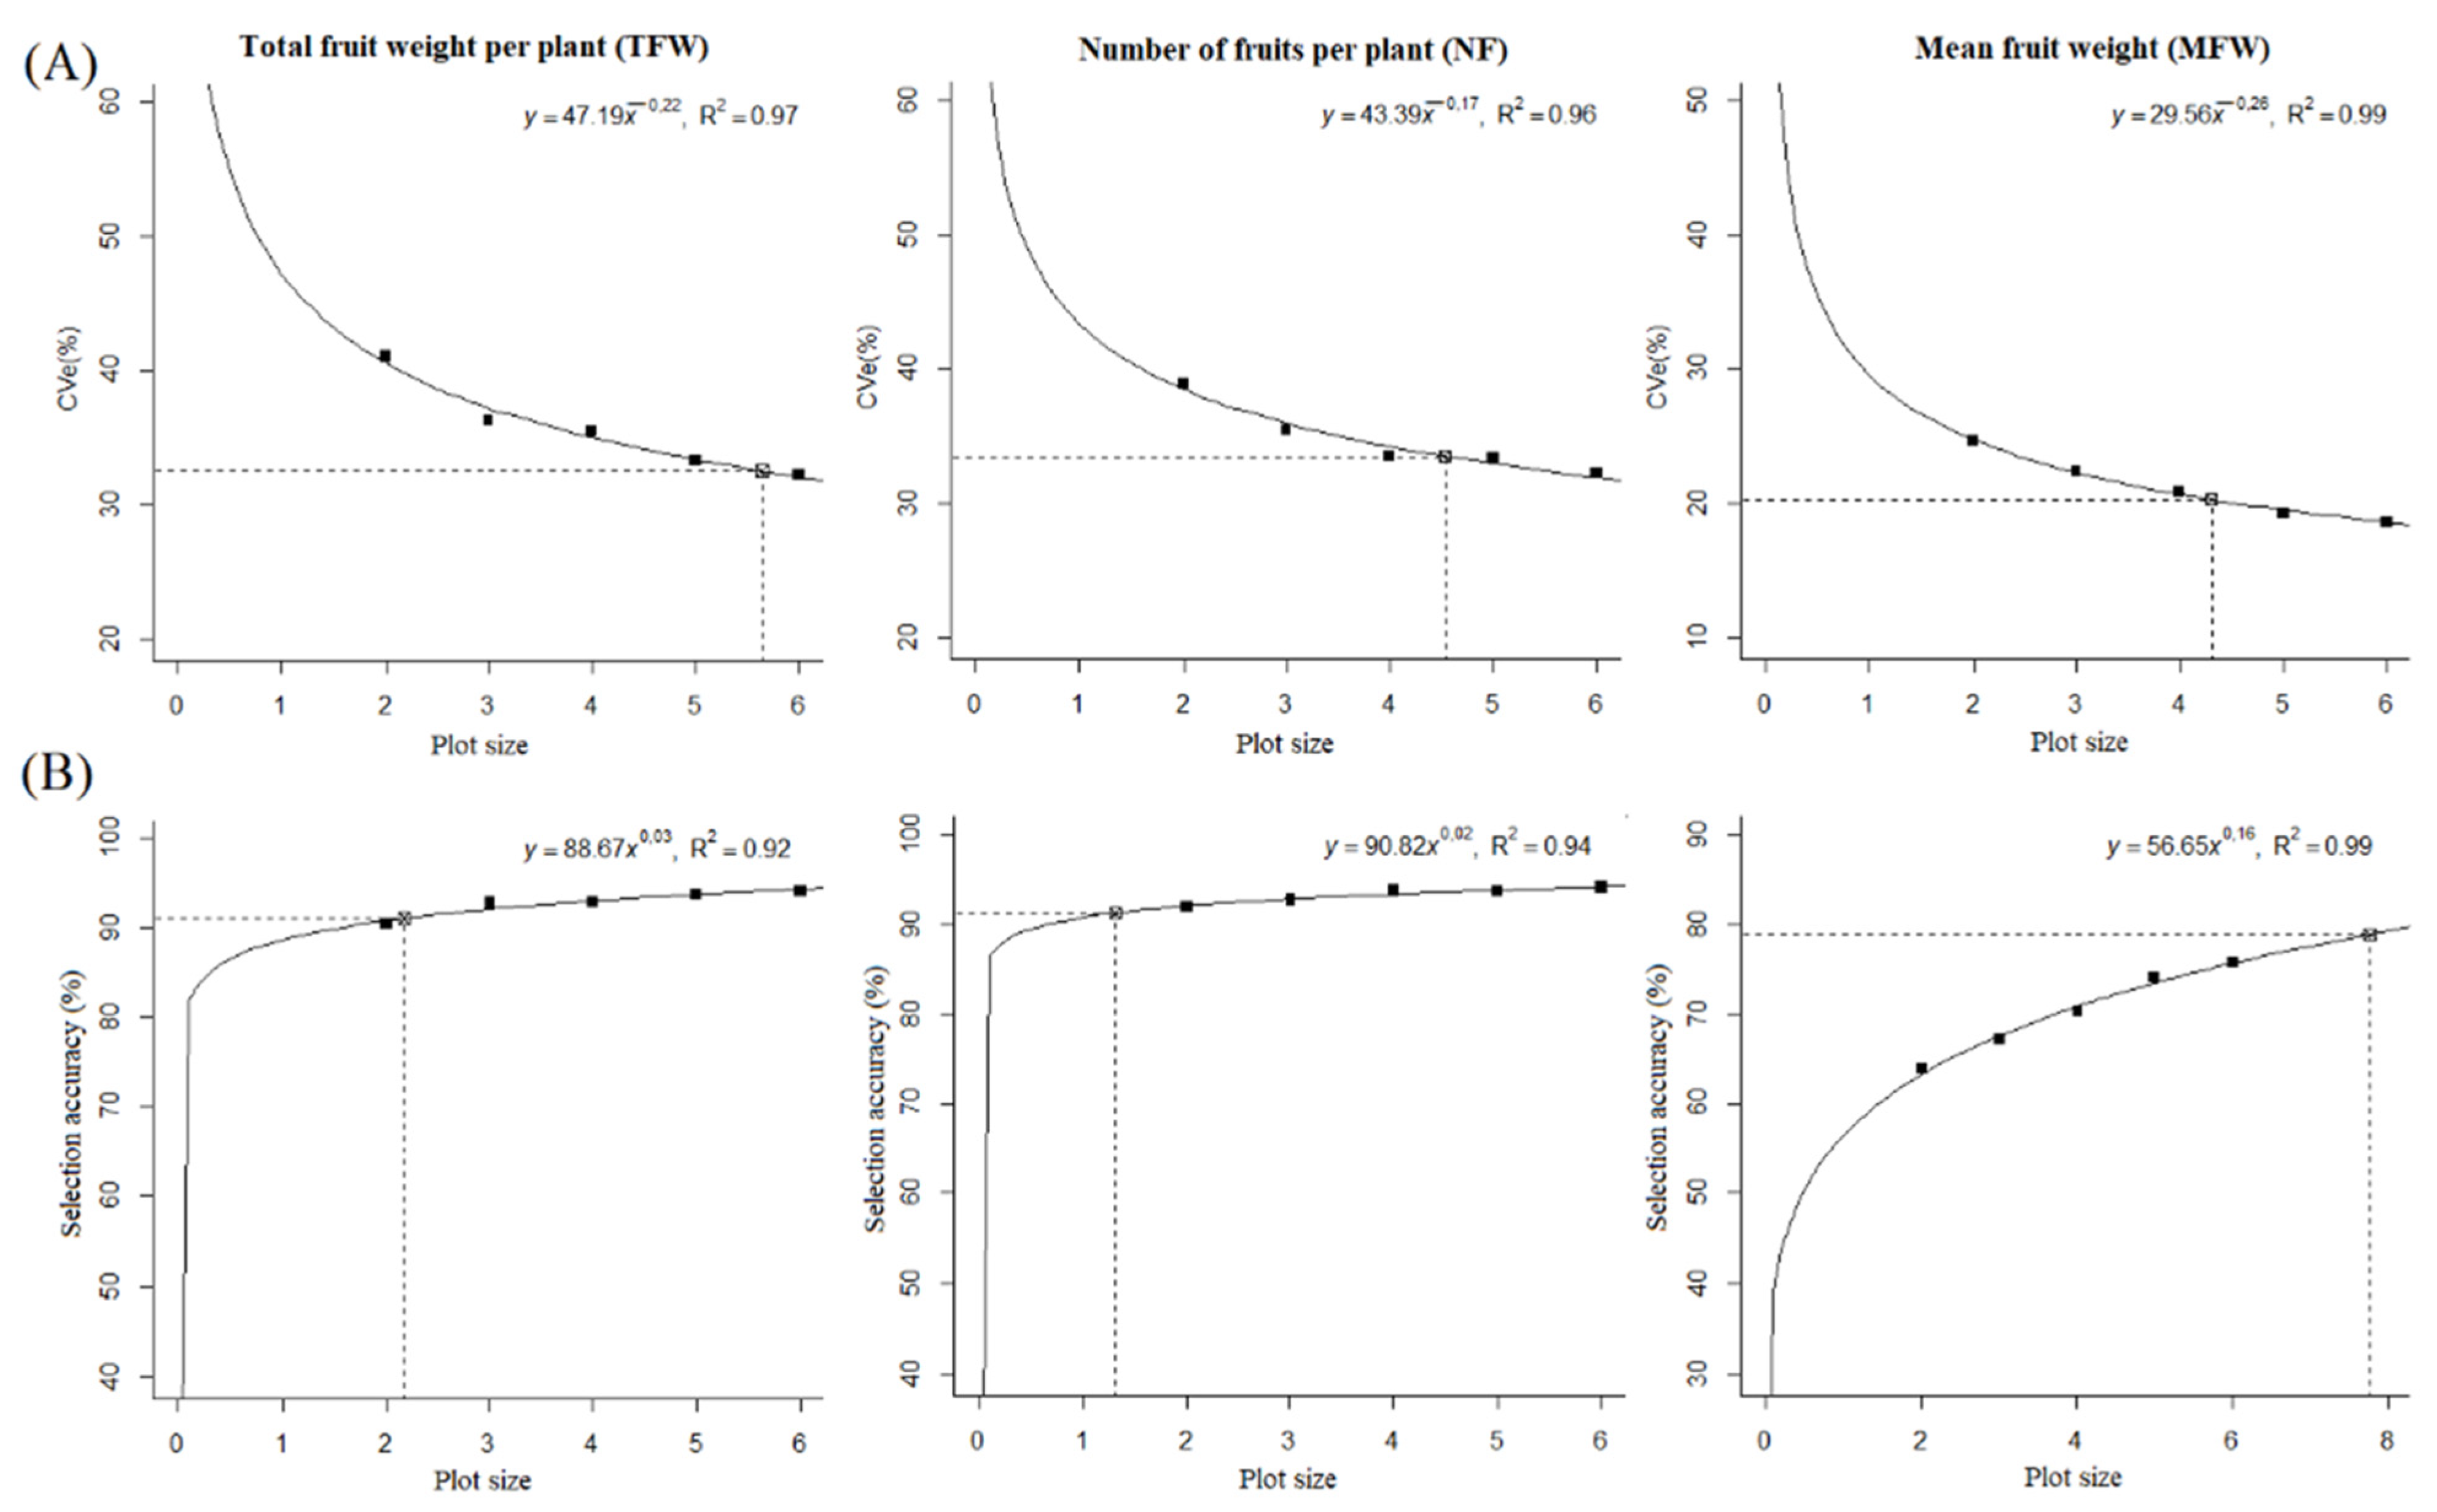
In addition to the analysis of sample size optimization for fruit traits in “pimenta-de-cheiro” C. chinense, studies were carried out to optimize the plot size based on the coefficient of variation and accuracy of selection for yield traits. For the plot size based on the experimental coefficient of variation, five plants per plot for future experiments with “pimenta-de-cheiro” C. chinense was recommended (Figure 4A). However, to obtain coefficients of variation close to or below 30% for TFW and NF, according to the models obtained, a minimum of eight plants per plot would be required. These values are lower than those estimated by Lorentz et al. [40] in an evaluation of the fresh weight of sweet pepper (Capsicum annuum L.) plants grown in a plastic greenhouse, where the use of 10 plants per plot was recommended.
The increase in the number of plants per plot was followed by increases in heritability, with values ranging from 81.75 to 88.59% for TFW, from 84.79 to 88.68% for NF and from 40.82 to 57 and 52 for MFW in plot sizes ranging from two to six plants, respectively. From the point of view of genetic breeding and the selection of superior genotypes for the traits TFW and NF, a plot size of only two plants would be enough to optimize selection accuracy to >90% (Figure 4B). For mean fruit weight, the recommendation would be five or eight plants per plot for accuracy close to 70% and 80%, respectively.
According to our results, five to eight plants per experimental plot will provide satisfactory results both with the aim of optimizing experimental precision and providing an accurate selection process for yield traits in “pimenta-de-cheiro” C. chinense. The optimal sunflower (Helianthus annuus) plot size was found to be two units [41], the optimal eggplant (Solanum melongena L.) plot size is five plants [19], and the optimal plot size for field papaya experiments is six plants per plot [35]. In breeding programs, the results need to be accurate in order to make selections without making plots unnecessarily large, resulting in higher costs [22].

4. Conclusions

The genotypes contain considerable phenotypic variability for flower, fruit and yield traits. This allows for the selection of genotypes with a superior performance to possibly establish a base collection for breeding and development of future commercial cultivars of “pimenta-de-cheiro” C. chinense morphotypes to improve the economic return for producers.
Based on the methodologies used to define the sample size, 25 to 40 fruits should be sampled in biometric traits evaluations of “pimenta-de-cheiro” C. chinense. The adoption of experiments with five to eight plants per plot is recommended for progeny tests in C. chinense, combining experimental precision with high selection accuracy for the traits total fruit weight per plant, number of fruits per plant, and mean fruit weight.

Author Contributions

Conceptualization, S.R.M.A., R.L. and M.T.G.L.; methodology, S.R.M.A., R.L., M.S.F.V., C.M. and M.T.G.L.; software, M.S.F.V. and S.F.R.; validation, C.C.M. and L.C.; formal analysis, C.C.M. and I.O.; investigation, S.R.M.A., I.O. and L.C.; resources, C.C.M. and S.F.R.; data curation, S.F.R.; writing—original draft preparation, M.T.G.L.; writing—review and editing, C.M., T.d.J.P.F. and M.T.G.L.; supervision, T.d.J.P.F. and R.L.; project administration, R.L.; funding acquisition, R.L., C.M. and M.T.G.L. All authors have read and agreed to the published version of the manuscript.

Funding

The research has the financial support of the Conselho Nacional de Desenvolvimento Científico e Tecnológico (CNPq) process n° 313075/2021-2 and the Foundation for Research Support of the State of Amazonas (FAPEAM) finance code 001. This study was financed in part by the State University of Paraiba grant 003/2022/PRPGP. This study was financed in part by the Coordenação de Aperfeiçoamento de Pessoal de Nível Superior—Brazil (CAPES)—Finance Code 001.

Institutional Review Board Statement

Not applicable.

Informed Consent Statement

Not applicable.

Acknowledgments

Silfran Rogério Marialva Alves was supported by a scholarship from CNPq. Izamara Oliveira was supported by a scholarship from CAPES (Finance Code 001). Cibele Chalita Martins, Therezinha de Jesus Pinto Fraxe (Process n° 303760/2020-6), Carlos Henrique Salvino Gadelha Meneses (Process n° 313075/2021-2), and Maria Teresa Gomes Lopes (Process n° 310307/2018-0) were supported by fellowships from CNPq.

Conflicts of Interest

The authors declare no conflict of interest.

References

  1. García, C.C.; Sehr, E.M.; Barfuss, M.H.J.; Barboza, G.E.; Samuel, R.; Moscone, E.A.; Ehrendorfer, F. Phylogenetic relationships, diversification and expansion of chili peppers (Capsicum, Solanaceae). Ann Bot. 2016, 118, 35–51. [Google Scholar]
  2. Moreira, A.F.P.; Ruas, P.M.; Ruas, C.D.F.; Baba, V.Y.; Giordani, W.; Arruda, I.M.; Rodrigues, R.; Gonçalves, L.S.A. Genetic diversity, population structure and genetic parameters of fruit traits in Capsicum chinense. Sci. Hortic. 2018, 236, 1–9. [Google Scholar]
  3. Barboza, G.E.; García, C.C.; González, S.L.; Scaldaferro, M.; Reyes, X. Four new species of Capsicum (Solanaceae) from the tropical Andes and an update on the phylogeny of the genus. PLoS ONE 2019, 14, e0209792. [Google Scholar]
  4. Barboza, G.E.; de Bem Bianchetti, L.; Stehmann, J.R. Capsicum carassense (Solanaceae), a new species from the brazilian atlantic forest. PhytoKeys 2020, 140, 125–138. [Google Scholar]
  5. Bianchi, P.A.; da Silva, L.R.A.; da Silva Alencar, A.A.; Araújo Diniz Santos, P.H.; Pimenta, S.; Sudré, C.P.; Corte, L.E.D.; Azeredo Gonçalves, L.S.; Rodrigues, R. Biomorphological characterization of brazilian Capsicum chinense Jacq. germplasm. Agronomy 2020, 10, 447. [Google Scholar]
  6. de Aguiar, A.C.; Coutinho, J.P.; Barbero, G.F.; Godoy, H.T.; Martínez, J. Comparative study of capsaicinoid composition in Capsicum peppers grown in Brazil. Int. J. Food Prop. 2016, 19, 1292–1302. [Google Scholar]
  7. Oney-Montalvo, J.E.; Avilés-Betanzos, K.A.; Jesús Ramírez-Rivera, E.D.; Ramírez-Sucre, M.O.; Rodríguez-Buenl, I.M. Polyphenols content in Capsicum chinense fruits at different harvest times and their correlation with the antioxidant activity. Plants 2020, 9, 1394. [Google Scholar]
  8. Camposeco-Montejo, N.; Flores-Naveda, A.; Ruiz-Torres, N.; Álvarez-Vázquez, P.; Niño-Medina, G.; Ruelas-Chacón, X.; Torres-Tapia, M.A.; Rodríguez-Salinas, P.; Villanueva-Coronado, V.; García-López, J.I. Agronomic performance, capsaicinoids, polyphenols and antioxidant capacity in genotypes of habanero pepper grown in the southeast of Coahuila, Mexico. Horticulturae 2021, 7, 372. [Google Scholar]
  9. Martínez-Ispizua, E.; Martínez-Cuenca, M.R.; Marsal, J.I.; Díez, M.J.; Soler, S.; Valcárcel, J.V.; Calatayud, Á. Bioactive compounds and antioxidant capacity of valencian pepper landraces. Molecules 2021, 26, 1031. [Google Scholar]
  10. Chel-Guerrero, L.D.; Castañeda-Corral, G.; López-Castillo, M.; Scampicchio, M.; Morozova, K.; Oney-Montalvo, J.E.; Ferrentino, G.; Acevedo-Fernández, J.J.; Rodríguez-Buenfil, I.M. In vivo anti-inflammatory effect, antioxidant activity, and polyphenolic content of extracts from Capsicum chinense by-products. Molecules 2022, 27, 1323. [Google Scholar]
  11. Cruz, J.G.; Silveira, T.; Richter, V.; Wagner, J.G.; Neitzke, R.S.; Barbieri, R.L.; Vizzotto, M. Genetic variability of bioactive compounds in Capsicum chinense. Food Sci. Technol. 2022, 42, e123721. [Google Scholar]
  12. Joshi, D.D.; Somkuwar, B.G.; Kharkwal, H.; Chander, S. Aroma based varieties of Capsicum chinense Jacq., geographical distribution and scope for expansion of the species. J. Appl. Res. Med. Aromat. Plants 2022, 29, 100379. [Google Scholar]
  13. Van Zonneveld, M.; Ramirez, M.; Williams, D.E.; Petz, M.; Meckelmann, S.; Avila, T.; Bejarano, C.; Ríos, L.; Peña, K.; Jäger, M.; et al. Screening genetic resources of Capsicum peppers in their primary center of diversity in Bolivia and Peru. PLoS ONE 2015, 10, e0134663. [Google Scholar]
  14. Sudré, C.P.; Gonçalves, L.S.A.; Rodrigues, R.; Do Amaral, A.T.; Riva-Souza, E.M.; Bento, C.D.S. Genetic variability in domesticated Capsicum spp. as assessed by morphological and agronomic data in mixed statistical analysis. Genet. Mol. Res. 2010, 9, 283–294. [Google Scholar]
  15. Oliveira, A.C.R.; Cecon, P.R.; Nascimento, M.; Finger, F.; Pereira, G.; Puiatti, G.A. Genetic divergence between pepper accessions based on quantitative fruit traits. Científica 2019, 47, 83–90. [Google Scholar] [CrossRef]
  16. Uncu, A.T. Genome-wide identification of Simple Sequence Repeat (SSR) markers in Capsicum chinense Jacq. with high potential for use in pepper introgression breeding. Biologia 2019, 74, 119–126. [Google Scholar]
  17. Nimmakayala, P.; Lopez-Ortiz, C.; Shahi, B.; Abburi, V.L.; Natarajan, P.; Kshetry, A.O.; Shinde, S.; Davenport, B.; Stommel, J.; Reddy, U.K. exploration into natural variation for genes associated with fruit shape and size among Capsicum chinense collections. Genomics 2021, 113, 3002–3014. [Google Scholar] [PubMed]
  18. Koumanov, K.S. Sample size determination in horticultural research: An empirical approach. Sci. Hortic. 2017, 225, 416–421. [Google Scholar] [CrossRef]
  19. Krysczun, D.K.; Lúcio, A.D.; Sari, B.; Diel, M.I.; Olivoto, T.; Santana, C.S.; Ubessi, C.; Schabarum, D.E. Sample size, plot size and number of replications for trials with Solanum melongena L. Sci. Hortic. 2018, 233, 220–224. [Google Scholar]
  20. de Souza, R.R.; Toebe, M.; Marchioro, V.S.; Cargnelutti Filho, A.; Lúcio, A.D.C.; Benin, G.; Mello, A.C.; de Lima Tartaglia, F.; Manfio, G.L. Soybean yield variability per plant in subtropical climate: Sample size definition and prediction models for precision statistics. Eur. J. Agron. 2022, 136, 126489. [Google Scholar]
  21. Coelho, A.A.; Oliveira, E.M.S.; Resende, E.D.; Thiébaut, J.T.L. Dimensionamento amostral para a caracterização da qualidade pós-colheita do maracujá-amarelo. Rev. Ceres 2011, 58, 23–28. [Google Scholar] [CrossRef]
  22. Stockem, J.E.; Korontzis, G.; Wilson, S.E.; de Vries, M.E.; van Eeuwijk, F.A.; Struik, P.C. Optimal plot dimensions for performance testing of hybrid potato in the field. Potato Res. 2022, 65, 417–434. [Google Scholar]
  23. Filgueira, F.A.R. Novo Manual de Olericultura: Agrotecnologia Moderna na Produção e Comercialização de Hortaliças; Editora UFV: Viçosa. Brazil, 2000; 402p. [Google Scholar]
  24. IPGRI. Descriptors for Capsicum (Capsicum spp.); International Plant Genetic Resources Institute: Rome, Italy, 1995; 49p. [Google Scholar]
  25. Gower, J.C. A general coefficient of similarity and some of its properties. Biometrics 1971, 27, 857. [Google Scholar]
  26. Kovach, W.L. A Multivariate Statistical Package for Windows, ver 3.1; Kovach Computing Services: Pentraeth, UK, 1999. [Google Scholar]
  27. Cruz, C.D. GENES—Software para análise de dados em estatística experimental e em genética quantitativa. Acta Sci.-Agron. 2013, 35, 271–276. [Google Scholar]
  28. Meier, V.D.; Lessman, K.J. Estimation of optimum field plot shape and size for testing yield in Crambe abyssinica Hochst. Crop Sci. 1971, 11, 648–650. [Google Scholar] [CrossRef]
  29. Moses, M.; Umaharan, P.; Dayanandan, S. Microsatellite Based Analysis of the Genetic structure and diversity of Capsicum chinense in the neotropics. Genet. Resour. Crop Evol. 2014, 61, 741–755. [Google Scholar]
  30. Brilhante, B.D.G.; Santos, T.d.O.; Santos, P.H.A.D.; Kamphorst, S.H.; Neto, J.D.S.; Rangel, L.H.; Valadares, F.V.; de Almeida, R.N.; Rodrigues, R.; Júnior, A.C.S.; et al. Phenotypic and molecular characterization of brazilian Capsicum germplasm. Agronomy 2021, 11, 854. [Google Scholar]
  31. Jarret, R.L.; Berke, T. Variation for fruit morphological characteristics in a Capsicum chinense Jacq. Germplasm Collection. HortScience 2008, 43, 1694–1697. [Google Scholar]
  32. Luitel, B.P.; Ro, N.Y.; Ko, H.C.; Sung, J.S.; Rhee, J.H.; Hur, O.S. Phenotypic variation in a germplasm collection of pepper (Capsicum chinense Jacq.) from Korea. J. Crop Sci. Biotechnol. 2018, 21, 499–506. [Google Scholar]
  33. Silva, R.; Silva, C.; Francisco, C.; Isabel, S.; Carvalho, C.; De Rodrigues, I.; Da Silva Filho, J.G.; Trevisan Braz, L.; Beckercd, F.J.; Reifschneider, B. New Brazilian lines of Habanero pepper Capsicum chinense: Morpho-Agronomic and biochemical characterization in different environments. Sci. Hortic. 2019, 261, 108941. [Google Scholar]
  34. Toebe, M.; Machado, L.N.; Tartaglia, F.L.; de Carvalho, J.O.; Bandeira, C.T.; Filho, C.A. Sample size for estimating mean and coefficient of variation in species of Crotalarias. An. Acad. Bras. 2018, 90, 1705–1715. [Google Scholar] [CrossRef] [PubMed]
  35. Schmildt, E.R.; Schmildt, O.; Cruz, C.D.; Cattaneo, L.F.; Ferreguetti, G.A. Optimum plot size and number of replications in papaya field experiment. Rev. Bras. Frutic. 2016, 38. [Google Scholar] [CrossRef]
  36. Storck, L.; Lúcio, A.D.; Krause, W.; De Araújo, D.V.; Silva, C.A. Scaling the number of plants per plot and number of plots per genotype of yellow passion fruit plants. Acta Sci. Agron. 2014, 36, 73. [Google Scholar] [CrossRef]
  37. Toebe, M.; Cargnelutti Filho, A.; Lopes, S.J.; Burin, C.; Silveira TR, D.; Casarotto, G. Sample size in the estimation of correlation coefficients for corn hybrids in crops and accuracy levels. Bragantia 2015, 74, 16–24. [Google Scholar] [CrossRef]
  38. Toebe, M.; Cargnelutti Filho, A.; Storck, L.; Lúcio, A.D. Sample size for estimation of direct effects in path analysis of corn. Genet. Mol. Res. 2017, 16, 11018–11756. [Google Scholar] [CrossRef] [PubMed]
  39. da Silva, A.R.; Hilário, R.F.; do Rêgo, E.R.; do Nascimento, N.F.F.; dos Santos Dias, C.T.; de Lima, R.P. A Multivariate Approach to determine sample size for morphological characterization of pepper fruits. Aust. J. Crop Sci. 2015, 9, 1064–1068. [Google Scholar]
  40. Lorentz, L.H.; Lúcio, A.D. Plot size and shape for chili pepper in plastic greenhouse. Cienc. Rural 2009, 39, 2380–2387. [Google Scholar] [CrossRef]
  41. Lohmor, N.; Khan, M.; Kapoor, K.; Bishnoi, S. Estimation of optimum plot size and shape from a uniformity trial for field experiment with sunflower (Helianthus Annuus) crop in soil of hisar. Int. J. Plant Soil Sci. 2017, 15, 1–5. [Google Scholar] [CrossRef]
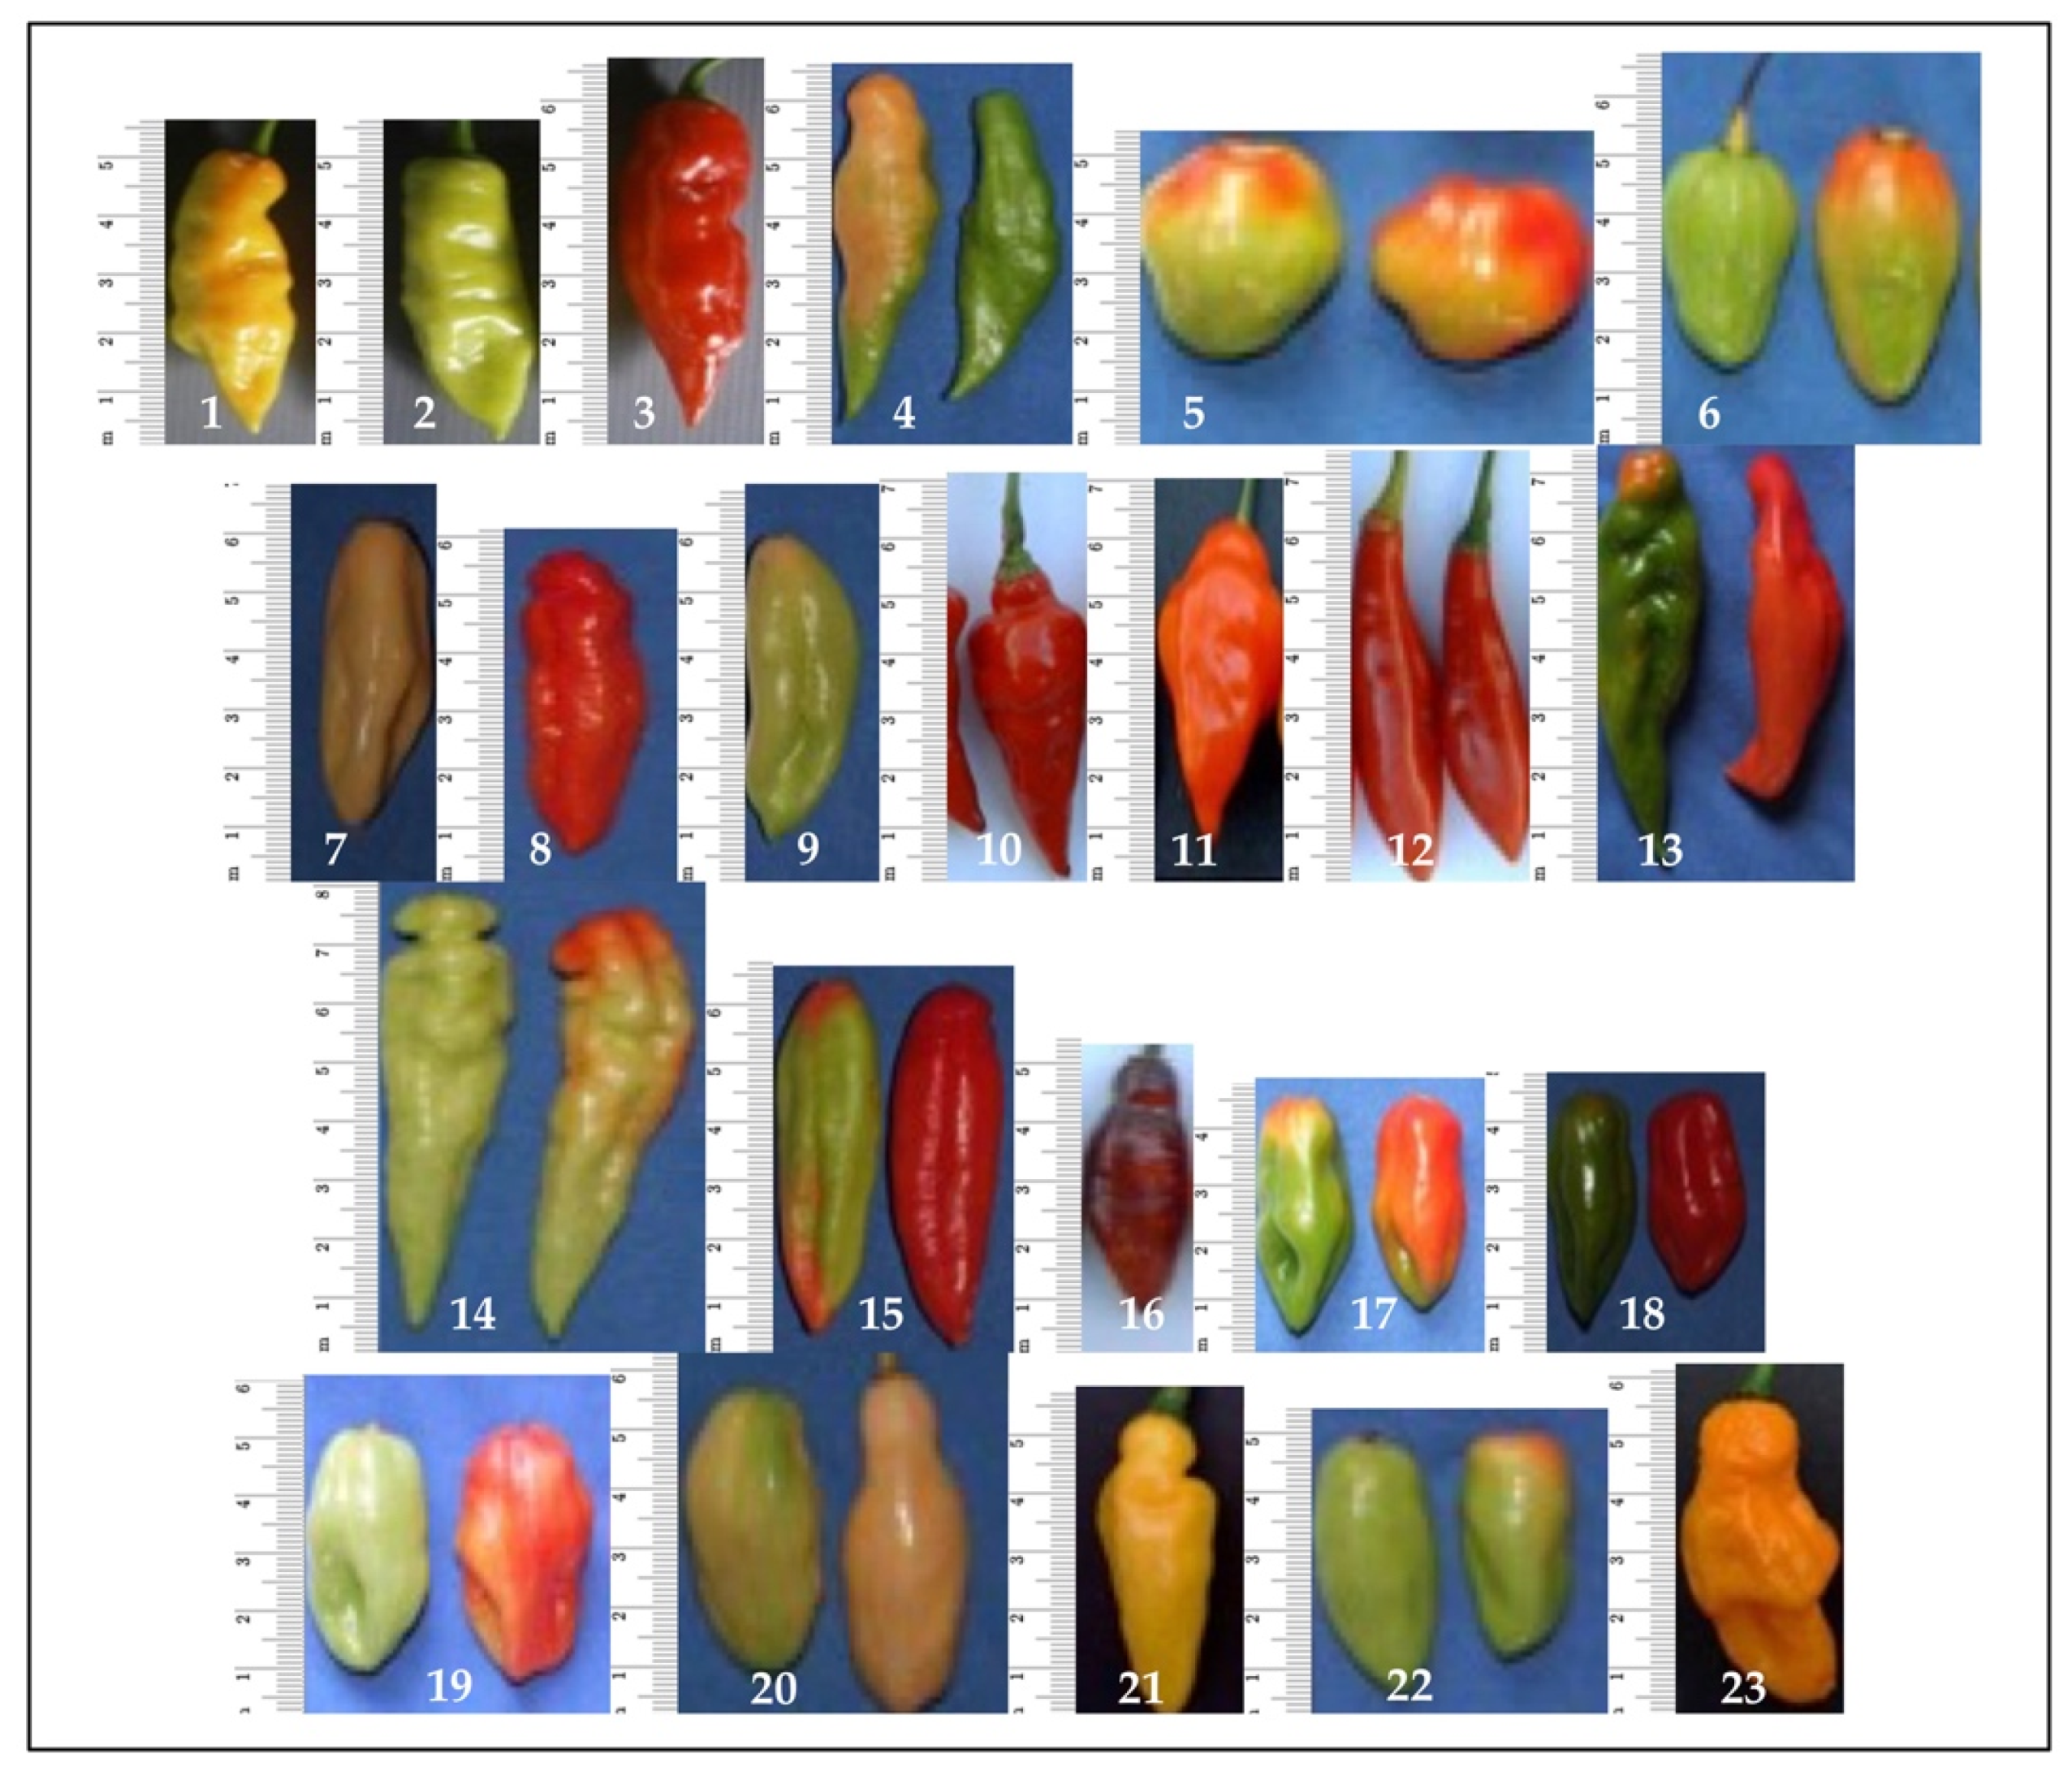
Figure 1. Samples of fruits from a plot the cultivated Capsicum chinense of Northern Brazil varieties: 1—BEN-III, 2—BEN-IV, 3—DBI-I, 4—GUA-I, 5—MAN-I, 6—MAN-II, 7—MAO-III, 8—MAO-VII, 9—MAO-IX, 10—MPR-III, 11—MPR-V, 12—ORX-2, 13—ORX-I, 14—ORX-II, 15—ORX-IV, 16—ORX-V, 17—RPE-V, 18—SGC-XI, 19—SGC-XVIII, 20—TAB-I, 21—TAB-II, 22—TAB-III, and 23—TAB-V.
Horticulturae 08 00785 g001
Figure 2. Hierarchical clustering by the UPGMA method and Gower general similarity coefficient of 23 C. chinense genotypes, evaluated by 21 morphological descriptors. Cophenetic correlation = 0.6623. The dashed vertical line represents the estimated cut by the Mojema method.
Horticulturae 08 00785 g002
Figure 3. Graphical dispersion obtained by principal coordinate analysis (PCA) on the first two axes of 23 genotypes of Capsicum chinense, characterized by 21 morphological descriptors. The colors that delimit the genotypes correspond to groups identified in Figure 2: orange, group 1; green, group 2; purple, group 3A; blue, group 3B; and red, group 3C.
Horticulturae 08 00785 g003
Figure 4. Coefficient of experimental variation—CVe (A) and selection accuracy (B) by the modified method of maximum curvature as a function of different plot sizes for experiments with “pimenta-de-cheiro” Capsicum chinense. The squares represent the points that generated curvature (equation). The meeting of the dashed lines represent the points of maximum curvature.
Horticulturae 08 00785 g004
Table 1. Values of 21 morphological descriptors evaluated in 23 genotypes of Capasicum chinense Jacq. from shops and markets in Amazonas, Pará and Rondônia.
GenotypesTrait 1
CMCACIFCMFCFShFLFDFWPLFWThOFIPNFBFTShAFTCCSNLFSPUGARMSSNS
BEN-III318544242230105331352
BEN-IV217444242240207332252
DBI-I318844242240107331252
GUA-I319514242240105341152
MAN-I304753342230105321252
MAN-II308564342230215441253
MAO-III218544252330305321353
MAO-VII218844242230105321353
MAO-IX3121354242330203322252
MPR-III314934242230207322353
MPR-V204844242230317332352
ORX-2314614242220315321353
ORX-I214814242210105331353
ORX-II314814252231317331252
ORX-IV314814242220105231252
ORX-V317544231230313311252
RPE-V319344242230317332252
SGC-XI214844351330305332353
SGC-XVIII214844242210307322153
TAB-I319544243230307321252
TAB-II219334241210105321252
TAB-III318544242230317321352
TAB-V218544241230305321352
1 CM—calyx margin, CAC—calyx annular constriction, IFC—fruit color at intermediate maturity, MFC—fruit color at maturity, FSh—fruit shape; FL—fruit length; FD—fruit diameter; FW—fruit weight; PL—peduncle length; FWTh—fruit wall thickness; OFIP—fruit shoulder at pedicel insertion; NFB—neck at fruit base; FTSh—fruit tip shape; AFT—appendage at the fruit tip; CCS—corrugated cross section of the fruit; NL—number of locules; FS—fruit surface; PUG—pungency; ARM—aroma; SS—seed size; and NS—number of seeds per fruit.
Table 2. Means of the traits total fruit weight per plant (TFW), number of fruits per plant (NF) and mean fruit weight (FW), evaluated in 25 weekly harvests, fruit length (FL), fruit diameter (FD), fruit length to diameter ratio (DLR), fruit wall thickness (FWTh) and seed size (SS) were evaluated in a sample of 15 fruits per plot of 23 “pimenta-de-cheiro” C. chinense genotypes.
GenotypesTFW (g)NF (n)FW (g)FL (mm)FD (mm)DLRFWTh (mm)SS (mm)
BEN-III1504.7 c208.5 d7.2 b49.5 c20.1 c2.5 b1.3 c3.4 a
BEN-IV1850.7 c275.7 d6.7 b49.4 c20.7 c2.4 b1.5 c3.4 a
DBI-I1760.1 c242.0 d7.4 b58.9 b22.3 c2.6 b1.5 c3.5 a
GUA-I6077.4 a1123.0 a5.4 b57.6 b19.6 c2.9 a1.8 b3.5 a
MAN-I3893.0 b547.2 c7.2 b32.1 e32.4 a1.0 e1.8 b3.5 a
MAN-II3790.4 b530.3 c7.3 b42.3 d26.5 b1.6 d1.8 b3.5 a
MAO-III5244.0 a469.2 c11.2 a58.5 b24.1 c2.4 b2.1 a3.7 a
MAO-VII4351.8 b450.7 c9.6 a52.8 c23.8 c2.2 c1.8 b3.7 a
MAO-IX4795.3 b467.7 c10.4 a51.3 c23.0 c2.2 c2.1 a3.7 a
MPR-III6404.9 a679.6 b9.4 a56.0 b24.9 b2.2 c1.7 b3.8 a
MPR-V6717.4 a779.0 b8.6 a58.2 b22.8 c2.6 b1.8 b3.5 a
ORX-23995.9 b488.8 c8.2 a68.7 a22.5 c3.0 a1.6 c3.6 a
ORX-I4338.8 b508.0 c8.6 a68.5 a21.7 c3.2 a1.4 c3.4 a
ORX-II7029.9 a750.7 b9.3 a75.1 a23.1 c3.2 a1.7 b3.8 a
ORX-IV2306.9 c284.1 d8.0 b62.2 b20.6 c3.1 a1.6 c3.8 a
ORX-V1284.1 c190.0 d7.4 b49.2 c19.9 c2.5 b1.3 c3.7 a
RPE-V1933.0 c342.1 d6.3 b46.0 c21.3 c2.2 c1.4 c3.1 a
SGC-XI5530.6 a664.0 b8.6 a49.1 c25.5 b1.9 c2.1 a3.6 a
SGC-XVIII5342.3 a617.9 b8.8 a47.3 c24.8 b1.9 c1.7 b3.4 a
TAB-I2062.7 c267.8 d8.6 a62.9 b22.8 c2.8 b1.6 c3.4 a
TAB-II1734.6 c196.5 d8.3 a42.2 d21.8 c1.9 c1.4 c3.5 a
TAB-III1243.5 c182.4 d7.1 b41.8 d22.2 c1.9 c1.5 c3.6 a
TAB-V2793.6 c340.0 d7.8 b53.0 c21.9 c2.4 b1.3 c3.5 a
Mean3738.5461.18.253.623.02.42.43.5
Means followed by the same letter did not differ from each other by the Scott-Knott test at 5% probability.
Table 3. Minimum and maximum values, arithmetic mean, standard deviation (SD), coefficient of variation (CV%), asymmetry (AS), kurtosis + 3 (CT), Lilliefors’ normality test, and recommended fruit sample size (based on simulation—n1 and semi-amplitudes of the confidence interval—n2) for the estimation of mean fruit weight (FW), fruit length (FL), diameter (FD), and diameter length ratio (DLR) of “pimenta-de-cheiro” C. chinense at 95%, reliability and semi-amplitude of the confidence interval (% Error) based on 40 evaluated fruits.
StatisticMPR-V GenotypeMAN-I GenotypeTAB-V Genotype
FWFLFDDLRFWFLFDDLRFWFLFDDLR
Minimum5.8148.6717.271.694.2321.6419.730.794.6336.2218.621.70
Mean8.0460.9223.742.616.4327.7231.390.886.5256.1521.782.59
Maximum9.8874.5729.344.078.6035.4036.801.008.7967.6125.443.36
SD0.986.442.960.441.344.293.430.070.907.301.360.39
CV (%)12.2110.5712.4517.0520.8315.4610.938.3013.8112.996.2515.13
AS (1)−0.19 ns−0.03 ns−0.27 ns0.73 **−0.36 ns0.16 ns−1.06 **0.39 ns0.03 ns−0.57 ns0.28 ns−0.13 ns
CT (2)2.73 ns2.18 ns2.50 ns4.85 **2.41 ns2.12 ns5.15 **1.71 ns2.38 ns2.90 ns3.57 ns3.00 ns
Lilliefors (3)0.04 ns0.06 ns0.04 ns0.03 ns0.07 ns0.09 ns0.06 ns0.23 **0.09 ns0.06 ns0.03 ns0.05 ns
n1192322212422161820252320
n224182548713920113128637
Error (%)3.903.383.985.456.664.953.492.664.424.162.004.84
(1) ** Asymmetry differs from zero as determined by t-test (p = 0.01); ns = non-significant. (2) ** Kurtosis differs from three by the t test (p = 0.01); ns = non-significant. (3) ** Does not follow the normal distribution based on the Lilliefors test (p = 0.01); ns = normal distribution.
Publisher’s Note: MDPI stays neutral with regard to jurisdictional claims in published maps and institutional affiliations.