Abstract
Raspberries are considered valuable fruits due to their high levels of nutrients and phytochemicals, which have many beneficial effects on humans. As many external factors affect the composition of these fruits (the type of cultivation, soil characteristics, ripeness, storage time and post-harvest technologies, cultivar/genotype, and climatic conditions), the goal of this study was to analyze different raspberry cultivars grown in Norway. Considering that Norway is a country with specific climatic conditions, as well as has a limited period of fruit vegetation, another important goal of this study was also to compare raspberries from different Norwegian areas, as well as different grown cultivars. Modern analytical techniques, such as high-performance anion-exchange liquid chromatography with pulsed amperometric detection (HPEAC-PAD), ultra-high-performance liquid chromatography with diode array detector coupled to triple quadrupole mass spectrometry (UHPLC-DAD MS/MS), and inductively coupled plasma–optical emission spectrometry (ICP-OES), provided a detailed examination of the raspberry extract samples. Based on their high levels of minerals (especially N, P, and K), organic acids (predominantly citric and malic acids), sugars (glucose, fructose, sucrose, and galactose), and polyphenols (ellagic acid, syringic acid, quercetin, and rutin), Norwegian raspberries could be considered fruits with increased health-beneficial compounds. The chemical composition of the studied cultivars depended on the locality of growth.
1. Introduction
Raspberry (Rubus idaeus L.) belongs to the genus Rubus, which comprises 12 subgenera, more than 500 species, and thousands of cultivars. It is accepted that the place of origin of Rubus idaeus is the Ida Mountains in Turkey [1]. The domestication of raspberry started when the Romans spread it throughout Europe in the IV century. Its popularity increased by the 1500s, when its cultivation was all over Europe. Nowadays, the subgenus Idaeobatus (raspberries) is distributed in North America, Europe, Africa, and Asia, and it is the most commercially important one.
Rubus idaeus production is an important high-value horticultural industry in Europe (mostly in northern and central European countries) because it provides incomes directly from agriculture and indirectly from food processing and confectionery. The world raspberry production occurs on more than 127 k ha, bearing ~882 k tons, where Europe leads with nearly three-quarters of the total quantity of raspberries on an annual basis. Russia produces ~174 k tons, Mexico is in second place with ~129 k tons, and Serbia is in third place with ~120 k tons. Global raspberry production grew by 21.9% in the last five years [2,3].
Berry fruits, especially raspberries, are considered enjoyable, refreshing fruits with an outstanding taste and aroma that provide energy and contribute to a balanced diet. They are consumed as table fruit, but very often, they are sold as frozen (whole, crumble, and block), canned, or dried and are used for making raspberry puree and juice concentrate. They are considered to be a plant from nature’s treasure chests due to their high levels of many nutrients, including essential minerals (magnesium, potassium, copper, and iron), sugars, organic acids, vitamins, carotenoids, phenols, fatty acids, stilbenes (resveratrol), tannins, lignans, and dietary fibers [4,5,6,7,8].
The contents of nutrients and antioxidant capacity of raspberries depend on the type of cultivation, soil characteristics, ripeness, storage time, and post-harvest technologies, but the cultivar (genotype) seems to be the most important [9,10]. In general, late-season cultivars store much higher levels of phenolics than early-season cultivars, so some breeding programs are selecting genotypes with increased contents of beneficial compounds [11]. A changing climatic factor during the growth and ripening of raspberries (light intensity, photoperiod, temperature, wind, precipitation, and pests) can significantly affect the quality of fruits [12,13].
Raspberry fruits are an excellent source of vitamin C, which is known to strengthen the immune system and prevent colds, especially during the days of pandemia [14,15]. Its fruits are a good source of potentially health-promoting compounds because they contain diverse levels of carotenoids [16], unsaturated fatty acids (linoleic acid (18:2), α-linolenic acid (18:3), and oleic acid (18:1)), tocopherols (predominantly γ-tocopherol) [17,18], phenols (anthocyanins (derivatives of cyanidins), ellagitannins (sanguiin H-6 and lambertianin C) and ellagic acid, flavonoids (myricetin, cynarosid, resveratrol, quercetin, kaempferol, vitexin, rutin, and apigenin), tannins, lignans, phenolic acids, and stilbenes), which confer protection against oxidative stress and have cytoprotective activities [19]. Fruits show a wide range of effects, including antimutagenic, antimicrobial, anticancer, antidiabetic, anti-inflammatory, antioxidant, vasodilatory, and cardioprotective properties [20,21,22,23]. Natural phenols from raspberries show protective effects against metabolic disorders such as diabetes and obesity and against neurodegenerative diseases such as Alzheimer’s, Parkinson’s, or Huntington’s disease [24,25]. Raspberry juice reduces the growth of Salmonella enterica, Echerihia coli, and Staphylococcus aureus [26,27]. Besides all of these advantages, raspberry fruits have two allergenic proteins, Rub i 1 and Rub i 3, as stated by many authors [28,29].
In Norway, raspberries are produced on 400 ha, with total yields of ~2060 t [2]. Historically, raspberry production in Norway reached an all-time high of 4111 tons in 1988. Raspberry production is organized both in open fields and in tunnels along the west coast fjords up to 65° N, where the climate has proved to be very suitable for this kind of production. The cultivar ‘Veten’ (intended for jam production) was the main cultivar for more than 30 years, but nowadays, the Scottish cultivar ‘Glen Ample’ (intended for fresh consumption) dominates the raspberry industry.
Given the remarkable importance of this berry species and its improved nutritional quality, which can be considered ‘functional food’, and the fact that, so far, several studies have covered only a few cultivars [10,30,31,32], the aim of this study was to evaluate quality indicators of raspberry cultivars that are grown in Norway. The results of such a comprehensive study can help producers and consumers to choose the cultivar with the highest quality for growing, processing, and fresh consumption and breeders to select genotypes that can be used in subsequent breeding programs, which are aimed at creating cultivars with increased phytochemicals.
2. Materials and Methods
2.1. Chemicals and Standards
Methanol (HPLC grade) was purchased from Sigma-Aldrich (Steinheim, Germany), while formic acid and acetonitrile (both MS grade) were from Merck (Darmstadt, Germany). Sugar standards were purchased from Tokyo Chemical Industry (TCI, Zwijndrecht, Belgium), while standards of phenolic compounds (protocatechuic acid, syringic acid, chlorogenic acid, caffeic acid, p-coumaric acid, ellagic acid, aesculetin, rutin, quercetin, kaempferol, quercetin 3-O-glucoside, quercetin 3-O-rhamnoside, kaempferol 3-O-glucoside, phlorizin, eriodictyol, naringenin, and naringin) were purchased from Sigma-Aldrich (Steinheim, Germany). The sugar alcohol (sorbitol, glycerol, galactitol, and mannitol) and organic acid (citric, maleic, malic, pyruvic, shikimic, lactic, propionic, butyric, quinic, oxalic, and fumaric acid) kit obtained from Sigma-Aldrich (Steinheim, Germany) was used for the determination of polyols and organic acids. In addition, 50% sodium hydroxide solutions in water, sodium acetate trihydrate, and sugar standards (glucose, fructose, sucrose, arabinose, trehalose, turanose, galactose, ribose, maltose, isomaltose, maltotriose, isomaltotriose, xylose, melibiose, panose, rhamnose, raffinose, and stachylose) were also purchased from Sigma-Aldrich (Steinheim, Germany). External calibration solutions were made from certified plasma standard solutions: Multi-Element Plasma Standard Solution 4, Specpure®, 1000 µg/mL (Alfa Aesar GmbH & Co KG, Kandel, Germany), and ILM 05.2 ICS Stock 1 (VHG Labs, Inc.—Part of LGC Standards, Manchester, NH, USA) were used for the determination of minerals by ICP-OES. For microwave digestion, pressure-resistant PTFE vessels (volume 100 mL) consisting of a fluoropolymer liner were used. Nitric acid (HNO3, 65 wt. %) and hydrogen peroxide (H2O2, 30 wt. %) were from Suprapur®, Merck KGaA (Darmstadt, Germany). Trolox standard and gallic acid were purchased from Sigma-Aldrich (Steinheim, Germany). Ultra-pure water (0.055 mS/cm) was obtained by using a Thermo fisher TKA MicroPure water purification system and was used to prepare the standard solutions and blanks. The cartridges for solid-phase extraction (SPE) of sample extracts were Strata C18-E type (500 mg per 3 mL), obtained from Phenomenex (Torrance, CA, USA). Syringe filters (15 mm, 0.45 µm, and 22 µm) were purchased from Supelco (Bellefonte, PA, USA).
2.2. Plant Materials
Raspberry fruits were collected in two areas in Norway (Figure 1), Njøs Fruit and Berry Center, Leikanger (at latitude 61°10′43.2″ N, longitude 6°51′34.3″ E), along the Sognefjord, Western Norway, and Norwegian University of Life Science (NMBU) (at latitude 59°66′87.6″ N, longitude 10°76′82.4″ E), Eastern Norway. The main raspberry production area in Norway is located along the Sognefjord. The fjord areas have a marine climate, which is under the influence of the Gulf Stream. Summers are cool and winters are mild. Frost damage to fruit trees, either during the winter or during blossom time, rarely occurs. The snow-covered mountains provide protection from high amounts of rain from the west.
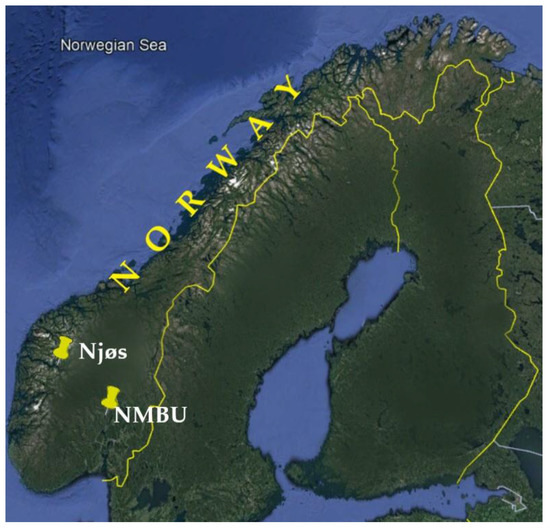
Figure 1.
Sampling sites in Norway; Njøs Fruit and Berry Center and University of Life Science (NMBU).
The annual average temperature in both years of study (2019/2020) at Leikanger was 8.1 °C and 8.7 °C, respectively. The lowest temperature was recorded on 6 February (−6.6 °C), and the highest occurred on 27 July (32.5 °C) in 2019. The following year, the lowest temperature was recorded on 26 February (−3.2 °C), and the highest occurred on 27 June (29.1 °C). The total rainfall in those years was 1019 mm and 1219 mm, with May as the driest month. NMBU has more inland climate with colder winters and warmer summers. In this area, winter frost and blossom frost can happen and damage the fruit trees. The average temperature was 6.6 °C in 2019 and 7.9 °C the year after. The lowest temperature was recorded on 29 January (−19.2 °C), and the highest occurred on 28 July (31.2 °C) in 2019. The year after, the coldest day was 5 February (−11.5 °C), and the warmest day was 18 August (30.3 °C). The amount of rainfall was 593 mm in 2019 and 659 mm in 2020. Both sites had a sandy soil that easily drained, and trickle irrigation was provided.
Management was implemented according to agricultural practices for the areas. The fruits were picked when visually regarded as fully ripe during the end of July/beginning of August. In total, fruits from 18 raspberry cultivars were collected during the two seasons in the years 2019 and 2020. Cultivars ‘Stiora’, ‘Varnes’, ‘Asker’, ‘Balder’, ‘Anitra’, ‘Borgund’, ‘Ninni’, ‘Agat’, ‘Veten’, ‘Preussen’, and ‘Vene’ were picked from Njøs, while ‘Malling June’, ‘2. Ninni’, ‘Cascade delight’, ‘Glen Ample’, ‘2.Veten’, ‘Glen Fyne’, and ‘Ru’ were collected from NMBU.
2.3. Sample Preparation
The samples of harvested raspberries were dried in an oven at 40 °C for about ten days (to a consistent mass). The average value of the moisture content in all raspberry samples was 80 (±4)%. Air-dried raspberry samples were pulverized in an A 10 basic analytical mill (IKA-Werke GmbH & Co., Staufen im Breisgau, Germany). All samples were measured in duplicate and expressed as the dry weight (dw) of the samples.
2.4. Preparation of Extracts
The raspberry extracts for all analyses (minerals, organic acids, sugars, sugar alcohols, and phenolic content, as well as antioxidant activity) were prepared by the procedure previously described in our paper [33].
2.5. Methods
The contents of minerals in raspberry extract samples were determined by inductively coupled plasma with optical emission spectrometry (ICP-OES) using a Thermo Scientific iCAP 6500 Duo ICP (Thermo Fisher Scientific, Cambridge, UK) spectrometer equipped with a RACID86 Charge Injector Device (CID) detector [33]. Organic acids, sugars, and sugar alcohols were analyzed by high-performance anion-exchange chromatography with pulsed amperometric detection (HPAEC-PAD) using a DIONEX ICS 3000 DP liquid chromatograph (Dionex, Sunnyvale, CA, USA) under different conditions [33]. Analysis of phenolic compounds was performed by ultra-high-performance liquid chromatography (UHPLC) with mass spectrometry (MS). Otherwise, phenolic quantification was determined by UHPLC-DAD MS/MS using a Dionex Ultimate 3000 UHPLC system connected to a TSQ Quantum Access Max triple quadruple (QqQ) mass spectrometer (Thermo Fisher Scientific, Bremen, Germany) [33]. Antioxidant activity expressed as total phenolic content (TPC) and radical scavenging activity (RSA) were determined using UV-Vis spectrophotometry (Thermo Scientific Evolution 600; Thermo Fisher Scientific Inc.). All following procedures for the measurements were previously described in our recent study [33].
2.6. Statistical Analysis
Principal component analysis (PCA) enabled an easier understanding of the patterns of the analyzed data by providing information about specific variables that interact similarly with each other. The analysis results of 18 samples by PCA analysis for analytical variables such as minerals, sugars, organic acids, and phenol content are shown in dendrograms and biplots. The data were explored using StatSoft Statistica 12 (StatSoft Inc., Tulsa, OK, USA).
3. Results and Discussion
3.1. Determination of Minerals
In analyzed samples of Norwegian raspberries, 13 micro- and macronutrients were determined, and average values of their contents for a two-year period are presented in Table 1. In all samples, the most abundant macroelement was shown to be nitrogen, with an amount of about 2%. The second most abundant macroelement was P (Table 1), with values ranging from 7040.7 (‘Asker’) to 12195.1 (‘Preussen’) mg/kg in Njøs samples and between 4803.5 (‘Ru’) and 8245.8 (‘Glen Fyne’) mg/kg in NMBU samples. The third most widespread macroelement in Norwegian raspberries was potassium, with values in the range between 2028.1 (‘Malling June’) and 3152.8 mg/kg (‘Glen Ample’) for NMBU raspberries and 2301.4 (‘Agat’) and 3920.9 (‘Ninni’) mg/kg for Njøs samples. In samples from both areas, S content ranged from 383.8 to 630.2 mg/kg, while Mg and Ca quantities were similar and ranged from 172.1 to 276.1 mg/kg and from 211.4 to 336.9 mg/kg, respectively. Based on the results given in Table 1, raspberry samples from the Njøs area had higher macronutrient contents compared to NMBU samples.

Table 1.
The averages of the values of the contents (mg/kg; except N: mass %, i.e., g/100 g) of micronutrients (Al, B, Cu, Fe, Mn, and Zn) and macronutrients (N, P, K Ca, and Mg) in 18 raspberry extract samples during the two-year collection from two Norwegian regions (Njøs No. 1–No. 11 and NMBU No. 12–No. 18) (p ≤ 0.05).
In different raspberry samples from Brazil [7], the most dominant macronutrients were nitrogen and phosphorus, followed by potassium. Calcium and magnesium contents in investigated Brazilian raspberries were lower (Ca content in the range 77–112 mg/kg dry weight and Mg content of 122–147 mg/kg dry weight) when compared to our results (Ca content in the range 214–337 mg/kg dry weight and Mg content of 172–276 mg/kg dry weight). In investigated frozen raspberry samples grown in Serbia, the most common element was found to be potassium, followed by calcium and magnesium [34]. However, it must be noted that among 18 investigated minerals, phosphorus and nitrogen were not determined in these raspberry samples. In investigations conducted by some authors [35,36], potassium stood out as the most represented mineral, followed by phosphorus, calcium, and magnesium, in fresh red raspberries. According to a published study [37], among other minerals, raspberries are valued due to their rich content of potassium. In another study [38], the authors reported lower contents of P, K, Ca, and Mg in Brazilian berries. Given the well-known significance of N, P, and K in improving crop production, the additional importance of these elements in the plant can be noticed. Besides that, their accumulation in plants could be influenced by the soil.
Micronutrients are also important for plants, and they are present in small amounts. In the investigated raspberry samples, the most abundant micronutrients were Zn (10.53–20.38 mg/kg), Fe (8.33–18.45 mg/kg), and Al (3.33–10.50 mg/kg). Based on the results given in Table 1, raspberry samples from the Njøs area had similar micronutrient and higher macronutrient contents compared to NMBU samples. In samples from NMBU, the contents of Fe were higher (Table 1). The typical acidic type of soil was stated as the reason for the higher Fe content in raspberries from Brazil [38]. Moreover, according to Stojanov et al. [9], the response of some elements, including Zn, is environment-dependent, even in the interaction with the fertilizer. According to other authors [38], published results of Fe and Zn contents in raspberries, as well as in other berries, are similar to the results in the present study, but they expressed content in relation to the fresh weight, which is contrary to our results. Furthermore, as raspberries accumulate a lot of iron from the environment [36], the obtained results could be an additional indicator of habitat influence. In addition, the significant contribution of raspberry to the reference dietary intake of Fe was emphasized in the literature data [7,38]. Based on these results (Table 1), raspberry samples from Norway possess valuable nutrient contents.
3.2. Determination of Fruit Acids
Generally, acids are also important for fruit flavor, but the sweet taste is negatively correlated with oxalic acid, citric acid, quinic acid, and total acids [39]. In the investigated raspberry samples, citric and malic acids were the main organic acids (Table 2). In all analyzed berry fruits, fumaric and shikimic acids were present in lower amounts. The contents of quinic and shikimic acids (Table 2) were comparable to those reported for blueberry, apple, and pear, which were dependent on the ripening period of fruits [40].

Table 2.
The averages of the values of the contents of fruit acids (g/kg) in 18 raspberry extract samples during the two-year collection from two Norwegian regions (Njøs No. 1–No. 11 and NMBU No. 12–No. 18) (p ≤ 0.05).
The values obtained for citric acid (Table 2) were higher than the results reported by others [41] (in relation to fresh weight), who also stated that citric acid was the main non-volatile organic acid in all four raspberry cultivars from Spain. Otherwise, their reported malic acid content (fresh weight) was higher than in our samples (dried weight). Additionally, Polish authors [14] showed small differences in the contents of citric and malic acids between fresh and dried raspberry samples. However, they reported significantly higher values of malic and citric acids (by a few orders of magnitude) [14].
3.3. Determination of Sugars
The average values of sugar content determined in dried raspberry samples are presented in Table 3. In all investigated cultivars, the most abundant were glucose and fructose, with ranges of 187.10–330.67 and 129.23–235.68 g/kg, respectively (Table 3). Considering that fructose, as fruit sugar, is a valuable compound (and has a low glycemic index), it increases the nutritional value of raspberries [35]. In addition, the sugar content is also important due to its effects on the taste and acidity of raspberries, as well as consumer preferences [40].

Table 3.
The averages of the values of sugar contents (g/kg) in 18 raspberry extract samples during the two-year collection from two Norwegian regions (Njøs No. 1–No. 11 and NMBU No. 12–No. 18) (p ≤ 0.05).
The content of sucrose was from 0.91 (in cultivar ‘Preussen’) to 53.19 g/kg (‘Glen Ample’), while for galactose, it was from 11.35 (in ‘2. Ninni’) to 41.00 g/kg (in ‘Preussen’). Interestingly, the cultivar ‘Glen Ample’, which possessed the highest sucrose content, has been preferred as the cultivar for the fresh market [10]. In comparison to the reported results of raspberries from Poland [14], the content of sucrose was similar, but the glucose and fructose contents were much higher in our samples, probably due to the fact that our samples were dried. Out of four quantified sugar alcohols, the most dominant was glycerol, then sorbitol (Table 3). Besides sucrose, which is known as a translocation sugar, sorbitol and mannitol have the same role. In addition, higher concentrations of stachyose, from 1.21 g/kg (in cultivar ‘Vene’) to 13.79 mg/kg (in ‘Malling June’), and raffinose, from 5.19 g/kg (in ‘Anitra’ cultivar) to 7.29 mg/kg (in ‘Vene’), could be explained by the build-up of sugar concentrations in the phloem by polymer trapping [42].
The sum of sugars was similar to the reported data in another study [38]. Contrary to the published results in [43], in which samples were frozen after harvesting, the sum of total sugars was much higher for our raspberries samples, which were air-dried.
3.4. Determination of Total Phenolic Content (TPC) and Relative Scavenging Activity (RSA)
The averages of the TPC and RSA values obtained from the two-year study are presented in Table 4. The average TPC values for raspberries ranged from 7.59 g/kg (for ‘Cascade delight’, NMBU) to 27.21 g/kg (for ‘Preussen’, Njøs), and the average RSA values ranged from 70.45 (‘Cascade delight’, NMBU) to 218.68 mmol/kg (for ‘Preussen’, Njøs). Observing the obtained average values for raspberries from two different Norwegian regions (Table 4, Figure A1), slightly higher TPC and RSA values were obtained for Njøs. The TPC results were of the same order of magnitude as in other studies, which analyzed different raspberry varieties [37,44,45,46,47] or raspberries from a different region [48]. Furthermore, a group of authors [45] reported similar levels of TPC, as well as antioxidant capacities, for raspberries and wild berries (blackberries and blueberries), although they showed different contents of anthocyanins.

Table 4.
The averages of the values of TPC (g GAE/kg) and RSA (mmol TE/kg) in 18 raspberry extract samples during the two-year collection from two Norwegian regions (Njøs No. 1–No. 11 and NMBU No. 12–No. 18) (p ≤ 0.05).
Correlation between the averages of TPC and RSA values in the two-year study showed a high Pearson’s coefficient (0.90, p < 0.5). Furthermore, high correlations between these values in each harvesting region (Table A1) were also noted. Moreover, other authors [38,44,49] also showed a good correlation between TPC and antioxidant capacity. Authors from Spain [37] who compared TPC and antioxidant activity for fresh raspberry extracts showed a slightly weaker correlation (a value of 0.64), as well as lower values for the DPPH assay (mmol TE/kg of fresh weight). However, the contents of some phenolic compounds (Table 4) were not much different from theirs. In comparison to the results of raspberry leaf extracts [50], the antioxidant activity of raspberry fruit extract (Table 4) was lower. Otherwise, the values obtained for TPC (Table 4) were higher than the results published by Brazilian authors [38]. Furthermore, based on their results, raspberries were recognized as a good source of antioxidants that showed similar activity to blackberries.
The obtained results of TPC and antioxidant capacity are generally in agreement with the published data. These results of high TPC values and antioxidant capacity, as well as the good correlation between these parameters, could suggest the high ability of raspberries to exert health effects. A recognized correlation between antioxidant parameters for raspberries was also noted for different regions over several seasons [51].
3.5. Determination of Polyphenols
The average values of phenolic content are presented in Table 5. The most dominant content was found for ellagic acid. The ellagic acid content was from 40.64 mg/kg (in cultivar ‘Varnes’) to 225.25 mg/kg (in ‘Glen Fyne’). Contrary to the ellagic acid content, the highest contents of many other phenolic compounds, such as chlorogenic acid, caffeic acid, aesculetin, rutin, and quercetin 3-O-glucoside, were found in the cultivar ‘Varnes’ (Table 5). Furthermore, it is well known that raspberry fruits contain large amounts of ellagic acid, which has been confirmed in many studies [35,37,45,49,51,52]. A group of authors [53] who analyzed 11 raspberry cultivars from Poland reported a higher content for ellagic acid. It should be noted that, contrary to air-dried samples in the present study, the samples from Poland were freeze-dried.

Table 5.
The averages of the values of contents of polyphenols (mg/kg) in 18 raspberry extract samples during the two-year collection from two Norwegian regions (Njøs No. 1–No. 11 and NMBU No. 12–No. 18) (p ≤ 0.05).
Among other phenolic compounds, high contents of quercetin and rutin (5.51–57.47 mg/kg and 7.26–88.57 mg/kg, respectively) were also found (Table 5). Besides quercetin, the contents of quercetin glycosides were similar to the values reported by other authors [10] who also analyzed Norwegian raspberries. They also reported the highest contents of anthocyanins and other phenolics in the cultivar ‘Veten’ [10]. Further, this cultivar has been preferred as the cultivar for processing in Norway [10]. In line with this, ‘Veten’ analyzed in this study also had high contents of many polyphenols (Table 5).
Quantified values of quercetin 3-O-glucoside were also comparable to those published by other authors [44]. This group of authors showed a significant contribution of the location (latitude, longitude, and elevation) to the content of quercetin 3-O-glucoside. Moreover, the results presented in this study show differences in the average values of quercetin 3-O-glucoside between the two regions Njøs and NMBU (Table 5).
The obtained values of caffeic acid and chlorogenic acid (Table 5) showed similar results compared to those obtained from conventionally grown raspberries in Portugal, in which the amounts were low relative to other polyphenols [54]. In addition, the contents of hydroxycinnamic acids, such as chlorogenic acid, caffeic acid, and p-coumaric acid, as well as the content of kaempferol, were similar to the published results for Serbian raspberries [47]. Furthermore, the content of caffeic acid in raspberry fruit extracts (Table 5) was similar to that of raspberry leaf extracts [50].
Syringic acid content was found be relatively dominant in all analyzed raspberry samples (from 29.02 to 88.51 mg/kg), which is contrary to the results of other authors [45], who did not detect this acid in raspberries. Furthermore, they also did not find p-coumaric acid or kaempferol in raspberry extracts. In contrast, the contents of other phenolic compounds, such as protocatechuic acid, caffeic acid, and quercetin, can be noted to be similar to the results in this study. In addition to the recognized correlation between some phenolic compounds, as well as between polyphenols and antioxidant activity for raspberries [37], some similarities can also be noted in this study.
Based on the literature data, many studies have emphasized the anthocyanin content as the main contribution to the antioxidant capacity [52] and health properties of raspberries [48,55], which was different between cultivars [54,56]. In addition, ellagic acid derivatives were noted as dominant in raspberries [51,52], as well as in their products [56]. However, the contents of other polyphenols that are presented in this study (Table 5) are also important. Therefore, the contribution of analyzed polyphenols is significant for antioxidant activity, as well as the high potential of these fruits for their health properties.
Regarding the phytochemical content of these 18 raspberry cultivars, some observations can be highlighted. ‘Glen Ample’, which is the preferred cultivar for the fresh market [10], appears to have predominant sucrose and syringic acid contents (Table 3 and Table 5). ‘Preussen’ is distinguished by the highest P, sorbitol, galactose, and citric acid contents and RSA and TPC values and the lowest Na and sucrose contents. `Cascade de light` showed the lowest TPC and RSA values, as well as the lowest sum of phenolic contents (Table 1, Table 2, Table 3, Table 4 and Table 5). In ‘Veten’, which is the preferred cultivar for jam production, was found to have high phenolic content, the lowest glucose content, the lowest sum of all sugar contents (from Njøs), and the highest Na content (Table 1, Table 3 and Table 5).
3.6. Statistical Analysis
A more noticeable difference in the mineral content between the raspberry samples from the two regions can be seen in Figure A2 when statistical analysis is applied. Statistically significant correlations (p ≤ 0.05) were found in mineral contents between the samples. The circle’s color is defined by the correlation coefficient value, while the circle’s size is defined by the p-value of the correlation. The highest positive correlations were found between Zn and S contents (r = 0.692), Al and P contents (r = 0.745), and B and N contents (r = 0.635). The content of Cu was positively correlated with P, S, and Zn contents (r = 0.659; r = 0.623; and r = 0.612, respectively), while the content of Mg was positively correlated with P and S contents (r = 0.610 and r = 0.599). There were weaker positive correlations between B and Mn; Ca and S; K and P; and Mn and N contents (Figure A2). Different results were obtained for black and red currants, where Mg was correlated with Ca, Mn was correlated with Mg, and Fa was correlated with Al [57]. Correlations between different traits indicate whether the selection of one property has an effect on another. As a matter of fact, strong correlations between two positive or two negative traits can accelerate and facilitate breeding programs [58].
The PCA of the mineral contents in samples (Figure 2) revealed that the first three principal components explained 66.64% of the total variance in the 13 parameters (Al, B, Ca, Cu, Fe, K, Mg, Mn, Na, P, S, Zn, and N). According to the results of the PCA, the contents of: Al (which contributed 10.0% of the total variance, based on correlations), Cu (14.1%), Mg (11.3%), Na (13.9%), P (16.0%), S (12.0%), and Zn (9.7%) exhibited a negative influence on the first principal component (PC1), while the contents of B (29.4% of the total variance, based on correlations), Mn (22.5%), S (7.4%), and N (30.6%) exerted a negative effect according to the second principal component (PC2). On the other hand, the contents of Ca (39.1%) and Fe (7.3%) showed a positive influence on the third principal component (PC3) calculation, while the contents of Al (11.1%), K (11.4%), and P (7.1%) exerted a negative influence on PC3 (Figure 2). The samples obtained from Njøs and NMBU were mostly different in their contents of B, N, Mn, and Fe. Statistical analysis revealed evident differences between these two regions, most likely due to the different cultivars tested. As higher contents of macronutrients were already noted in samples from Njøs (Table 1), PCA confirmed these findings (Figure 2).
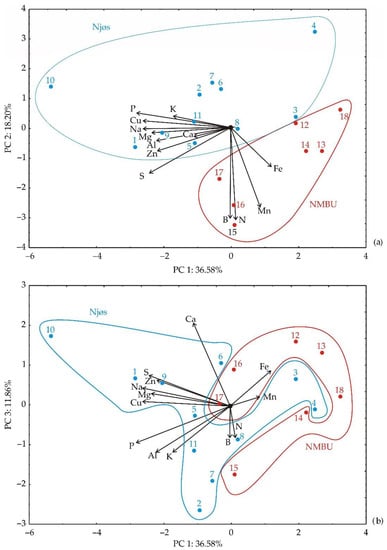
Figure 2.
PCA ordination of element content variables: (a) projection in PC1–PC2 plane; (b) projection in PC1–PC3 plane.
In the study of Karlsons et al. [59], grown cranberry fruits were associated with K, P, Mo, and Fe, while wild fruits were correlated with B, S, Ca, Cu, Mn, and Mg. Cultivated blueberries were associated with Fe, S, B, and Mo, and wild ones were correlated with P, K, Zn, Ca, Cu, Mg, and Mn, which all show that the storage of minerals is genotype-dependent.
The highest positive correlations between organic acid contents (Figure A3) were found between oxalic and malic acid contents (r = 0.783), propionic and shikimic acid contents (r = 0.683), butyric and pyruvic (r = 0.997), shikimic and lactic (r = 0.670), and propionic and lactic (r = 0.808). In contrast, Dincheva et al. [60] found a strong positive correlation between citric acid and malic acid in the ripening raspberry cultivar ‘Rubin’. In blueberries, Wang et al. [61] found that quinic acid content was significantly and positively correlated with shikimic and citric acids, while quinic acid was dependent on citric acid content.
The PCA of the organic acid content in the studied samples (Figure 3) revealed that the first three principal components explained 70.55% of the total variance in the 11 parameters (citric, maleic, malic, pyruvic, shikimic, lactic, propionic, butyric, quinic, oxalic, and fumaric). The content of propionic (9.4% of the total variance, based on correlations) and lactic (16.8%) positively influenced the PC1 calculation, while the content of malic (14.5%) and oxalic (12.9%) negatively affected the PC1 calculation. The contents of organic acids, such as citric (10.3% of the total variance, based on correlations), butyric (26.6%), and pyruvic (24.1%), positively influenced the PC2 coordinate, while the contents of quinic (14.6%), fumaric (8.2%), and shikimic (11.8%) negatively influenced the PC2 coordinate (Figure 3). The contents of organic acids, such as maleic (39.4% of the total variance, based on correlations), citric (17.0%), quinic (7.1%), and fumaric (28.5%), positively affected the PC3 calculation (Figure 3).
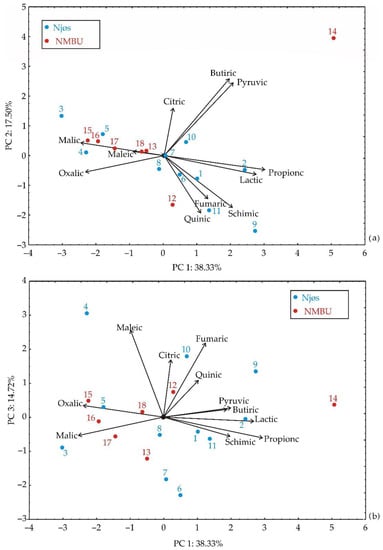
Figure 3.
PCA ordination of fruit acid content variables: (a) projection in PC1–PC2 plane; (b) projection in PC1–PC3 plane.
The highest positive correlations between sugar contents (Figure A4) were found between ribose and glycerol (r = 0.703), mannitol and glycerol (r = 0.856), trehalose and isomaltose (r = 0.743), sorbitol and maltotriose (r = 0.706), stachyose and galactose (r = 0.621), rhamnose and panose (0.970), melibiose and panose (0.769), and melibiose and rhamnose (r = 0.771), while the highest negative correlations were found between ribose and glucose (−0.650), galactose and sucrose (r = −0.692), melibiose and fructose (r = −0.630), panose and fructose (r = −0.756), rhamnose and fructose (r = −0.754), and stachyose and sucrose (r = −0.684) (Figure A4).
Strong positive correlations between sucrose and fructose (r = 0.941) and sucrose and glucose (r = 0.991) were found in ‘Rubin’ raspberry [60]. Similarly, Zhang et al. [62] found that glucose content was correlated with fructose content and sucrose was correlated with both glucose and fructose contents in blueberry cultivars grown in China. This is probably due to the fact that glucose and fructose can easily replace each other during metabolism [63] and due to the evidence that, during the final fruit ripening, invertase activity is strong, so the levels of glucose and fructose should be high and pretty much the same [64].
The PCA of the sugar content in samples (Figure 4) showed that the first three principal components explained 59.92% of the total variance in the 22 parameters (sorbitol, trehalose, arabinose, glucose, fructose, sucrose, turanose, glycerol, galactitol, galactose, ribose, isomaltose, isomaltotriose, maltose, maltotriose, mannitol, xylose, melibiose, panose, rhamnose, raffinose, and stachyose). According to the results of the PCA, the content of fructose (which contributed 14.3% of the total variance, based on correlations) showed a positive influence on PC1, while the contents of rhamnose (16.1%), panose (16.4%), and melibiose (12.6%) exerted a negative effect on the PC1 coordinate. On the other hand, the contents of maltose (7.5%), arabinose (10.9%), and glucose (13.4%) positively influenced the calculation of PC2, whereas the contents of galactitol (7.8%), glycerol (8.6%), ribose (12.9%), and mannitol (10.2%) negatively influenced the computation of the PC2 coordinate (Figure 4). From the results of the applied statistical analysis, the samples from Njøs and NMBU were mostly different in the contents of raffinose, stachyose, rhamnose, panose, melibiose, isomaltose, and sucrose.
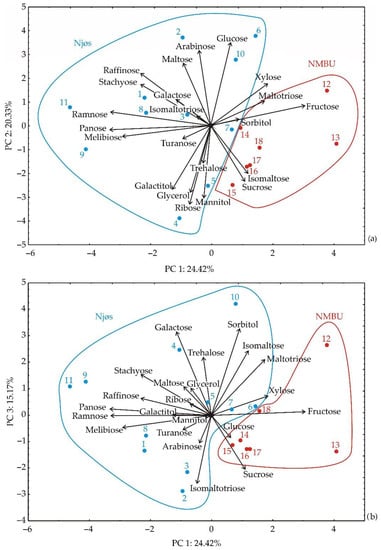
Figure 4.
PCA ordination of sugar content variables: (a) projection in PC1–PC2 plane; (b) projection in PC1–PC3 plane.
In addition to the mentioned correlations between phenolic compounds in raspberries in the literature [37], statistical analysis applied to the results of polyphenols in this study (Figure A5) revealed apparent correlations between phenolic compounds. The highest positive correlations were found between protocatechuic and syringic acids (r = 0.771), quercetin 3-O-rhamnoside and syringic acid (r = 0.721), chlorogenic acid and rutin (r = 0.910), quercetin 3-O-rhamnoside and p-coumaric acid (r = 0.771), protocatechuic and p-coumaric acids (r = 0.729), quercetin and kaempferol 3-O-glucoside (r = 0.808), and protocatechuic acid and quercetin 3-O-rhamnoside (r = 0.921) (Figure A5).
A long time ago, Howard et al. [65] proved that the antioxidant activity of various blueberries involved correlations between total polyphenols, total anthocyanins, total flavonols, total hydroxycinnamic acids, and antioxidant activity. Based on the results of Scalzo et al. [66], total malvidin was significantly and positively correlated with total anthocyanins, and chlorogenic acid was correlated with anthocyanins in blueberry cultivars grown in New Zealand. Correspondingly, according to Pliszka [67], the contents of total anthocyanins, flavonols, and phenolic acids were mutually positively correlated in elderberry fruits.
The PCA of the phenolic content in the studied samples (Figure 5) indicated that the first three principal components explained 74.0% of the total variance in the 17 parameters (protocatechuic acid, syringic acid, chlorogenic acid, caffeic acid, aesculetin, rutin, p-coumaric acid, quercetin 3-O-glucoside, ellagic acid, kaempferol 3-O-glucoside, quercetin 3-O-rhamnoside, phlorizin, eriodictyol, quercetin, naringenin, kaempferol, and naringin). The contents of syringic acid (11.6% of the total variance, according to correlations), protocatechuic acid (15.3%), p-coumaric acid (10.7%), naringin (7.2%), and quercetin 3-O-rhamnoside (11–8%) exhibited a positive influence on the PC1 coordinate, while a negative influence on the PC1 coordinate was observed for the contents of chlorogenic acid (5.7%), rutin (8.5%), quercetin 3-O-glucoside (9.1%), and aesculetin (9.0%) (Figure 5). In the study of Fotirić Akšić et al. [68], syringic acid and naringenin were the most important factors for separating blueberry cultivars, while the presence of p-coumaric acid separated raspberry cultivars in PCA analysis.
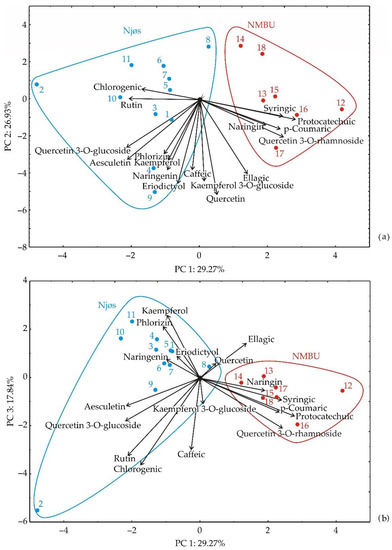
Figure 5.
PCA ordination of phenolic content variables: (a) projection in PC1–PC2 plane; (b) projection in PC1–PC3 plane.
The contents of aesculetin (6.7%), phlorizin (5.3%), kaempferol (6.8%), naringenin (9.0 %), eriodictyol (12.9%), caffeic acid (9.1%), kaempferol 3-O-glucoside (12.3%), quercetin (16.6%), and ellagic acid (10.2%) showed a negative influence on PC2 coordinate computation (Figure 5). The contents of phlorizin (7.6%) and kaempferol (11.1%) showed a positive influence on the PC3 coordinate calculation, whereas the contents of rutin (16.2%), chlorogenic acid (20.5%), caffeic acid (14.0%), and quercetin 3-O-rhamnoside (6.7%) showed a negative influence on the PC3 calculation (Figure 5). According to the statistical results, the samples obtained from Njøs and NMBU were mostly different in the contents of chlorogenic acid, rutin, syringic acid, protocatechuic acid, p-coumaric acid, naringin, and quercetin 3-O-rhamnoside.
From the results of the applied statistical analysis, the samples from Njøs and NMBU were mostly different in the contents of macronutrients, the contents of raffinose, stachyose, rhamnose, panose, melibiose, isomaltose, and sucrose, and the contents of chlorogenic acid, rutin, syringic acid, protocatechuic acid, p-coumaric acid, naringin, and quercetin 3-O-rhamnoside. Furthermore, based on the PCA, ‘Preussen’ was separated from other samples by element contents (Figure 2), ‘Veten’ and ‘Cascade de light’ were separated by organic acids (Figure 3), and ‘Varnes’ was separated by phenolic compounds and element contents (Figure 1 and Figure 5). These observations are consistent with those obtained by chemical analysis.
A more detailed presentation of the global conclusion resulting from the PCA analysis of chemical element and compound contents is presented in Figure 6. Samples from the NMBU region are richer in fructose, sucrose, and syringic acid contents, while samples from the Njøs region are richer in K and P contents, as well as galactose content. Augmented values of TPC and RSA were observed in samples from the Njøs region.
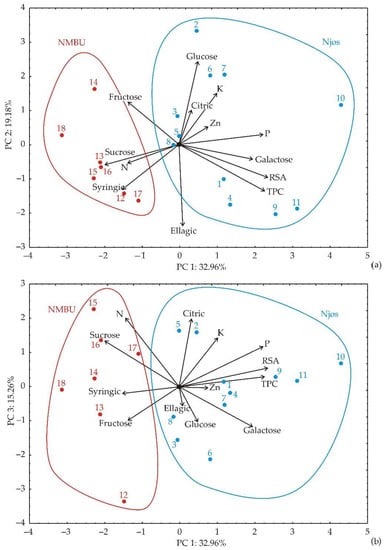
Figure 6.
PCA ordination of the most important chemical content variables in raspberry samples in Norwegian regions Njøs and NMBU: (a) projection in PC1–PC2 plane; (b) projection in PC1–PC3 plane.
4. Conclusions
In the present study, different raspberry cultivars had similar profiles of antioxidant activity, minerals, sugars, organic acids, and polyphenols, with quantitative variations between them. The samples obtained from Njøs and NMBU were mostly different in P, N, Zn, and Fe contents. Moreover, raspberry samples from Njøs had higher macronutrient contents compared to NMBU samples. The samples also differed in sugar contents (raffinose, stachyose, rhamnose, panose, melibiose, isomaltose, and sucrose) and in phenolics (chlorogenic acid, rutin, syringic acid, protocatechuic acid, p-coumaric, naringin, and quercetin 3-O-rhamnoside contents). It is important to mention that the various extraction methods of raspberry samples noted in the literature data caused different results of the analyzed parameters. Furthermore, the phytochemical composition of fruits in studied raspberry cultivars was dependent on the agricultural practice, as well as the growing location.
Based on the obtained results for Norwegian raspberries, minerals P and K, ellagic acid, quercetin, and derivatives, with pronounced antioxidant capacity of sample extracts, were characteristics for all 18 raspberry cultivars. The analyzed raspberries possessed high contents of sugars, with especially high contents of galactose, stachyose, and sugar alcohols glycerol and sorbitol, as well as citric acid as the dominant organic acid. Moreover, based on the obtained results, raspberries are recognized as a good source of nutrients and phytochemicals, which, overall, increase the health properties of these fruits.
Soil chemical properties, climatic conditions, agronomic practice, genetics, and physiology could affect the chemical components of raspberry fruits, which must be studied in more detail. Furthermore, these findings can be used as a reference for selecting the right raspberry cultivar for each location.
Author Contributions
Conceptualization, Ž.T., M.M. and M.F.A.; methodology, Ž.T. and M.F.A.; formal analysis, U.G., T.T., L.P., M.N., B.D. and B.L.; writing, M.F.A., I.Ć., Ž.T., L.P. and M.N.; review and editing, Ž.T., M.F.A. and M.M.; supervision, Ž.T. All authors have read and agreed to the published version of the manuscript.
Funding
This work was funded by The Research Council of Norway (Project No. 280376).
Institutional Review Board Statement
Not applicable.
Informed Consent Statement
Not applicable.
Data Availability Statement
The original contributions presented in the study are included in the article material; further inquiries can be directed to the corresponding authors.
Acknowledgments
The authors would like to thank Marianne Hotle, NIBIO Ullensvang, Norwegian Institute of Bioeconomy Research, Lofthus, Norway; Kurab Røen and Dag Røen, Njøs Fruit and Berry Center, Leikanger, Norway; and Signe Hansen and Kari Grønnerød, The University of Life Science, Norway, for technical support during the field trials and harvesting of fruits. In addition, we would like to thank the Ministry of Education, Science and Technological Development of the Republic of Serbia (Contract Nos.: 451-03-68/2022-14/200026; 451-03-68/2022-14/200168; 451-03-68/2022-14/200288; 451-03-68/2022-14/200051; 451-03-68/2020-14/200007; 451-03-68/2022-14/200134; and 451-03-68/2022-14/200116) and The Research Council of Norway (project No. 280376).
Conflicts of Interest
The authors declare no conflict of interest.
Appendix A. Additional Figures
Additional Figure captions: Figure A1. The averages of the values of TPC and RSA obtained for 18 raspberry varieties during the two-year collection; Figure A2. Color correlation graph between metal contents in raspberry extract samples; Figure A3. Color correlation graph between fruit acid contents in raspberry extract samples; Figure A4. Color correlation graph between sugar contents in raspberry extract samples; Figure A5. Color correlation graph between phenolic contents in raspberry extract samples.
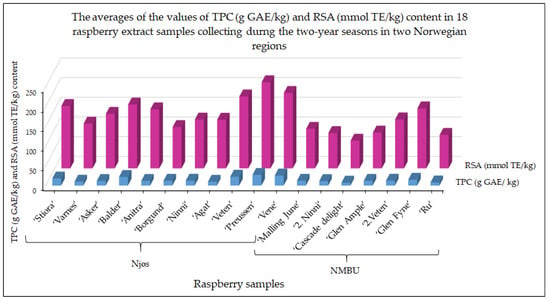
Figure A1.
The averages of the values of TPC and RSA obtained for 18 raspberry varieties during the two-year collection.
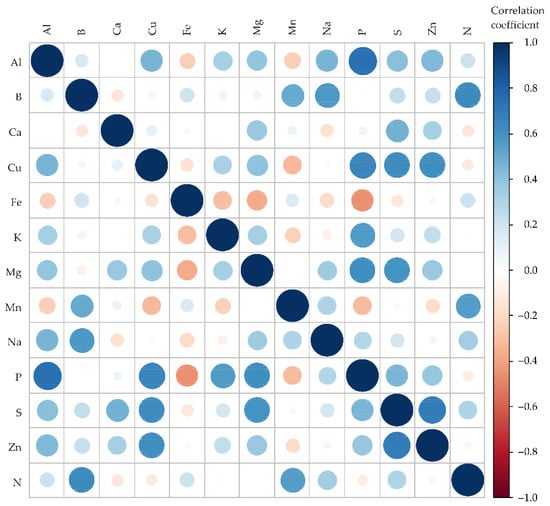
Figure A2.
Color correlation graph between metal contents in raspberry extract samples.
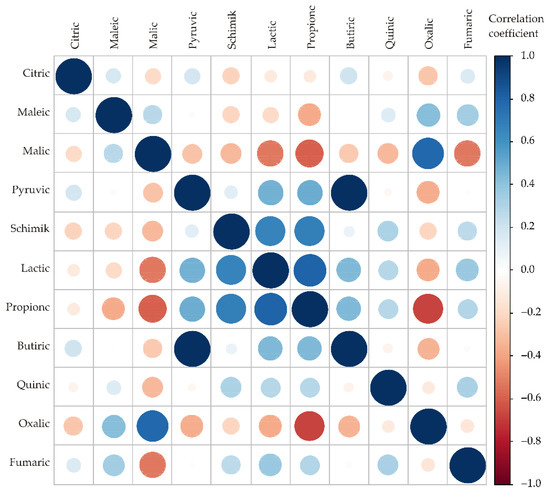
Figure A3.
Color correlation graph between fruit acid contents in raspberry extract samples.
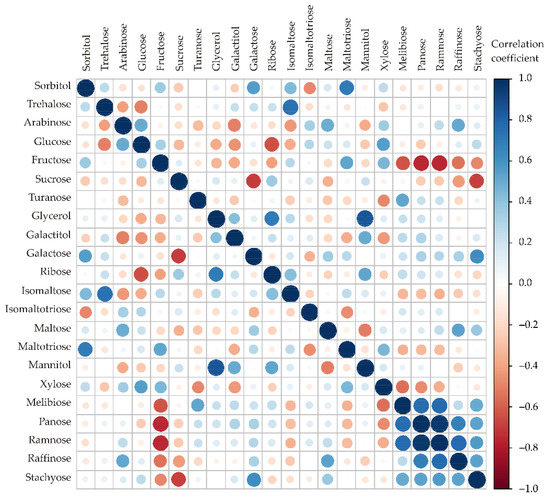
Figure A4.
Color correlation graph between sugar contents in raspberry extract samples.
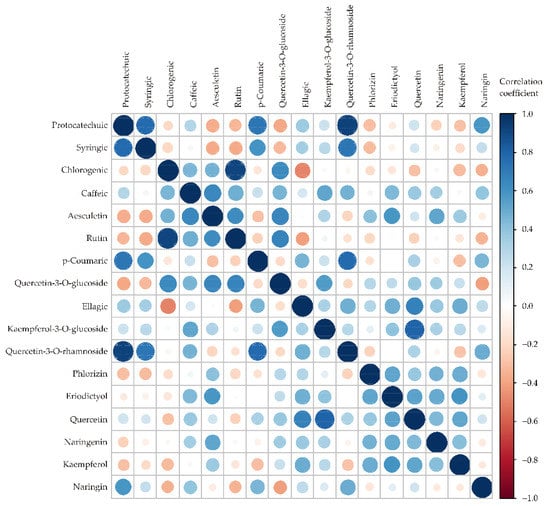
Figure A5.
Color correlation graph between phenolic contents in raspberry extract samples.
Appendix B. Additional Table
Additional Table caption: Table A1. Correlation between the average values of TPC (g GAE/kg) and RSA (mmol TE/kg) in 18 raspberry extract samples during the two-year collection from two Norwegian regions.

Table A1.
Correlation between the average values of TPC (g GAE/kg) and RSA (mmol TE/kg) in 18 raspberry extract samples during the two-year collection from two Norwegian regions. (p < 0.05).
Table A1.
Correlation between the average values of TPC (g GAE/kg) and RSA (mmol TE/kg) in 18 raspberry extract samples during the two-year collection from two Norwegian regions. (p < 0.05).
| Njøs | NMBU | Both Regions | ||||
|---|---|---|---|---|---|---|
| TPC | RSA | TPC | RSA | TPC | RSA | |
| TPC | 1 | 1 | 1 | |||
| RSA | 0.92 | 1 | 0.85 | 1 | 0.90 | 1 |
References
- Hytönen, T.; Graham, J.; Harrison, R. The Genomes of Rosaceous Berries and Their Wild Relatives; Springer International Publishing AG: Cham, Switzerland, 2018. [Google Scholar] [CrossRef]
- FAOStat. 2021. Available online: http://www.fao.org/faostat/en/#data/QC (accessed on 20 January 2022).
- Statista. 2021. Available online: https://www.statista.com/statistics/644467/annual-production-volume-of-raspberries-in-norway/ (accessed on 19 October 2021).
- Nikolić, M.; Radović, A.; Fotirić, M.; Milojević, J.; Nikolić, D. Pomological properties of promising raspberry seedlings with yellow fruit. Genetika 2009, 413, 255–262. [Google Scholar] [CrossRef]
- Pantelidis, G.; Vasilakakis, M.; Manganaris, G.A.; Diamantidis, G. Antioxidant capacity, phenol, anthocyanin and ascorbic acid contents in raspberries, blackberries, red currants, gooseberries and Cornelian cherries. Food Chem. 2007, 102, 777–783. [Google Scholar] [CrossRef]
- Krstić, Đ.; Vukojević, V.; Mutić, J.; Fotirić Akšić, M.; Ličina, V.; Milojković-Opsenica, D.; Trifković, J. Distribution of elements in seeds of some wild and cultivated fruits. Nutrition and authenticity aspects. J. Sci. Food Agric. 2019, 99, 546–554. [Google Scholar] [CrossRef] [PubMed]
- Castilho Maro, L.A.; Pio, R.; Santos Guedes, M.N.; Patto de Abreu, C.M.; Nogueira Curi, P. Bioactive compounds, antioxidant activity and mineral composition of fruits of raspberry cultivars grown in subtropical areas in Brazil. Fruits 2013, 68, 209–217. [Google Scholar] [CrossRef]
- Szajdek, A.; Borowska, E.J. Bioactive compounds and health-promoting properties of berry fruits: A review. Plant Foods Hum.Nutr. 2008, 63, 147–156. [Google Scholar] [CrossRef]
- Stojanov, D.; Milošević, T.; Mašković, P.; Milošević, N. Impact of fertilization on the antioxidant activity and mineral composition of red raspberry berries of cv.‘Meeker’. Mitt. Klost. Rebe Wein Obstbau Früchteverwertung 2019, 69, 184–195. [Google Scholar]
- Mazur, S.P.; Nes, A.; Wold, A.B.; Remberg, S.F.; Aaby, K. Quality and chemical composition of ten red raspberry (Rubus idaeus L.) genotypes during three harvest seasons. Food Chem. 2014, 160, 233–240. [Google Scholar] [CrossRef]
- . Frías-Moreno, M.N.; Parra-Quezada, R.Á.; Ruíz-Carrizales, J.; González-Aguilar, G.A.; Sepulveda, D.; Molina-Corral, F.J.; Jacobo-Cuellar, J.L.; Olivas, G.I. Quality, bioactive compounds and antioxidant capacity of raspberries cultivated in northern Mexico. Int. J. Food Prop. 2021, 24, 603–614. [Google Scholar] [CrossRef]
- Woznicki, T.L.; Heide, O.M.; Remberg, S.F.; Sonsteby, A. Effects of controlled nutrient feeding and different temperatures during floral initiation on yield, berry size and drupelet numbers in red raspberry (Rubus idaeus L.). Sci. Hortic. 2016, 212, 148–154. [Google Scholar] [CrossRef]
- Contreras, E.; Grez, J.; Alcalde Furber, J.A.; Neri, D.; Gambardella, M. Effect of low temperature in the first development stage for five red raspberry genotypes. Hortic. Sci. 2019, 46, 9–16. [Google Scholar] [CrossRef] [Green Version]
- Ponder, A.; Hallmann, E. The nutritional value and vitamin C content of different raspberry cultivars from organic and conventional production. J. Food Compos. Anal. 2020, 87, 103429. [Google Scholar] [CrossRef]
- Kumar, D.; Rizvi, S.I. Significance of vitamin C in human health and disease. Ann. Phytomed. 2012, 1, 9–13. [Google Scholar]
- Li, X.; Sun, J.; Chen, Z.; Jiang, J.; Jackson, A. Characterization of carotenoids and phenolics during fruit ripening of Chinese raspberry (Rubus chingii Hu). RSC Adv. 2021, 11, 10804–10813. [Google Scholar] [CrossRef] [PubMed]
- Hendawy, O.; Gomaa, H.A.; Hussein, S.; Alzarea, S.I.; Qasim, S.; Rahman, F.E.Z.S.A.; Ali, A.T.; Ahmed, S.R. Cold-pressed raspberry seeds oil ameliorates high-fat diet triggered non-alcoholic fatty liver disease. Saudi Pharm. J. 2021, 29, 1303–1313. [Google Scholar] [CrossRef] [PubMed]
- Marić, B.; Pavlić Čolović, D.; Abramović, B.; Zeković, Z.; Bodroža-Solarov, M.; Ilić, N.; Teslić, N. Recovery of high-content ω–3 fatty acid oil from raspberry (Rubus idaeus L.) seeds: Chemical composition and functional quality. LWT-Food Sci. Technol. 2020, 130, 109627. [Google Scholar] [CrossRef]
- Bensalem, J.; Dal-Pan, A.; Gillard, E.; Calon, F.; Pallet, V. Protective effects of berry polyphenols against age-related cognitive impairment. Nutr. Aging. 2015, 3, 89–106. [Google Scholar] [CrossRef]
- Baby, B.; Antony, P.; Vijayan, R. Antioxidant and anticancer properties of berries. Crit. Rev. Food Sci. Nutr. 2018, 58, 2491–2507. [Google Scholar] [CrossRef]
- Veljković, B.; Dordević, N.; Dolićanin, Z.; Ličina, B.; Topuzović, M.; Stanković, M.; Zlatić, N. Antioxidant and Anticancer Properties of Leaf and Fruit Extracts of the Wild Raspberry (Rubus iadeus L.). Not. Bot. Horti Agrobot. Cluj-Napoca 2019, 47, 359–367. [Google Scholar] [CrossRef]
- Noratto, G.D.; Chew, B.P.; Atienza, L.M. Red raspberry (Rubus iadeus L.) intake decreases oxidative stress in obese diabetic (db/db) mice. Food Chem. 2017, 225, 305–314. [Google Scholar] [CrossRef]
- Szymanowska, U.; Baraniak, B.; Bogucka-Kocka, A. Antioxidant, anti-inflammatory, and postulated cytotoxic activity of phenolic and anthocyanin-rich fractions from polana raspberry (Rubus idaeus L.) fruit and juice—In vitro study. Molecules 2018, 23, 1812. [Google Scholar] [CrossRef]
- Kallscheuer, N.; Menezes, R.; Foito, A.; da Silva, H.M.; Braga, A.; Dekker, W.; Méndez Sevillano, D.; Rosado-Ramos, R.; Jardim, C.; Oliveira, J.; et al. Identification and Microbial Production of the Raspberry Phenol Salidroside that Is Active against Huntington’s Disease. Plant Physiol. 2019, 179, 969–985. [Google Scholar] [CrossRef] [PubMed] [Green Version]
- Tsuda, T. Recent progress in anti-obesity and anti-diabetes effect of berries. Antioxidants 2016, 5, 13. [Google Scholar] [CrossRef]
- Yang, J.; Cui, J.; Wu, Y.; Han, H.; Chen, J.; Yao, J.; Liu, Y. Comparisons of the active components in four unripe raspberry extracts and their activities. Food Sci. Technol. 2019, 39, 632–639. [Google Scholar] [CrossRef]
- Das, H.; Samanta, A.K.; Kumar, S.; Roychoudhury, P.; Sarma, K. Exploration of Antimicrobial, Antibiofilm and Antiquorum Sensing Activity of the Himalayan Yellow Raspberry (Rubus ellipticus) against Clinical Isolates of Escherichia coli and Staphylococcus aureus. Indian J. Anim. Res. 2021, 1, 6. [Google Scholar] [CrossRef]
- Hallmann, E.; Ponder, A.; Aninowski, M.; Narangerel, T.; Leszczyńska, J. The interaction between antioxidants content and allergenic potency of different raspberry cultivars. Antioxidants 2020, 9, 256. [Google Scholar] [CrossRef]
- Chang, C.; Leung, P.S.C.; Todi, S.; Zadoorian, L. Definition of Allergens: Inhalants, Food and Insects Allergens. In Allergy and Asthma; Mahmoudi, M., Ed.; Springer Nature: Cham, Switzerland, 2018. [Google Scholar]
- Vrgović, P.; Pojić, M.; Teslić, N.; Mandić, A.; Kljakić, A.C.; Pavlić, B.; Stupar, A.; Pestorić, M.; Škrobot, D.; Mišan, A. Communicating Function and Co-Creating Healthy Food: Designing a Functional Food Product Together with Consumers. Foods 2022, 11, 961. [Google Scholar] [CrossRef]
- Mazur, S.P.; Sonsteby, A.; Wold, A.B.; Foito, A.; Freitag, S.; Verrall, S.; Heide, O.M. Post-flowering photoperiod has marked effects on fruit chemical composition in red raspberry (Rubus idaeus). Ann. Appl. Biol. 2014, 165, 454–465. [Google Scholar] [CrossRef]
- Durán-Soria, S.; Pott, D.M.; Will, F.; Mesa-Marín, J.; Lewandowski, M.; Celejewska, K.; Masny, A.; Zurawicz, E.; Jennings, N.; Sønsteby, A.; et al. Exploring Genotype-by-Environment Interactions of Chemical Composition of Raspberry by Using a Metabolomics Approach. Metabolites 2021, 11, 490. [Google Scholar] [CrossRef]
- Fotirić Akšić, M.; Nešović, M.; Ćirić, I.; Tešić, Ž.; Pezo, L.; Tosti, T.; Gašić, U.; Dojčinović, B.; Lončar, B.; Meland, M. Polyphenolics and chemical profiles of domestic Norwegian apple (Malus × domestica Borkh.) cultivars. Front. Nutr. 2022, in press. [Google Scholar] [CrossRef]
- Pavlović, A.V.; Dabić, D.C.; Momirović, N.M.; Dojčinović, B.P.; Milojković-Opsenica, D.M.; Tešić, Ž.L.; Natić, M.M. Chemical composition of two different extracts of berries harvested in Serbia. J. Agric. Food Chem. 2013, 61, 4188–4194. [Google Scholar] [CrossRef]
- Rao, A.V.; Snyder, D.M. Raspberries and Human Health: A review. J. Agric. Food Chem. 2010, 58, 3871–3883. [Google Scholar] [CrossRef] [PubMed]
- Nile, S.H.; Park, S.W. Edible berries: Bio-active components and their effect on human health. Nutrition 2014, 30, 134–144. [Google Scholar] [CrossRef] [PubMed]
- Vázquez-González, M.; Fernández-Prior, Á.; Oria, A.B.; Rodríguez-Juan, E.M.; Pérez-Rubio, A.G.; Fernández-Bolaños, J.; Rodríguez-Gutiérrez, G. Utilization of strawberry and raspberry waste for the extraction of bioactive compounds by deep eutectic solvents. LWT-Food Sci. Technol. 2020, 130, 109645. [Google Scholar] [CrossRef]
- De Souza, V.R.; Pereira, P.A.P.; da Silva, T.L.T.; de Oliveira Lima, L.C.; Pio, R.; Queiroz, F. Determination of the bioactive compounds, antioxidant activity and chemical composition of Brazilian blackberry, red raspberry, strawberry, blueberry and sweet cherry fruits. Food Chem. 2014, 156, 362–368. [Google Scholar] [CrossRef]
- Bett-Garber, K.L.; Lea, J.M.; Watson, M.A.; Grimm, C.C.; Lloyd, S.W.; Beaulieu, J.C.; Stein-Chisholm, R.E.; Andrzejewski, B.P.; Marshall, D.A. Flavor of fresh blueberry juice and the comparison to amount of sugars, acids, anthocyanidins, and physicochemical measurements. J. Food Sci. 2015, 80, S818–S827. [Google Scholar] [CrossRef]
- Walker, R.P.; Famiani, F. Organic acids in fruits: Metabolism, functions and contents. Ian Warrington, Ed.; Jon Wiley and Sons Inc: Hoboken, NJ, USA. Hortic. Rev. 2018, 45, 371–430. [Google Scholar]
- de Ancos, B.; Gonzalez, E.; Cano, M.P. Differentiation of raspberry varieties according to anthocyanin composition. Z. Lebensm. Forsch. A 1999, 208, 33–38. [Google Scholar] [CrossRef]
- Rennie, E.A.; Turgeon, R. A comprehensive picture of phloem loading strategies. In Proceedings of the National Academy of Sciences, Washington, DC, USA, 18 August 2009; Volume 106, pp. 14162–14167. [Google Scholar] [CrossRef]
- Fu, Y.; Zhou, X.; Chen, S.; Sun, Y.; Shen, Y.; Ye, X. Chemical composition and antioxidant activity of Chinese wild raspberry (Rubus hirsutus Thunb). LWT-Food Sci. Technol. 2015, 60, 1262–1268. [Google Scholar] [CrossRef]
- Bradish, C.M.; Perkins-Veazie, P.; Fernandez, G.E.; Xie, G.; Jia, W. Comparison of flavonoid composition of red raspberries (Rubus idaeus L.) grown in the Southern United States. J. Agric. Food Chem. 2012, 60, 5779–5786. [Google Scholar] [CrossRef]
- Pimpão, R.C.; Dew, T.; Oliveira, P.B.; Williamson, G.; Ferreira, R.B.; Santos, C.N. Analysis of phenolic compounds in Portuguese wild and commercial berries after multienzyme hydrolysis. J. Agric. Food Chem. 2013, 61, 4053–4062. [Google Scholar] [CrossRef]
- Freeman, B.L.; Stocks, J.C.; Eggett, D.L.; Parker, T.L. Antioxidant and phenolic changes across one harvest season and two storage conditions in primocane raspberries (Rubus idaeus L.) grown in a hot, dry climate. HortScience 2011, 46, 236–239. [Google Scholar] [CrossRef]
- Dragišić-Maksimović, J.J.; Milivojević, J.M.; Poledica, M.M.; Nikolić, M.D.; Maksimović, V.M. Profiling antioxidant activity of two primocane fruiting red raspberry cultivars (Autumn bliss and Polka). J. Food Compos. Anal. 2013, 31, 173–179. [Google Scholar] [CrossRef]
- Jiménez-Aspee, F.; Theoduloz, C.; Ávila, F.; Thomas-Valdés, S.; Mardones, C.; von Baer, D.; Schmeda-Hirschmann, G. The Chilean wild raspberry (Rubus geoides Sm.) increases intracellular GSH content and protects against H2O2 and methylglyoxal-induced damage in AGS cells. Food Chem. 2016, 194, 908–919. [Google Scholar] [CrossRef] [PubMed]
- González, E.M.; de Ancos, B.; Cano, M.P. Relation between bioactive compounds and free radical-scavenging capacity in berry fruits during frozen storage. J. Sci. Food Agric. 2003, 83, 722–726. [Google Scholar] [CrossRef]
- Pavlović, A.V.; Papetti, A.; Zagorac, D.Č.; Gašić, U.M.; Mišić, D.M.; Tešić, Ž.L.; Natić, M.M. Phenolics composition of leaf extracts of raspberry and blackberry cultivars grown in Serbia. Ind. Crops Prod. 2016, 87, 304–314. [Google Scholar] [CrossRef]
- Dobson, P.; Graham, J.; Stewart, D.; Brennan, R.; Hackett, C.A.; McDougall, G.J. Over-seasons analysis of quantitative trait loci affecting phenolic content and antioxidant capacity in raspberry. J. Agric. Food Chem. 2012, 60, 5360–5366. [Google Scholar] [CrossRef]
- Borges, G.; Degeneve, A.; Mullen, W.; Crozier, A. Identification of flavonoid and phenolic antioxidants in black currants, blueberries, raspberries, red currants, and cranberries. J. Agric. Food Chem. 2010, 58, 3901–3909. [Google Scholar] [CrossRef]
- Kula, M.; Majdan, M.; Głód, D.; Krauze-Baranowska, M. Phenolic composition of fruits from different cultivars of red and black raspberries grown in Poland. J. Food Compos. Anal. 2016, 52, 74–82. [Google Scholar] [CrossRef]
- Anjos, R.; Cosme, F.; Gonçalves, A.; Nunes, F.M.; Vilela, A.; Pinto, T. Effect of agricultural practices, conventional vs organic, on the phytochemical composition of ‘Kweli’ and ‘Tulameen’ raspberries (Rubus idaeus L.). Food Chem. 2020, 328, 126833. [Google Scholar] [CrossRef]
- Bowen-Forbes, C.S.; Zhang, Y.; Nair, M.G. Anthocyanin content, antioxidant, anti-inflammatory and anticancer properties of blackberry and raspberry fruits. J. Food Compos. Anal. 2010, 23, 554–560. [Google Scholar] [CrossRef]
- Sójka, M.; Macierzyński, J.; Zaweracz, W.; Buczek, M. Transfer and mass balance of ellagitannins, anthocyanins, flavan-3-ols, and flavonols during the processing of red raspberries (Rubus idaeus L.) to juice. J. Agric. Food Chem. 2016, 64, 5549–5563. [Google Scholar] [CrossRef] [PubMed]
- Cosmulescu, S.; Trandafir, I.; Nour, V. Mineral composition of fruit in black and red currant. South-West. J. Hortic. Biol. Environ. 2015, 6, 43–51. [Google Scholar]
- Garazhian, M.; Gharaghani, A.; Eshghi, S. Genetic diversity and inter-relationships of fruit bio-chemicals and antioxidant activity in Iranian wild blackberry species. Sci. Rep. 2020, 10, 18983. [Google Scholar] [CrossRef] [PubMed]
- Karlsons, A.; Osvalde, A.; Čekstere, G.; Pormale, J. Research on the mineral composition of cultivated and wild blueberries and cranberries. Agron. Res. 2018, 16, 454–463. [Google Scholar] [CrossRef]
- Dincheva, I.; Badjakov, I.; Kondakova, V.; Batchvarova, R. Metabolic profiling of red raspberry (Rubus idaeus) during fruit development and ripening. Int. J. Agric. Sci. Res. 2013, 3, 81–88. [Google Scholar]
- Wang, Y.; Yang, H.; Zhong, S.; Liu, X.; Li, T.; Zong, C. Variations in sugar and organic acid content of fruit harvested from different Vaccinium uliginosum populations in the Changbai Mountains of China. J. Am. Soc. Hortic. Sci. 2019, 144, 420–428. [Google Scholar] [CrossRef]
- Zhang, J.; Nie, J.; Jing, L.; Zhang, H.; Ye, L.; Farooq, S.; Bacha, S.A.S.; Wang, J. Evaluation of sugar and organic acid composition and their levels in highbush blueberries from two regions of China. J. Integr. Agric. 2020, 19, 2352–2361. [Google Scholar] [CrossRef]
- Taiz, L.; Zeiger, E. Plant Physiology, 4th ed.; Sinauer Associates Inc.: Sunderland, MA, USA, 2006. [Google Scholar]
- Mesarović, J.; Trifković, J.; Tosti, T.; Fotirić Akšić, M.; Milatović, D.; Ličina, V.; Milojković-Opsenica, D. Relationship between ripening time and sugar content of apricot (Prunus armeniaca L.) kernels. Acta Physiol. Plant. 2018, 40, 157. [Google Scholar] [CrossRef]
- Howard, L.R.; Clark, J.R.; Brownmiller, C. Antioxidant capacity and phenolic content in blueberries as affected by genotype and growing season. J. Sci. Food Agric. 2003, 83, 1238–1247. [Google Scholar] [CrossRef]
- Scalzo, J.; Stevenson, D.; Hedderley, D. Polyphenol compounds and other quality traits in blueberry cultivars. J. Berry Res. 2015, 5, 117–130. [Google Scholar] [CrossRef]
- Pliszka, B. Content and correlation of polyphenolic compounds, bioelements and antiradical activity in black elder berries (Sambucus nigra L.). J. Elem. 2020, 25, 2. [Google Scholar] [CrossRef]
- Fotirić Akšić, M.; Dabić Zagorac, D.; Sredojević, M.; Milivojević, J.; Gašić, U.; Meland, M.; Natić, M. Chemometric characterization of strawberries and blueberries according to their phenolic profile: Combined effect of cultivar and cultivation system. Molecules 2019, 24, 4310. [Google Scholar] [CrossRef] [PubMed] [Green Version]
Publisher’s Note: MDPI stays neutral with regard to jurisdictional claims in published maps and institutional affiliations. |
© 2022 by the authors. Licensee MDPI, Basel, Switzerland. This article is an open access article distributed under the terms and conditions of the Creative Commons Attribution (CC BY) license (https://creativecommons.org/licenses/by/4.0/).