Article

Lipidomics Analysis of Tea Leaves Cultured in Hydroponics Reveals That High Nitrogen Application Decreases Tea Plant Resistance to Ultraviolet Radiation

1
College of Horticulture, Fujian Agriculture and Forestry University, Fuzhou 350002, China
2
Key Laboratory for Plant Biology and Resource Application of Tea (The Ministry of Agriculture), Tea Research Institute, Chinese Academy of Agricultural Sciences, Hangzhou 310058, China
3
Institute of Horticultural, Jiangxi Province Academy of Agricultural Sciences, Nanchang 330200, China
4
College of Food Science, Southwest University, Chongqing 400715, China
*
Authors to whom correspondence should be addressed.
These authors contributed equally to this work.
Horticulturae 2022, 8(8), 724; https://doi.org/10.3390/horticulturae8080724
Submission received: 14 June 2022 / Revised: 19 July 2022 / Accepted: 4 August 2022 / Published: 11 August 2022
(This article belongs to the Special Issue Advances in Tea Plant Biology and Tea Quality Regulation)

Abstract

:
Lipid composition in tea leaves is significantly affected by ultraviolet (UV) radiation and nitrogen levels. Here, to reveal the response of lipids in tea plants (Camellia sinensis L.) to the interaction between nitrogen and UV radiation, we treated tea plants with three gradients of UV radiation under two nitrogen levels by the hydroponic method. Lipidomics results show that ultraviolet radiation can decrease neutral lipid (TAG) and increase membrane lipids (including PC, PE, and PG) under hydroponic conditions, indicating that tea plants could survive UV radiation by decomposing TAG to avoid damaging cells. In addition, the accumulation of phospholipids and galactolipids may be related to avoiding UV damage and enhancing photosynthesis in tea plants under UV radiation. Furthermore, the response of lipid components to UV radiation in tea plants under low nitrogen conditions is significantly lower than that under high nitrogen conditions, which suggests that excessive nitrogen application may reduce the resistance of tea plants to UV radiation. This study provides a theoretical basis for optimizing cultivation measures based on tea UV resistance.

1. Introduction

The tea plant (Camellia sinensis L.), belonging to the genus Camellia of the Theaceae family, is an important cash crop. The quality of tea mainly depends on the quantity and composition of chemical components (e.g., amino acids, tea polyphenols, catechins, and caffeine) in tea leaves [1,2,3].
Studies have shown that the levels of these substances are affected by the nutritional status of tea plants [4,5,6]. After carbon, N is the element required in the largest quantity by plants. Nitrogen is a component of proteins, nucleic acids, chlorophyll, coenzymes, plant hormones, cell walls, and secondary metabolites, among others [7,8]. Nitrogen is absorbed by plants mainly in ammonium or nitrate from soil water. Studies have shown that different nitrogen forms and nitrogen supply levels affect enzyme activities, photosynthetic characteristics, hormones, growth, and quality components of plants [9,10,11].
The effects of enhanced surface ultraviolet radiation (<400 nm) caused by ozone layer decay on plants have attracted much attention [12]. Many studies have shown that ultraviolet radiation inhibits the growth of most plants [13,14,15,16]. Ultraviolet damage to plant cells mainly focuses on the genetic system, photosynthetic system, and membrane lipids. UV-B can cause peroxidation damage to fatty acids in the chloroplast membrane, reduce the level of chloroplast-specific lipids, and change the proportion of polar lipids [14,15]. A previous study has shown that low doses of UV-B radiation in tea plants can promote the accumulation of catechins, but excessive UV radiation can inhibit it [17]. UV-B radiation can inhibit the cell proliferation of the callus of the tea plant, reduce the cell size, reduce the weight gain of the callus, promote the accumulation of soluble phenolic compounds, and enhance the ability to resist UV radiation [18].
Lipids are the main components of the membrane and play important roles in energy and carbon storage, signal transduction, and stress response [16,19,20]. Lipid metabolism is also an important part of plant stress response [21]. The most abundant lipids in plants are glycerolipids, namely phospholipids and neutral lipids [22]. The composition of plant lipids is affected by various tissues, organs, and plant species, and under drought stress, tea plants can adapt to the adverse environment by regulating the changes of lipids inside [23]. In tea plants, the lipid profile is an important quality component, contributing to aroma formation [24]. The composition of lipid compounds in mature leaves and new shoots of tea plants was different and affected by nitrogen level [25]. Tea plants can maintain C/N balance by activating the carbon stored in TAGs [25]. The plasma membrane is the main target of UV-B radiation injury in plants. Under UV-B radiation, lipid peroxidation was intensified, and plasma membrane permeability was enhanced [26]. A previous study has shown that UV-B radiation can reduce the concentration of monogalactose diacylglycerol (MGDG) in pear membrane lipids [16]. Significantly, polyunsaturated fatty acids are more prone to lipid peroxidation since the presence of double bonds in unsaturated fatty acids greatly increases the possibility of lipid peroxidation [27].
This study treated tea plants with ultraviolet radiation under two nitrogen levels for three periods. Lipidomics analysis was performed on the leaves by ultra-performance liquid chromatography-mass spectrometry (UPLC/MS). This study aimed to evaluate the effects of ultraviolet radiation on lipids in tea leaves and evaluate the effects of nitrogen application on tea plant resistance to ultraviolet stress.

2. Materials and Methods

2.1. Plant Materials and Treatment

The experimental material was annual ‘Longjing 43’ cutting seedlings. It was cultured in a climate chamber by hydroponic (light for 14 h, 26 °C, darkness for 10 h, 20 °C, the relative humidity for 75–80%). The volume of the nutrient solution container was 4.5 L, the inner diameter was 16 cm, and the height was 23 cm. Ninety-six tea plants with the same growth were selected, one box for every four trees, with a total of twenty-four boxes.
The tea plants were cultured in pure water for 2 months and divided into 2 groups with 12 boxes in each group. They were treated with nutrient solutions with low nitrogen (NL, 1.0 mmol·L−1) and high nitrogen (NH, 4.5 mmol·L−1). The nutrient solution formula was improved based on Ruan et al. [28]. The pH value was adjusted to 4.5–5.5, replaced once per week, and ventilated with an air pump for 24 h. After eight weeks of culture, tea plants were treated with UV-B radiation (280–310 nm). Each nitrogen treatment was divided into UV0, UV1, and UV2 groups, with four boxes in each group and UV0 as the control group (UV-B irradiation 0 h·d−1). The LED white light was used as the light source (the intensity was 220 μmol·m−2·s−1). UV1 and UV2 were treated with UV-B with the radiation intensity of 11 μW·cm−2 emitted by LED (Yihao Agricultural Science and Technology Co., Ltd., Hangzhou, China). The radiation time of UV1 was 4 h·d−1 (10:00–14:00), and that of UV2 was 8 h·d−1 (10:00–18:00). Samples were taken after 15 days of treatment. Under the condition that the growth period was consistent, the first three fully expanded leaves at the top were collected as test materials. Six replicates were taken from each treatment group and placed in liquid nitrogen, and then transferred to a −80 °C ultra-low temperature refrigerator for use.

2.2. Lipid Extraction

We extracted lipids according to the method proposed by Giavalisco et al. [29] Under constant freezing conditions, 50 mg of each sample was placed into a 2 mL Eppendorf tube and then dissolved in 1 mL MTBE buffer. The samples were thoroughly mixed in an ice cooled ultrasonication bath for 10 min and extracted at 4 °C on the orbital shaker for 10 min. Then 0.5 mL of water and methanol mixture (water: methanol 3:1) was added, mixed evenly, and centrifuged in a table-top centrifuge at room temperature at 14,000 rpm for 5 min. The top organic phase with the lipid compound was desiccated by lyophilizer (Labconco Co., Kansas City, Missouri, American) overnight and kept frozen before measurement.

2.3. Detecting Lipid Components by UPLC/MS

The extracted lipids were separated on a Waters Acquity UPLC system (Waters, http://www.waters.com, accessed on 5 July 2017) using a C8 reversed-phase column (100 mm × 2.1 mm × 1.7 μm particles; Waters), and the column temperature was 60 °C as established by Giavalisco et al. [29]. The mobile phase was buffer A: UPLC MS grade water containing 1% 1 M NH4Ac and 0.1% acetic acid, buffer B: UPLC grade acetonitrile/isopropyl alcohol mixture with 1% 1M NH4Ac and 0.1% acetic acid (acetonitrile: isopropyl alcohol 7:3). The obtained organic fractions were thoroughly mixed in 500 μL acetonitrile/isopropyl alcohol (7:3). 2 μL of sample were injected, and a linear gradient was always applied, but at the beginning was isocratic at 55% of buffer B for 1 min. Then a linear gradient of 55%B to 65%B for 3 min, and 75%B to 89%B for 8 min and 89%B to 99%B for 3 min. The chromatographic column was washed with 99% B for 3 min and balanced with 55%B for 4 min. The total running time was 22 min.
Mass spectra were obtained using an Exactive Mass Spectrometer (Thermo-Fisher, Waltham, MA, USA). The spectra were alternately recorded between full-scan and all-ion fragmentation-scan modes, with masses ranging from 100 to 1500 m/z. We set the scan resolution to 10,000 and perform ten scans per second. We set the capillary voltage to 3 kV, sheath gas flow value to 60, and auxiliary gas flow to 35 (L/h). We set the capillary temperature to 150 °C, the drying gas temperature in the heated electrospray source was set to 350 °C, the skimmer voltage was set to 25 V, and the tube lens voltage was set at 130 V. We recorded spectra from 1 to 17 min in the UPLC gradient. Use the following substances for internal calibration: phospholipids: PC-12:0-12:0, PA-14:0-14:0, PE-12:0-12:0, PG-20:0-20:0, PI-16:0-18:0, PS-20:0-20:0; lysophospholipids: LPC-19:0, LPG-18:0, LPE-18:0; galactolipids: MGDG-18:0-18:0, DGDG-18:0-18:0; TAG-17:0-17:0-17:0; DAG-17:0-17:0.2.4. Peak annotation, quantification, and data analyses.
Baseline correction, chemical noise reduction, chromatogram alignment, and peak detection were performed on chromatogram primary files using Genedata software (version 9.0, Refiner MS, Basel, Switzerland). After preprocessing, a list of detected peaks and a matrix with their respective intensity can be obtained for each sample.
Peak annotations were performed using the internally developed R package GRM (available on request), based on a library compiled by Giavalisco et al. [29] The software corrects the output matrix against identified markers with known retention time (RT). The compound was then searched by comparing the compound-specific m/z, expected adducts, and RTs within the specified range. Lipid species were identified with a mass error range of 10 ppm. The chromatogram was manually checked with XCalibur (Thermo-Fisher) software to confirm peaks. When an isomer of the same isobaric species was found, it was indicated by adding a number to the parentheses following its name.
Data were statistically analyzed using the online software MetaboAnalyst (https://www.metaboanalyst.ca/, accessed on 4 December 2021). Principal component analysis and partial least squares discriminant analysis obtained the metabolite difference information. The histogram was drawn by GraphPad Prism 8, and the pathway was drawn by Microsoft PowerPoint 2016.

3. Results

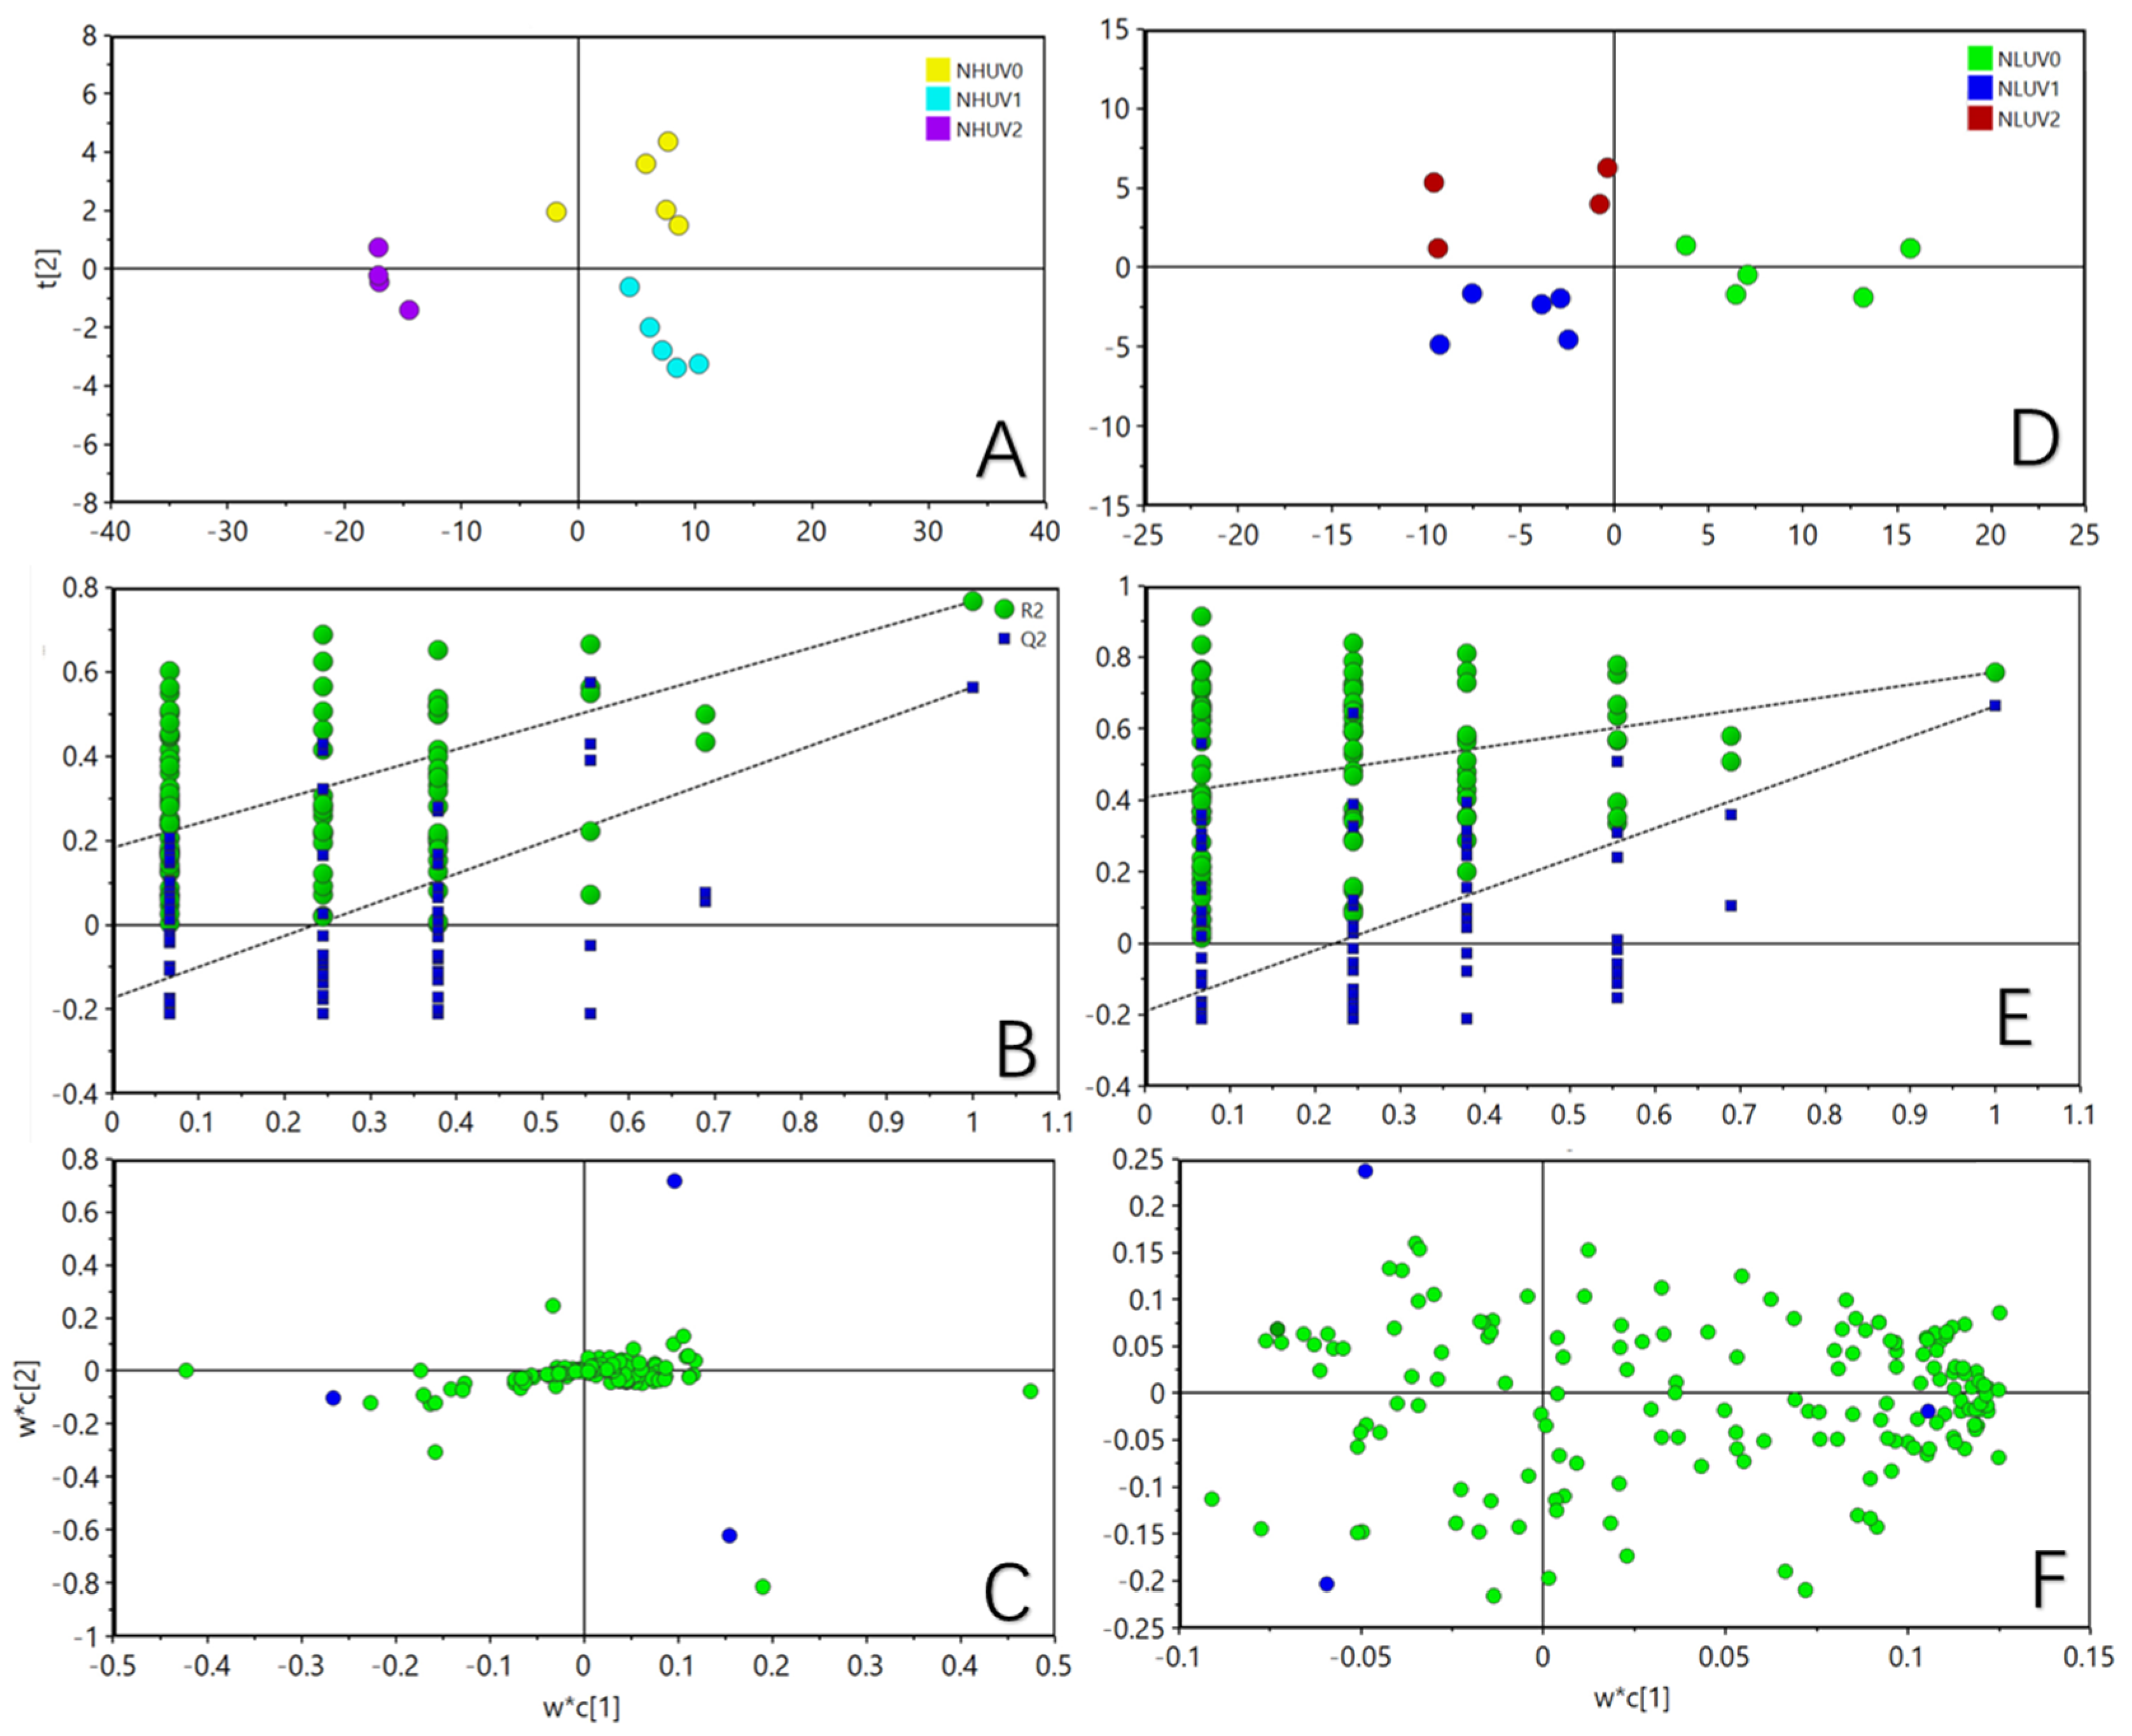
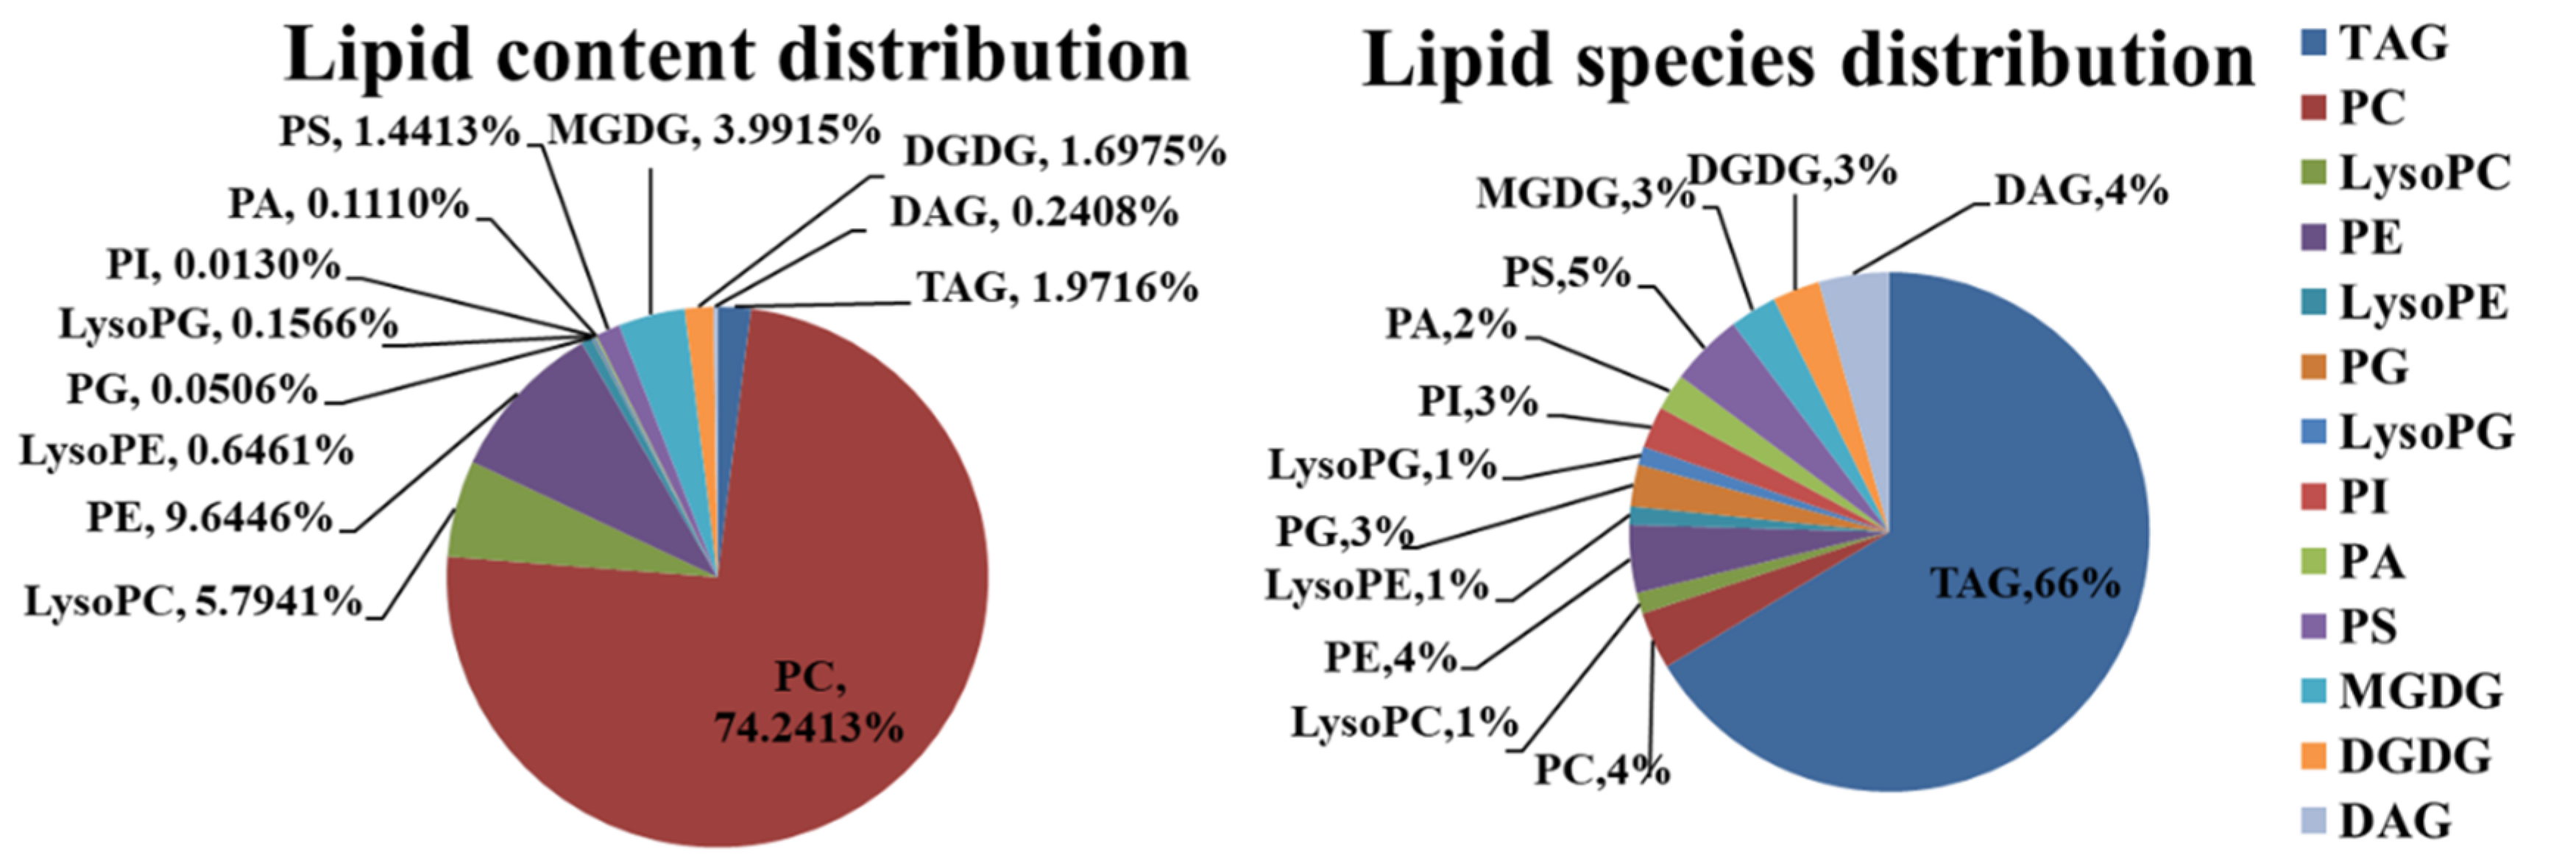
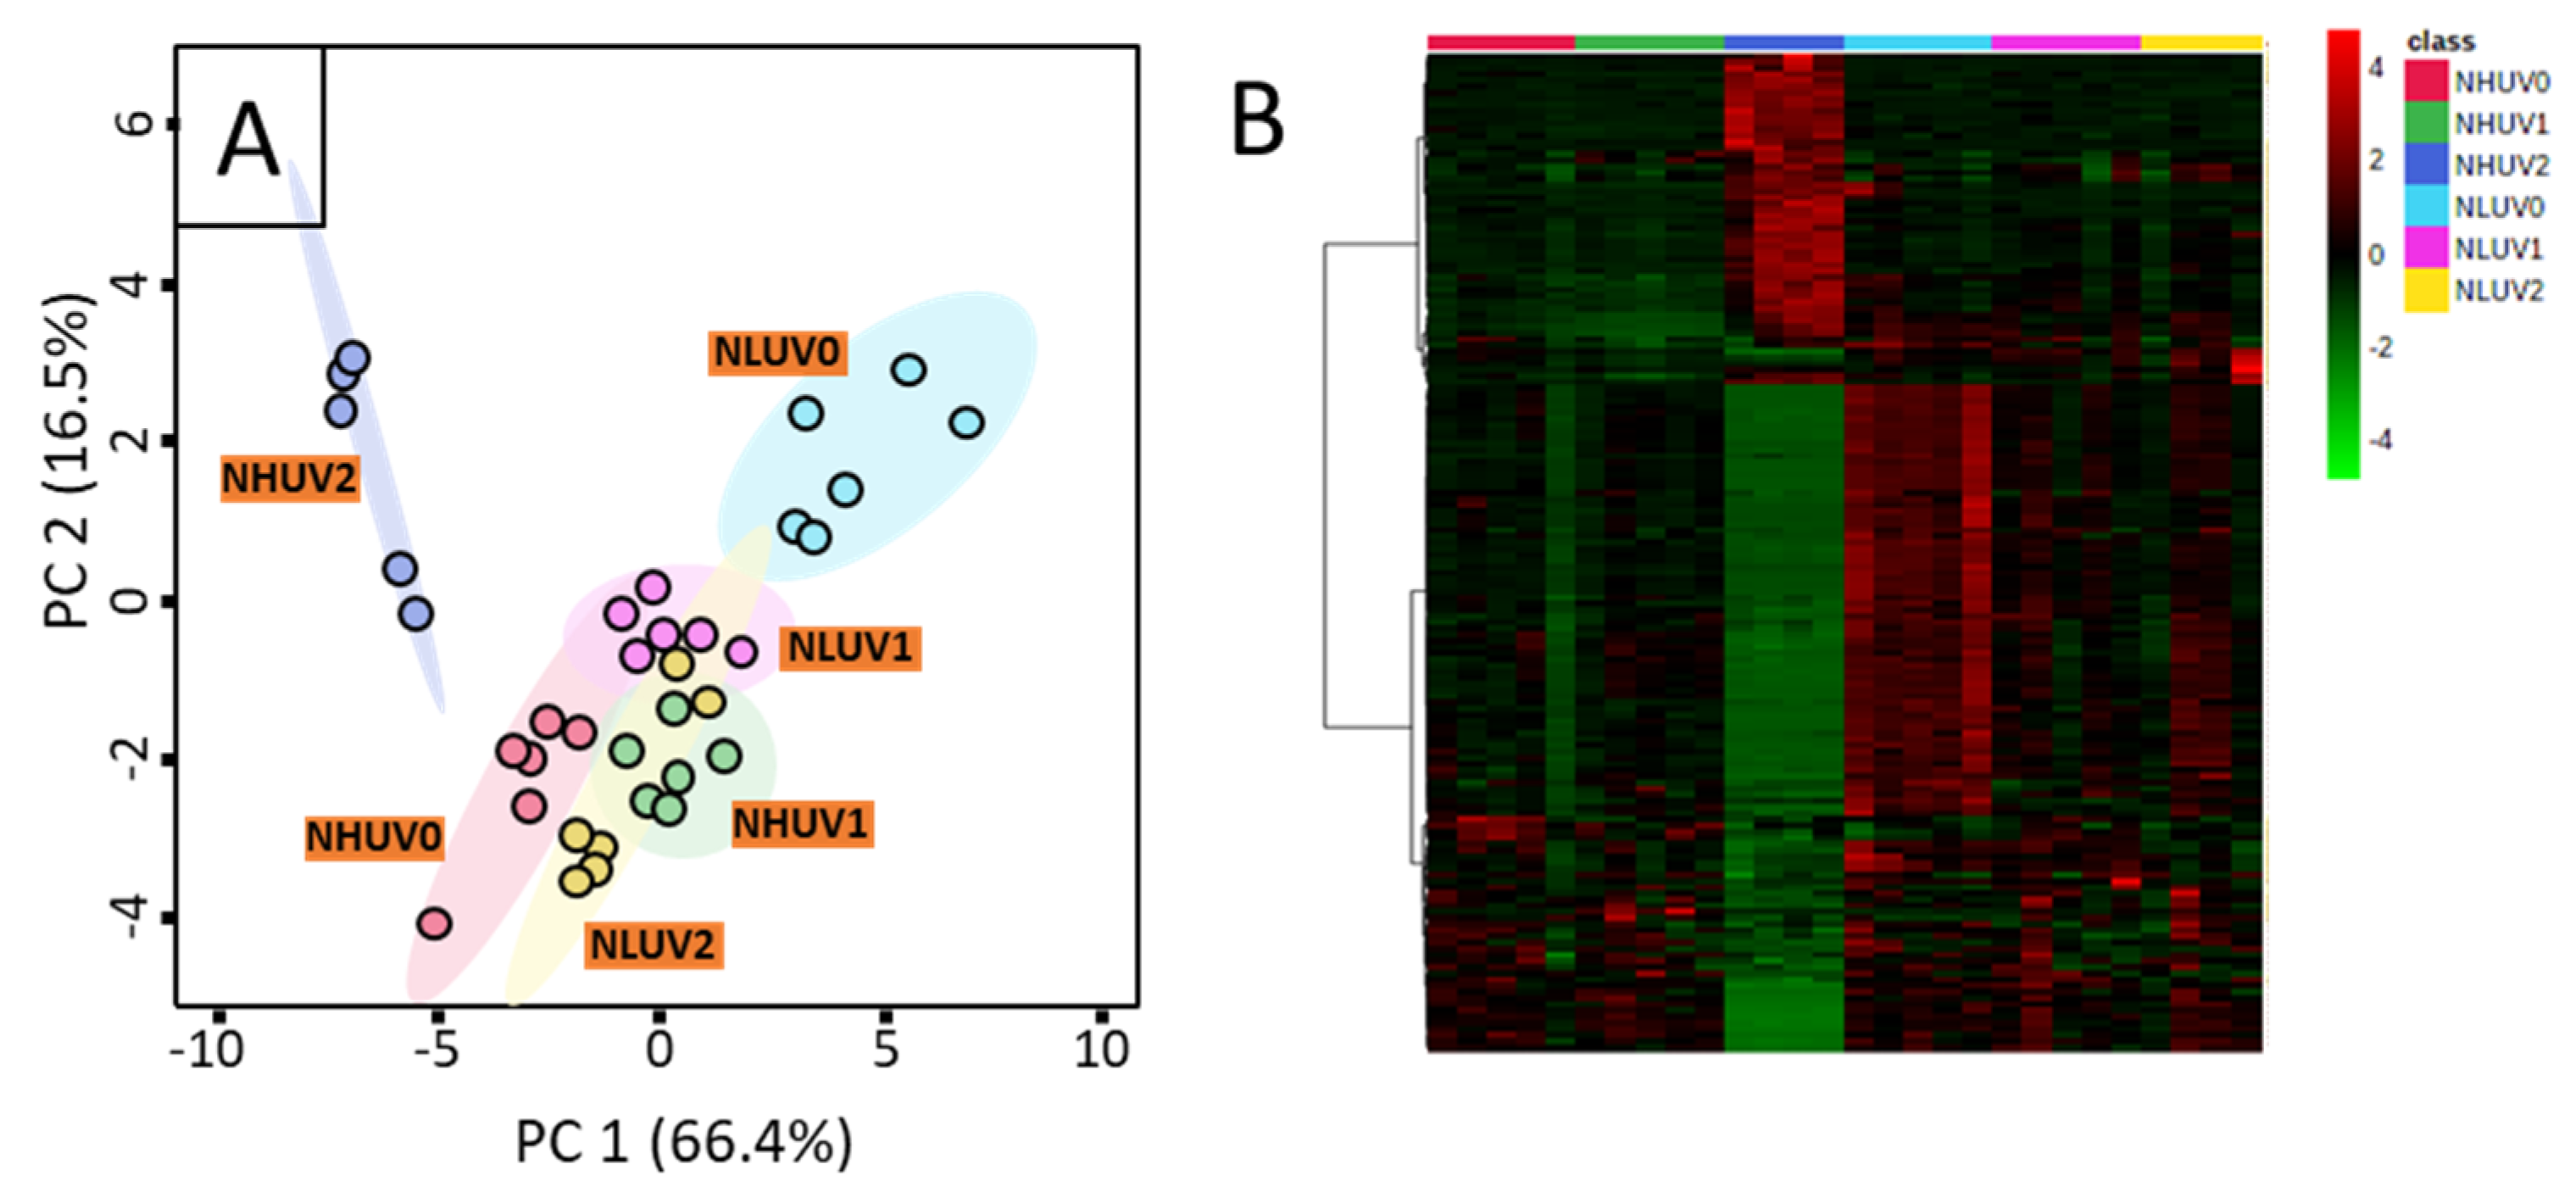
3.1. Lipid Profile Analysis after Ultraviolet Radiation Treatment under Different Nitrogen Levels

Six-hundred-fifteen lipid compounds were identified from the tea leaves (Figure 1). There were 144 phospholipids, including PC, LysoPC, PE, LysoPE, PA, PS, PI, PG and LysoPG, and 36 galactolipids, including 18 species of MGDG and 18 species of DGDG. There were 27 and 408 neutral lipid species DAG and TAG, respectively. All lipid compounds were analyzed by principal component analysis (PCA), and the cumulative contribution rate of the PCA model reached 82.9% (Figure 2A). Principal component 1 (PC1) and principal component 2 (PC2) explained the effects of different nitrogen levels and three levels of ultraviolet radiation on lipids, respectively.
All treatments were relatively clustered within the group except NLUV2, indicating good repeatability of samples within the treatments. Different groups were separated, indicating that lipid composition differed among different treatments. The effects of ultraviolet radiation on the lipid composition of tea plants were different under three nitrogen levels. It can be seen from Figure 2A that, under the high nitrogen treatment, there was a great difference between the group of 8 h ultraviolet radiation treatment and other groups.
Heat maps were made for the selected differential metabolites in each group (Figure 2B). It can be seen from the heat map in Figure 2B that each group can be distinguished, indicating that there were differences in tea lipid components under different treatments.

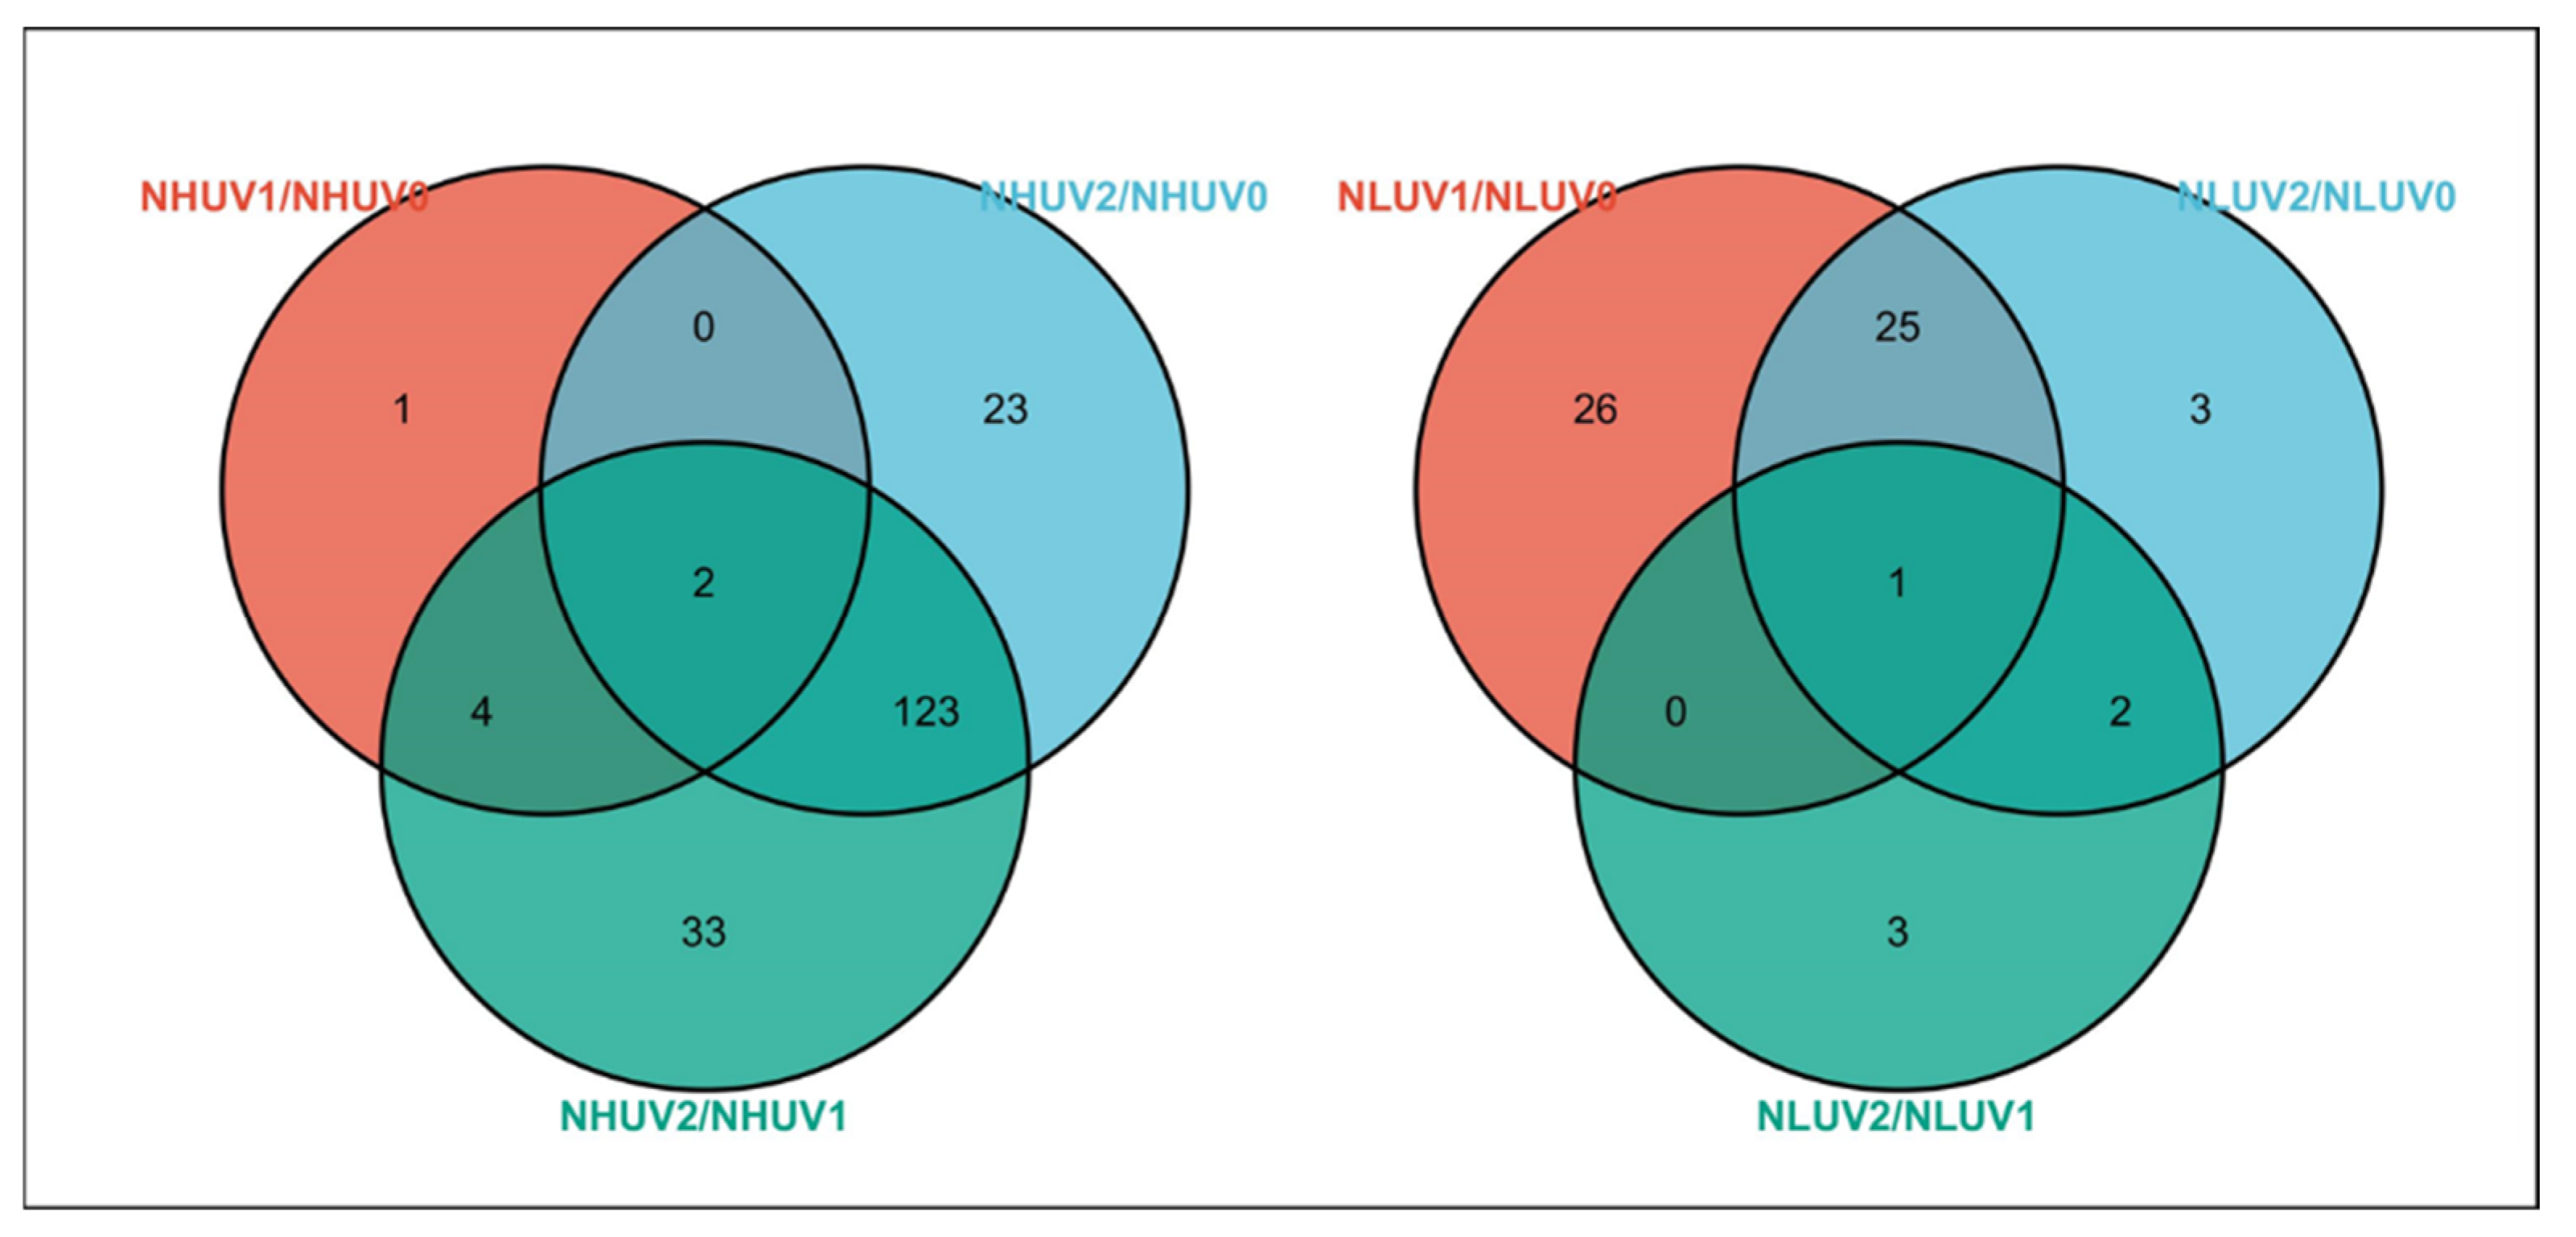
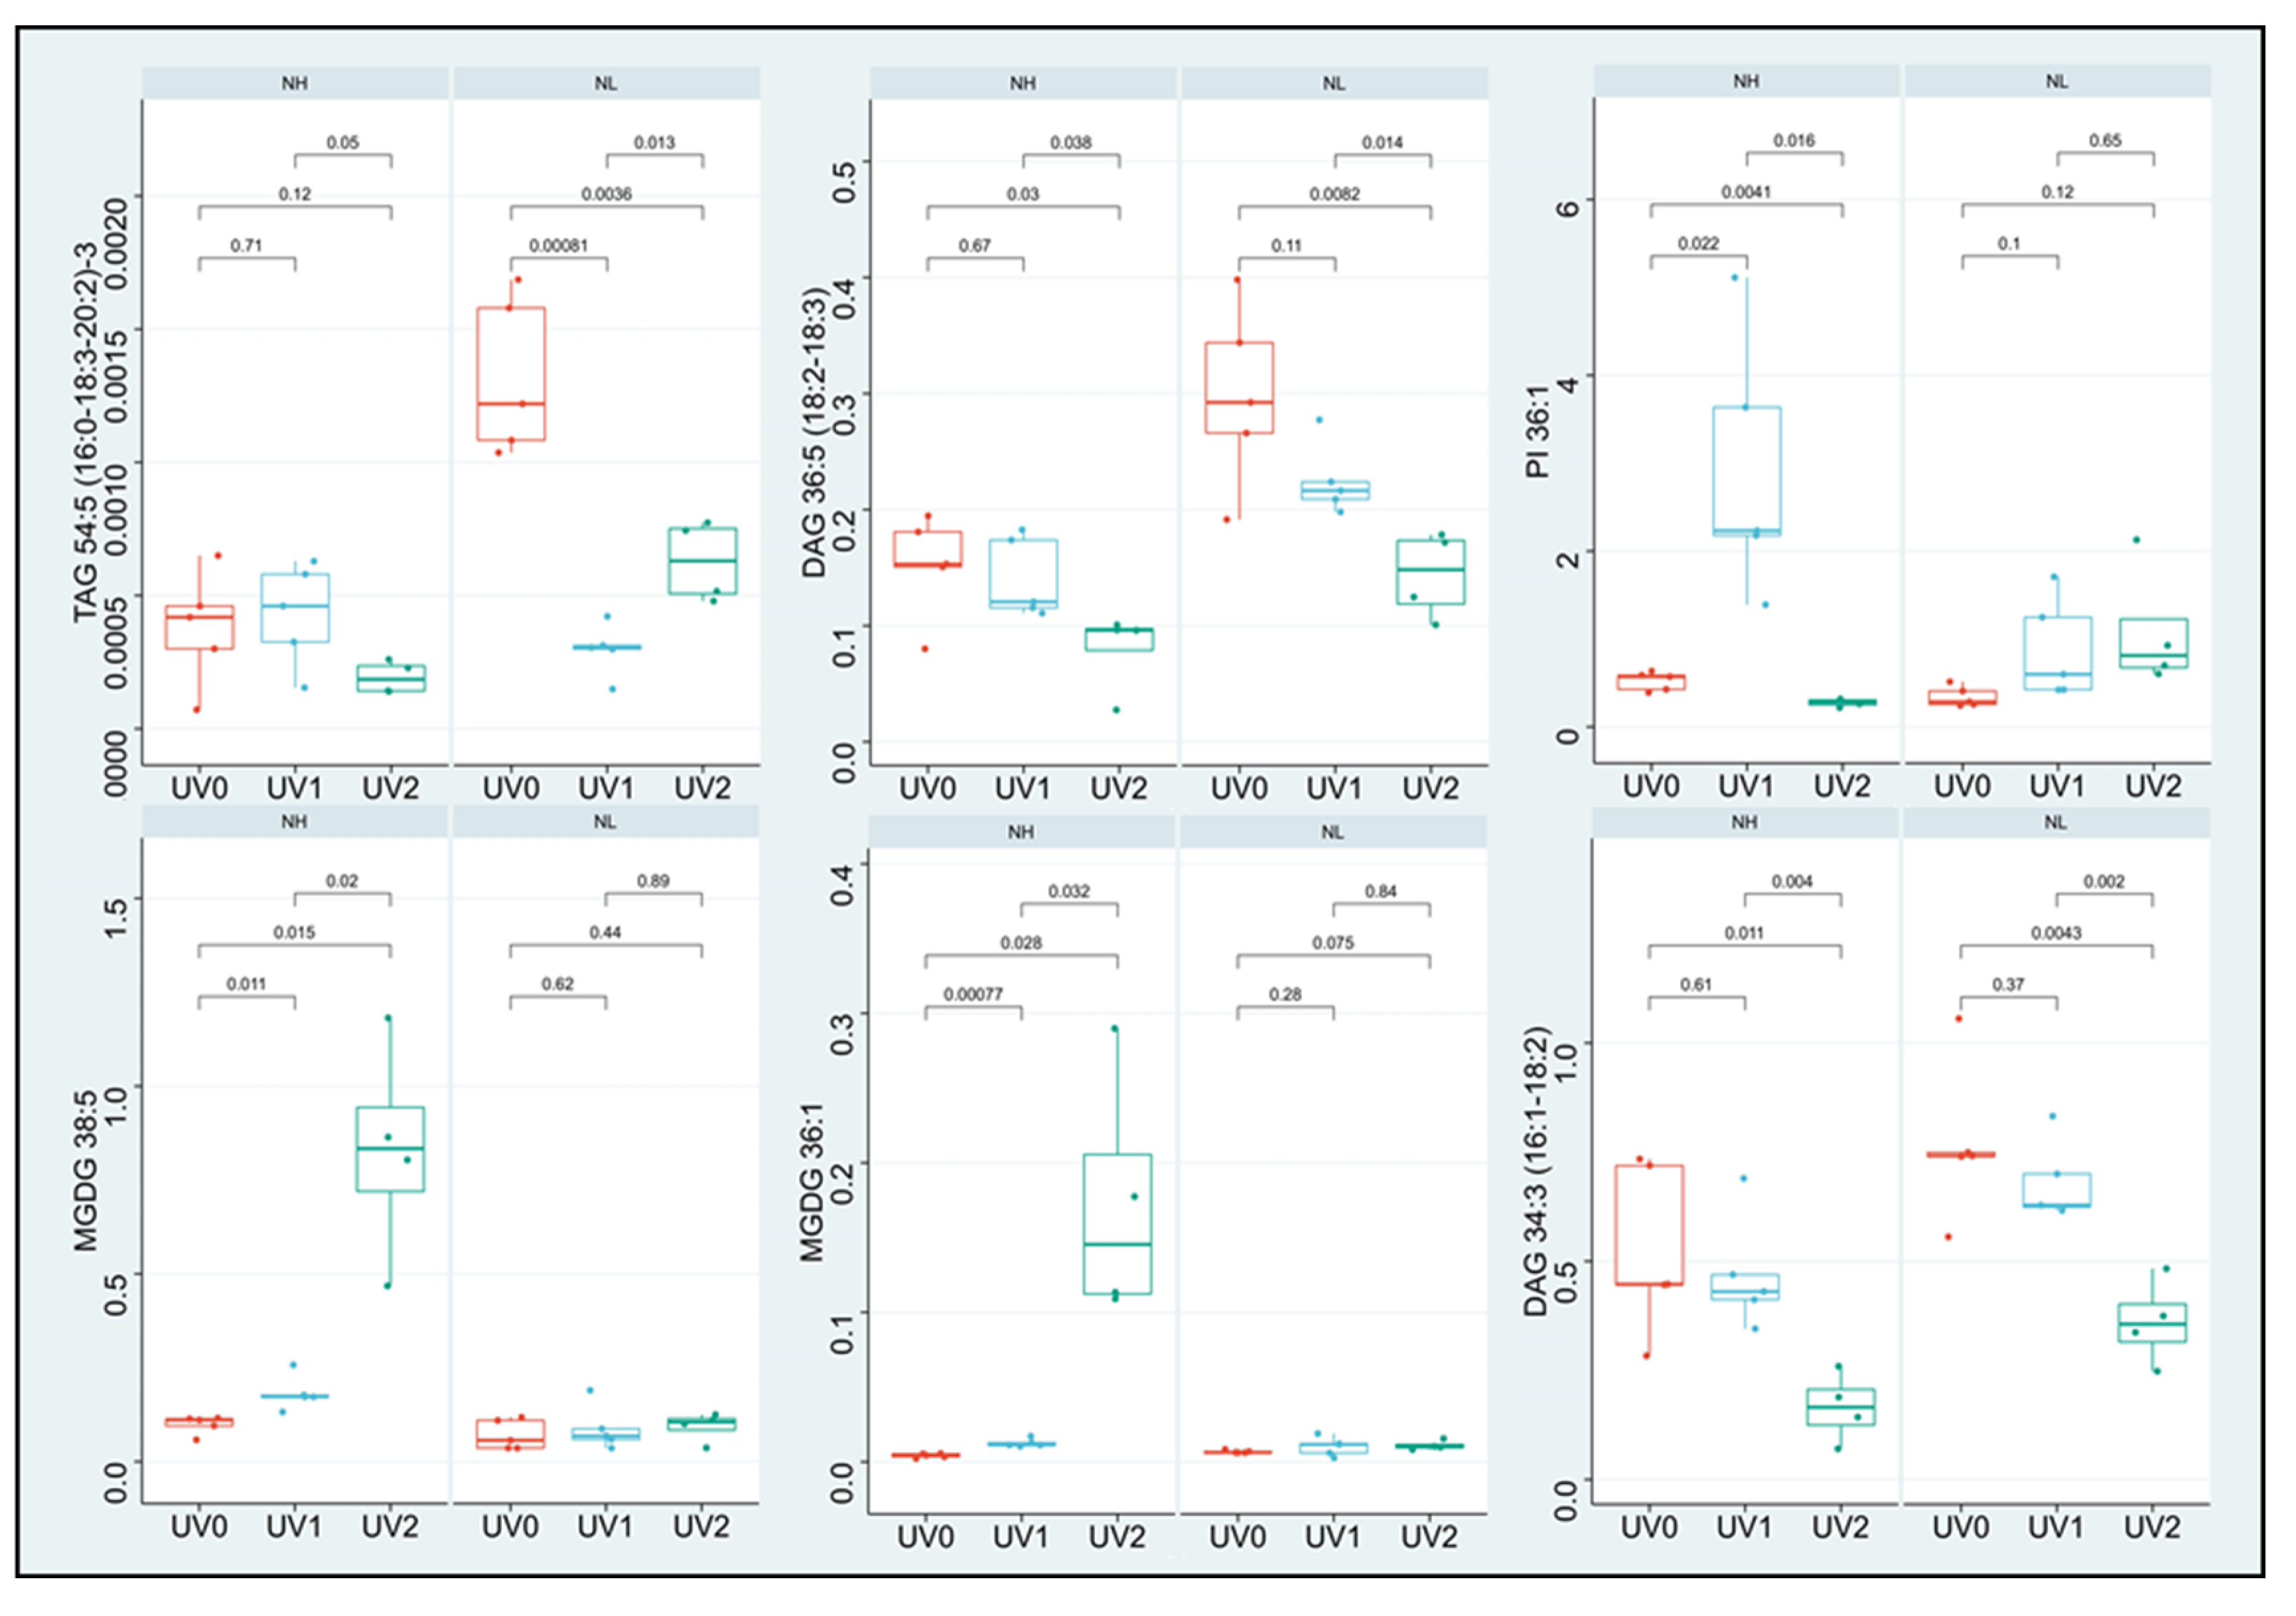
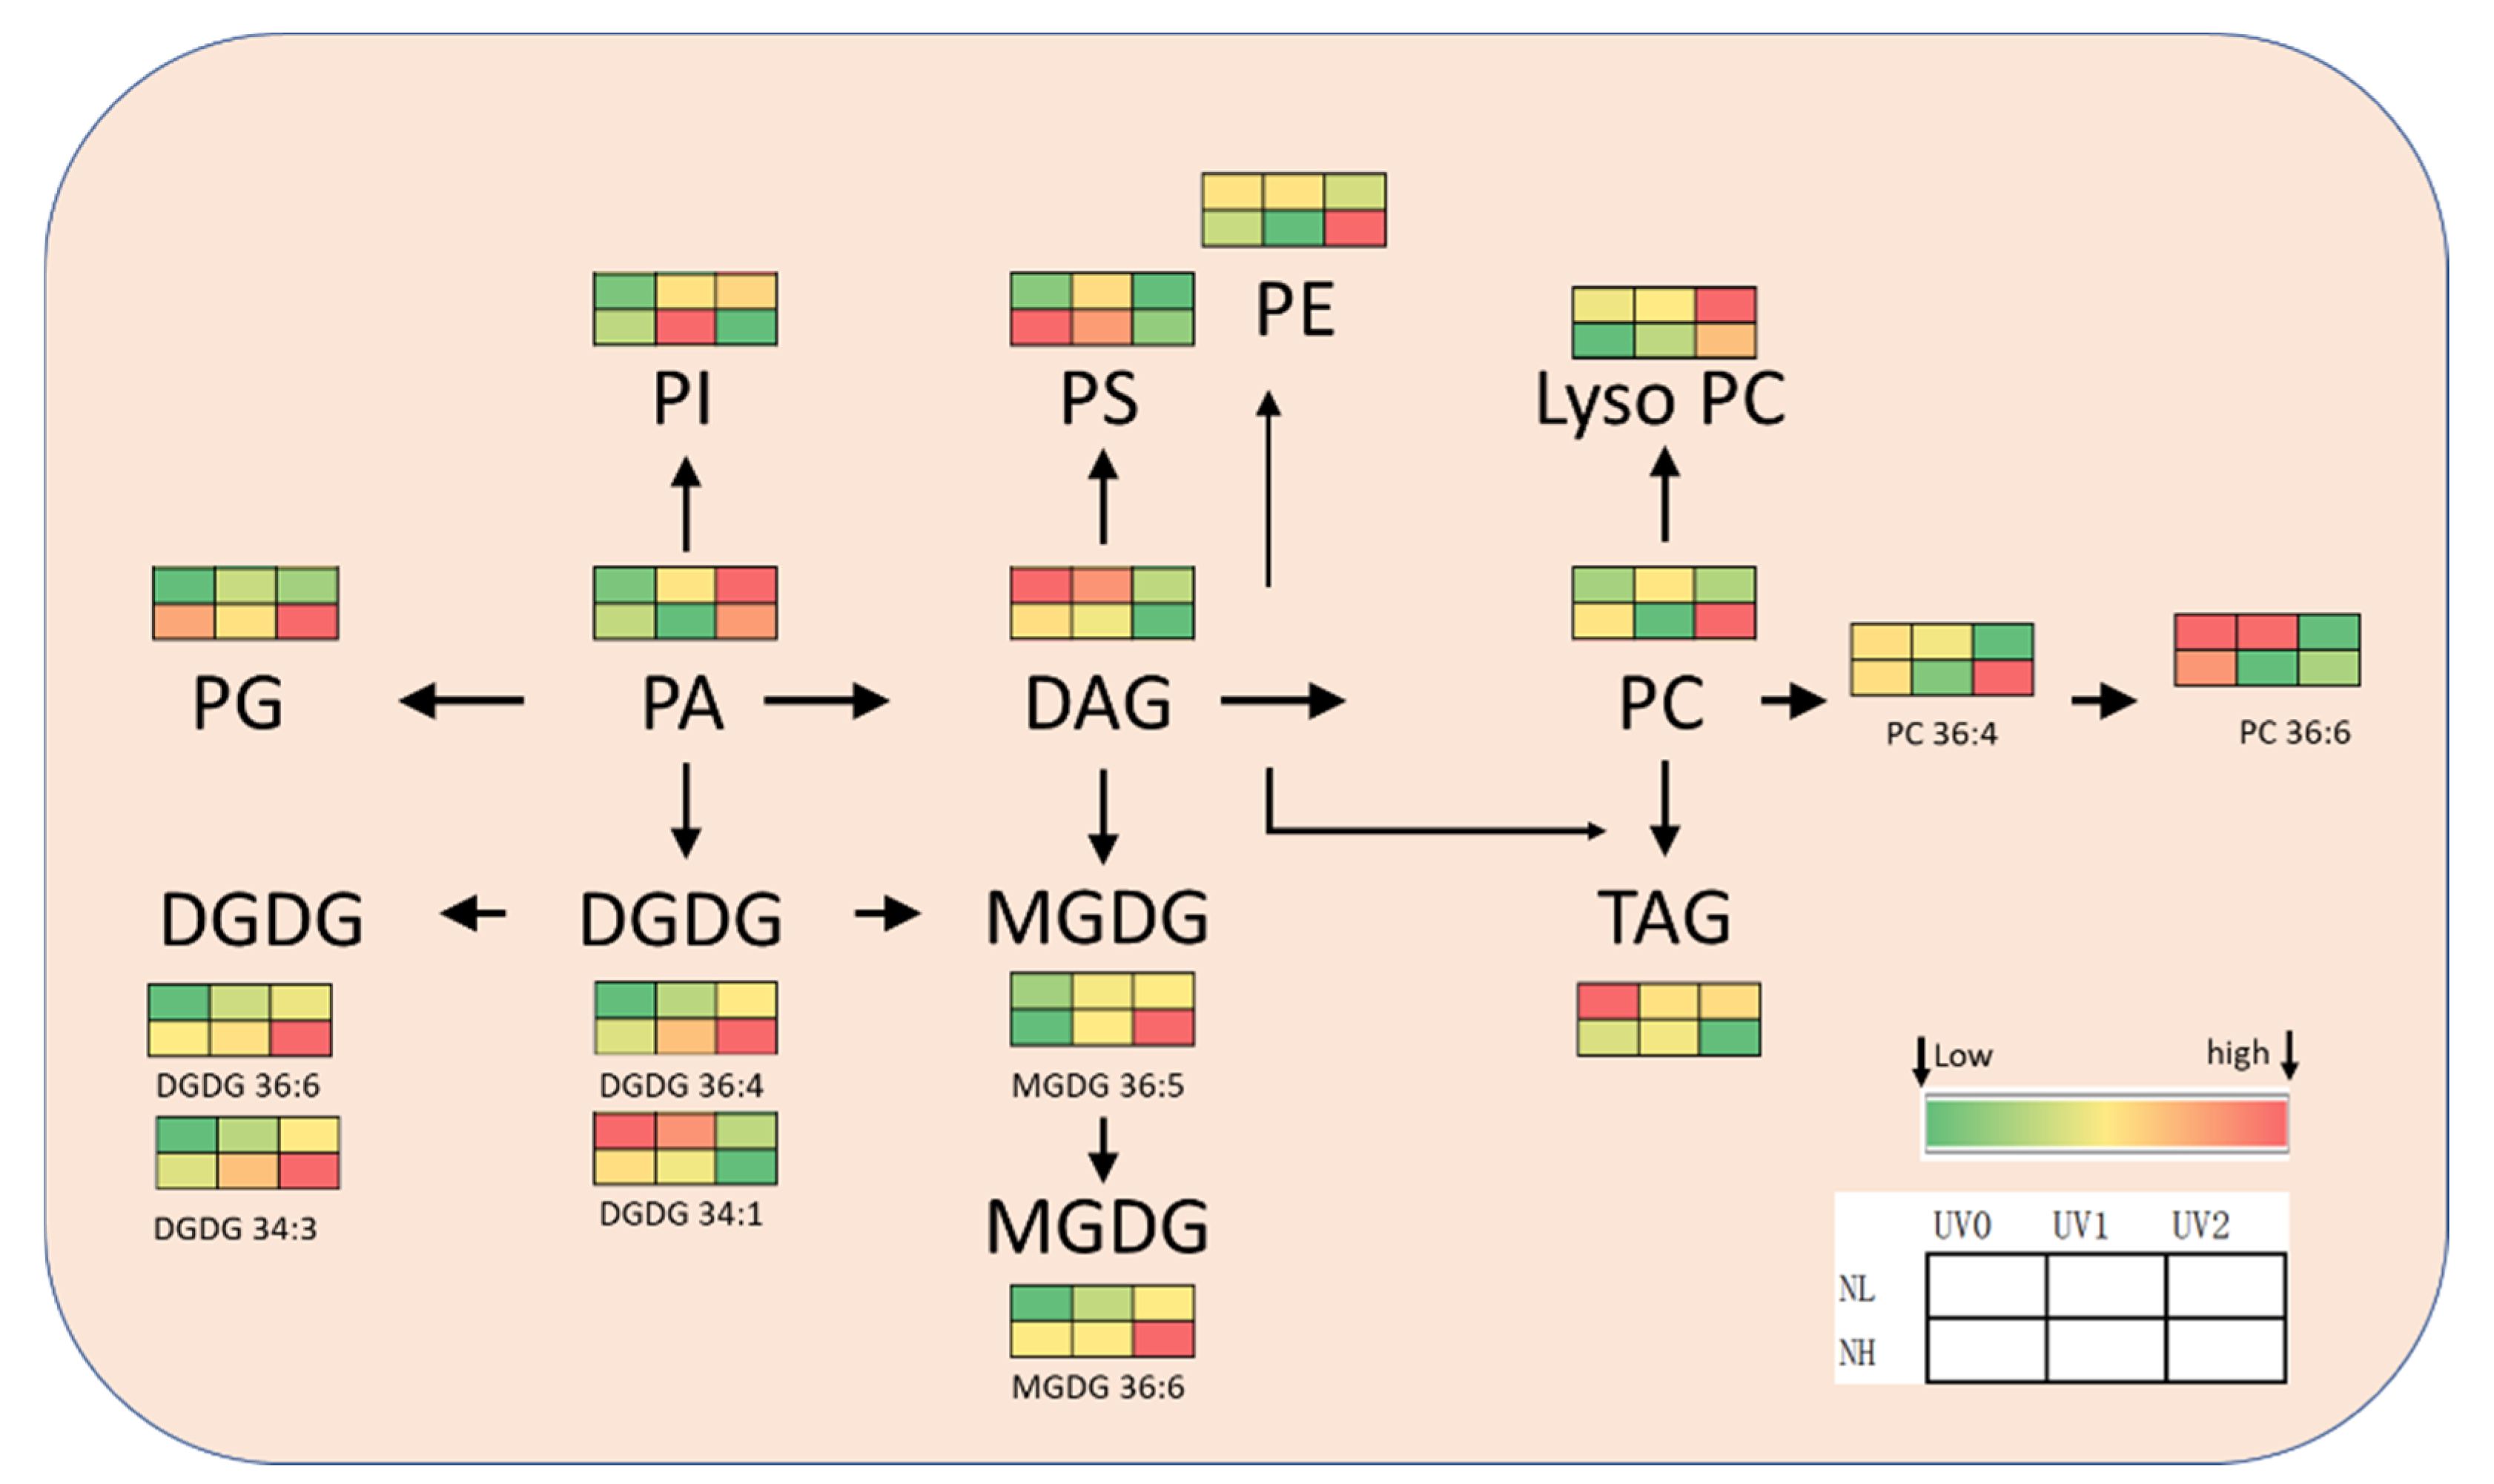
3.2. Effect of Ultraviolet Radiation on Lipids in Tea Leaves under Different Nitrogen Levels

To distinguish the differences among different treatments, partial least-squares discriminant analysis (PLS-DA) was performed on high nitrogen and low nitrogen groups (Figure 3). After 100 permutation tests (Figure 3B,E), R2 and Q2 values generated by random arrangement in any permutation test were all smaller than the original values, and the slope of the line was large, indicating that the PLS-DA model did not overfit and the results were reliable. As can be seen from the score plot (Figure 3A,D), samples from different periods of ultraviolet radiation can be distinguished well under high and low nitrogen, respectively, indicating differences among the different treatments.
The response of lipid changes to UV radiation was different under two nitrogen levels. Under high nitrogen levels, the 8-h radiation group was further away from the other two groups means that the difference between the 8-h radiation group and the other two groups was larger. Moreover, under low nitrogen, the control group was further away from the treatment groups, and the difference between the control and treatment groups was larger. The blue dots in the loadings plot (Figure 3C,F) represented the substance that contributed most to each treatment. According to PLS-DA results, six metabolites (TAG54:5(16:0-18:3-20:2)-3, DAG36:5(18:2-18:3), PI36:1, MGDG38:5, MGDG36:1, DAG34:3(16:1-18:2)) with the most significant differences were selected.
The detected lipids were screened for differential metabolites, and a Venn diagram was drawn (Figure 4). It was found that more differential metabolites were concentrated on UV2/UV0 (148 species) and UV2/UV1 (162 species) in the high nitrogen groups, indicating that NHUV2 had greater differences from the other two groups. The differential metabolites in low nitrogen groups mainly concentrated on UV1/UV0 (53 species) and UV2/UV0 (31 species), indicating that NLUV0 had greater differences from the other two groups. This is consistent with the score plot (Figure 3). Regardless of high or low nitrogen, there are various TAGs in the differential metabolites, indicating that TAGs are the main substances responding to ultraviolet radiation. However, in addition to TAG, many phospholipids and galactose lipids were also present in the differential metabolites under high nitrogen, while only two phospholipids except TAG were present under low nitrogen. In general, there were more differential metabolites in the high nitrogen group.
By analyzing the total amount of detected substances (Table 1), we found that, under low nitrogen, the total amount of phospholipids and glycolipids increased under 4 h radiation, and Lyso PG changed significantly. Under 8 h radiation, LysoPC, LysoPE, and PA increased, and PA had the biggest change fold. Other phospholipids and glycolipids showed a decrease, but only PC, PE, and PS were lower than the control group. Under low nitrogen, the content of DAG and TAG decreased significantly after exposure to ultraviolet radiation. With increasing ultraviolet radiation time under high nitrogen, PI first increased and then decreased significantly. LysoPG decreased with increasing ultraviolet radiation time and changed significantly at 8 h of radiation. The contents of phospholipids first decreased and then increased significantly with the extension of UV radiation time, except Lyso PC, which was all higher than the control group under 8 h of radiation. The content of MGDG increased significantly with the extension of UV radiation time, but the change in DGDG was inconspicuous. The contents of DAG and TAG showed a decreasing trend, and the change in TAG was significant. In summary, DAG and TAG are sensitive to ultraviolet radiation and have significant changes in both high nitrogen and low nitrogen. Phospholipids were more sensitive to ultraviolet changes under high nitrogen.
Six metabolites with the most significant changes were identified (Figure 5), including one TAG, two DAGs, one PI, and two MGDGs. Under low nitrogen, the content of TAG 54:5 (16:0-18:3-20:2)-3 in the control group was extremely significantly different from that in the two treatment groups (p < 0.01), and there was a significant difference between the two treatment groups (p < 0.05). With the increase of ultraviolet radiation time, the content of TAG 54:5 (16:0-18:3-20:2)-3 first decreased and then increased. Ultraviolet radiation made its content decrease compared with the control group. Under high nitrogen, the content of TAG54:5 (16:0-18:3-20:2)-3 increased slightly at 4-h UV radiation, but it was lower than that in the control group at 8-h radiation, and the change was not obvious. The contents of the two kinds of DAG decreased with the increase of ultraviolet radiation time, and the changes of ultraviolet radiation at 8 h under two nitrogen levels were significant or extremely significant compared with the other two groups. However, there was no significant change between 4 h UV radiation and the control group.
The changes of DAG under low nitrogen were significantly greater than that under high nitrogen. Under high nitrogen, the content of PI 36:1 increased first and then decreased with the increase of ultraviolet radiation, and it was lower than the control group at 8 h UV radiation. The changes were all significant (p < 0.05 or p < 0.01). Under low nitrogen, its content increased with the increase of ultraviolet radiation time, but the change was not significant. With the increase in ultraviolet radiation time, two MGDGs showed an upward trend. Under high nitrogen, the differences between different treatments reached a significant or extremely significant level, and the content of the two MGDGs has a significant increase at 8 h ultraviolet radiation. Among the six differential metabolites, neutral lipids TAG and DAG were more significant under low nitrogen, while other lipids were more significant under high nitrogen.
Figure 6 shows a simple pathway of lipid metabolism in plants. The content of PA, the beginning of phospholipid synthesis, increased with ultraviolet radiation. PA can be used as a signaling molecule to regulate the whole process of lipid metabolism and can also be used as a substrate to synthesize PI, PG, DAG, and other substances. DAG, TAG, and PC are important components of the lipid metabolism network, which play an important role in the desaturation of lipid acyl group and the increase of molecular species. TAG is an energy storage substance and serves as a carbon source for secondary metabolism. The decrease in TAG content may be due to increased secondary metabolism stimulated by ultraviolet radiation and increased energy consumption.
TAG decomposition provides abundant acyl species for synthesizing other lipids. The content of DGDG 34:1 decreased, while the content of other DGDGs containing more unsaturated bonds increased, indicating that DGDG desaturation is beneficial to ultraviolet radiation resistance. Conversely, PC tends to convert to molecules with fewer unsaturated bonds. The overall content of PC decreased under low nitrogen levels.

4. Discussion

PC, DAG, and TAG are important for lipids synthesis in plants. Most of the newly formed acyl chains are preferentially entered into PC, where they are acyl edited at the sn-2 site to synthesize DAG and further synthesize TAG and other substances. Then, the acyl groups are recycled into the acyl library to synthesize other phospholipids and enrich the lipid molecular species [30,31]. Phospholipids dominate the cell membrane and are the main component of non-photosynthetic membrane lipids [32,33]. In hydroponic conditions, in all lipids detected in this experiment, the content of PC was the highest, followed by PE. Most of the species are TAG, the storage lipid, followed by DAG and PC. The TAG content was significantly lower than that of PC and PE since leaves have evolved into highly specialized “source” tissues for synthesizing and exporting carbohydrates and have no tendency to accumulate TAG [34].
Ultraviolet radiation causes lipid peroxidation and increased permeability of plant cell membranes [35,36]. In Yu et al.’s study [37], PS and TAG played an important role in mediating the salt defense response of sweet potato leaves. In their experiment, with the increase of UV radiation time, the total TAG content showed a downward trend, indicating that UV radiation causes TAG decomposition in hydroponic tea leaves. Considering that TAG is a storage lipid (the main carbon and chemical energy storage in plants), the decomposition of TAG in tea leaves can provide a carbon source and energy for the synthesis of other substances [38]. Furthermore, β-oxidation of TAG produces fatty acid-CoA (FA-CoA) and acetyl-CoA (AC-CoA), releasing many acyls molecular species stored in TAG [39]. These products may be used to synthesize other UV-resistant substances. It is worth noting that compared with the control group, the change of total TAG content under 4 h UV radiation is more significant in the low nitrogen group, but the change of total TAG content under 8 h UV radiation is more significant under high nitrogen than that under 4 h radiation and the control group. The difference metabolites in the high nitrogen group were more concentrated on UV2/UV0 and UV2/UV1, indicating that the difference between NHUV2 and the other two groups was greater. The differential metabolites in the low nitrogen group were mainly concentrated on UV1/UV0 and UV2/UV0, indicating that the difference between NLUV0 and the other two groups was greater. Compared with the control group, the differential metabolites at 4 h UV radiation were more at low nitrogen than at high nitrogen. All of the above results indicated that in this experiment, under hydroponic condition, tea plants in the low nitrogen group responded faster to UV stress and that this difference may be related to the degree of defense response.
Glycerophospholipids is the skeleton component of the cell membrane, including PC, PE, PG, PI, and PS, and lysophospholipids are the intermediate products of its metabolic process [38]. In this experiment, under hydroponic condition, PC, PE, LysoPE, PG, LysoPG, and PI were significantly affected by the interaction between UV and nitrogen (Table 1). This response may be related to the activation of phospholipase D (PLD) under stress and the production of signal substance PA [40,41,42]. In addition, among the three phospholipids that make up the thylakoid membrane (PG, PC, and PI), PG has the highest content of unsaturated fatty acids and is vulnerable to free radical attack [43]. In this experiment, under high nitrogen, the contents of PG, PE, and PC decreased first and then increased with UV radiation time. The contents of PG, PE, and PC changed significantly and multiplied with 8 h of UV radiation. A previous study has shown that a negative correlation between the contents of PG, PE, and PC and membrane permeability [44]. Under hydroponic conditions, UV irradiation may damage the membrane structure of tea leaves, thus enhancing the permeability of membrane. Plants reduce membrane permeability by accumulating PC, PE, and PG. Wang et al. [44] reported that the content of PI decreased under drought stress, which is the same as the experimental results. Under UV stress, PI may participate in degradation and form corresponding PA.
Galactolipids are the main component of the chloroplast envelope and thylakoid membrane—accounting for 70–80% of its total lipids—and play an important role in photosynthetic reactions [45,46]. Some galactolipids stabilize the membrane structure, while others are directly involved in photosynthesis [44]. When plants are subjected to low-temperature stress, MGDG molecules are transformed into DGDG to maintain the stability of the thylakoid membrane [47]. In this experiment, MGDG (38:5) and MGDG (36:1) in tea leaves changed significantly under hydroponic condition, and the content increased greatly when exposed to ultraviolet radiation for 8 h under high nitrogen. Studies have shown that galactoglycerolipids plays an important role in photosynthesis and may be induced by environmental stress that may damage membrane integrity. Galactoglycerolipids have specific structural roles in pigment–protein complexes [48,49]. Wang et al. [44] showed that MGDG (38:5) has a strong positive correlation with photosynthetic rate, which may be directly involved in photosynthesis. Their finding indicates that ultraviolet radiation may stimulate the enhancement of photosynthesis.
Nitrogen can promote the rapid growth of plants and increase the water content of plant leaves, but excessive nitrogen will lead to plant overgrowth, reduced resistance, and makes it easy to be infected with diseases and pests. For example, the heat resistance of wheat under low nitrogen levels is significantly stronger than that under high nitrogen conditions [50]. In this experiment, there are more differential metabolites in the high nitrogen group, and the differential metabolites in the low nitrogen group are mainly neutral lipids (such as TAG and DAG). The differential metabolites in the high nitrogen group are not only tagged but also a large number of galactose lipids and phospholipids. Combined with the fact mentioned above that the response speed of TAG under low nitrogen is faster than that under high nitrogen in the hydroponic tea plant, it is speculated that the rapid decomposition of TAG under low nitrogen is conducive to maintaining the lipid homeostasis of cell membrane structures [51].

5. Conclusions

In this study, we analyzed the effects of UV-B radiation on lipidomics of mature tea leaves under two nitrogen levels in hydroponics and revealed the response of tea plants to UV radiation stress under different nitrogen levels. Our results suggest that the response of tea plants to UV radiation was different under different nitrogen application levels and that there were more kinds of differential metabolites under high nitrogen, including neutral lipids, phospholipids, and galactolipids. Under low nitrogen, there were fewer differential metabolites (mainly neutral lipids) and the change of TAGs was more significant. This indicates that excessive nitrogen application may reduce the resistance of the tea plant to UV radiation. The neutral lipid mainly showed a decreasing trend with the increase of ultraviolet radiation time. Phospholipids and galactose lipids showed an opposite trend. This indicates that tea plants survive UV radiation by decomposing TAG and accumulating phospholipids and galactolipids to avoid damaging cells. This study provides a theoretical basis for optimizing the cultivation measures based on tea UV resistance.

Author Contributions

Q.Z. and M.L. gathered samples; M.L. and C.Y. participated in the study design; Q.Z., F.D. and M.L. performed data analysis; Q.Z., S.D., H.C. and M.L interpreted the results and drafted the manuscript; M.L. and J.R. conceived the study, provided funding, and gave guidance on experimental design. All authors have read and agreed to the published version of the manuscript.

Funding

This work was financially supported by the National Key Research and Development Program of China (2021YFD1601105), the Chinese Academy of Agricultural Sciences through the Agricultural Sciences Innovation Project (CAAS-ASTIP-2017-TRICAAS) and the China Agriculture Research System of MOF and MARA (CARS-19).

Institutional Review Board Statement

Not applicable.

Informed Consent Statement

Not applicable.

Data Availability Statement

All data are available in this publication.

Conflicts of Interest

The authors declare no conflict of interest.

Abbreviations

TAGTriacylglycerol
PCPhosphatidylcholine
LysoPCLysophosphatidylcholine
PEPhosphatidylethanolamine
LysoPELysophosphatidylethanolamine
PGPhosphatidylglycerol
LysoPGLysophosphatidylglycerol
PIPhosphatidylinositol
PAPhosphatidylic acid
PSPhosphatidylserine
MGDGMonogalactosyldiglyceride
DGDGDigalactosyldiglyceride
DAGDiacylglycerol

References

  1. Liang, Y.; Lu, J.; Shang, S. Effect of Gibberellins on Chemical Composition and Quality of Tea (Camellia sinensis L.). J. Sci. Food Agric. 1996, 72, 411–414. [Google Scholar] [CrossRef]
  2. Punyasiri, P.; Abeysinghe, I.; Kumar, V.; Treutter, D.; Duy, D.; Gosch, C.; Martens, S.; Forkmann, G.; Fischer, T. Flavonoid biosynthesis in the tea plant Camellia sinensis: Properties of enzymes of the prominent epicatechin and catechin pathways. Arch. Biochem. Biophys. 2004, 431, 22–30. [Google Scholar] [CrossRef]
  3. Zhang, Q.; Ruan, J.T. Analysis and Tasting. In Encyclopedia of Food and Health; Caballero, B., Finglas, P.M., Toldrá, F., Li-Beisson, Y., Eds.; Academic Press: Cambridge, MA, USA, 2016; pp. 256–267. ISBN 978-0-12-384953-3. [Google Scholar]
  4. Ruan, J.; Haerdter, R.; Gerendás, J. Impact of nitrogen supply on carbon/nitrogen allocation: A case study on amino acids and catechins in green tea [Camellia sinensis (L.) O. Kuntze] plants. Plant Biol. 2010, 12, 724–734. [Google Scholar] [CrossRef]
  5. Du, X.H.; Peng, F.R.; Jiang, J.; Tan, P.P.; Wu, Z.Z.; Liang, Y.W.; Zhong, Z.K. Inorganic nitrogen fertilizers induce changes in ammonium assimilation and gas exchange in Camellia sinensis L. Turk. J. Agric. For. 2015, 39, 28–38. [Google Scholar] [CrossRef]
  6. Lin, Z.-H.; Qi, Y.-P.; Chen, R.-B.; Zhang, F.-Z.; Chen, L.-S. Effects of phosphorus supply on the quality of green tea. Food Chem. 2012, 130, 908–914. [Google Scholar] [CrossRef]
  7. Hawkesford, M.; Horst, W.; Kichey, T.; Lambers, H.; Schjoerring, J.; Møller, I.S.; White, P. Functions of Macronutrients. In Marschers’s Mineral Nutrition of Higher Plants, 3rd ed.; Marschner, P., Ed.; Elsevier: Amsterdam, The Netherlands, 2012; pp. 135–189. ISBN 978-0-12-384905-2. [Google Scholar]
  8. Krapp, A. Plant nitrogen assimilation and its regulation: A complex puzzle with missing pieces. Curr. Opin. Plant Biol. 2015, 25, 115–122. [Google Scholar] [CrossRef]
  9. Sharma, S.N.; Sirohi, G.S. The effect of ammonium and nitrate on CO2 assimilation, RuBP and PEP carboxylase activity and dry matter production in wheat. Photosynth. Res. 1987, 12, 265–272. [Google Scholar] [CrossRef]
  10. Rosen, C.J.; Allan, D.L.; Luby, J.J. Nitrogen Form and Solution pH Influence Growth and Nutrition of Two Vaccinium Clones. J. Am. Soc. Hortic. Sci. 1990, 115, 83–89. [Google Scholar] [CrossRef]
  11. Raab, T.K.; Terry, N. Nitrogen Source Regulation of Growth and Photosynthesis in Beta vulgaris L. Plant Physiol. 1994, 105, 1159–1166. [Google Scholar] [CrossRef] [Green Version]
  12. Reifenrath, K.; Müller, C. Species-specific and leaf-age dependent effects of ultraviolet radiation on two Brassicaceae. Phytochemistry 2007, 68, 875–885. [Google Scholar] [CrossRef]
  13. Frohnmeyer, H.; Staiger, D. Ultraviolet-B Radiation-Mediated Responses in Plants. Balancing Damage and Protection. Plant Physiol. 2003, 133, 1420–1428. [Google Scholar] [CrossRef] [Green Version]
  14. Mosadegh, H.; Trivellini, A.; Lucchesini, M.; Ferrante, A.; Maggini, R.; Vernieri, P.; Sodi, A.M. UV-B Physiological Changes Under Conditions of Distress and Eustress in Sweet Basil. Plants 2019, 8, 396. [Google Scholar] [CrossRef] [Green Version]
  15. Gill, S.S.; Anjum, N.A.; Gill, R.; Jha, M.; Tuteja, N. DNA Damage and Repair in Plants under Ultraviolet and Ionizing Radiations. Sci. World J. 2015, 2015, 250158. [Google Scholar] [CrossRef] [Green Version]
  16. Predieri, S.; Norman, H.; Krizek, D.; Pillai, P.; Mirecki, R.; Zimmerman, R. Influence of UV-B radiation on membrane lipid composition and ethylene evolution in ‘Doyenne d’Hiver’ pear shoots grown in vitro under different photosynthetic photon fluxes. Environ. Exp. Bot. 1995, 35, 151–160. [Google Scholar] [CrossRef]
  17. Zheng, X.Q.; Jin, J.; Chen, H.; Du, Y.Y.; Ye, J.H.; Lu, J.L.; Lin, C.; Dong, J.J.; Sun, Q.L.; Wu, L.Y.; et al. Effect of Ultraviolet B Irradiation on Accumulation of Catechins in Tea (Camellia sinensis (L.) O. kuntze). Afr. J. Biotechnol. 2008, 7, 3283–3287. [Google Scholar] [CrossRef]
  18. Zagoskina, N.; Dubravina, G.A.; Alyavina, A.K.; Goncharuk, E.A. Effect of Ultraviolet (UV-B) Radiation on the Formation and Localization of Phenolic Compounds in Tea Plant Callus Cultures. Russ. J. Plant Physiol. 2003, 50, 270–275. [Google Scholar] [CrossRef]
  19. Shimojima, M. Biosynthesis and functions of the plant sulfolipid. Prog. Lipid Res. 2011, 50, 234–239. [Google Scholar] [CrossRef]
  20. Horn, P.J.; Chapman, K.D. Lipidomics in situ: Insights into plant lipid metabolism from high resolution spatial maps of metabolites. Prog. Lipid Res. 2014, 54, 32–52. [Google Scholar] [CrossRef]
  21. Lavell, A.A.; Benning, C. Cellular Organization and Regulation of Plant Glycerolipid Metabolism. Plant Cell Physiol. 2019, 60, 1176–1183. [Google Scholar] [CrossRef]
  22. Li-Beisson, Y.; Nakamura, Y.; Harwood, J. Lipids: From Chemical Structures, Biosynthesis, and Analyses to Industrial Applications. In Lipids in Plant and Algae Development; Nakamura, Y., Li-Beisson, Y., Eds.; Springer International Publishing: Basel, Switzerland, 2016; Volume 86, pp. 1–18. ISBN 978-3-319-25977-2. [Google Scholar]
  23. Gai, Z.; Wang, Y.; Ding, Y.; Qian, W.; Qiu, C.; Xie, H.; Sun, L.; Jiang, Z.; Ma, Q.; Wang, L.; et al. Exogenous abscisic acid induces the lipid and flavonoid metabolism of tea plants under drought stress. Sci. Rep. 2020, 10, 12275. [Google Scholar] [CrossRef]
  24. Li, J.; Hua, J.; Zhou, Q.; Dong, C.; Wang, J.; Deng, Y.; Yuan, H.; Jiang, Y. Comprehensive Lipidome-Wide Profiling Reveals Dynamic Changes of Tea Lipids during Manufacturing Process of Black Tea. J. Agric. Food Chem. 2017, 65, 10131–10140. [Google Scholar] [CrossRef]
  25. Liu, M.-Y.; Burgos, A.; Ma, L.; Zhang, Q.; Tang, D.; Ruan, J. Lipidomics analysis unravels the effect of nitrogen fertilization on lipid metabolism in tea plant (Camellia sinensis L.). BMC Plant Biol. 2017, 17, 165. [Google Scholar] [CrossRef] [Green Version]
  26. Li, Y.; Zu, Y.; Gao, Z.; Gao, G. Physiological and Biochemical Effects of UV-B Radiation on Primula Malacoides. Acta Bot. Boreali-Occident. Sin. 2006, 26, 179–182. [Google Scholar]
  27. Pospíšil, P.; Yamamoto, Y. Damage to photosystem II by lipid peroxidation products. Biochim. Biophys. Acta (BBA)-Gen. Subj. 2017, 1861, 457–466. [Google Scholar] [CrossRef]
  28. Ruan, J.; Gerendás, J.; Härdter, R.; Sattelmacher, B. Effect of Nitrogen Form and Root-zone pH on Growth and Nitrogen Uptake of Tea (Camellia sinensis) Plants. Ann. Bot. 2007, 99, 301–310. [Google Scholar] [CrossRef] [Green Version]
  29. Giavalisco, P.; Li, Y.; Matthes, A.; Eckhardt, A.; Hubberten, H.-M.; Hesse, H.; Segu, S.; Hummel, J.; Köhl, K.; Willmitzer, L. Elemental formula annotation of polar and lipophilic metabolites using 13C, 15N and 34S isotope labelling, in combination with high-resolution mass spectrometry. Plant J. 2011, 68, 364–376. [Google Scholar] [CrossRef]
  30. Bates, P.D.; Ohlrogge, J.B.; Pollard, M. Incorporation of Newly Synthesized Fatty Acids into Cytosolic Glycerolipids in Pea Leaves Occurs via Acyl Editing. J. Biol. Chem. 2007, 282, 31206–31216. [Google Scholar] [CrossRef] [Green Version]
  31. Bates, P.; Durrett, T.P.; Ohlrogge, J.B.; Pollard, M. Analysis of Acyl Fluxes through Multiple Pathways of Triacylglycerol Synthesis in Developing Soybean Embryos. Plant Physiol. 2009, 150, 55–72. [Google Scholar] [CrossRef] [Green Version]
  32. Quartacci, M.F.; Pinzino, C.; Sgherri, C.; Navari-Izzo, F. Lipid Composition and Protein Dynamics in Thylakoids of Two Wheat Cultivars Differently Sensitive to Drought. Plant Physiol. 1995, 108, 191–197. [Google Scholar] [CrossRef] [Green Version]
  33. Gigon, A.; Matos, A.-R.; Laffray, D.; Zuily-Fodil, Y.; Pham-Thi, A.-T. Effect of Drought Stress on Lipid Metabolism in the Leaves of Arabidopsis thaliana (Ecotype Columbia). Ann. Bot. 2004, 94, 345–351. [Google Scholar] [CrossRef]
  34. Chapman, K.D.; Dyer, J.M.; Mullen, R.T. Commentary: Why don’t plant leaves get fat? Plant Sci. 2013, 207, 128–134. [Google Scholar] [CrossRef] [PubMed]
  35. Murphy, T.M.; Vu, H. Photoinactivation of Superoxide Synthases of the Plasma Membrane from Rose (Rosa damascena Mill.) Cells. Photochem. Photobiol. 1996, 64, 106–109. [Google Scholar] [CrossRef]
  36. Mishra, R.K.; Singhal, G.S. Function of Photosynthetic Apparatus of Intact Wheat Leaves under High Light and Heat Stress and Its Relationship with Peroxidation of Thylakoid Lipids. Plant Physiol. 1992, 98, 1–6. [Google Scholar] [CrossRef] [Green Version]
  37. Yu, Y.; Kou, M.; Gao, Z.; Liu, Y.; Xuan, Y.; Liu, Y.; Tang, Z.; Cao, Q.; Li, Z.; Sun, J. Involvement of Phosphatidylserine and Triacylglycerol in the Response of Sweet Potato Leaves to Salt Stress. Front. Plant Sci. 2019, 10, 1086. [Google Scholar] [CrossRef] [PubMed] [Green Version]
  38. Buchanan, B.B.; Gruissem, W.; Jones, R.L. Biochemistry & Molecular Biology of Plants, 1st ed.; American Society of Plant Physiologists: Rockville, MD, USA, 2000; p. 1367. ISBN 7-03-012013-2. [Google Scholar]
  39. Theodoulou, F.L.; Eastmond, P.J. Seed storage oil catabolism: A story of give and take. Curr. Opin. Plant Biol. 2012, 15, 322–328. [Google Scholar] [CrossRef] [PubMed]
  40. Testerink, C.; Munnik, T. Phosphatidic acid: A multifunctional stress signaling lipid in plants. Trends Plant Sci. 2005, 10, 368–375. [Google Scholar] [CrossRef]
  41. Welti, R.; Li, W.; Li, M.; Sang, Y.; Biesiada, H.; Zhou, H.E.; Rajashekar, C.B.; Williams, T.D.; Wang, X. Profiling membrane lipids in plant stress responses: Role of phospholipase Dα in freezing-induced lipid changes in arabidopsis. J. Biol. Chem. 2002, 277, 31994–32002. [Google Scholar] [CrossRef] [Green Version]
  42. Zien, C.A.; Wang, C.; Wang, X.; Welti, R. In vivo substrates and the contribution of the common phospholipase D, PLDα, to wound-induced metabolism of lipids in Arabidopsis. Biochim. Biophys. Acta (BBA)-Mol. Cell Biol. Lipids 2001, 1530, 236–248. [Google Scholar] [CrossRef]
  43. Zhou, G.; Liu, Z.; Li, J.; Wang, B.; Huang, J. Effect of Water Stress on Membrane Lipid Peroxidation of Chloroplast from Wheat. J. Beijing Agric. Coll. 2003, 02, 86–88. [Google Scholar] [CrossRef]
  44. Wang, Y.; Zhang, X.; Huang, G.; Feng, F.; Liu, X.; Guo, R.; Gu, F.; Zhong, X.; Mei, X. Dynamic changes in membrane lipid composition of leaves of winter wheat seedlings in response to PEG-induced water stress. BMC Plant Biol. 2020, 20, 84. [Google Scholar] [CrossRef]
  45. Hölzl, G.; Witt, S.; Gaude, N.; Melzer, M.; Schöttler, M.A.; Dörmann, P. The Role of Diglycosyl Lipids in Photosynthesis and Membrane Lipid Homeostasis in Arabidopsis. Plant Physiol. 2009, 150, 1147–1159. [Google Scholar] [CrossRef] [PubMed] [Green Version]
  46. Dorne, A.J.; Joyard, J.; Douce, R. Do thylakoids really contain phosphatidylcholine? Proc. Natl. Acad. Sci. USA 1990, 87, 71–74. [Google Scholar] [CrossRef] [PubMed] [Green Version]
  47. Tarazona, P.; Feussner, K.; Feussner, I. An enhanced plant lipidomics method based on multiplexed liquid chromatography-mass spectrometry reveals additional insights into cold- and drought-induced membrane remodeling. Plant J. 2015, 84, 621–633. [Google Scholar] [CrossRef] [PubMed]
  48. Boudière, L.; Michaud, M.; Petroutsos, D.; Rébeillé, F.; Falconet, D.; Bastien, O.; Roy, S.; Finazzi, G.; Rolland, N.; Jouhet, J.; et al. Glycerolipids in photosynthesis: Composition, synthesis and trafficking. Biochim. Biophys. Acta 2014, 1837, 470–480. [Google Scholar] [CrossRef]
  49. Moellering, E.R.; Benning, C. Galactoglycerolipid metabolism under stress: A time for remodeling. Trends Plant Sci. 2011, 16, 98–107. [Google Scholar] [CrossRef]
  50. Bencze, S.; Keresztényi, E.; Veisz, O. Change in heat stress resistance in wheat due to soil nitrogen and atmospheric CO2 levels. Cereal Res. Commun. 2007, 35, 229–232. [Google Scholar] [CrossRef]
  51. Xu, C.; Shanklin, J. Triacylglycerol Metabolism, Function, and Accumulation in Plant Vegetative Tissues. Annu. Rev. Plant Biol. 2016, 67, 179–206. [Google Scholar] [CrossRef]
Figure 1. Map of lipid species and content distribution in tea leaves. A total of 615 lipid compounds were identified, and their species distribution and content distribution were shown in the figure.
Horticulturae 08 00724 g001
Figure 2. Scores plot of principal component analysis of lipids content in tea leaves (A). The dots represent individual samples, and the ellipses represent 95% confidence intervals. Heat map of lipid content changes in tea leaves (B). A column represents a set of samples, with each pixel representing a metabolite, in which red represents high concentration and green represents low concentration.
Horticulturae 08 00724 g002
Figure 3. Scores plot (A,D), permutation tests (B,E), loadings plot (C,F) of high (A,B,C) or low (D,E,F) nitrogen treatment of partial least-squares discriminant analysis (PLS-DA) of lipid content in tea leaves. The blue dots in the loadings plot (C,F) represented the substance that contributed most to each treatment. Each green dot represents a substance.
Horticulturae 08 00724 g003
Figure 4. Venn diagram of lipid differential metabolites in tea leaves under different UV-B treatments under high/low (left/right) nitrogen conditions.
Horticulturae 08 00724 g004
Figure 5. Six lipids with the most significant changes in tea leaves were screened according to PLS-DA results.
Horticulturae 08 00724 g005
Figure 6. Diagram of simple pathways of lipid metabolism in plants. The square shows the changes of lipid content in tea leaves under different treatments, where green indicates low content and red indicates high content.
Horticulturae 08 00724 g006
Table 1. Fold change of lipid content in tea leaves under different UV-B treatments under high/low nitrogen levels (NH/NL). The ‘*’ indicates a significant difference (p < 0.05).
NLNH
UV1/UV0UV2/UV0UV2/UV1UV1/UV0UV2/UV0UV2/UV1
PC1.010.850.840.861.311.53 *
LysoPC1.101.681.520.860.871.01
PE1.000.820.820.732.87 *3.93 *
LysoPE1.111.631.460.834.08 *4.91 *
PG1.441.190.830.953.91 *4.10 *
LysoPG1.44 *1.140.790.830.44 *0.53 *
PI1.511.460.971.560.17 *0.11 *
PA1.112.862.590.881.251.42
PS1.040.930.890.941.421.51
MGDG1.411.250.891.234.423.60
DGDG1.341.180.890.861.371.58
DAG0.910.75 *0.82 *1.060.780.74
TAG0.64 *0.65 *1.021.120.39 *0.35 *
Publisher’s Note: MDPI stays neutral with regard to jurisdictional claims in published maps and institutional affiliations.

