Article

Biochemical and Proteome Analysis Reveal Different Nutritional Compound Compositions and Chloroplast Development Situations between Purple-Red and White-Yellow Tea Plant Cultivars

1
Tea Research Institute, Hangzhou Academy of Agricultural Sciences, Hangzhou 310024, China
2
National Center for Tea Plant Improvement, Tea Research Institute, Chinese Academy of Agricultural Sciences, Hangzhou 310008, China
*
Authors to whom correspondence should be addressed.
Horticulturae 2022, 8(8), 685; https://doi.org/10.3390/horticulturae8080685
Submission received: 8 July 2022 / Revised: 27 July 2022 / Accepted: 27 July 2022 / Published: 28 July 2022
(This article belongs to the Special Issue Advances in Tea Plant Biology and Tea Quality Regulation)

Abstract

:
Across the world, most of the main tea plant cultivars are green-leaf cultivars, but colored-leaf cultivars have become increasingly popular in recent years. In this research, the differences between purple-red and white-yellow tea plant cultivars were compared on biochemical and proteome levels. White-yellow cultivars had significantly high amino acid (AA) content and low polyphenols/amino acid (PP/AA), while purple-red cultivars showed high PP/AA. Comprehensive analysis of all nutritional compounds revealed that most of them showed significant positive correlations, except AA, and that there were significant negative correlations between AA and other compounds. The nutritional compounds of some individual cultivars differed from the average trend of the classification, using color as a criterion. Twenty-one differential proteins were detected in the purple-red and yellow-white cultivars. Among these proteins, there were 16 upregulated proteins and 5 downregulated proteins in purple-red cultivars. Most of these proteins act in the photosynthetic system. This indicated that tea plants with purple-red leaves performed better in photosynthesis than yellow-white tea plant cultivars. The chloroplast development of white-yellow tea plant cultivars was obstructed and may introduce AA accumulation.

1. Introduction

Tea plants (Camellia sinensis) are one of the most important cash crops in the world, and their young shoots are processed into tea, one of the most popular non-alcoholic aromatic beverages. In recent years, the consumption of tea has gained widespread attention in terms of both nutritional and therapeutic benefits, such as its protective role against cardiovascular [1] and oxidant activity [2]. Most of the normal tea plant cultivars have green shoots and leaves, but many special colored-leaf cultivars have been bred and developed. Some colored-leaf cultivars are white-yellow, such as ‘Zhonghuang 2’ [3], ‘Baiye 1’ [4] and ‘Huangjinya’ [5,6], whose young shoots exhibit yellowish or albino phenotypes in specific growth environments and have lower total catechin (CAT) and caffeine (CAF) contents, medium polyphenol (PP) content, and higher amino acid (AA) content [7,8,9] compared to the green-leaf tea plant cultivars, leading to a high-umami taste. Other colored-leaf cultivars are purple-red, such as ‘Zijuan’, ‘Ziyan’, ‘Sunrouge’ and TRFK K-Purple, in which young shoots exhibit a purple or red color and have high anthocyanidins [10,11,12,13] with contributing tolerance to photoinhibition [14,15]. Some nutritional compounds in purple-red tea are complex. Purple-red tea cultivars have significantly lower CAF [16], AA [17] and CAT contents [18] compared to green tea. Other results showed that purple-red tea plant cultivars had higher total PP and gallic acid (GA) contents [13] but lower (−)-epi-gallocatechin-3-gallate (EGCG) content [19] compared to green tea. A total of 66 major differential metabolites, including CAT and AA, have been identified in purple-red tea ‘Zijuan’ [20]. The analysis of differential nutritional compounds among tea plant cultivars with different leaf colors is relatively rare.
The regulation of leaf color is influenced by chlorophylls in chloroplasts. Chlorophylls in leaves not only influence photosynthesis but also participate in coloration. Chlorophyll content can be affected by chlorophyll biosynthesis, chlorophyll a/b interconversion and degradation [21]. Most chlorophylls are non-covalently bound to specific proteins to form chlorophyll–protein complexes in chloroplasts [22]. Chloroplasts are important sites for plant photosynthesis and chlorophyll storage, and the light-harvesting complex (LHC) and chlorophylls are important functional components of chloroplasts. The main components of LHC are chlorophyll A/B binding proteins (CABs) in plants. CABs participate in light uptake, transmit the energy to the reaction center of two photosystems (PS I and PS II) [23] and then take part in color biosynthesis [22]. There are 10 different gene families that encode CABs based on their nucleotide sequence homology. LHCa1, LHCa2, LHCa3 and LHCa4, are acted in PS I, and LHCb1, LHCb2, LHCb3, LHCb4, LHCb5 and LHCb6 are acted in PS II [24,25]. Their expression is affected by light intensity, low temperature, high salinity, drought, and disease [24].
The analysis of yellow and green regions of white-yellow tea showed that carbon metabolism, nitrogen metabolism, and AA biosynthesis were different based on color region and were closely related to chloroplast development and photosynthesis. Chlorophyll synthesis was hindered and the balance of carbon and nitrogen metabolism in the yellow region was disrupted with the accumulation of AA [26]. A previous study obtained a proteome map of purple-red tea cultivars related to color changes during leaf growth in the tea plant and identified 46 differentially expressed proteins in the proteomic profile between tender purple leaves and mature green leaves. These proteins were associated with CO2 assimilation, energy metabolism, photo flux efficiency and anthocyanin content [27]. There have been few relevant studies of differential proteins among tea plant cultivars with different leaf colors.
In this study, we analyzed tea with green, white-yellow and purple-red leaves from 26 cultivars, and 20 typical colored-leaf samples were selected for proteomic analysis. The purposes of this work were to identify differential nutritional compounds and differential abundance proteins in the leaves of white-yellow and purple-red tea cultivars. It is believed that the study of colored-leaf tea will positively facilitate tea breeding programs by accelerating the effective utilization of germplasm to develop the newly improved colored cultivars.

2. Materials and Methods

2.1. Plant Material

Twenty-six tea cultivars with different leaf colors were selected for this study. All cultivars grown in November of 2012 were cultivated in the fields of Daqinggu, Hangzhou, China (30°20′ N, 120°07′ E). The tea plants were fertilized and watered by the same standards, and only those that were healthy, without disease or insects, having shoots with one bud and two leaves were collected, in March 2021. All analyses were done with 30 single plants for each tea sample. After collection, the samples were promptly preserved in liquid nitrogen, freeze-dried and stored at −80 °C until use.

2.2. Determination of AA, PP, CAF and CAT

AA were determined according to Ye et al. [28]. The detection of PP was performed according to the standard protocol of GB/T 8313-2018, a national standard method, that was used to determine the PP content of tea infusions in China [29]. The CAT and CAF contents in tea samples were simultaneously determined by high-performance liquid chromatography (HPLC) (Agilent 1100, Palo Alto, CA, USA) according to a previous method [30]. All analyses were performed with three replications for each tea sample. The content of each nutritional compound in the tea powder was expressed as a percentage by mass on a dry weight basis (%).
All standards used, including (+)-catechin (C), (−)-epi-catechin (EC), (+)-gallocatechin (GC), (−)-epi-gallocatechin (EGC), (−)-catechin-3-gallate (CG), (−)-epi-catechin-3-gallate (ECG), (−)-gallocatechin-3-gallate (GCG) and (−)-epi-gallocatechin-3-gallate (EGCG), were purchased from Sigma Chemicals (St. Louis, MO, USA).

2.3. Protein Extraction, Digestion and Identification

The leaves from 20 cultivars, divided into two classes as purple-red (including four cultivars mixed with equal weight) and white-yellow (including 16 cultivars mixed with equal weight), were chosen for quantitative proteomic analysis. Protein was extracted from young leaves using the TCA/acetone precipitation method [31] and digested with trypsin, as described by Liu et al. [32]. The peptides were first separated by HPLC using an Agilent 300 Extend C18 column (5-μm particles, 4.6 mm i.d., 250 mm in length) over 60 min. The combined peptides were dried through vacuum centrifugation and redissolved in 0.1% formic acid for MS analysis. LC-MS/MS (Thermo Fisher Scientific, San Jose, CA, USA) analysis was performed as described by Liu et al. [33].

2.4. Proteomics Database Search and Differential Protein Identification

The data analysis method was performed as described by Liu et al. [32], with some modifications. Briefly, the raw files were analyzed by MaxQuant software (version 1.6.0.1, Max-Planck Institute for Biochemistry, Martinsried, Germany), and peak lists were searched against the Uniprot FASTA database (Version 2020). Label-free quantification was performed using the MaxLFQ algorithm integrated into MaxQuant. The MaxQuant software settings were as follows: (i) 2 for missed cleavages; (ii) 7 amino-acid residues for minimum peptide length and 5 for maximum modification sites in a peptide; (iii) cysteine alkylation fixed modification and oxidation of methionine and N-terminalacetylation of protein as variable modifications; (iv) mass tolerance of 10 ppm for peptide ions and 25 mmu for fragment ions; and (v) FDR ≤ 1% for protein identification and the peptide-spectrum matches. The “proteinGroups.txt” file produced by MaxQuant was further analyzed in Perseus (version 2.0.3.0, Max-Planck Institute for Biochemistry, Martinsried, Germany). Positions containing non-valid values were filtered out to obtain a protein dataset present in all samples. Mean and standard deviations were calculated from the remaining data and groups according to how the study subjects were annotated. The data were log2-transformed and normalized. Unsupervised hierarchical clustering of significantly regulated proteins (ANOVA, FDR < 0.05) (z-scored MaxLFQ values) was performed in Perseus.
Functional annotation of proteins was conducted using Gene Ontology annotation. The differentially accumulated proteins were assigned to the Cluster of Orthologous Groups of Proteins database and the Kyoto Encyclopedia of Genes and Genomes database [27].

2.5. Statistical Analysis

Data for AA, PP, CAT and CAF were analyzed using SPSS software (version 25.0, IBM SPSS Statistics, Chicago, IL, USA). After testing for a normal distribution, a multiple test was applied. Results were considered significant when p < 0.05. The graphs were drawn using Sigma Plot (version 9.0, SYSTAT Inc., San Jose, CA, USA), Cytoscape (version 3.9.1, University of California, San Diego, CA, USA) [34], and R.

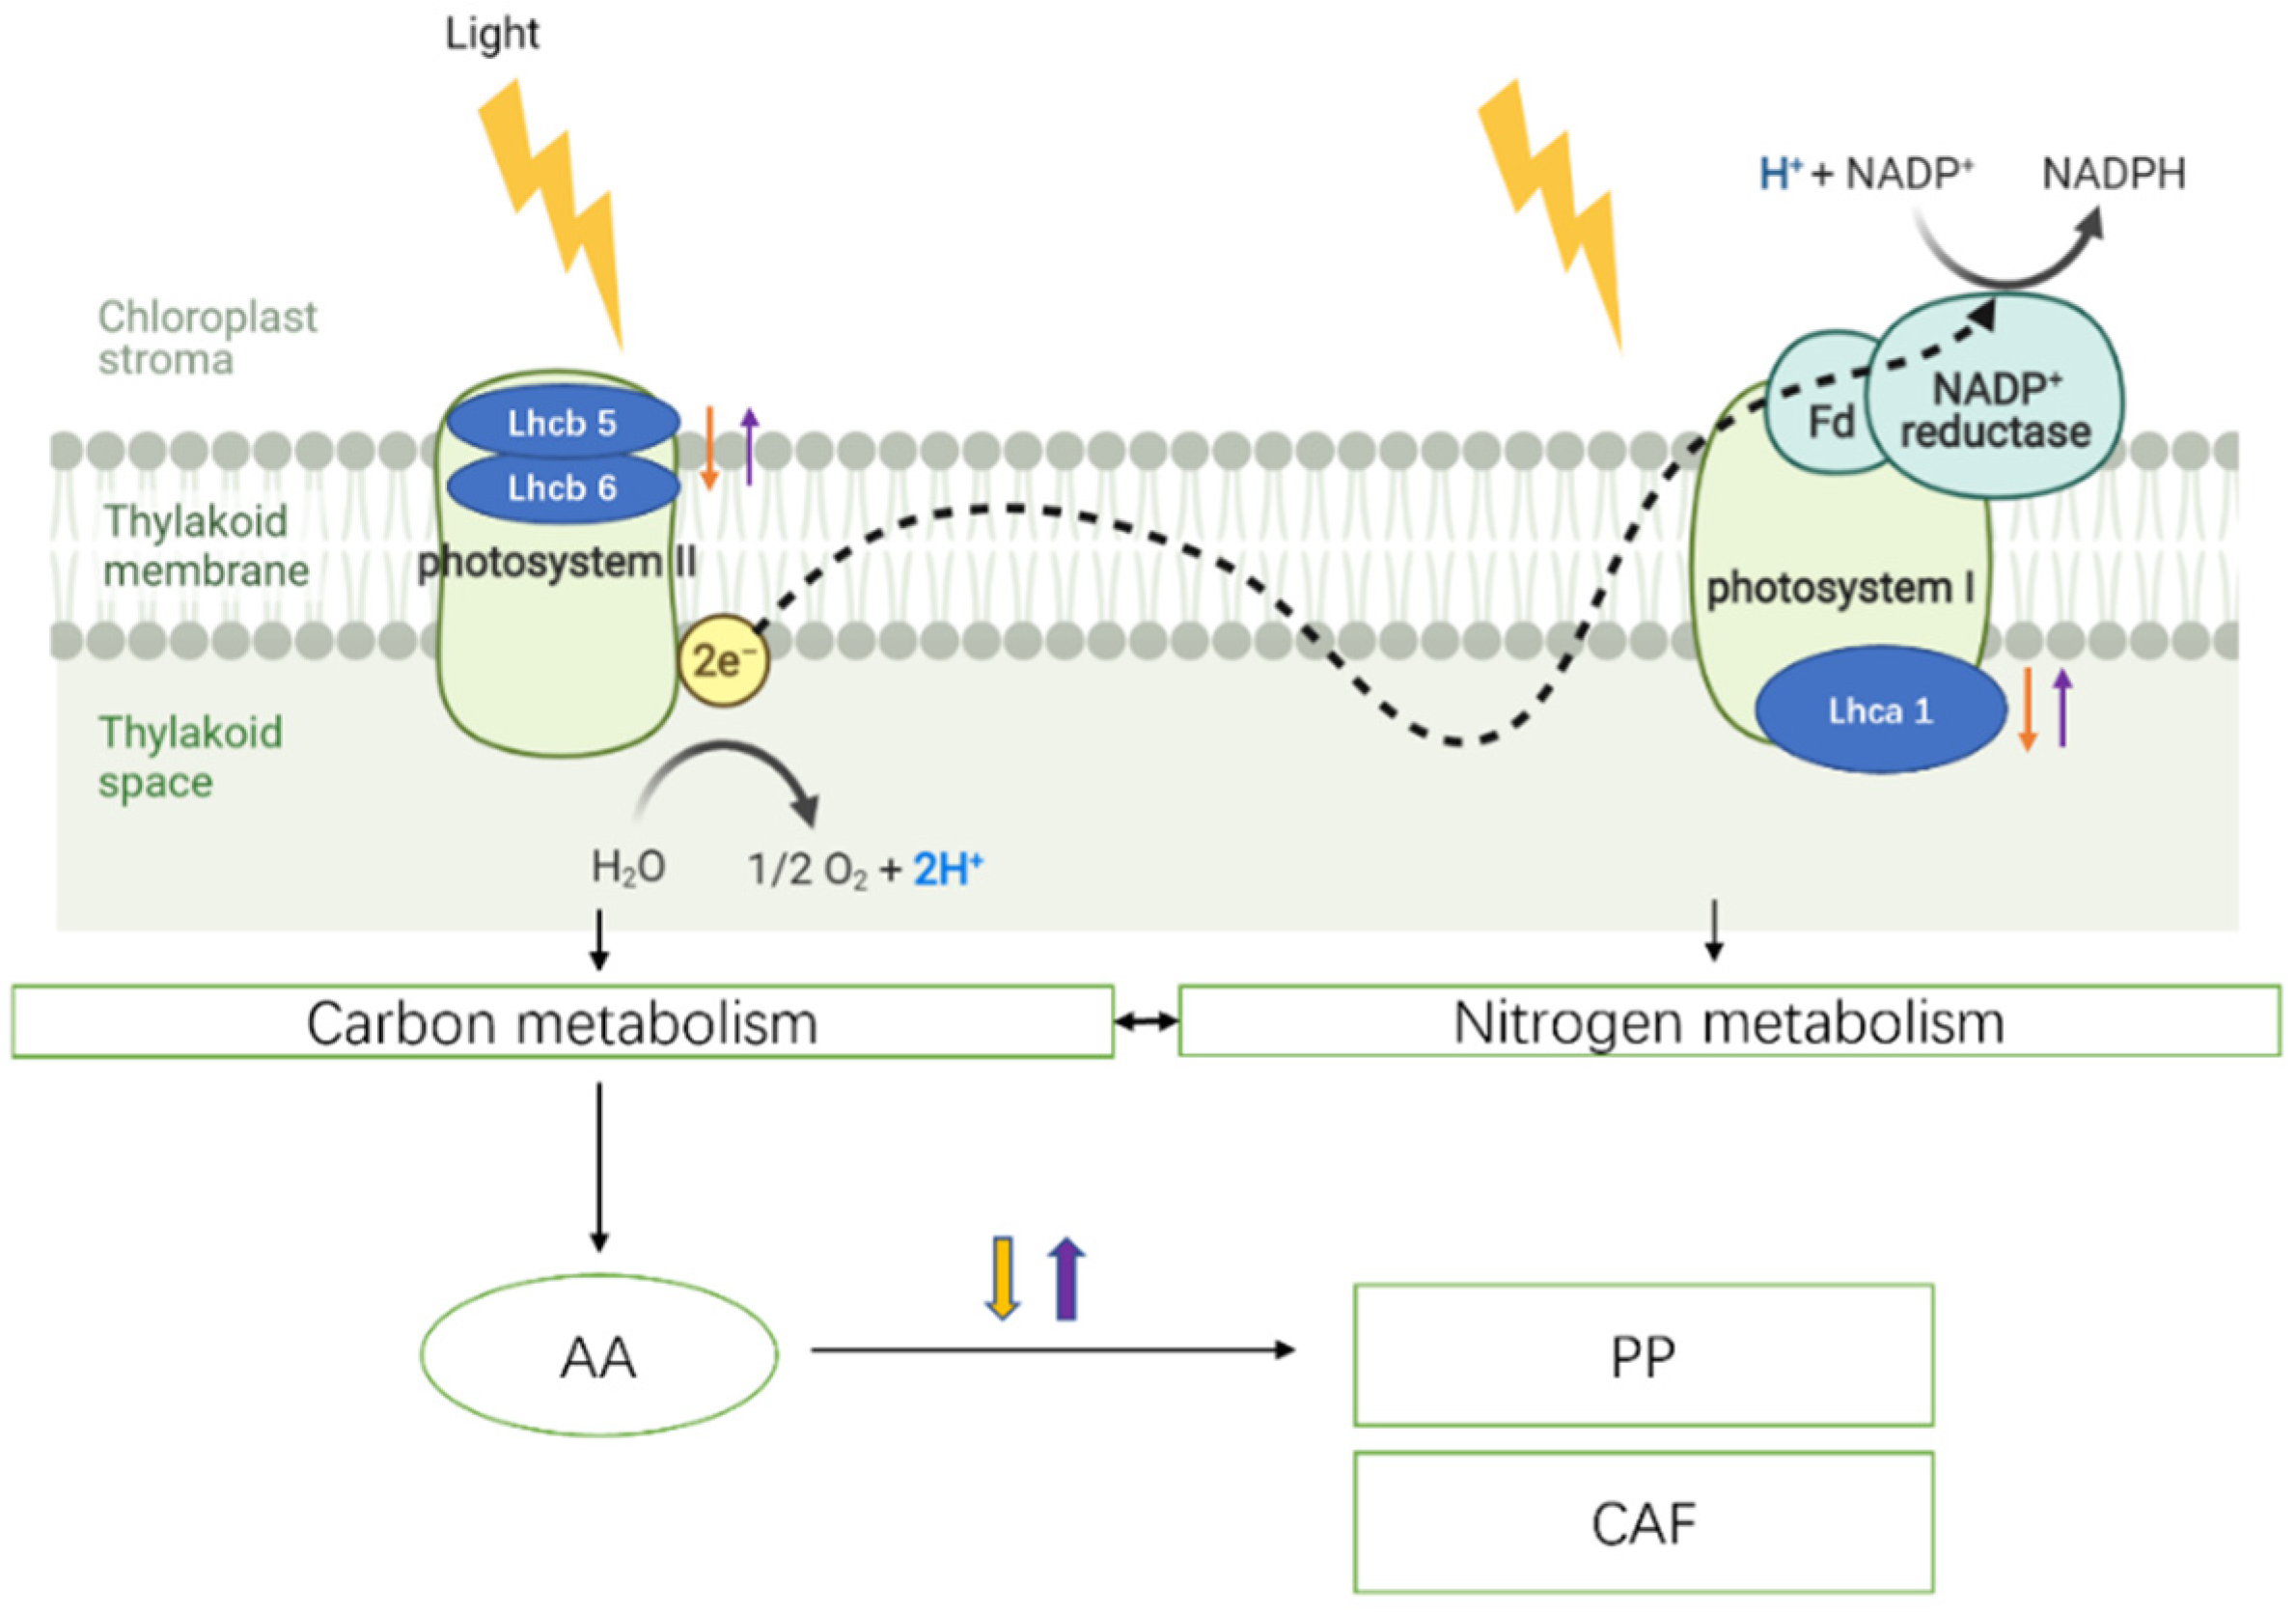
3. Results and Discussion

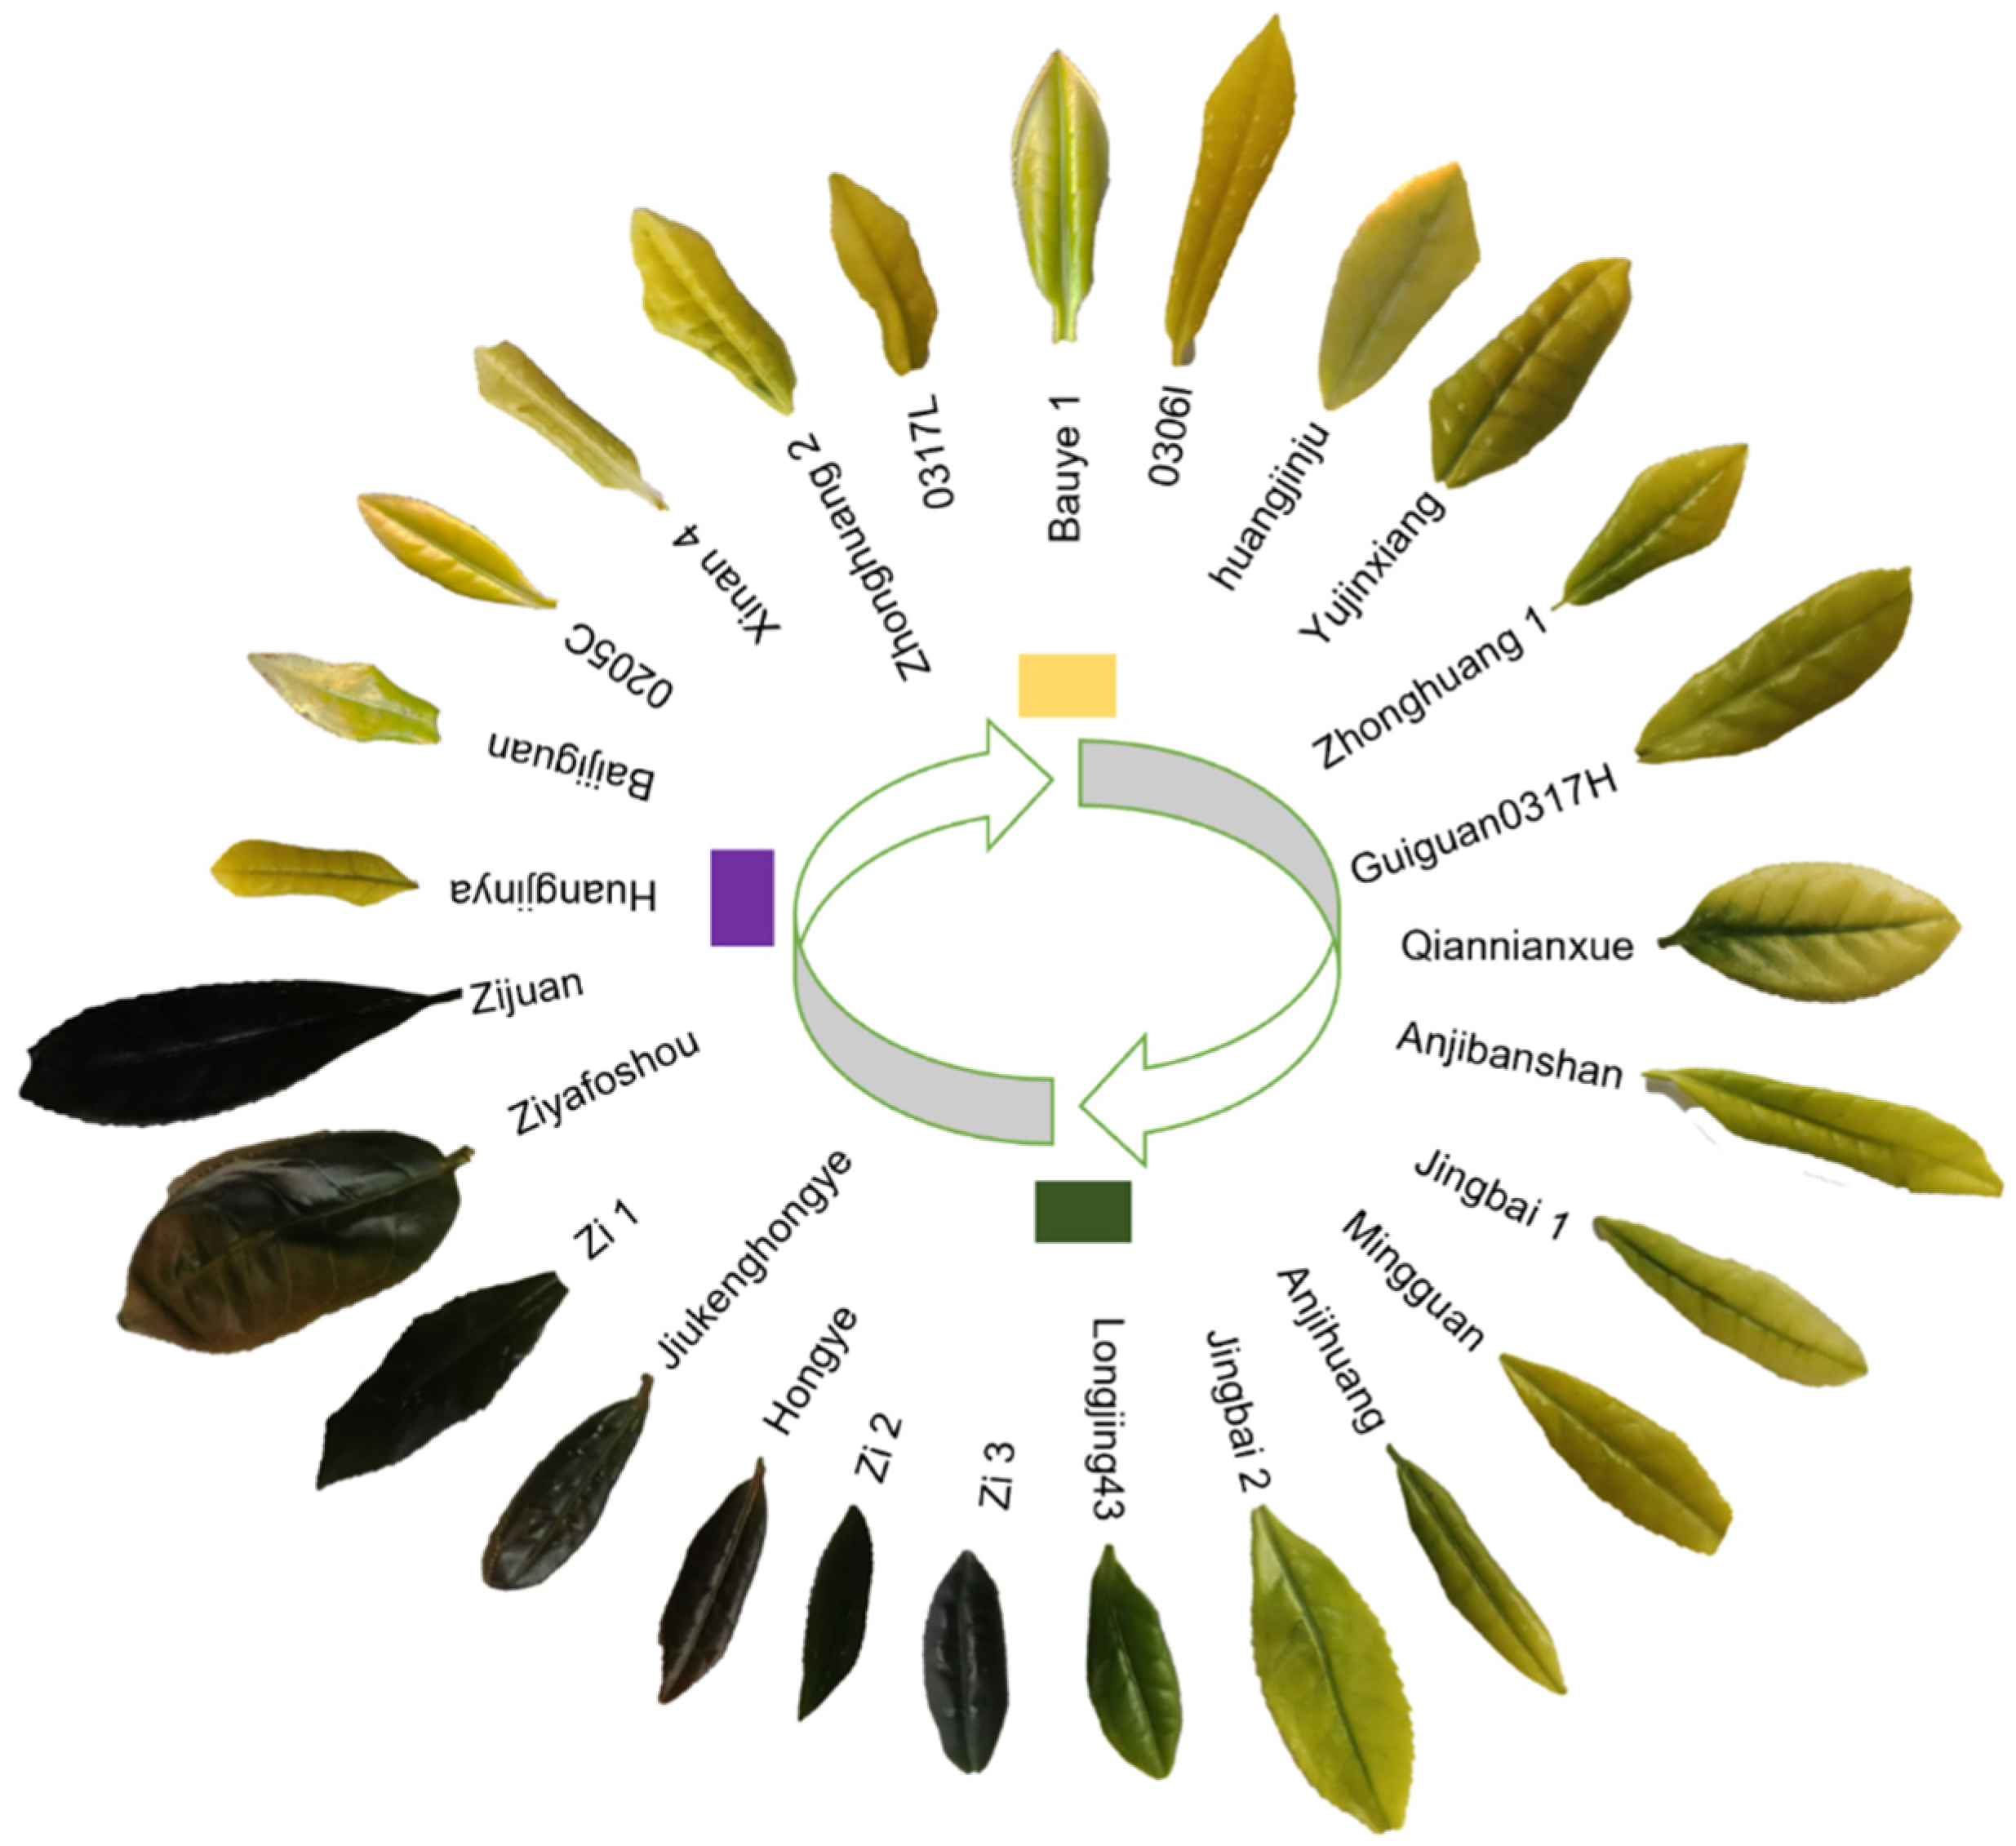
3.1. Color of Leaves in 26 Tea Cultivars

The color of new leaves was observed in 26 tea cultivars when they had one bud and two leaves. Among them, seven cultivars showed a distinct purple-red color, and 20 cultivars appeared white-yellow (Figure 1). The regular green tea cultivar ‘Longjing 43’, which served as a control, remained green over the same period.
Some previous studies have shown that there are factors that affect the whitening of white-yellow tea: light and temperature [35,36]. Compared with white-yellow tea cultivars, there is relatively little research on the environmental impact of purple-red tea. Some purple-red tea cultivars showed obvious purple-red characteristics in the first bud and second leaf of young leaves and then reverted to green, such as ‘Zi 1’, ‘Zi 2’ and ‘Zi 3’. Because this change may cause differences in nutritional compounds and protein expression in leaves, the materials used in this experiment were taken from the one-bud, two-leaf stage with colored leaves.

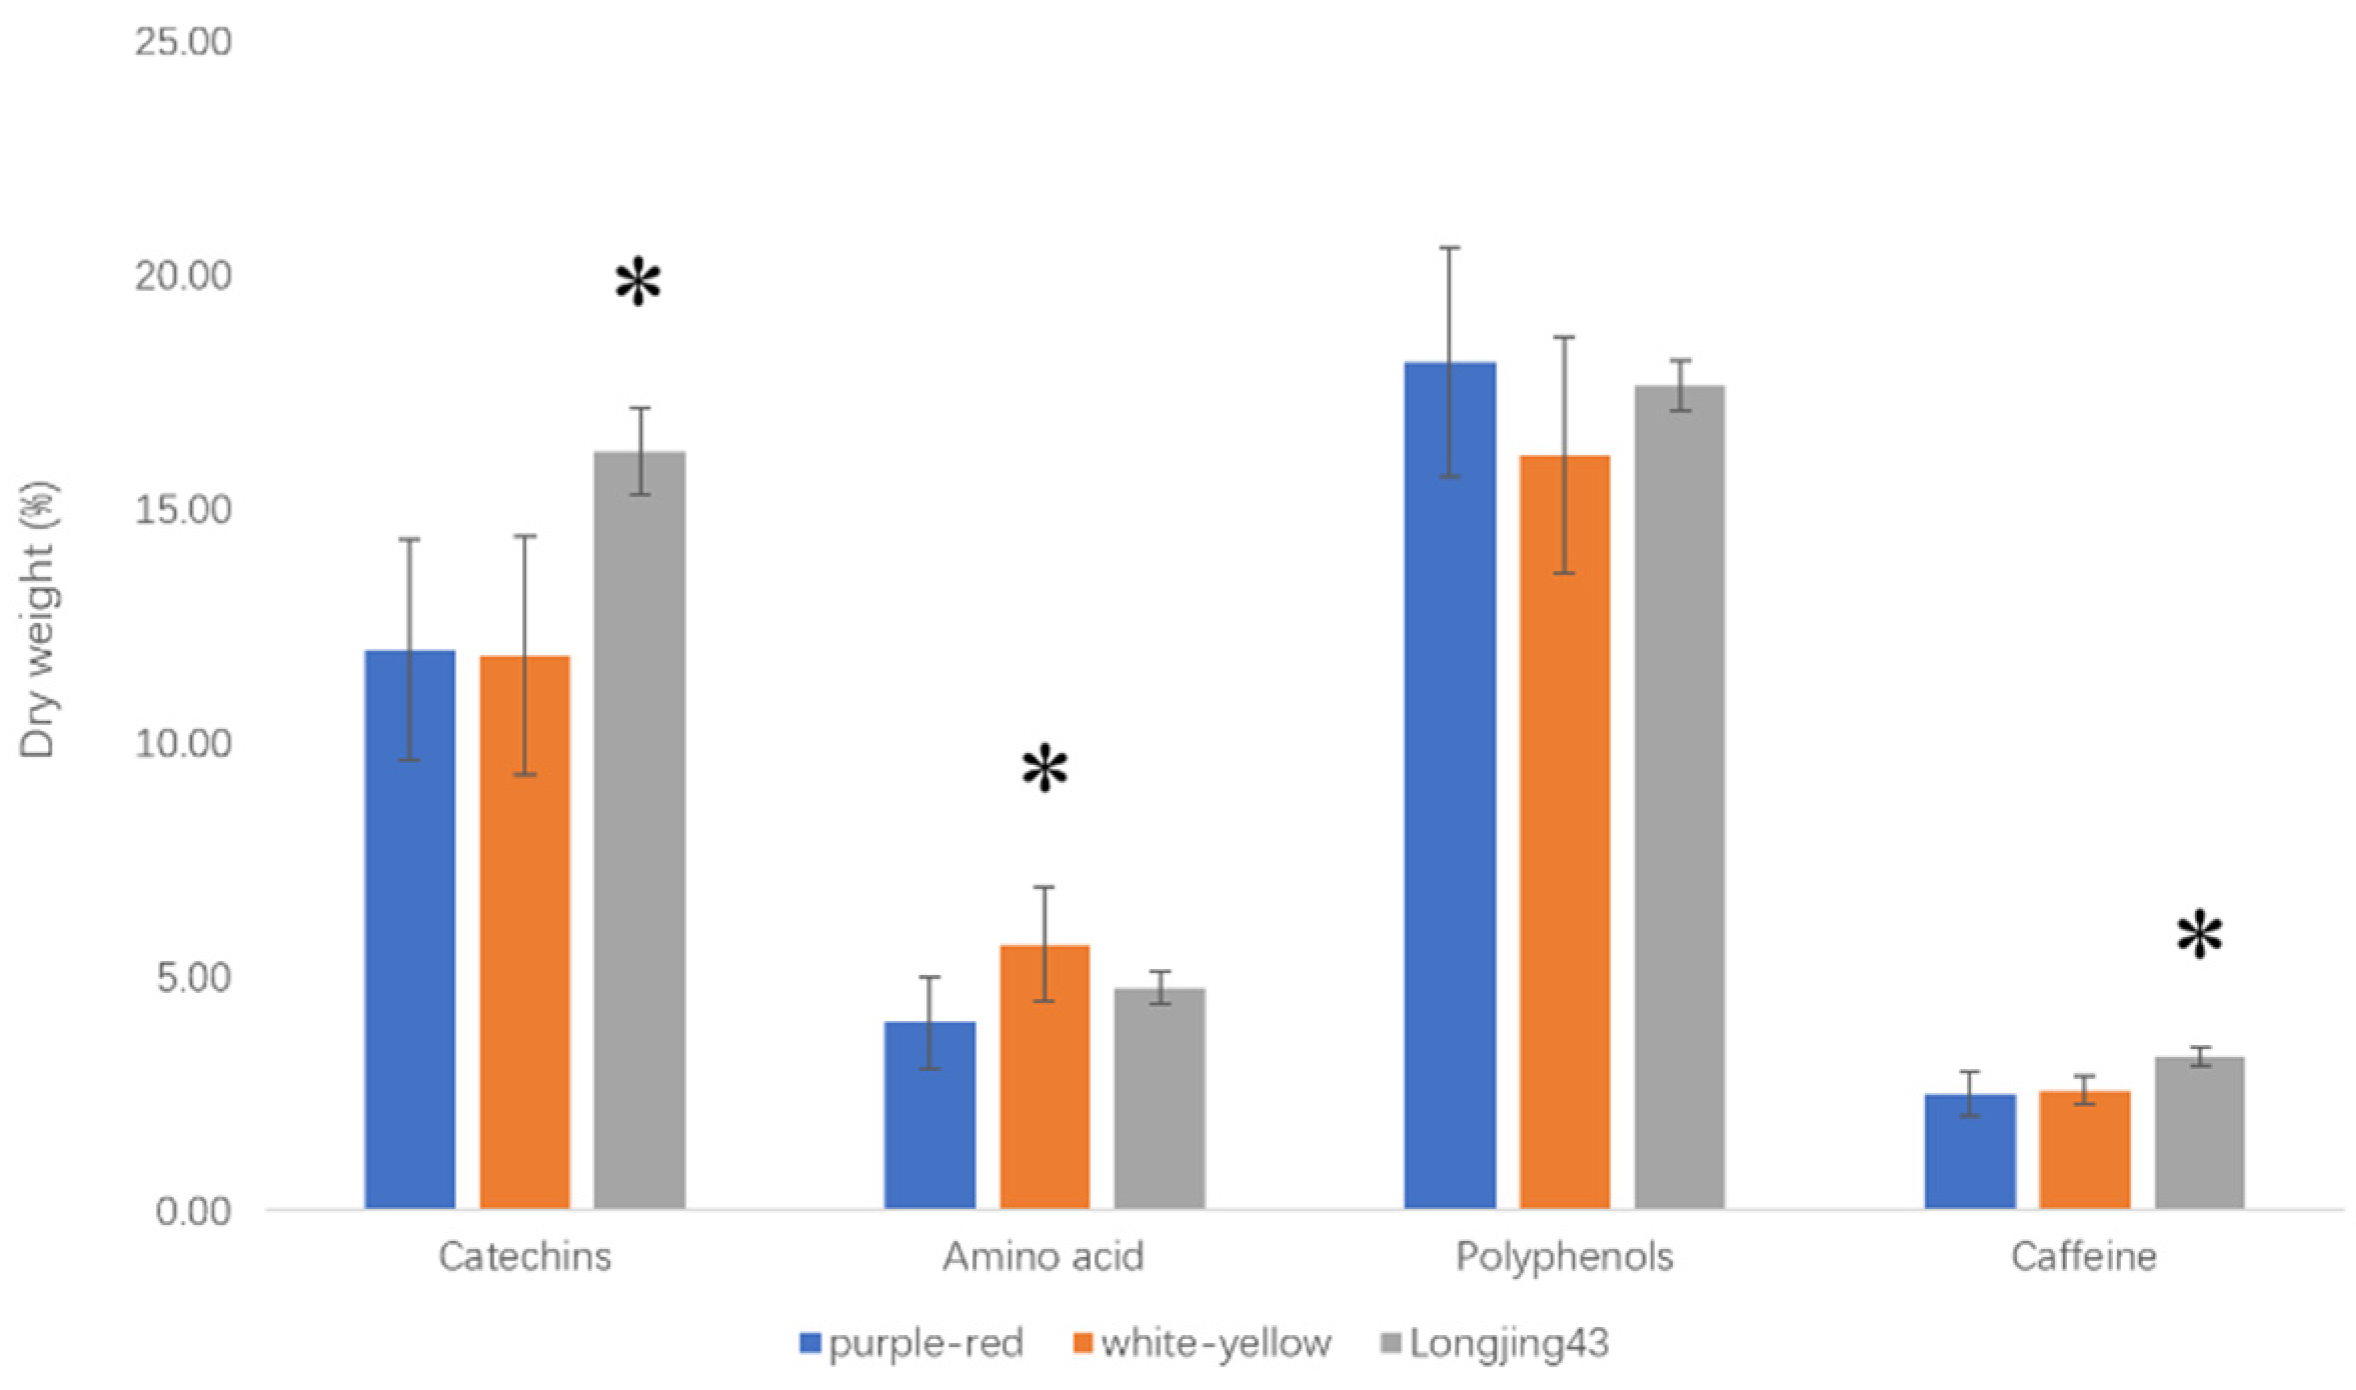
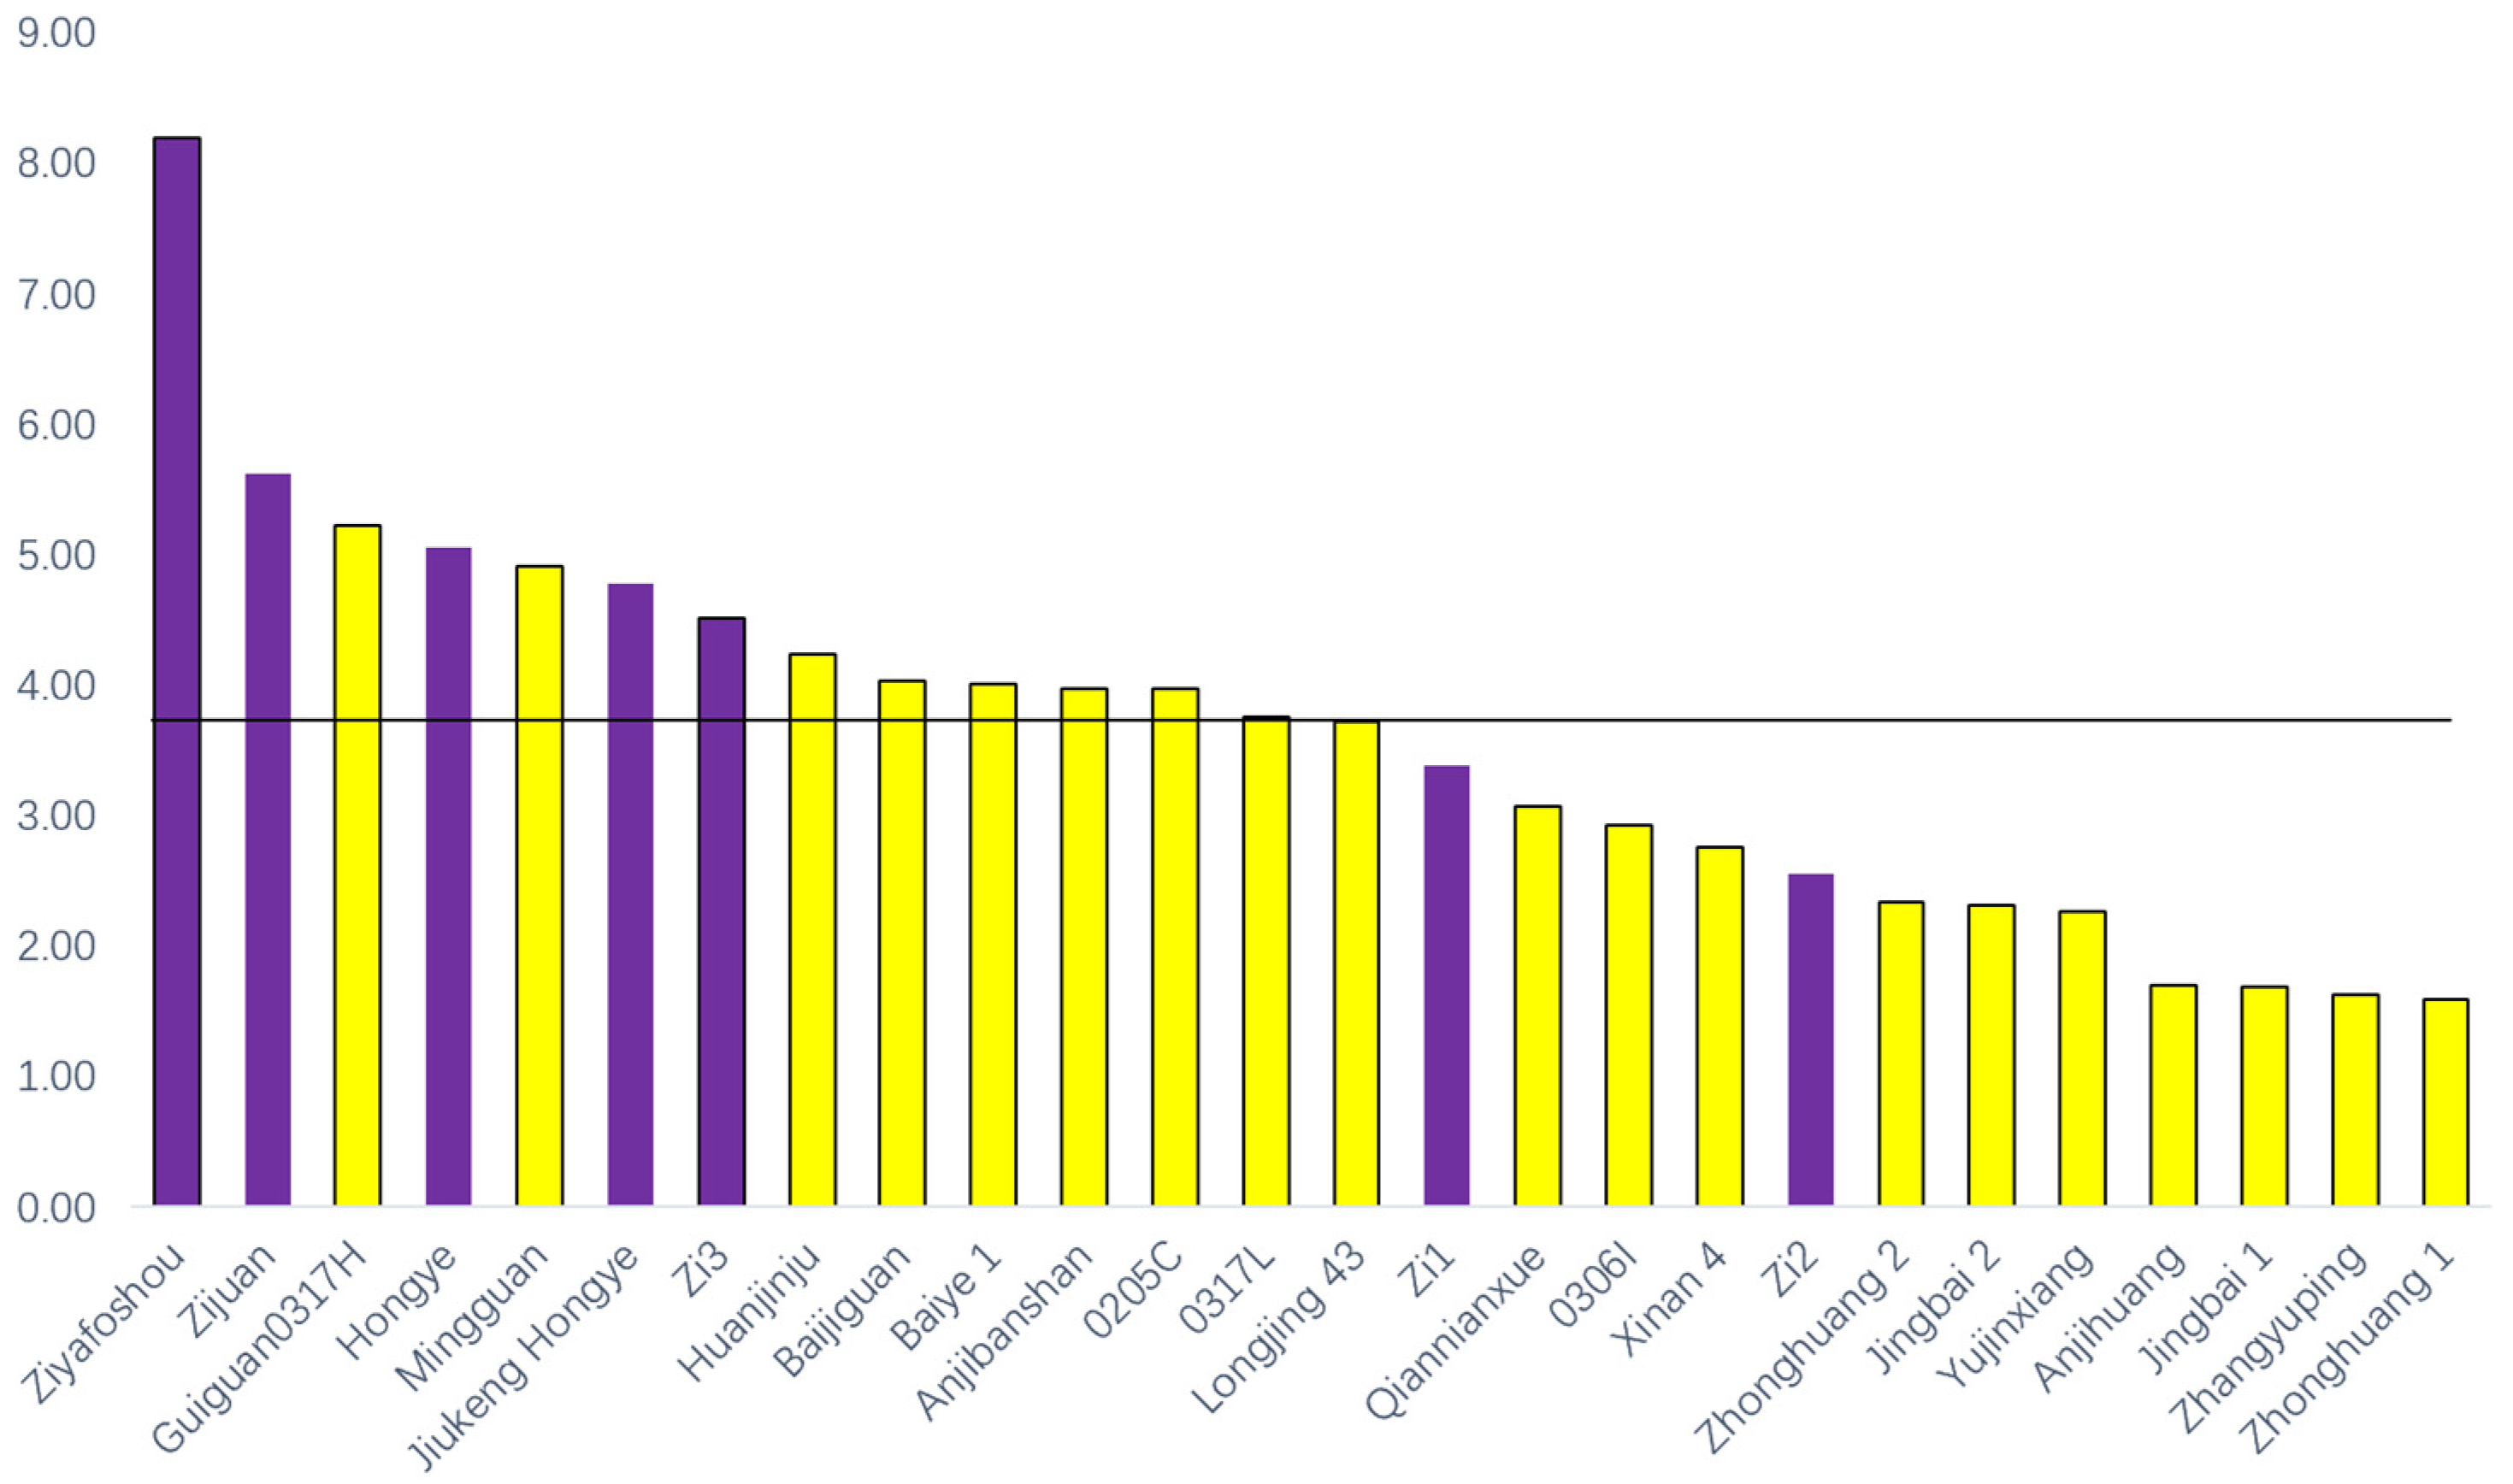
3.2. AA, PP, CAT and CAF Contents

Three nutritional compounds closely related to tea quality, CAF, PP and AA, were analyzed in 26 cultivars. White-yellow leaves had a significantly higher AA content than others, while green (Longjing 43) leaves showed significantly higher CAT and CAF contents (Figure 2).
Among the PP, the CAT were the main components and could be divided into simple catechins (SCAT, GC+EGC+C+EC) and ester-type catechins (ETCAT, EGCG+GCG+ECG+CG). The EGCG, GCG, ECG and CG contents of the green-leaf cultivar were significantly higher than those of the colored-leaf cultivars (p < 0.01, Table 1), indicating that all constituent contents of ETCAT showed the same trend as lower in colored-leaf cultivars and determining the quality of tea beverages. The C content in white-yellow cultivars was lower than in green cultivars (p < 0.01, Table 1), and the EC content of green cultivars was higher than in white-yellow cultivars (p < 0.05, Table 1).
The phenol-to-ammonia ratio (PP/AA) was another important factor that determined the taste and processing suitability of tea. White-yellow cultivars showed significantly low PP/AA (3.13 ± 1.17), and the fresh taste was consistent with the findings of previous studies [37,38], while purple-red cultivars showed high PP/AA (4.88 ± 1.80). Although the difference in PP/AA ratio among purple-red and yellow-white cultivars was significant when analyzing the mean value, such differences were no longer significant among some specific cultivars. Compared with white-yellow cultivars, some purple-red cultivars showed special PP/AA values. For example, ‘Zijuan’ and ‘Ziyafoshou’ had significantly high PP/AA, while ‘Zi 1’ and ‘Zi 2’ showed low PP/AA, which was similar to most white-yellow cultivars (Figure 3). Compared with purple-red cultivars, some white-yellow cultivars also showed special PP/AA values. For example, ‘Guiguan0317H’ and ‘Mingguan’ had significantly high PP/AA values.

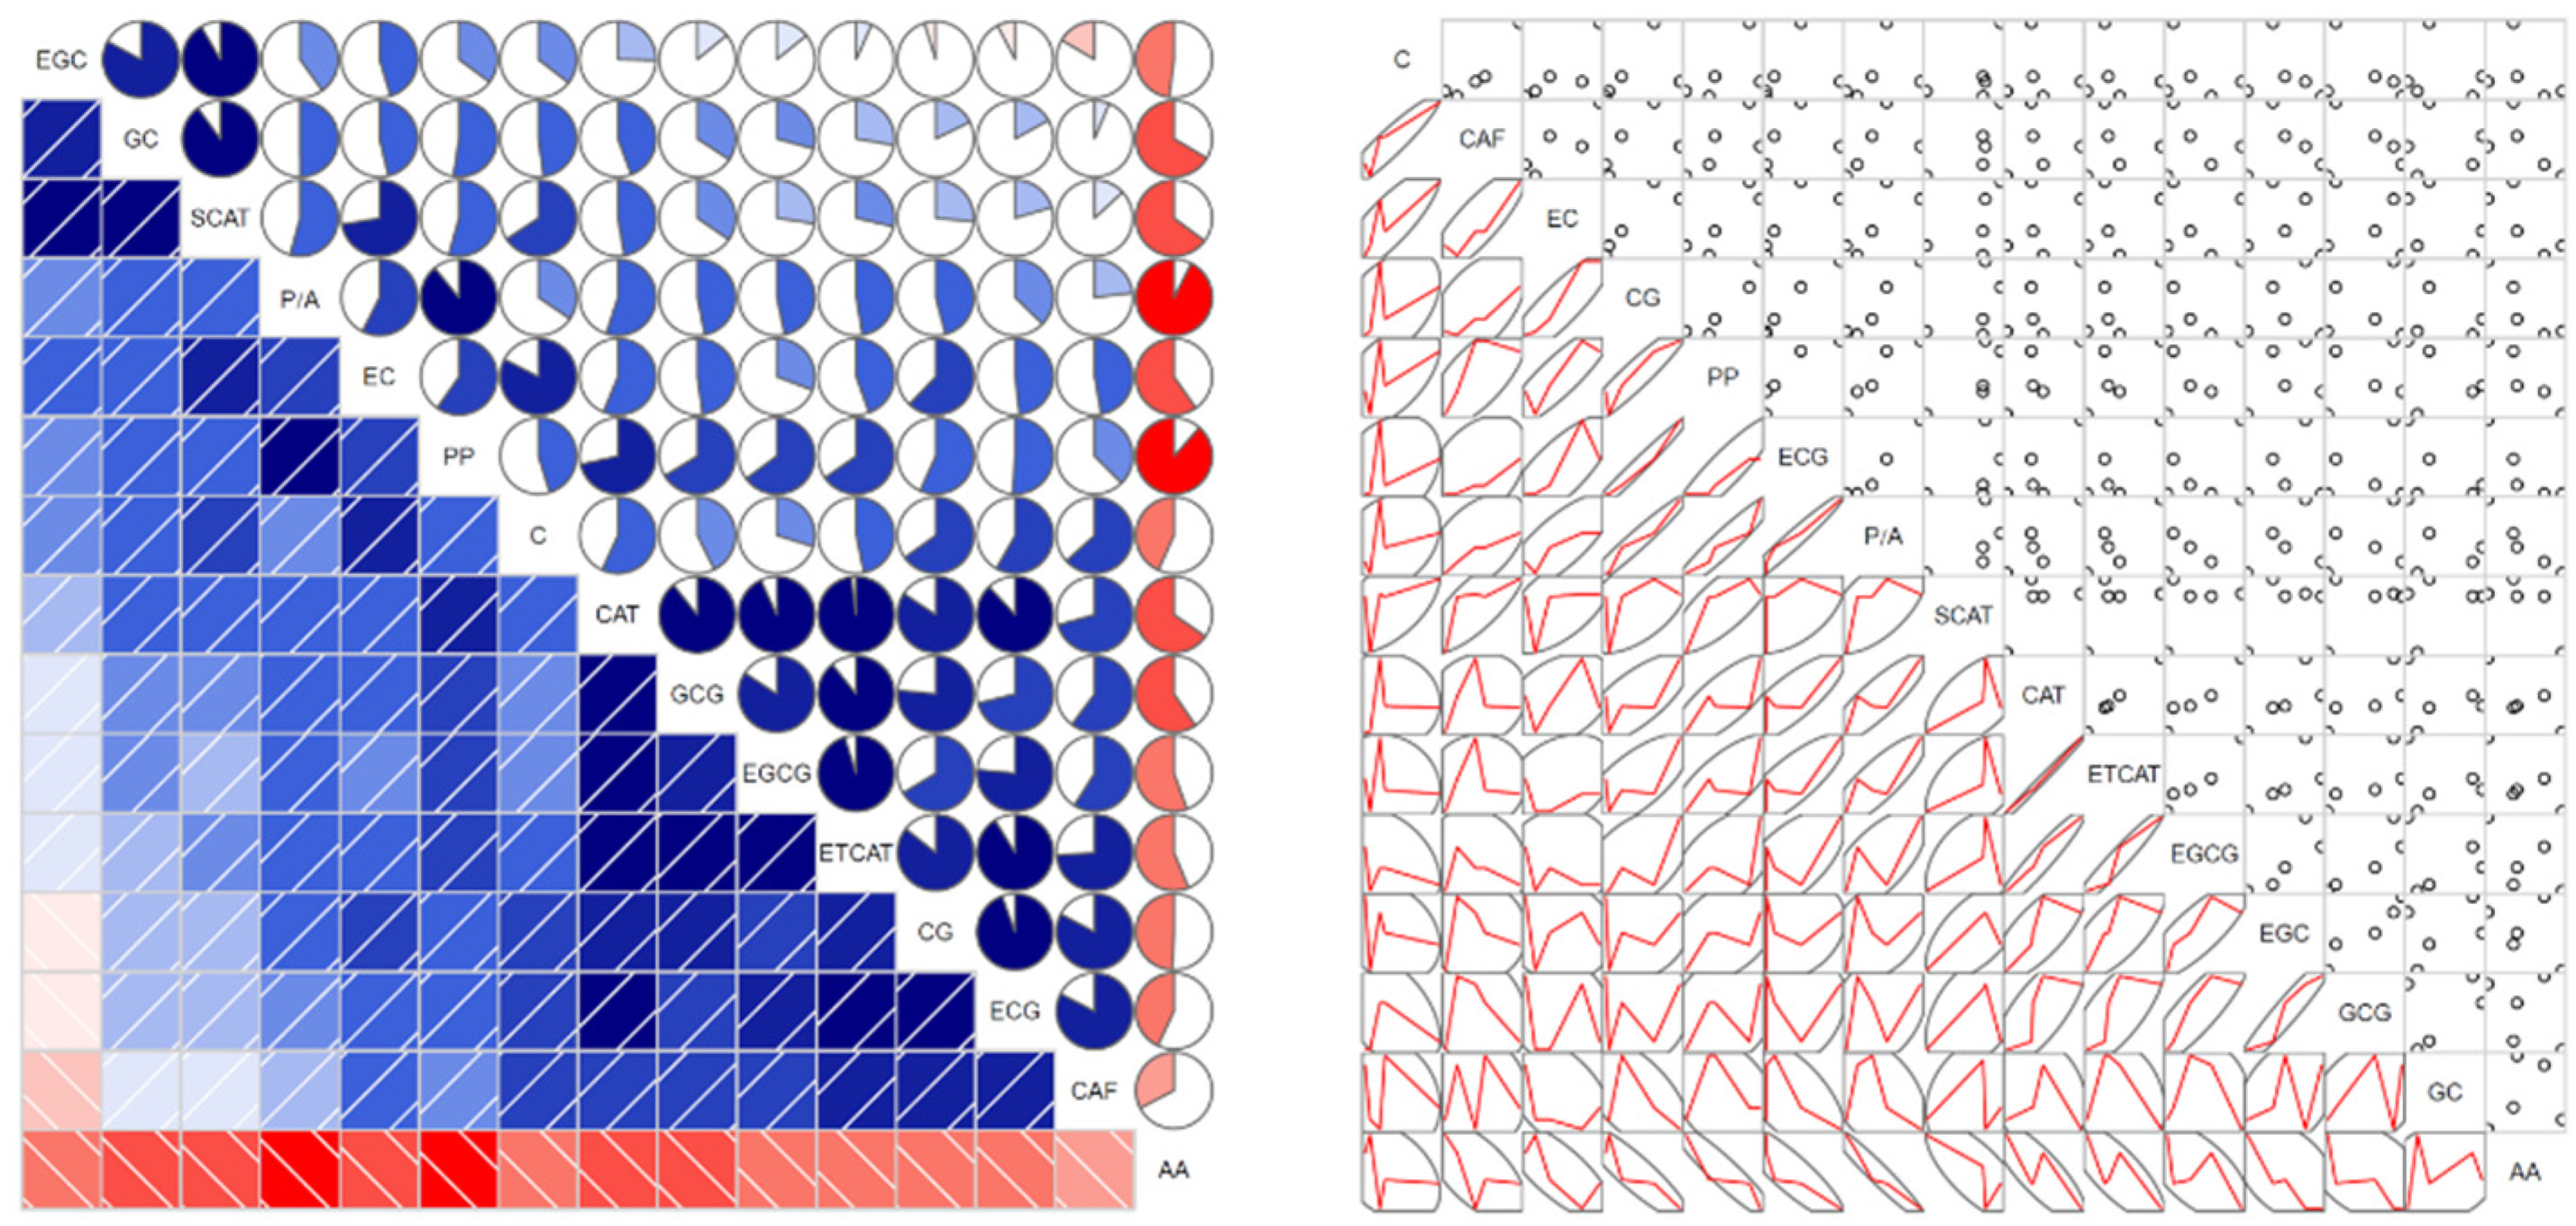
3.3. Correlation among AA, PP, CAT and CAF

The comprehensive analysis of all nutritional compounds found that most showed significant positive correlations, except AA. CAT, PP and ETCAT showed significant positive correlations with all other compounds, except AA. There were significant negative correlations between the AA content and other compounds. The AA, CAF and PP contents were correlated with each other. The same trend was also present in purple-red tea cultivars; therefore, considering compound correlation when selecting cultivars with excellent substance proportions was important (Figure 4).
These results can be explained by the metabolic relationship. The synthesis of AA is the core element of nitrogen metabolism and carbon metabolism. One of the most important AAs in tea is theanine, which is synthesized by glutamic acid and ethylamine under the catalytic action of theanine synthase. Among them, ethylamine also is used to synthesize PP (ethylamine→acetaldehyde→vinyl alcohol→phloroglucinol→PP). Therefore, the accumulation of AA represented by theanine may affect the accumulation of precursor substances of PP. This idea was confirmed in a previous study [26].
Because the genetic backgrounds of the tea plant cultivars were complex, the nutritional compounds of the individuals varied greatly among the different cultivars. For example, some previous results showed that there was no significant difference in the PP content of purple-red tea compared with green tea [18]. Other results showed that a kind of purple-red tea had a higher total PP content compared with green tea [13,19]. When performing a principal component analysis of 26 cultivars, each purple-red and white-yellow cultivar was evenly distributed, with no obvious aggregation points. This was consistent with the conclusion that the average values of purple-red and white-yellow cultivars were significantly different, and individual analysis might have different results from the overall analysis.
We performed a comprehensive evaluation of purple-red and white-yellow cultivars using ‘Longjing 43’ as control. White-yellow cultivars had significantly higher AA content and lower PP/AA than other color cultivars, and ‘Zi 1’ and ‘Zi 2’ had better nutritional compositions than other purple-red cultivars. Of the two, ‘Zi 2’ had a lower PP/AA ratio, which was related to better taste, and ‘Zi 1’ had significantly higher levels of PP, CAT and CAF, which were found to be beneficial to health.

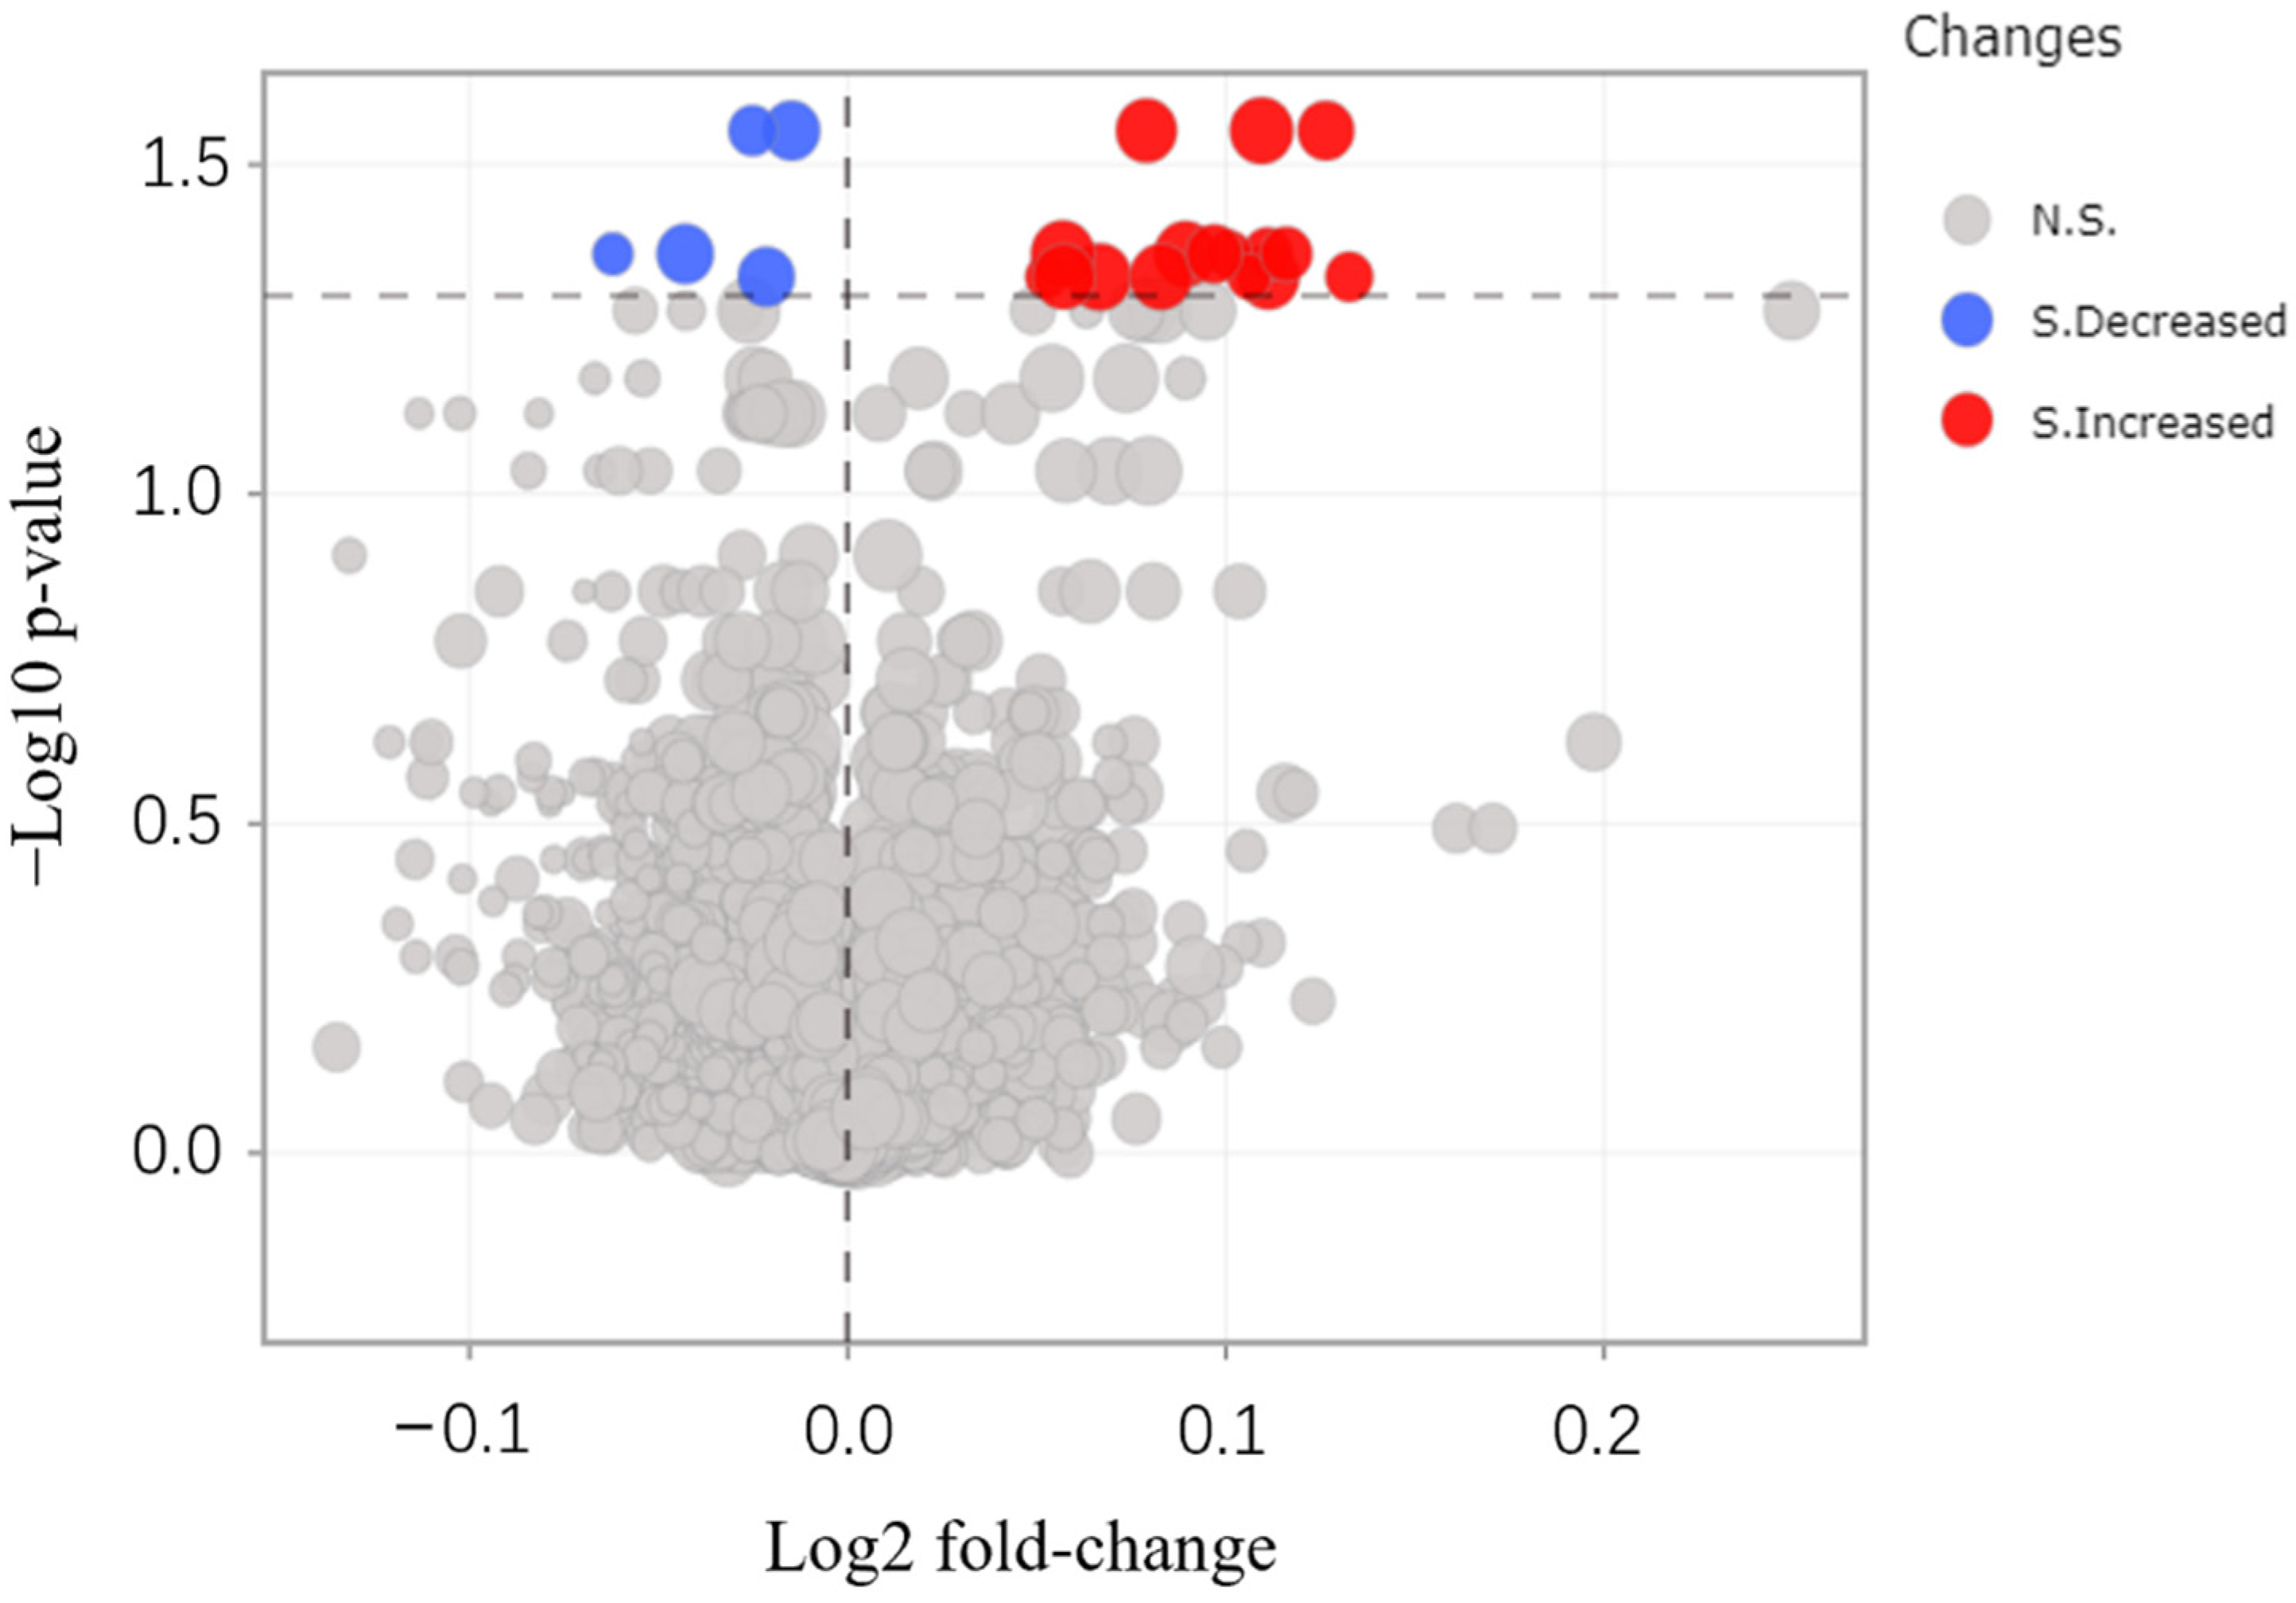
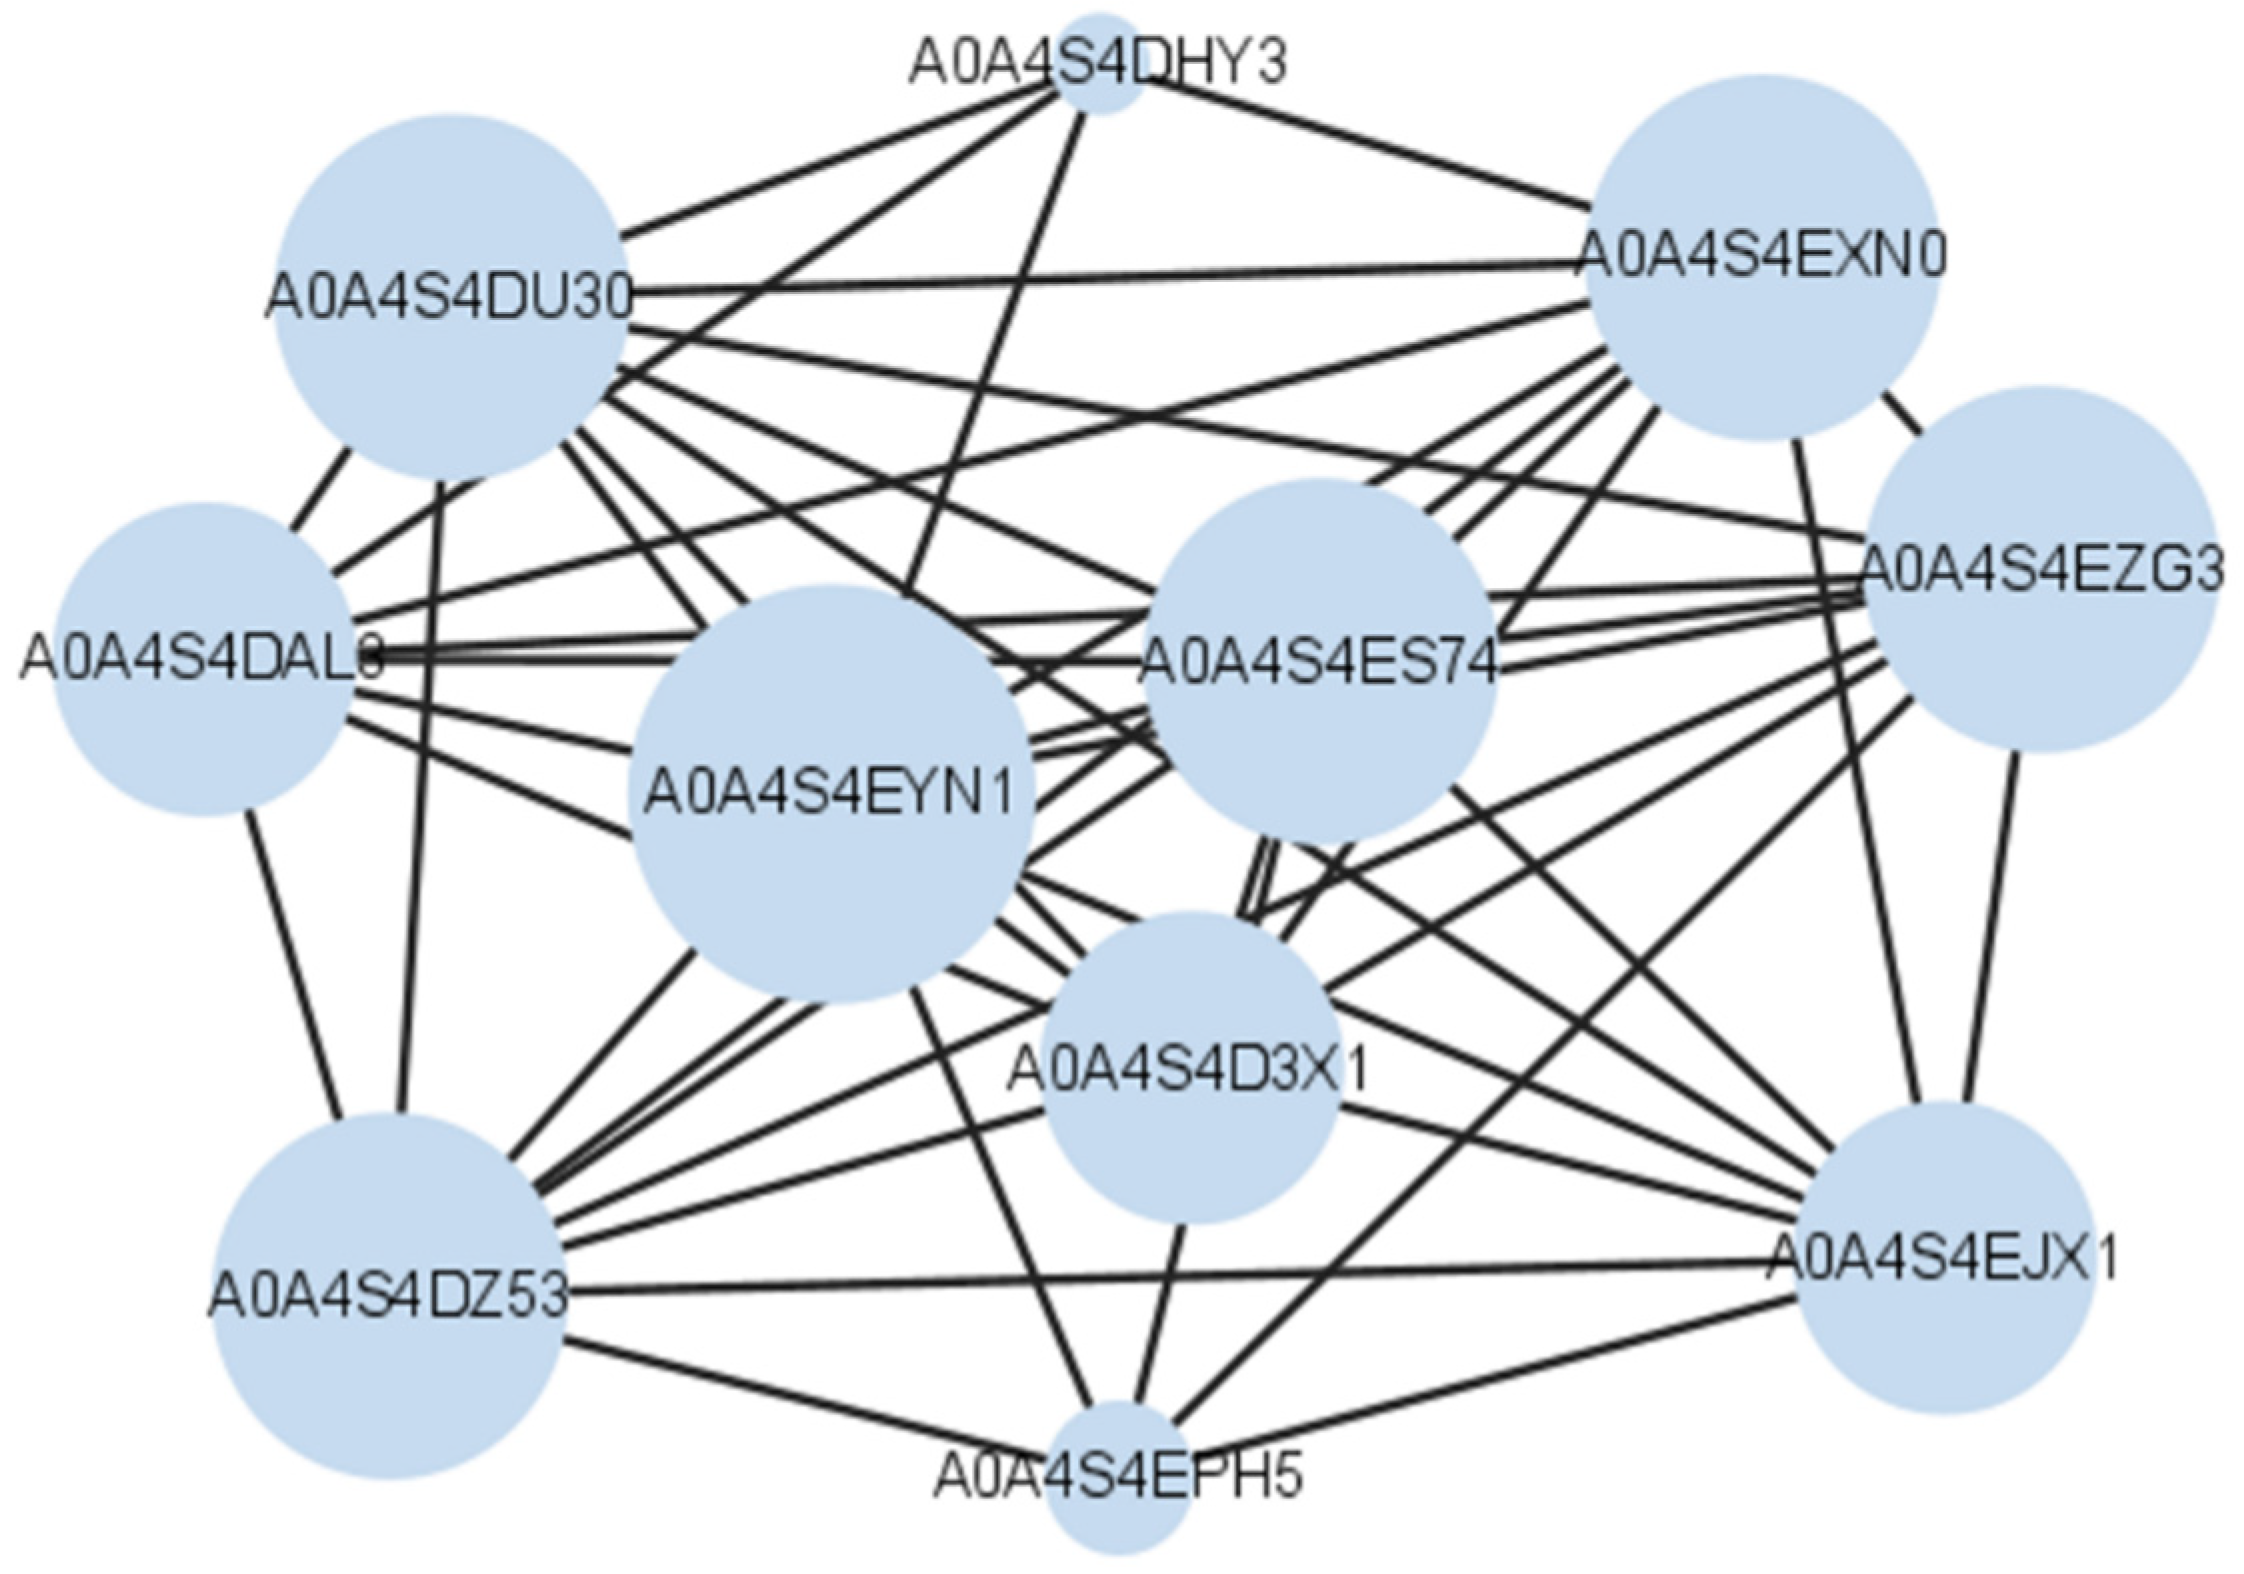
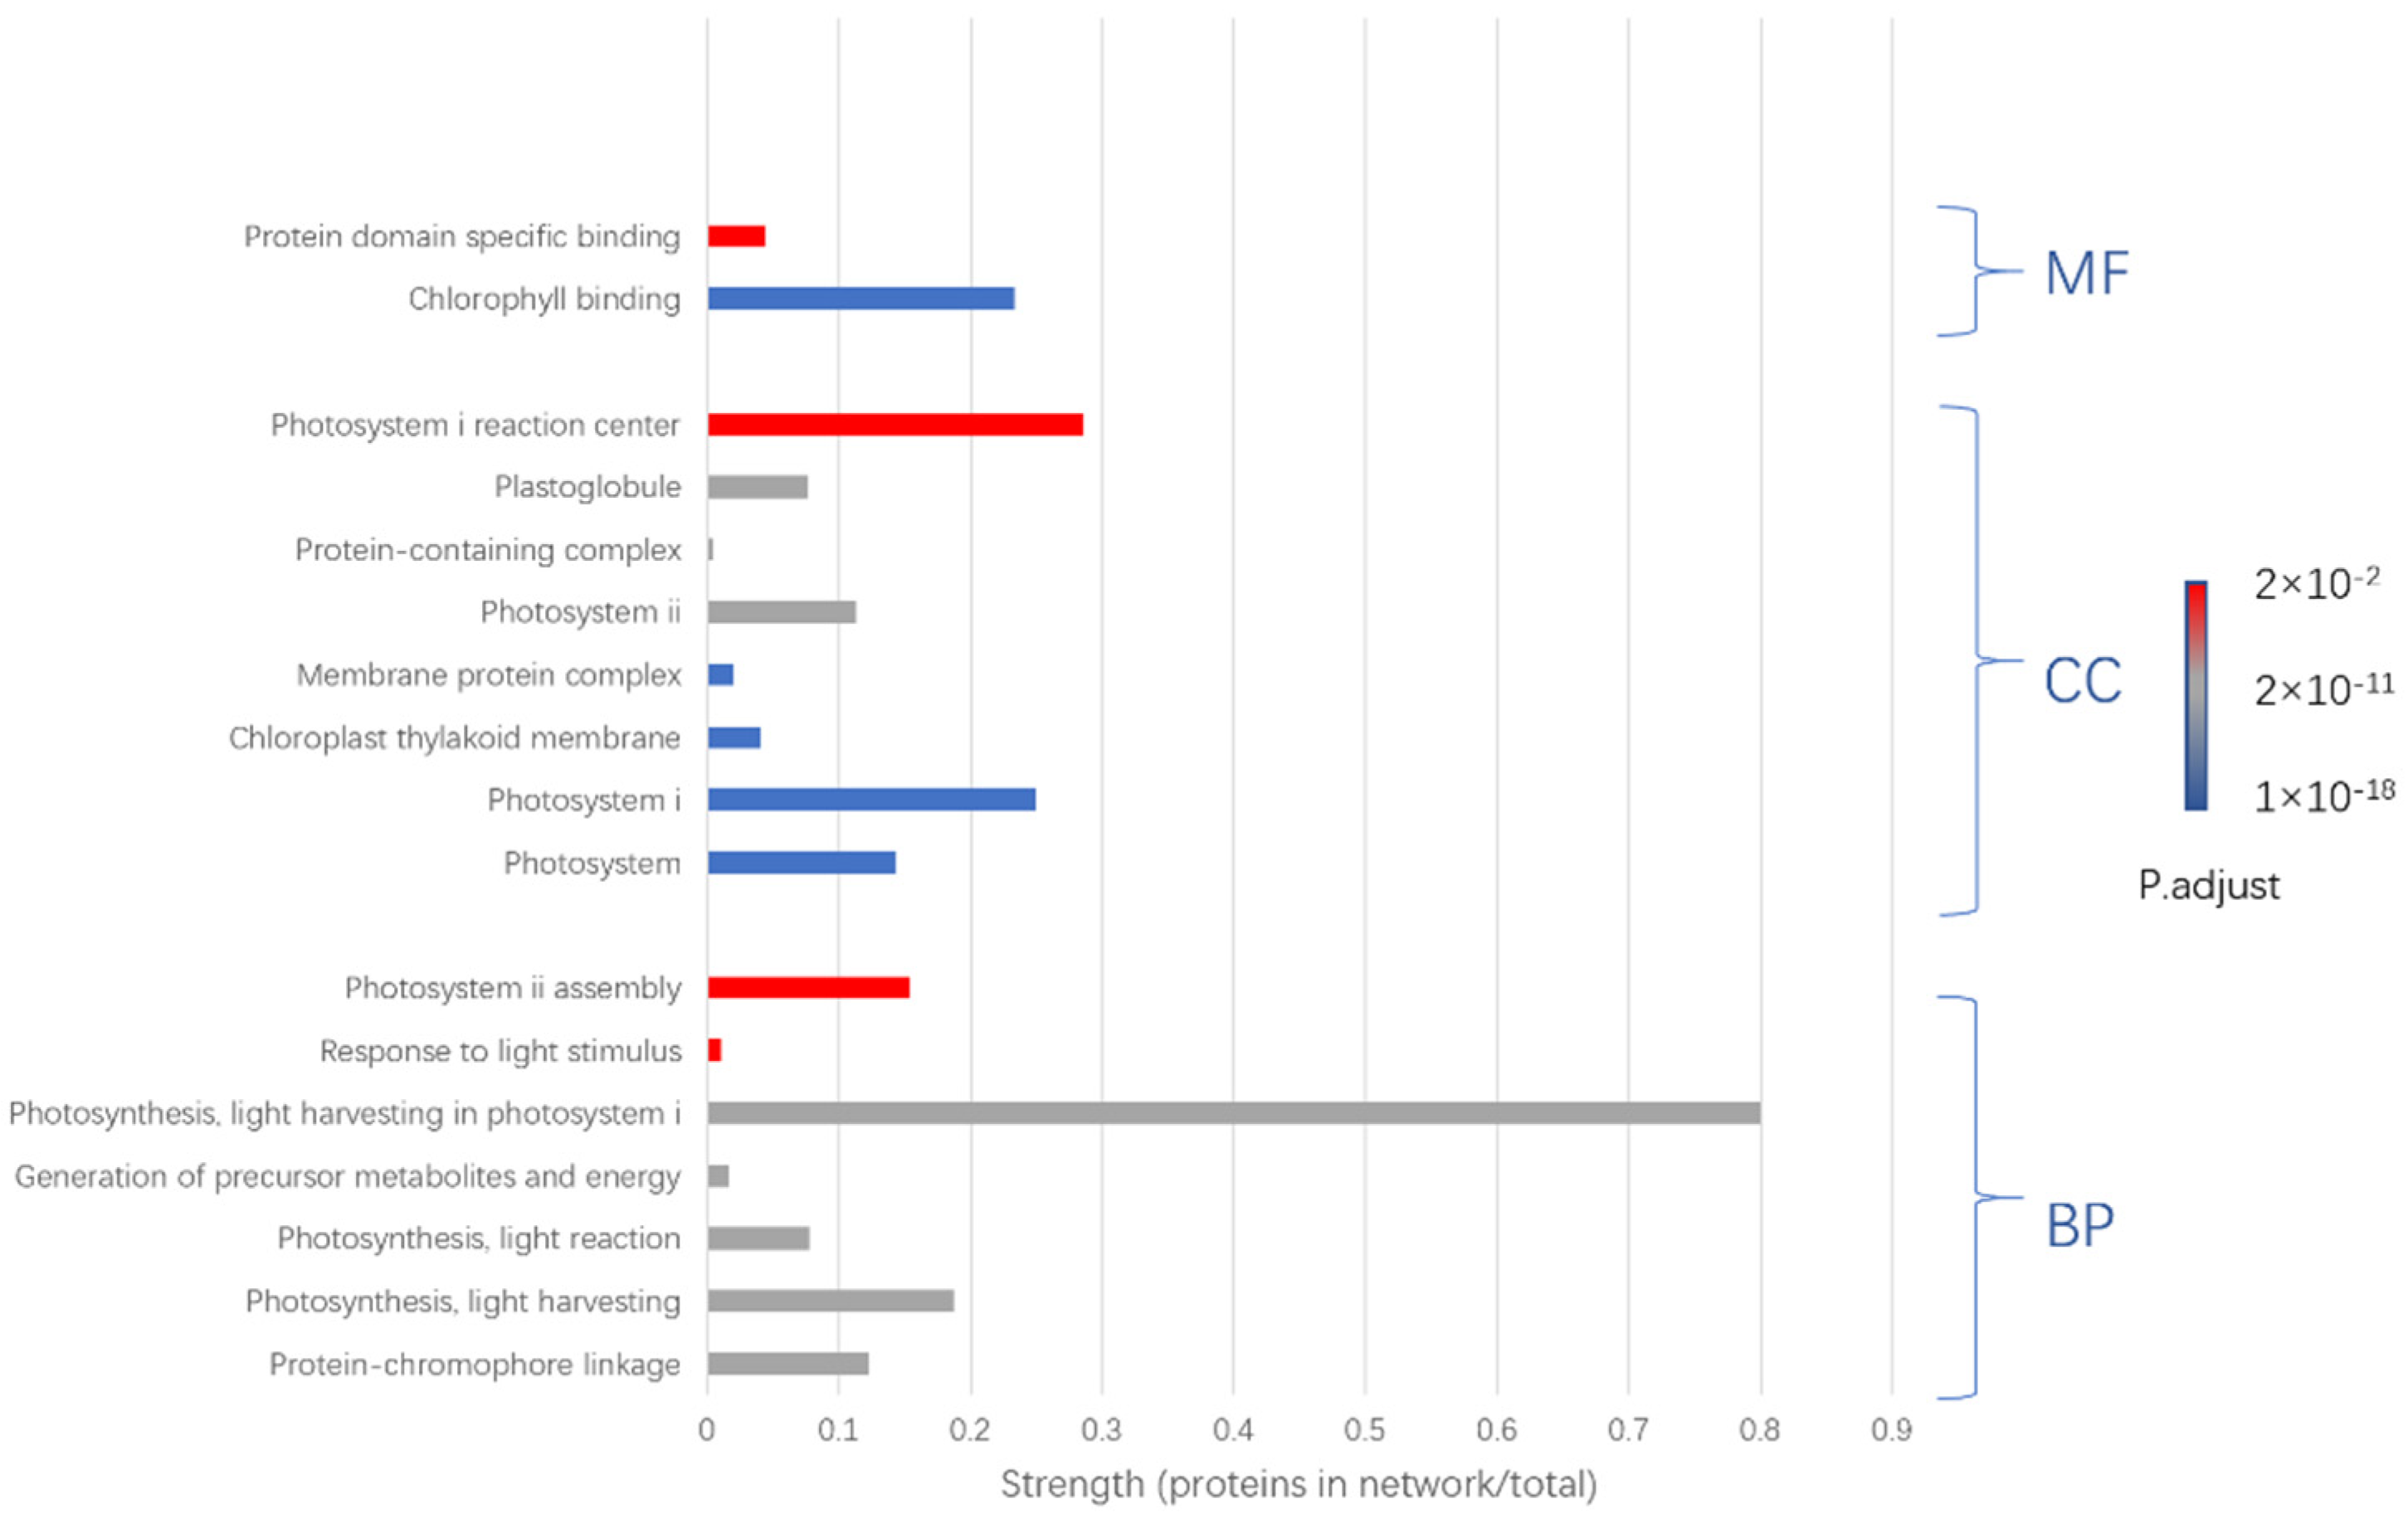
3.4. Protein Identification by MALDI-TOF/TOF-MS

To further understand the difference in molecular mechanisms among purple-red and white-yellow cultivars, proteomes of 20 typical colored-leaf cultivars (including 4 purple-red cultivars and 16 white-yellow cultivars) were obtained. These peptides were assigned to 4712 distinct protein groups. Single peptide hits were filtered from the dataset to yield a list of 4620 high-confidence protein groups identified at 0.1% FDR. Twenty-one differential proteins were detected when we classified cultivars as purple-red and white-yellow classes, and the most identified proteins in this study were homologous to those found in other plants and organisms. Among these proteins, there were 16 upregulated proteins and 5 downregulated proteins in purple-red cultivars (Figure 5).
Among all identified differential proteins (Table 2), 11 upregulated proteins (A0A4S4EJX1, A0A4S4D3X1, A0A4S4DAL3, A0A4S4EPH5, A0A4S4DHY3, A0A4S4DU30, A0A4S4DZ53, A0A4S4ES74, A0A4S4EXN0, A0A4S4EYN1 and A0A4S4EZG3) played main roles in the system chlorophyll-binding subunits of photosystems I and II (PS I and II). Among them, A0A4S4EYN1, as PS I reaction subunit V, is a kind of PsaL domain-containing protein belonging to the PsaL family. Homologous proteins were present in other plants, such as Carica papaya, Nelumbo nucifera and Theobroma cacao [39,40], and it was usually present as PS I reaction center subunit XI in the membrane of the chloroplast. A0A4S4EYN1 interacted with all other proteins and should be at the core position as the receptor protein in PS I of tea (Figure 6).
In addition, the function of protein A0A4S4DU30 of tea plants has not been well characterized, but some homologous proteins have been resolved in other plants, such as Citrus clementina [39]. It may be PS I reaction center subunit ii, as PsaD, which can form complexes with ferredoxin and ferredoxin-oxidoreductase in the PS I reaction center. A0A4S4ES74 has also not been well characterized, with lower homology in other plants, and it might be a kind of oxygen-evolving enhancer protein. In addition, A0A4S4DZ53, A0A4S4EXN0, A0A4S4EZG3, A0A4S4D3X1, A0A4S4DAL3 and A0A4S4EJX1, as chlorophyll a-b binding proteins (CABs), had a higher interaction relationship in purple-red cultivars (Table 3). This is consistent with the findings of previous studies on the mechanism of white-yellow tea leaves [9]. The expression of chlorophyll and carotenoids in white-yellow tea cultivars was suppressed, which may lead to inhibition of CAB expression through feedback regulation and, finally, induced hypoplasia of chloroplasts by suppressing the development of thylakoids and grana stacking. The development of chloroplasts is closely related to chlorophyll content, and any obstructed pathway in the process of chloroplast development affects chlorophyll content and leaf color mutations. Compared with white-yellow tea, purple-red tea had a high expression of related proteins, which might mean better chloroplast development, high light adaptation and transformation ability.
Abundance analysis showed that most proteins related to photosynthesis (light reaction, light harvesting in PS I and PS II assembly) had the molecular function of chlorophyll binding. Additionally, the biological processes of these proteins were involved in protein–chromophore linkage, generation of precursor metabolites and response to light stimulus. The cellular components involved in the reaction include photosystem, photosystem I, chloroplast thylakoid membrane, membrane protein complex, photosystem ii, protein-containing complex, plastoglobuli and PS I reaction center (Figure 7).
Photosynthesis plays an important role in plant growth and development, providing a source of carbon for the synthesis of organic matter and nutritional compounds. The chlorophyll-binding subunits of PS I and II were internal antenna light-harvesting proteins of oxygenic photosynthesis, which, together with a chain of electron carriers, were localized in the photosynthetic membrane. The light-harvesting complex protein (Lhc) in green plants acts as a peripheral antenna system, enabling the more efficient absorption of light energy (Figure 8). Some researchers believed that the color changes, from green to white-yellow or purple-red, were associated with chlorophyll reduction [21]. Additionally, CsSGR is involved in the regulation of leaf albinism, and it may play an important role as a key regulator for dismantling photosynthetic chlorophyll–LHCP complexes [44]. Zhang et al. [45] used genome-wide identification, phylogenetic analysis, chromosomal distribution and collinearity to examine potential functions of Lhc superfamily genes in upland cotton and found that the expression pattern of Lhc family proteins was important for photosynthetic processes in leaves. Most of the differential proteins found in this paper in colored-leaf tea cultivars were related to the chloroplast system, demonstrating that chlorophyll and photosynthesis had an effect on the color presentation of tea leaves. Previously, studies found similar results compared with green-leaf tea. Yellow-leaf tea cultivar ZH1 exhibited significantly decreased chlorophyll content and abnormal chloroplast development with a higher AA content [46].
Unlike white-yellow cultivars, purple-red plants had a higher expression of Lhc with better absorption of light and developed chloroplasts. Carbon and nitrogen metabolism operated successfully, and the decomposition of AA was not hindered. Thus, the AA content in purple-red tea cultivars did not accumulate as in yellow-white cultivars. Some intermediate chemicals, such as ethylamine formed by AA decomposition, may continue to participate in the formation of PP and CAF (Figure 8).

4. Conclusions

With the gradual expansion of the tea market around the world, consumers have further requirements and expectations for tea quality. Non-green teas are gradually gaining attention due to their special colors and unique nutritional compounds. In this paper, the differences between the purple-red and white-yellow cultivars were compared on biochemical and proteome levels. White-yellow cultivars had significantly high AA content and low PP/AA, while purple-red cultivars showed high PP/AA. The analysis of all nutritional compounds showed that most had significant positive correlations, except AA, which had significant negative correlations with other compounds. Twenty-one differential proteins were detected in the purple-red cultivars. Most of these proteins act in the photosynthetic system. Compared with white-yellow tea, purple-red tea cultivars might have better chloroplast development.

Author Contributions

Conceptualization, Y.D. and H.C.; methodology, H.C.; software, Y.D.; validation, Y.D., H.C. and X.W.; formal analysis, X.W.; investigation, H.C.; resources, H.C.; data curation, Y.D.; writing—original draft preparation, Y.D.; writing—review and editing, X.W.; visualization, Y.D.; supervision, Y.Z.; project administration, Y.Z.; funding acquisition, Y.Z. All authors have read and agreed to the published version of the manuscript.

Funding

This research was funded by Zhejiang Science and Technology Major Program on Agricultural New Variety Breeding-Tea Plant (2021C02067-5 and 2021C02067-4), Zhejiang Tea Industry Technical Team Project (2022–2024) and Science and Technology Innovation and Demonstration and Promotion Fund of Hangzhou Academy of Agricultural Sciences (2022HNCT-04).

Institutional Review Board Statement

Not applicable.

Informed Consent Statement

Not applicable.

Data Availability Statement

Data is available by contact with the first author.

Acknowledgments

The authors gratefully acknowledge the financial support for this work from the Zhejiang Science and Technology Major Program on Agricultural New Variety Breeding-Tea Plant, Zhejiang Tea Industry Technical Team Project and Hangzhou Academy of Agricultural Sciences.

Conflicts of Interest

The authors declare have no conflict of interest.

References

  1. Hodgson, J.M.; Croft, K. Tea flavonoids and cardiovascular health. Mol. Asp. Med. 2010, 31, 495–502. [Google Scholar] [CrossRef]
  2. Kao, Y.H.; Chang, H.H.; Lee, M.J.; Chen, C.L. Tea, obesity, and diabetes. Mol. Nutr. Food Res. 2006, 50, 188–210. [Google Scholar] [CrossRef] [PubMed]
  3. Wang, L.; Yue, C.; Cao, H.; Zhou, Y.; Zeng, J.; Yang, Y. Biochemical and transcriptome analyses of a novel chlorophyll-deficient chlorina tea plant cultivar. BMC Plant Biol. 2014, 14, 352. [Google Scholar] [CrossRef] [PubMed] [Green Version]
  4. Li, C.F.; Xu, Y.X.; Ma, J.Q.; Jin, J.Q.; Chen, L. Biochemical and transcriptomic analyses reveal different metabolite biosynthesis profiles among three color and developmental stages in ‘anji baicha’ (Camellia sinensis). BMC Plant Biol. 2016, 16, 195. [Google Scholar] [CrossRef] [PubMed] [Green Version]
  5. Tian, Y.; Wang, H.; Sun, P.; Fan, Y.; Qiao, M.; Zhang, L. Response of leaf color and the expression of photoreceptor genes of camellia sinensis cv. huangjinya to different light quality conditions. Sci. Hortic. 2019, 251, 225–232. [Google Scholar] [CrossRef]
  6. Song, L.; Ma, Q.; Zou, Z.; Sun, K.; Yao, Y.; Tao, J.; Kaleri, N.A.; Li, X. Molecular link between leaf coloration and gene expression of flavonoid and carotenoid biosynthesis in camellia sinensis cultivar ‘huangjinya’. Front. Plant Sci. 2017, 8, 803. [Google Scholar] [CrossRef] [PubMed] [Green Version]
  7. Ma, L.; Liu, Y.; Cao, D.; Gong, Z.; Jin, X. Quality constituents of high amino acid content tea cultivars with various leaf colors. Turk. J. Agric. For. 2018, 42, 383–392. [Google Scholar] [CrossRef]
  8. Feng, L.; Gao, M.J.; Hou, R.Y.; Hu, X.Y.; Zhang, L.; Wan, X.C.; Wei, S. Determination of quality constituents in the young leaves of albino tea cultivars. Food Chem. 2014, 155, 98–104. [Google Scholar] [CrossRef] [PubMed]
  9. Li, N.; Yang, Y.; Ye, J.; Lu, J.; Zheng, X.; Liang, Y. Effects of sunlight on gene expression and chemical composition of light-sensitive albino tea plant. Plant Growth Regul. 2016, 78, 253–262. [Google Scholar] [CrossRef]
  10. Jiang, L.; Shen, X.; Shoji, T.; Kanda, T.; Zhao, L. Characterization and activity of anthocyanins in zijuan tea (Camellia sinensis var. kitamura). J. Agric. Food Chem. 2013, 61, 3306–3310. [Google Scholar] [CrossRef]
  11. Saito, T.; Honma, D.; Tagashira, M.; Kanda, T.; Maeda-Yamamoto, M. Anthocyanins from new red leaf tea ‘sunrouge’. J. Agric. Food Chem. 2011, 59, 4779–4782. [Google Scholar] [CrossRef]
  12. Lai, Y.S.; Li, S.; Tang, Q.; Li, H.X.; Chen, S.X. The Dark-Purple Tea Cultivar ‘Ziyan’ Accumulates a Large Amount of Delphinidin-Related Anthocyanins. J. Agric. Food Chem. 2016, 64, 2719–2726. [Google Scholar] [CrossRef] [PubMed]
  13. Kilel, E.C.; Faraj, A.K.; Wanyoko, J.K.; Wachira, F.N.; Mwingirwa, V. Green tea from purple leaf coloured tea clones in kenya—Their quality characteristics. Food Chem. 2013, 141, 769–775. [Google Scholar] [CrossRef] [PubMed]
  14. Kumari, M.; Thakur, S.; Kumar, A.; Joshi, R.; Kumar, R. Regulation of color transition in purple tea (Camellia sinensis). Planta 2019, 251, 35. [Google Scholar] [CrossRef]
  15. Shen, J.; Zou, Z.; Zhang, X.; Zhou, L.; Wang, Y.; Fang, W.; Zhu, X. Metabolic analyses reveal different mechanisms of leaf color change in two purple-leaf tea plant (Camellia sinensis L.) cultivars. Hortic. Res. 2018, 5, 7. [Google Scholar] [CrossRef] [Green Version]
  16. Kerio, L.C.; Wachira, F.N.; Wanyoko, J.K.; Rotich, M.K. Total polyphenols, catechin profiles and antioxidant activity of tea products from purple leaf coloured tea cultivars. Food Chem. 2013, 136, 1405–1413. [Google Scholar] [CrossRef]
  17. Hsu, C.P.; Shih, Y.T.; Lin, B.R.; Chiu, C.F.; Lin, C.C. Inhibitory effect and mechanisms of an anthocyanins- and anthocyanidins-rich extract from purple-shoot tea on colorectal carcinoma cell proliferation. J. Agric. Food Chem. 2012, 60, 3686–3692. [Google Scholar] [CrossRef]
  18. Li, Y.; Yuan, P.; Wang, C.; Wu, Z. The research progress of main chemical constituents and functional activity in purple tea. Int. J. Nutr. Food Sci. 2021, 10, 24. [Google Scholar] [CrossRef]
  19. Joshi, R.; Rana, A.; Gulati, A.A. Studies on quality of orthodox teas made from anthocyanin-rich tea clones growing in Kangra Valley, India. Food Chem. 2015, 176, 357–366. [Google Scholar] [CrossRef] [PubMed]
  20. Li, M.; Shen, Y.; Ling, T.; Ho, C.T.; Xie, Z. Analysis of differentiated chemical components between zijuan purple tea and yunkang green tea by uhplc–orbitrap–ms/ms combined with chemometrics. Foods 2021, 10, 1070. [Google Scholar] [CrossRef]
  21. Peng, G.; Xie, X.L.; Jiang, Q.; Song, S.; Xu, C.J. Chlorophyll a/b binding protein plays a key role in natural and ethylene-induced degreening of ponkan (Citrus reticulata blanco). Sci. Hortic. 2013, 160, 37–43. [Google Scholar] [CrossRef]
  22. Green, B.R.; Pichersky, E.; Kloppstech, K. Chlorophyll a/b-binding proteins: An extended family. Trends Biochem. Sci. 1991, 16, 181. [Google Scholar] [CrossRef] [Green Version]
  23. Wei, X.; Su, X.; Cao, P.; Liu, X.; Chang, W.; Li, M. Structure of spinach photosystem II–LHCII supercomplex at 3.2 resolution. Nature 2016, 534, 69. [Google Scholar] [CrossRef] [PubMed]
  24. Li, X.W.; Zhu, Y.L.; Chen, C.Y.; Geng, Z.J.; Du, F. Cloning and characterization of two chlorophyll a/b binding protein genes and analysis of their gene family in Camellia sinensis. Sci. Rep. 2020, 10, 4602. [Google Scholar] [CrossRef] [Green Version]
  25. Amarie, S.; Wilk, L.; Barros, T.; Kühlbrandt, W.; Dreuw, A.; Wachtveitl, J. Properties of zeaxanthin and its radical cation bound to the minor light-harvesting complexes cp24, cp26 and cp29. Biochim. Biophys. Acta—Bioenerg. 2009, 1787, 747–752. [Google Scholar] [CrossRef] [PubMed] [Green Version]
  26. Xie, N.; Zhang, C.; Zhou, P.; Gao, X.; Wang, M.; Tian, S.; Lu, C.; Wang, K.; Shen, C. Transcriptomic analyses reveal variegation-induced metabolic changes leading to high L-theanine levels in albino sectors of variegated tea (Camellia sinensis). Plant Physiol. Biochem. 2021, 169, 29–39. [Google Scholar] [CrossRef] [PubMed]
  27. Zhou, Q.; Chen, Z.; Lee, J.; Li, X.; Sun, W. Proteomic analysis of tea plants (Camellia sinensis) with purple young shoots during leaf development. PLoS ONE 2017, 12, e0177816. [Google Scholar]
  28. Ye, Y.; Yan, J.; Cui, J.; Mao, S.; Li, M.; Liao, X.; Tong, H. Dynamic changes in amino acids, catechins, caffeine and gallic acid in green tea during withering. J. Food Compos. Anal. 2018, 66, 98–108. [Google Scholar] [CrossRef]
  29. Yu, C.; Hao, D.; Chu, Q.; Wang, T.; Liu, S.; Lan, T.; Pan, C. A one adsorbent QuEChERS method coupled with LC-MS/MS for simultaneous determination of 10 organophosphorus pesticide residues in tea. Food Chem. 2020, 321, 126657. [Google Scholar] [CrossRef]
  30. Zuo, Y.; Chen, H.; Deng, Y. Simultaneous determination of catechins, caffeine and gallic acids in green, Oolong, black and pu-erh teas using HPLC with a photodiode array detector. Talanta 2002, 57, 307–316. [Google Scholar] [CrossRef]
  31. Simpson, D.M.; Beynon, R.J. Acetone precipitation of proteins and the modification of peptides. J. Proteome Res. 2010, 9, 444–450. [Google Scholar] [CrossRef]
  32. Liu, Y.; Cao, D.; Ma, L.; Jin, X.; Yang, P.; Ye, F.; Wei, C. TMT-based quantitative proteomics analysis reveals the response of tea plant (Camellia sinensis) to fluoride. J. Proteom. 2018, 176, 71–81. [Google Scholar] [CrossRef] [PubMed]
  33. Liu, Y.; Chaturvedi, P.; Fu, J.; Cai, Q.; Weckwerth, W.; Yang, P. Induction and quantitative proteomic analysis of cell dedifferentiation during callus formation of lotus (Nelumbo nucifera Gaertn. spp. baijianlian). J. Proteom. 2016, 131, 61–70. [Google Scholar] [CrossRef] [PubMed]
  34. Shannon, P.; Markiel, A.; Ozier, O.; Baliga, N.S.; Wang, J.T.; Ramage, D.; Deker, T. Cytoscape: A software environment for integrated models of biomolecular interaction networks. Genome Res. 2003, 13, 2498–2504. [Google Scholar] [CrossRef]
  35. Zhang, Q.; Liu, M.; Jianyun, R. Integrated Transcriptome and metabolic analyses reveals novel insights into free amino acid metabolism in Huangjinya tea cultivar. Front. Plant Sci. 2017, 8, 891. [Google Scholar] [CrossRef] [Green Version]
  36. Zhang, Q.; Tang, D.; Liu, M.; Ruan, J. Integrated analyses of the transcriptome and metabolome of the leaves of albino tea cultivars reveal coordinated regulation of the carbon and nitrogen metabolism. Sci. Hortic. 2017, 231, 272–281. [Google Scholar] [CrossRef]
  37. Wei, K.; Wang, L.Y.; Zhou, J.; He, W.; Zeng, J.M.; Jiang, Y.W.; Cheng, H. Comparison of catechins and purine alkaloids in albino and normal green tea cultivars (Camellia sinensis L.) by HPLC. Food Chem. 2012, 130, 720–724. [Google Scholar] [CrossRef]
  38. Du, Y.Y.; Liang, Y.R.; Wang, H.; Wang, K.R.; Lu, J.L.; Zhang, G.H.; Fang, Q.Y. A study on the chemical composition of albino tea cultivars. J. Hortic. Sci. Biotechnol. 2006, 81, 809–812. [Google Scholar] [CrossRef]
  39. Qin, X.; Suga, M.; Kuang, T.; Shen, J.R. Structural basis for energy transfer pathways in the plant PSI-LHCI supercomplex. Science 2015, 348, 989–995. [Google Scholar] [CrossRef] [PubMed]
  40. Amunts, A.; Toporik, H.; Borovikova, A.; Nelson, N. Structure determination and improved model of plant photosystem I. J. Biol. Chem. 2010, 285, 3478–3486. [Google Scholar] [CrossRef] [PubMed] [Green Version]
  41. Mazor, Y.; Borovikova, A.; Caspy, I.; Nelson, N. Structure of the plant photosystem I supercomplex at 2.6 Å resolution. Nat. Plants 2017, 3, 17014. [Google Scholar] [CrossRef] [PubMed] [Green Version]
  42. Su, X.; Ma, J.; Wei, X.; Cao, P.; Zhu, D.; Chang, W.; Li, M. Structure and assembly mechanism of plant C2S2M2-type PSII-LHCII supercomplex. Science 2017, 357, 815–820. [Google Scholar] [CrossRef] [PubMed] [Green Version]
  43. Pan, X.; Ma, J.; Su, X.; Cao, P.; Chang, W.; Liu, Z.; Li, M. Structure of the maize photosystem I supercomplex with light-harvesting complexes I and II. Science 2018, 360, 1109–1113. [Google Scholar] [CrossRef] [Green Version]
  44. Chen, X.; Li, J.; Yu, Y.; Kou, X.; Periakaruppan, R.; Chen, X.; Li, X. STAY-GREEN and light-harvesting complex II chlorophyll a/b binding protein are involved in albinism of a novel albino tea germplasm ‘Huabai 1’. Sci. Hortic. 2022, 293, 110653. [Google Scholar] [CrossRef]
  45. Zhang, Q.; Ma, C.; Wang, X.; Ma, Q.; Fan, S.; Zhang, C. Genome-wide identification of the light-harvesting chlorophyll a/b binding (Lhc) family in Gossypium hirsutum reveals the influence of GhLhcb 2.3 on chlorophyll a synthesis. Plant Biol. 2021, 23, 831–842. [Google Scholar] [CrossRef] [PubMed]
  46. Wang, L.; Cao, H.; Chen, C.; Yue, C.; Hao, X.; Yang, Y.; Wang, X. Complementary transcriptomic and proteomic analyses of a chlorophyll-deficient tea plant cultivar reveal multiple metabolic pathway changes. J. Proteom. 2016, 130, 160–169. [Google Scholar] [CrossRef] [PubMed]
Figure 1. Leaf color and morphology of 26 tea cultivars at the one-bud, two-leaf stage. ‘Baijiguan’ was not collected at the same time as other cultivars because its germination was significantly later than the others’.
Horticulturae 08 00685 g001
Figure 2. Average total catechin, amino acid, polyphenol and caffeine contents of three different colored-leaf tea types (*: p < 0.05).
Horticulturae 08 00685 g002
Figure 3. Polyphenol/amino acid content of 26 tea cultivars. The purple bar shows the data from 7 purple-red cultivars, and the yellow bar is the data from yellow-white cultivars. The horizontal line is the PP/AA of ‘Longjing 43’.
Horticulturae 08 00685 g003
Figure 4. Correlogram of CAT, AA, PP, CAF, EC, GC, EGC, CG, ECG, GCG, EGCG, C, SCAT and ETCAT. Left: Correlations of three different colored-leaf tea types. Red refers to a negative correlation, blue refers to a positive correlation, and the shade of color is proportional to the strength of the correlation. Right: Correlations of purple-red tea types. Lines indicate trends in correlations.
Horticulturae 08 00685 g004
Figure 5. Volcano plot to detect differential proteins of purple-red cultivars compared with white-yellow cultivars. Red refers to upregulated proteins, and blue refers to downregulated proteins.
Horticulturae 08 00685 g005
Figure 6. Interactions among 11 detected differential proteins. The size of the circle is positively correlated with the degree of interaction. The interaction was analyzed in STRING and drawn using Cytoscape.
Horticulturae 08 00685 g006
Figure 7. Gene Ontology classification of the differential proteins of purple-red cultivars. MF: molecular function, CC: cellular component, BP: biological process. p. adjust < 0.05 refers to significant difference among the accessions.
Horticulturae 08 00685 g007
Figure 8. Function and location of Lhc proteins in PS I and PS II. Yellow arrows represent decreasing content in white-yellow tea cultivars, and purple arrows represent increasing content in purple-red cultivars. Drawn by Biorender (version 2022, Shiz Aoki, Toronto, ON, Canada).
Horticulturae 08 00685 g008
Table 1. Simple catechin and ester-type catechin contents of three different colored-leaf tea types *.
Purple-RedWhite-YellowGreen (Longjing43)
GC0.90 ± 0.15 Aa0.70 ± 0.25 Ab0.80 ± 0.10 Aab
EGC1.03 ± 0.21 Aa0.99 ± 0.43 Aa0.89 ± 0.19 Aa
C0.25 ± 0.11 ABb0.25 ± 0.78 Bb0.32 ± 0.05 Aa
EGCG4.92 ± 1.47 Bb5.36 ± 1.35 Bb6.89 ± 0.34 Aa
EC0.61 ± 0.24 AaB0.55 ± 0.14 aB0.65 ± 0.11 Aa
GCG2.45 ± 0.43 Bb2.41 ± 0.56 Bb3.01 ± 0.23 Aa
ECG1.45 ± 0.76 Bb1.36 ± 0.41 Bb3.05 ± 0.17 Aa
CG0.38 ± 0.19 Bb0.32 ± 0.11 Bb0.63 ± 0.06 Aa
Simple catechins2.79 ± 0.44 Aa2.50 ± 0.83 Aa2.66 ± 0.44 Aa
Ester type catechins9.20 ± 2.24 Bb9.46 ± 2.30 Bb13.58 ± 0.67 Aa
* Different capital letters after the values refer to significant difference at the p < 0.01 level, and different small letters refer to significant difference among the accessions at p < 0.05.
Table 2. Detected differential proteins of purple-red cultivars compared with white-yellow cultivars with protein and gene names. Increased change refers to upregulated proteins, and decreased change refers to downregulated proteins.
No.ChangeProtein NameGene Name
1IncreasedPhotosystem I iron-sulfur center (PSI-C)psaC
2IncreasedGermin-like protein (A0A4S4EA81)TEA_002437
3IncreasedChlorophyll a-b binding protein (A0A4S4EJX1)TEA_020597
4IncreasedChlorophyll a-b binding protein (A0A4S4D3X1)TEA_001699
5IncreasedChlorophyll a-b binding protein (A0A4S4DAL3)TEA_001579
6IncreasedRhodanese domain-containing protein (A0A4S4EPH5)TEA_012572
7IncreasedPhotosystem I P700 chlorophyll a apoprotein A1 (A0A4S4DHY3)TEA_001227
8IncreasedA0A4S4DU30TEA_014123
9IncreasedChlorophyll a-b binding protein (A0A4S4DZ53)TEA_027100
10IncreasedA0A4S4E5H4TEA_005661
11IncreasedA0A4S4EM82TEA_030166
12IncreasedA0A4S4ES74TEA_019755
13IncreasedChlorophyll a-b binding protein (A0A4S4EXN0)TEA_015110
14IncreasedPhotosystem I subunit V (A0A4S4EYN1)TEA_018047
15IncreasedChlorophyll a-b binding protein (A0A4S4EZG3)TEA_025056
16IncreasedOxygen-evolving enhancer proteinOEP1
17DecreasedNop domain-containing protein (A0A4S4D679)TEA_025749
18DecreasedProteasome subunit beta (A0A4S4DXI4)TEA_014823
19DecreasedDerlin (A0A4S4E641)TEA_007225
20DecreasedPeptidylprolyl isomerase (A0A4S4F203)TEA_026953
21DecreasedRibosomal_L14e domain-containing protein (A0A4S4F275)TEA_019930
Table 3. Six detected differential proteins belonging to the chlorophyll a-b binding proteins family and related references.
Protein NameLhc NameReference
A0A4S4DAL3Lhca 1[41]
A0A4S4DZ53Lhcb 6[42]
A0A4S4EXN0Lhca 1[43]
A0A4S4EZG3Lhcb 6[42]
A0A4S4D3X1Lhc II[23]
A0A4S4EJX1Lhcb 5[42]
Publisher’s Note: MDPI stays neutral with regard to jurisdictional claims in published maps and institutional affiliations.

