1. Introduction
Foliar sprays containing fungicides can increase plant growth and yield [
1]. In agricultural work, fungicide is used to control the growth of fungi [
2], but the excessive use of fungicides leads to increased waste and pollution. Meanwhile, large-scale pesticides used leads to bioaccumulation and pollution of the environment [
3]. Many scholars’ have conducted relevant research to improve the utilization of pesticides, herbicides, and fungicides. Bruno et al. [
4] designed a hooded broadcast sprayer to decrease droplets drift during pesticide application. S. Appah et al. [
5] investigated the applied voltage, flow pressure, and spraying height to determine the maximum chargeability for electrostatic pesticide spray. Huitao et al. [
6] conceived a method for estimating canopy thickness using an ultrasonic sensor and provided a reference point for the precise application of variable spray to control the spray amount. Protective pesticide spray may increase the harvest, but at the same time, they increase costs. These methods can optimize utilization by reducing chemical use [
7]. The use of chemicals also causes problems such as environmental pollution, pesticide dregs, and fungitoxicity [
8].
Recently, many scholars have explored droplet characteristics during spraying or droplet deposition on plants surfaces. Decreasing the time droplets spend on the leaf surface can help us to enhance the utilization of pesticides [
9]. Zhu et al. [
10] quantified the effects of droplets with adjuvants on the plant’s surface. Samuel et al. [
11] investigated charged droplets with different surfactant concentrations and pesticides. Zhichong et al. [
12] investigated the evaporation of droplets with adjuvants under different conditions. Different adjuvants influence the droplet size and the time of dynamic evaporation. Additionally, different temperature and relative humidity levels also affect dynamic evaporation. Many adjuvants and surfactants are used in agricultural work by farm operators [
13,
14]. Changing the behavior of droplets can improve the effective utilization of pesticides. Most scholars focus on evaporation and wetted areas, as these can affect the morphology and absorption of pesticides [
15].
In field operation, wind speed influences the spraying quality. A high wind speed can carry droplets farther over the plants [
16], which could lead to poor deposition on leaf surfaces and thus lower resistances to pests and disease [
17]. Much research has been conducted on pesticide droplet evaporation on leaf surfaces or in the air, but the utilization of the technologies developed in these studies in agricultural work is still rare. The use of pesticides and fungicides could be optimized if the evaporation time of droplets on the leaf surfaces were longer.
Many studies have been conducted on how droplets evaporate on leaf surfaces, but they predominantly focus on relative humidity, temperature, leaf surface structure, and adjuvants. This can directly affect the time a droplet spends on the leaf, influencing the absorption and morphology of the active ingredients [
18]. Leaving droplets on the leaves for a long time can prevent the droplets from precipitating into crystals. Leaves cannot absorb crystal, so the pesticide or fungicide is thus rendered ineffective [
19]. Crystals are removed by the wind and pollute the environment. Thus, the droplets’ behavior in dynamic evaporation is essential, and focusing on this can assist farmers in choosing the most appropriate pesticide based on the weather, plats, and other factors [
20].
Droplet volume, relevant humidity, leaf surface structure, pesticides, and adjuvants are relevant to the droplet dynamic evaporation process [
21]. However, information on the effect of wind speed on evaporation is lacking. This paper explores how wind speed influences the droplet dynamic evaporation processes with different concentrations of thiophanate-methyl on peach leaves. We aimed to further optimize fungicide application and reduce pollution caused by chemical waste, find which different concentrations suited which wind speeds, and provide a reference for plant protection production [
22], particularly in the context of orchard spraying.
2. Materials and Methods
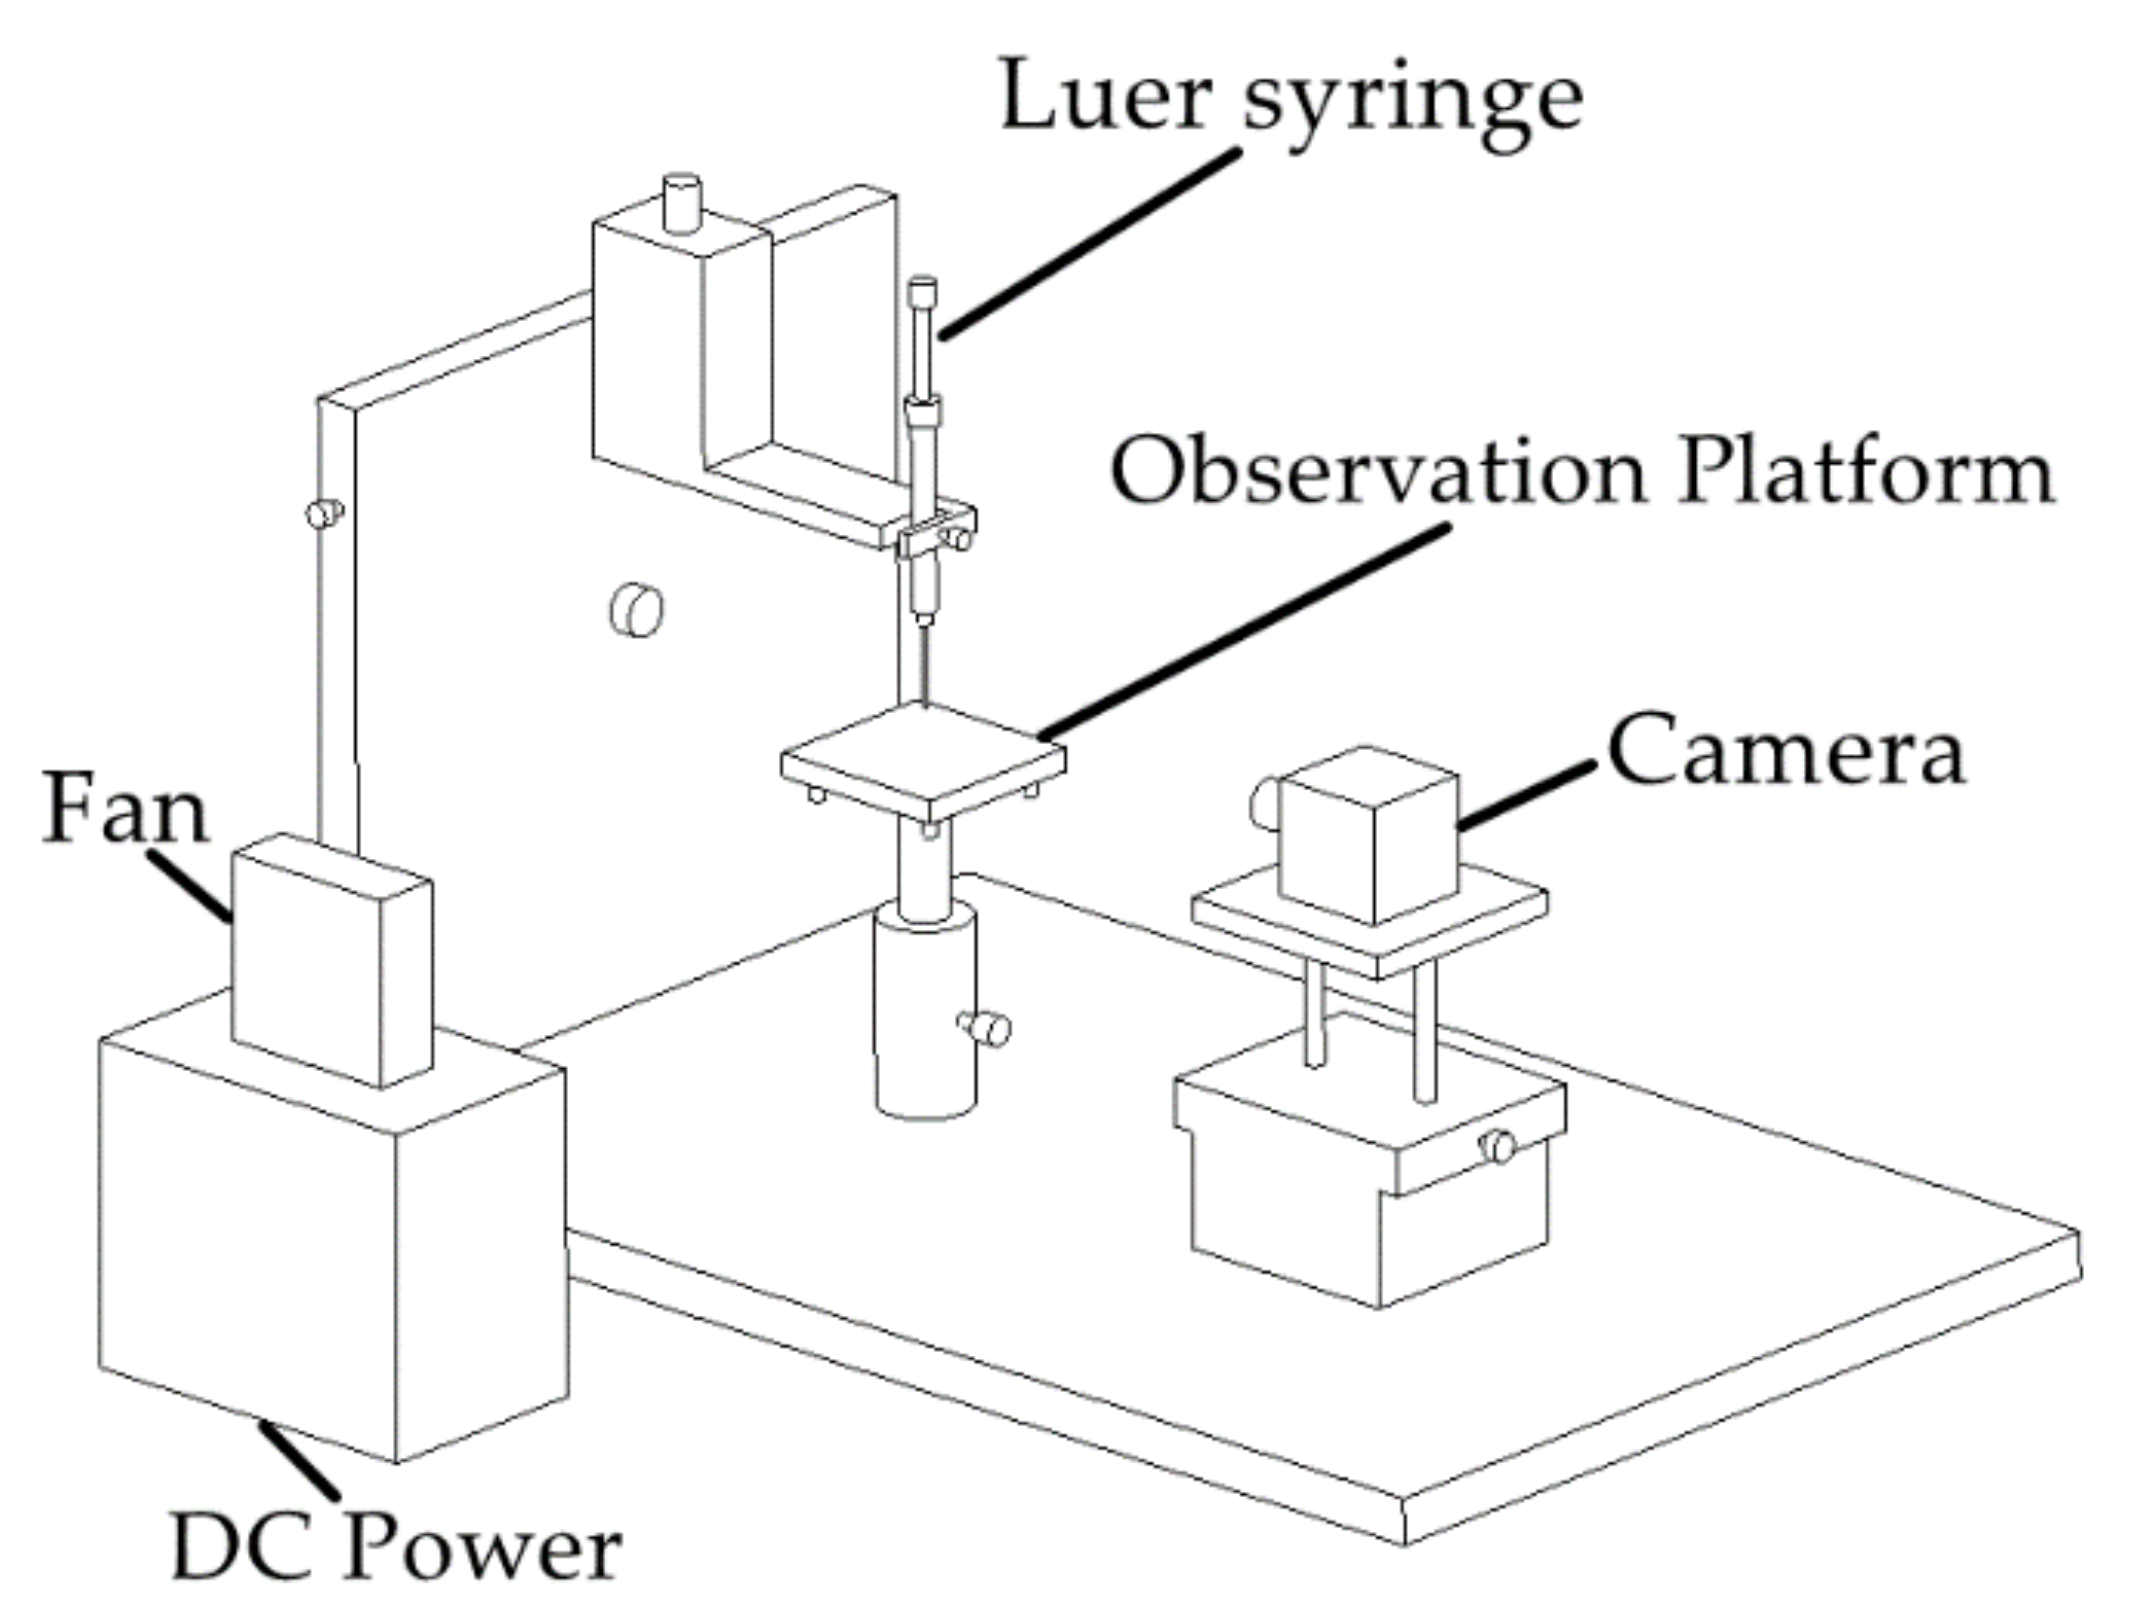
2.1. Experimental Setup
This study is about the dynamic evaporation of thiophanate-methyl droplets on the surfaces of peach leaves. The thiophanate-methyl (trade name: Ri Cao; formulation: suspension; active ingredient concentration: 500 g/L) solution was composited in pure water. The experiment involved different concentrations of thiophanate-methyl droplet static contact angles, droplet heights, and the time spent. A schematic of the experimental setup is presented in
Figure 1, which consists of three parts, including the wind flow section, droplet generator section, and visualization section.
The wind flow section included a stage, a fan (Hongda Instruments Ltd., Hefei, China; 90 ∗ 90 ∗ 25 mm; 12 V), and a DC power supply, which could trim the voltage dynamically within the range of 0–36 V. The droplet generator comprised a syringe and frame, and the visualization section included a computer, camera, and frame. The droplet generator and visualization sections were integrated into the automatic dynamic contact angle measurement. The optical contact angle and surface tension meter was a CAM101 (KSV Instruments Ltd., Bridgeport, Finland). It could measure the contact angle and height of a droplet. The fan provided different wind speeds on the surfaces of the droplets. The droplet generator section consisted of a syringe needle that dispensed the thiophanate-methyl solution onto a peach leaf through an oscillatory movement of the head of the syringe. Turning the knob of the syringe at a specified time generated a single droplet. The syringe could fit different needles to generate different of droplets sizes. In this work, we chose a stainless-steel needle of length 5 mm, diameter 0.71 mm, and volume capacity 2.5 mL, which could produce 2–5 μL mono-sized droplets. In this experiment, in order to ensure the accuracy of the experiment, we used 5 μL droplets. The unit was adjustable to maintain a maximum distance of 50 mm between the needle tip and the stage.
Fresh leaves were picked from natural peach trees and were mounted on the instrument. We cut the right base of each peach leaf to 5 cm × 5 cm and pasted it on the Teflon board. The board was placed on the observation platform. Part of the leaf was positioned adaxially and perpendicular to intercept the droplets. The fan was 30 cm away from the observation platform, and the center plane of the fan was parallel to the peach leaf. The wind speed was different when different voltages were applied to the fan. An air conditioner kept the air humidity and temperature constant. The air humidity was 70% during the experiment, and the temperature was 28 °C. The computer could control the time at which pictures were taken and calculate the data from the images. The camera was used to take sequence pictures of the droplets at regularly timed intervals during dynamic evaporation [
5].
2.2. Full Factors Experiment Setup
We aimed to explore the dynamic evaporation behavior of thiophanate-methyl droplets with different concentrations at different wind speeds on peach leaves. We used pure water as a control group to determine the evaporation performance of the thiophanate-methyl water solution on the surface of peach leaves.
When orchard sprayers work in the field, one environmental requirement is that the wind force must be lower than level three. Therefore, we chose the five wind speed levels of 0 m/s, 0.5 m/s, 1.0 m/s, 1.5 m/s, and 2.0 m/s to find the droplet evaporation regularity. The recommended concentration of thiophanate-methyl for an orchard is a 1000–1250 ppm solution. We used five different thiophanate-methyl concentrations: 1250 ppm, 1176 ppm, 1111 ppm, 1053 ppm, and 1000 ppm. Evaporation experiments were carried out at different wind speeds for each group. There were 30 sets of formulations with at least three replications for each formulation setting. A high-speed camera with an LED light fit was used to take a picture of the dynamic evaporation of different droplets. The quantitative analysis of the evaporation characteristics was conducted using the KSV CAM101, which records images every 300 s. We used the image processing software Image Pro Plus 6.0 (a photo image analyzer based on java) to analyze the changes in droplet contact angle and height. A picture was sent to the computer, and the contact angle was computed using the software. The time for droplet evaporation was measured from the total number of sequential images and the intervals after the single droplet was generated and stable.
3. Results and Discussion
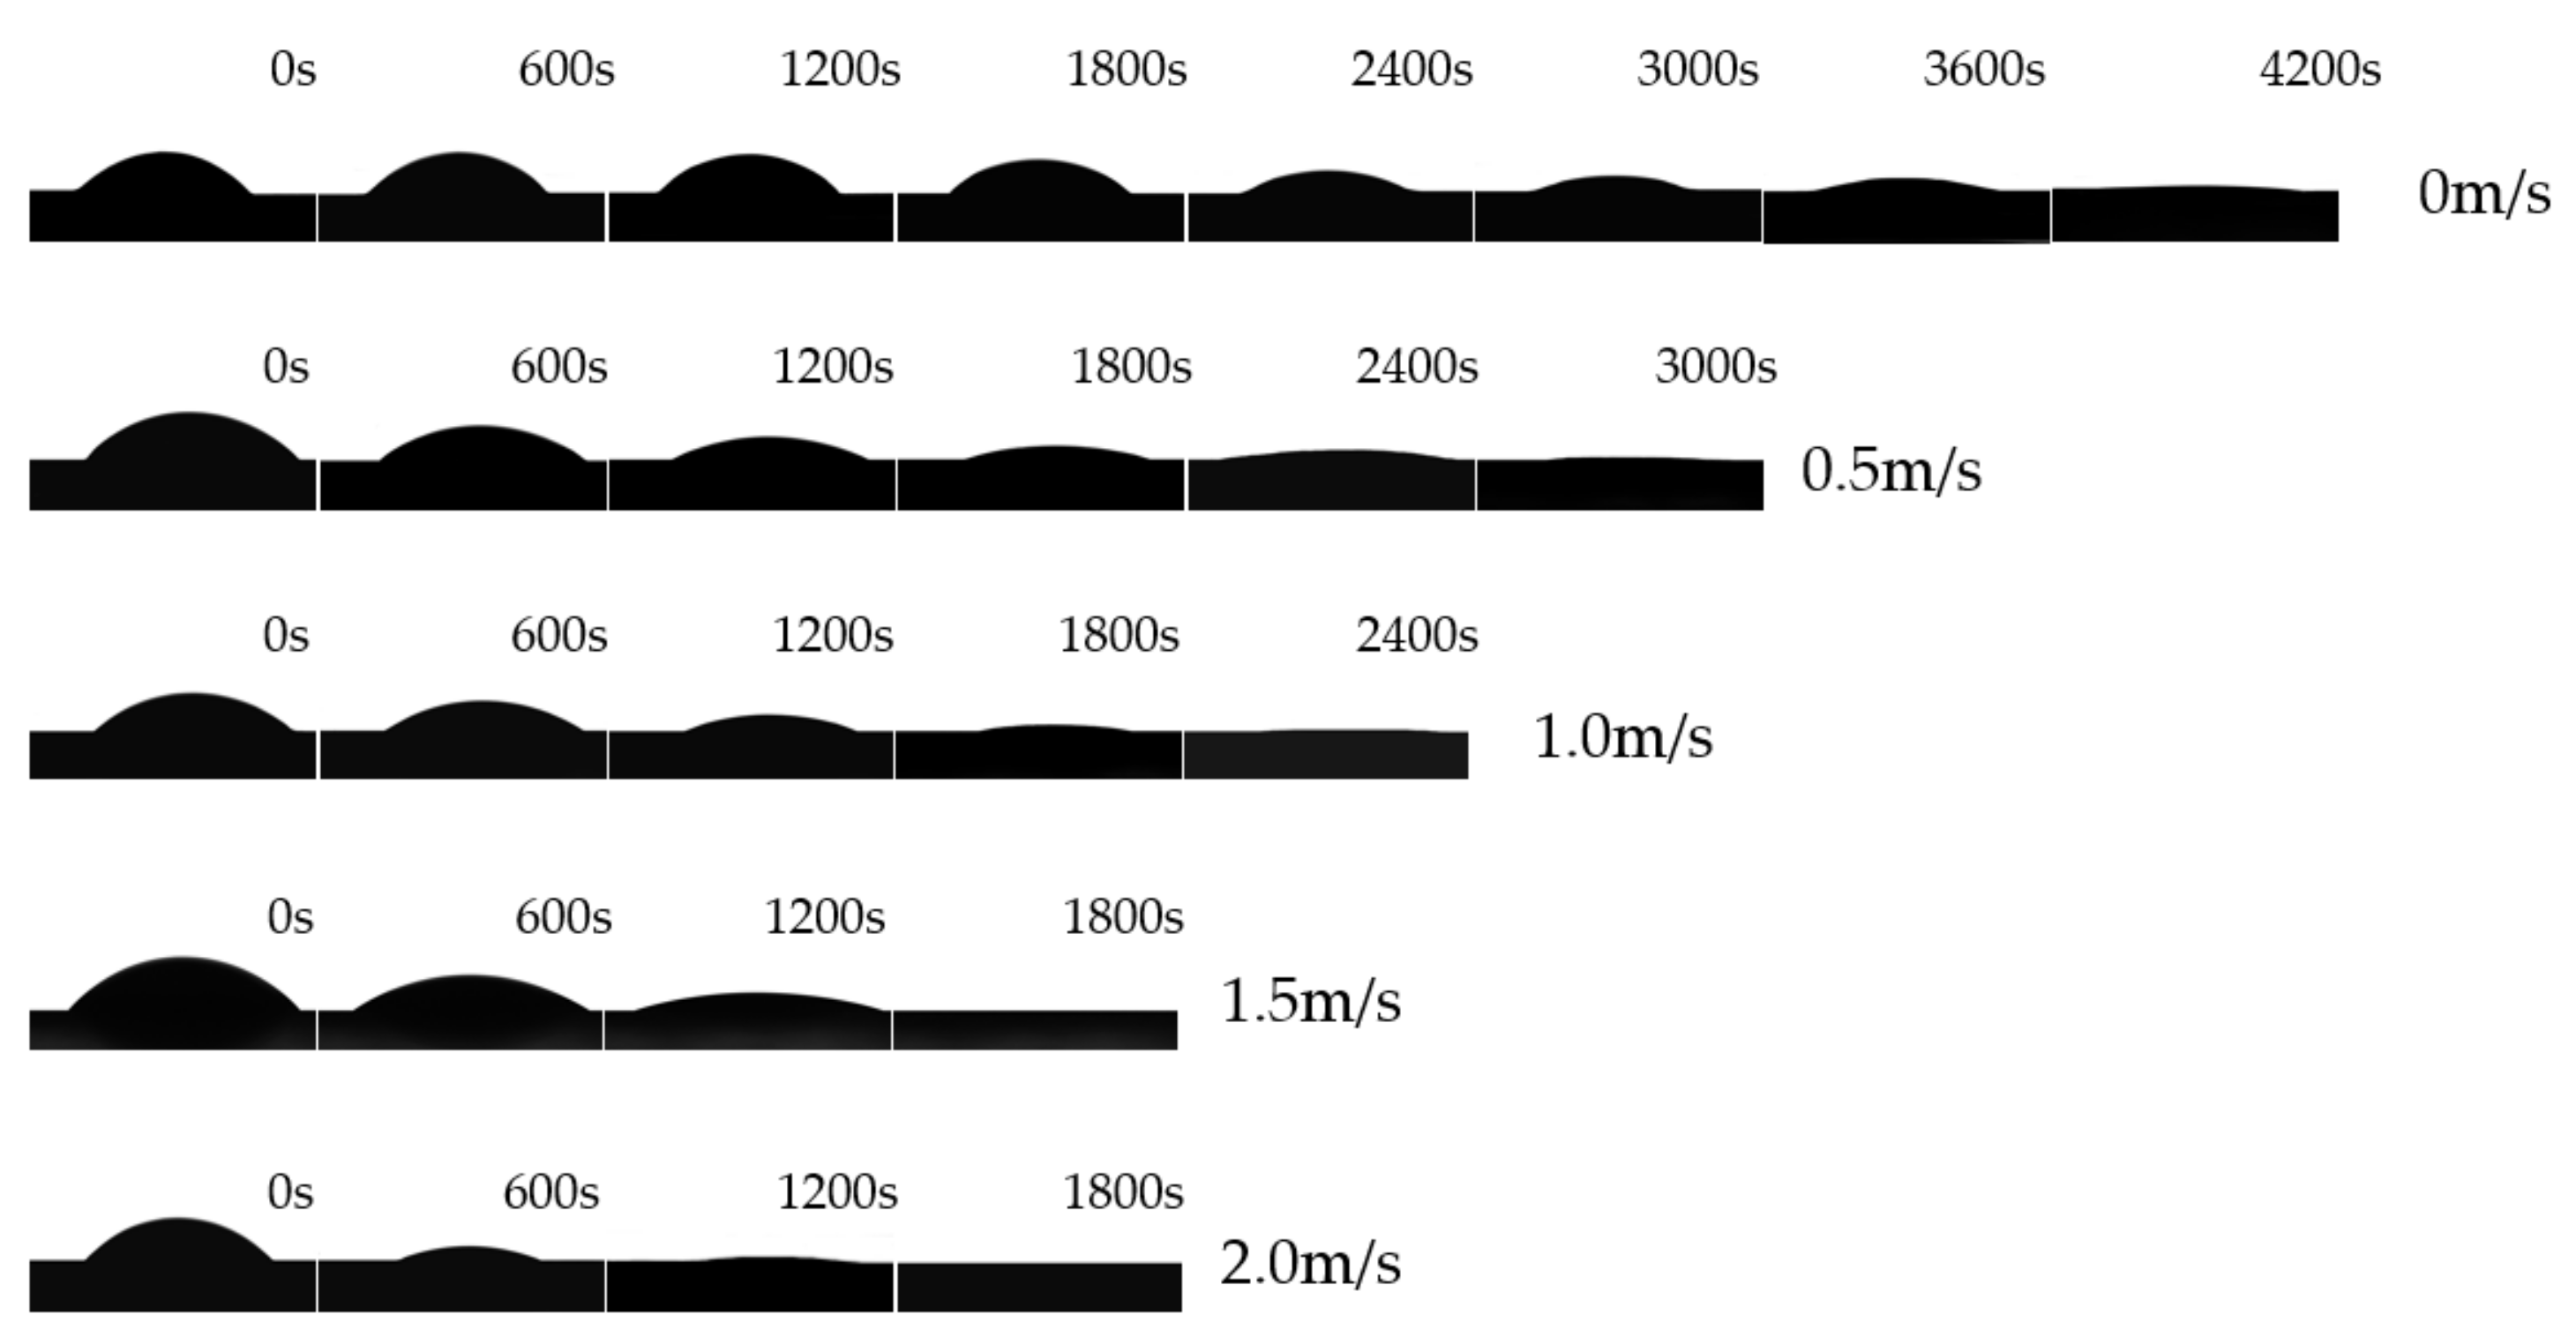
3.1. Pure Water Droplet Geometric Evolution
Picknett and Bexon [
23] pointed out that there were two stages during the evaporation of a droplet: the CCR (constant contact radius) mode and the CCA (constant contact angle) mode. During the evaporation of droplets, the direction through which water evaporates into the air is governed by the concentration gradient [
24]. In dynamic evaporation, the plant absorbs the water [
25].
Figure 2 shows snapshots of the pure water droplet geometric evolution on peach leaves at different wind speeds. As can be seen in the
Figure 2 and
Table 1, the evaporation time decreased with the increase in wind speed. When the wind speed was 0 m/s, the time taken for a droplet to evaporate was 4357 s. When the wind speed was 2.0 m/s, the time taken for a droplet to evaporate decreased to 1266 s. Thus, the time taken for a 5 μL e evaporating droplet to evaporate was shortened from 4357 s to 1266 s, when the surface wind force increased from 0 m/s to 2.0 m/s. At an increased wind speed, the water molecules on the droplet surface had tremendous momentum, and the concentration of water vapor around the droplet decreased, resulting in more water molecules escaping from the droplet surface. To further reveal the relationship between wind speed and evaporation,
Figure 3 provides the curves of the contact angle and contact height with times when pure water droplets evaporate on the surface of a peach leaf at different wind speeds. As the wind speed increases, the evaporation rate changes significantly. At 2.0 m/s in particular, the evaporation time is only 1266 s. Therefore, it can be concluded that different wind speeds have a great impact on the residence time of droplets on a leaf surface. The factors affecting droplet evaporation are very complex in field operations, and only the evaporation behavior under certain conditions is discussed here.
It can be seen from
Figure 2 that when the droplets evaporated on the surface of the peach leaves, the contact radius of the droplets was constant most of the time, which is typical of a CCR evaporation mode. The CCR period runs through the entire evaporation process. According to Dalton’s gas evaporation law formula [
12]:
In the formula, W is the evaporation rate, C is the wind speed influence coefficient, and (E − e) is the air saturation difference, where E is the saturated water vapor pressure at the water surface temperature, and e is the actual water vapor pressure of the air on the water surface.
As the wind speed increases, the water molecules are “carried” faster, so the faster the wind speed, the faster the evaporation.
Table 1 shows the time taken for the droplets to evaporate at different wind speeds. The greatest enhancement, which occurred at 2.0 m/s, was 3.44 times higher than that achieved with no wind.
3.2. Evaporation Dynamic Characteristics of Thiophanate-Methyl
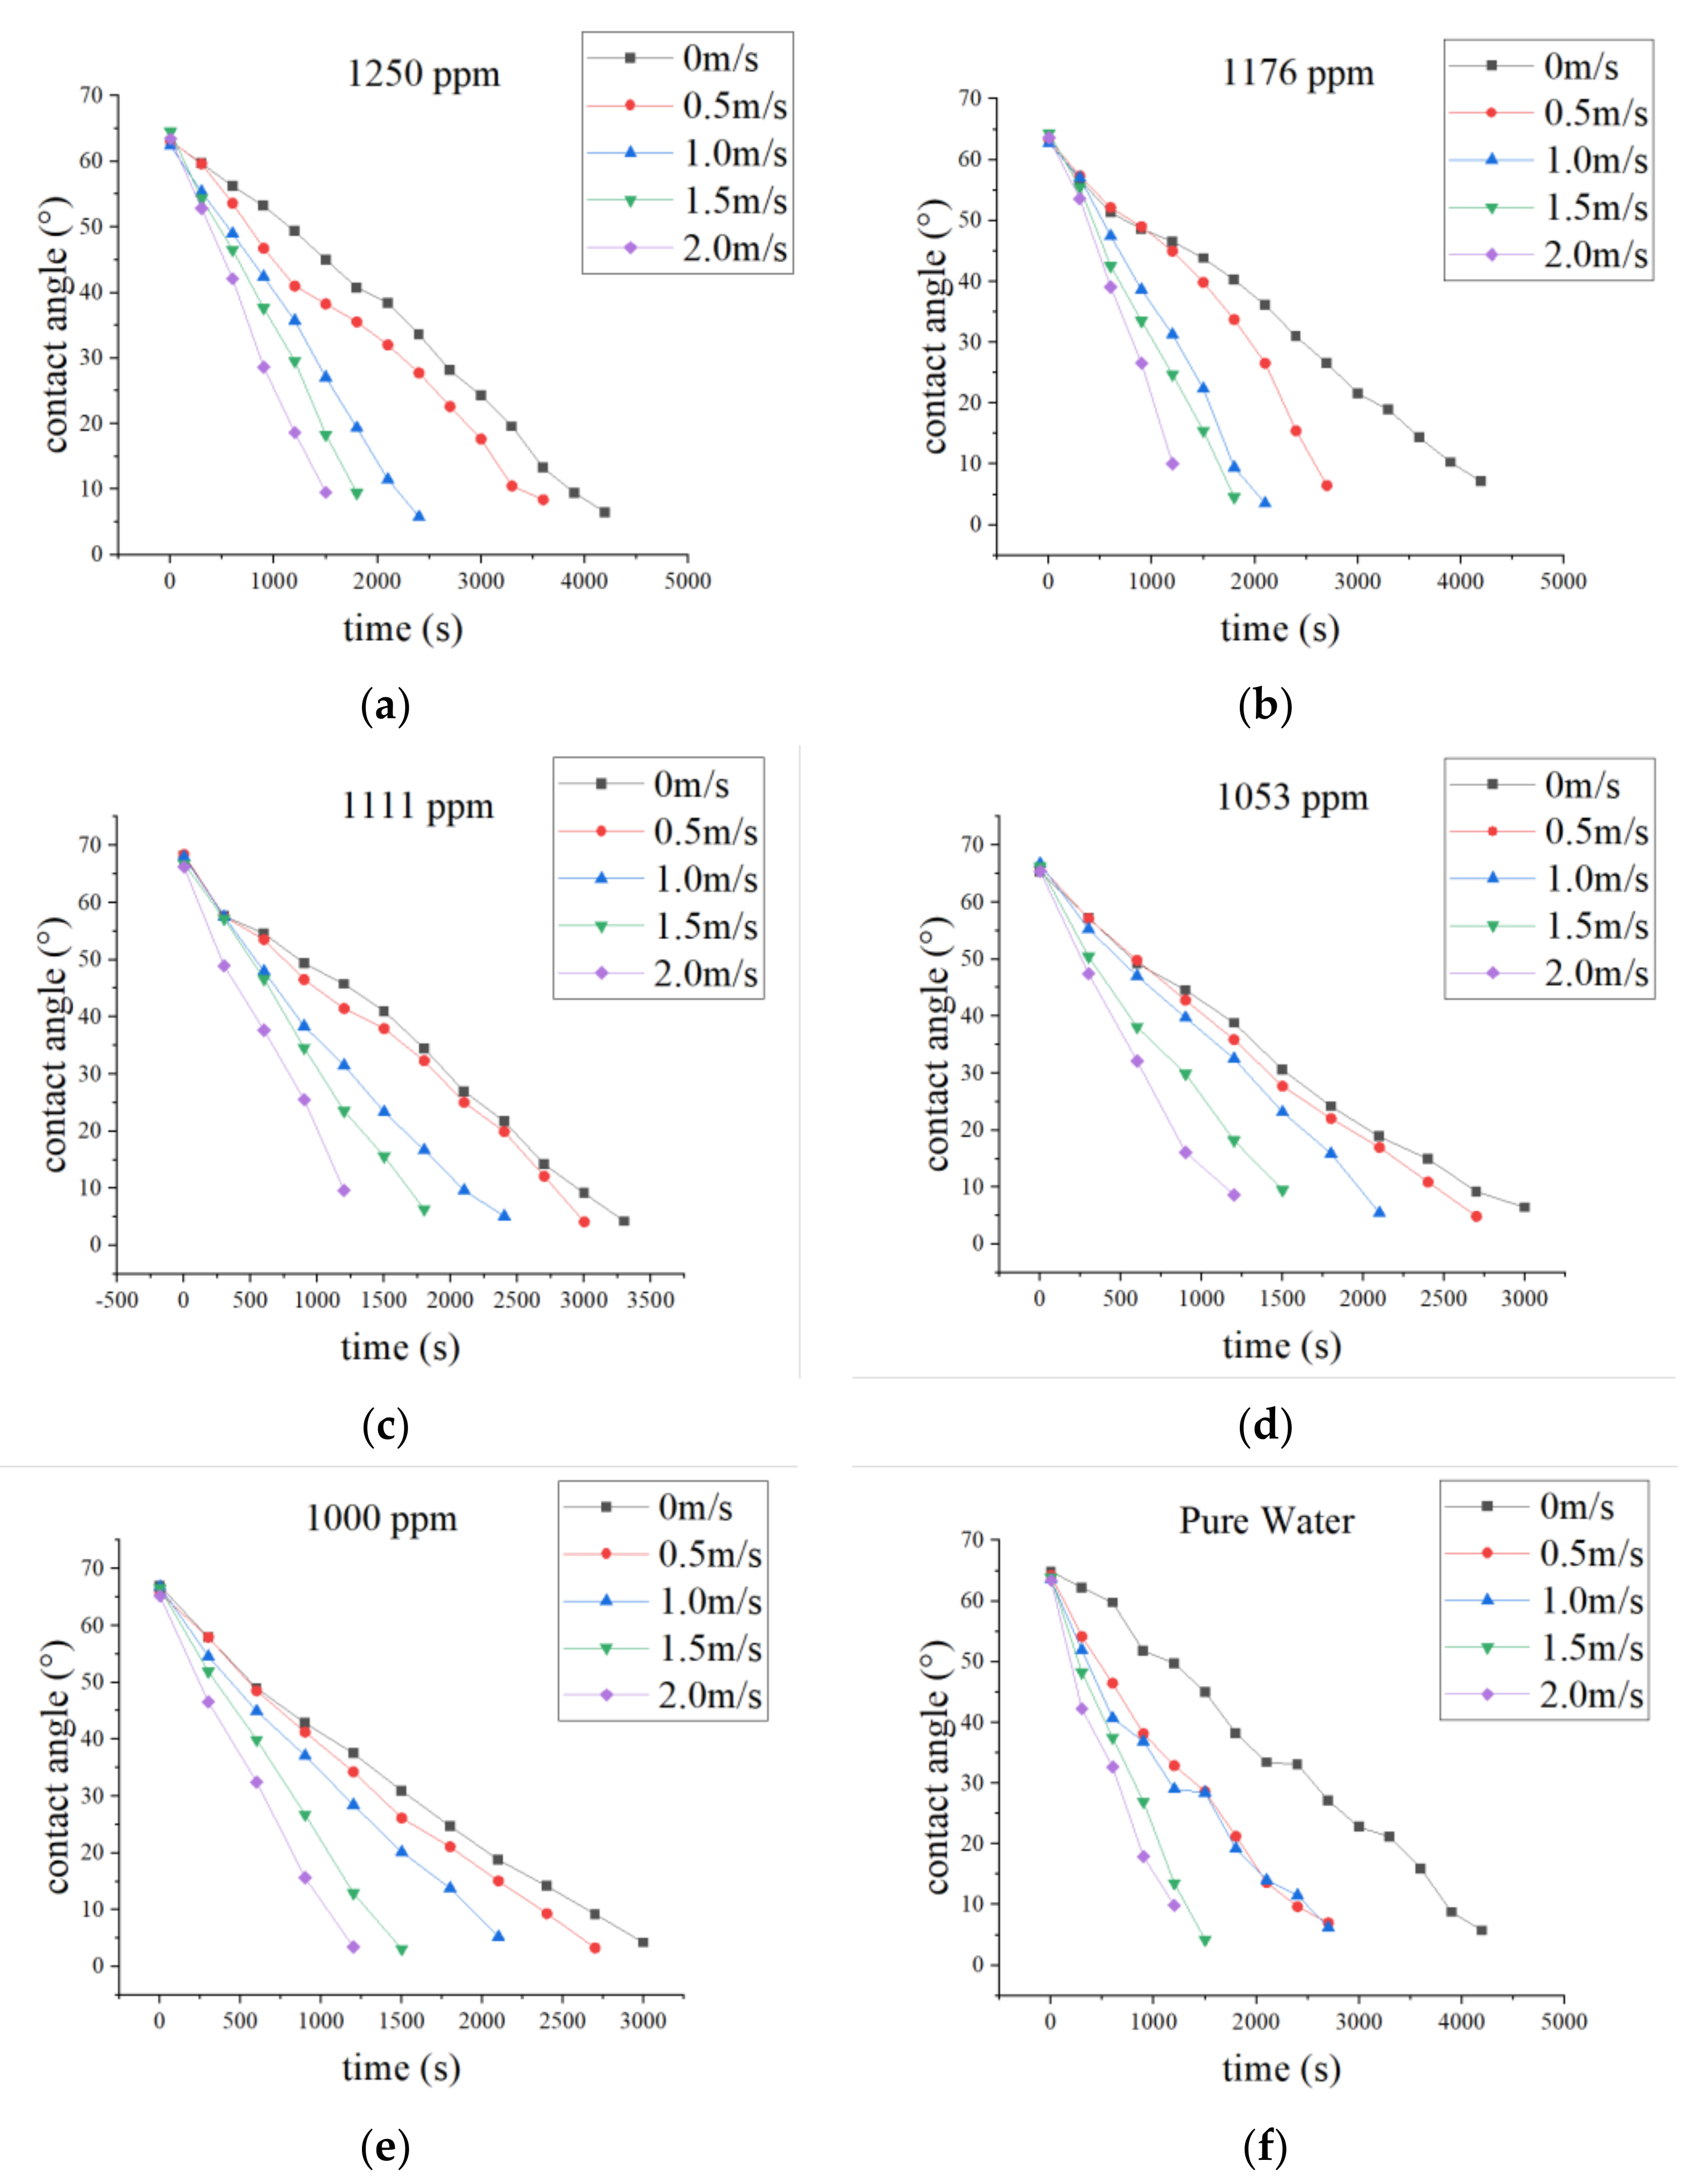
3.2.1. Contact Angle
Before the droplets wetted the surfaces, the droplet behavior was split into two stages. The first was the droplet spreading over the substrate, and the second was evaporation. In the first stage, the wetted time was short, and the dynamic droplet evaporation could be neglected. In the second stage, the spreading became negligible, and the deposition area was changed with the contact angle. The back contact angle influenced the wetted area and the equilibrium contact angle maintained it. Thus, this article only focused on the dynamic evaporation process. The initial contact angle of the pure water droplet on the peach leaf was found to be 64° ± 1°.
Figure 3 shows the effect of different wind forces on the contact angle of pure water and different concentrations of thiophanate-methyl solutions on a peach leaf. As shown in
Figure 3, all five curves of pure water droplets with different wind forces decreased with time, while the change rate increased monotonically with an increase in wind force.
Table 2 shows the initial contact angles of different concentrations of thiophanate-methyl solution droplets and pure water droplets on the surfaces of peach leaves. As the concentration of thiophanate-methyl changed, the initial contact angle of the droplet changed. This is because the surface tension of different concentrations of thiophanate-methyl solution is different. The contact angle of the 1111 ppm solution was the largest, and the surface tension was thus also the largest.
Figure 3 shows that the contact angle dynamic changing process of thiophanate-methyl droplets on the surface of peach leaves decreased from 65 degrees to 42 degrees. The process slowed down until the process end. The droplet evolution processes had different curves, and the slowing position was different. With an increase in concentration, the slowing position came earlier, and an increase in wind speed led to an inconspicuous change in the contact angle.
When the contact angle of the pure water droplet was 50°, the rate at which the contact angle changed began to slow down. The changing rate slowed down as the wind speed increased. In CCR mode, the change in contact angle needed to be accelerated to catch up with the volume change to maintain a constant evaporation rate [
26].
Xu et al. [
27] obtained the angular function formula of the contact angle during droplet evaporation based on Fick’s Law of Binary Diffusion:
According to the formulas, the contact angle of the CCR mode changed gently over time. In
Figure 4, when the wind speed was 0 m/s, the contact angle changing rate was consistent with the formula, because peach leaves are hydrophilic and have no hair. However, the evolution of the contact angle was inconsistent with the formula when the wind affected the droplet. This is because, in the evaporation process, due to the evolution of droplets, the contact surface between the droplets and air decreased, the vapor concentration gradient was outward, and the direction was the same as that of the diffusion flux. However, when different wind speeds occurred, the diffusion flux of the droplet increased, and the direction of the diffusion flux changed. There was a significantly deviation between the vapor concentration gradient and the formula simulation. When the wind speed changed, the vapor concentration gradient changed too, and the greater the wind speed, the greater the change in concentration gradient. In Xu’s research, the evaporation coefficient in the formula from Fick’s Law of Binary Diffusion was constant. However, when the droplets were exposed to wind, the evaporation coefficient became complex as it was influenced by wind speed, time, and droplets [
28].
3.2.2. Droplet Height
The evaporation time of the droplets changes with a change in wind speed and solution composition. The evaporation time of droplets is inversely proportional to its contact area [
29]. The larger the deposition area of droplets on the surface, the faster the evaporation speed of droplets. When the droplet volume is constant, the droplet height is inversely proportional to the droplet deposition area. Therefore, the droplet height is directly proportional to the evaporation time of the droplet. The greater the height of the droplet, the shorter the evaporation time of the droplet.
The initial height of different droplets is determined by factors such as substrate surface and liquid surface tension [
30]. The absorption of different concentrations of pesticide droplets on leaves is different.
The faster the wind speed, the quicker the heat exchange between droplets and the surrounding environment [
31], but this cannot change the absorption of pesticides by leaves. A smaller droplet height leads to a larger spreading area and a faster droplet evaporation process. On the other hand, a larger droplet spreading area can also improve the absorption of pesticides by leaves, accelerating the droplet evaporation process. However, the interconnection effect of the heat exchange of droplets on the leaf surface and the absorption of droplets by the leaf pores, and the evaporation of droplets is not clear and should be further studied in the future.
The wind speed is not the only factor influencing the evaporation process. Other factors might include the liquid–air interface, heat exchange rate, and absorption by leaves. This should be further studied in the future.
Figure 4 presents the variation in droplet height for different liquids with different wind forces on a peach leaves during the evaporation process.
Table 3 shows the average initial droplet height of thiophanate-methyl solutions with different concentrations. From
Figure 4, we can see that the different solution droplet heights at different wind speeds on peach leaves illustrates a linear decrease and the rate also significantly changes with different wind speeds. In the droplet evaporation process, the faster the wind speed, the smaller the change in the gradient of the curve. This is contrary to the droplet height. Because in the evaporation process, the mass transfer and heat transfer between droplets and air are accelerated due to the acceleration of wind speed. According to Fick’s Law, the liquid’s evaporation rate is determined by the concentration of water molecules in the surrounding air and the concentration at infinity. When the wind speed is faster, the liquid concentration in the air around the droplet is lower, which speeds up the mass transfer, and heat transfer. Therefore, faster wind speeds lead to a quicker change in droplet height.
Additionally, it was found that when the height was 80 μm, the decline rate decelerated until the process ended. Because the evaporation speed was constant, the height “waited for” the contact angle to maintain the volume.
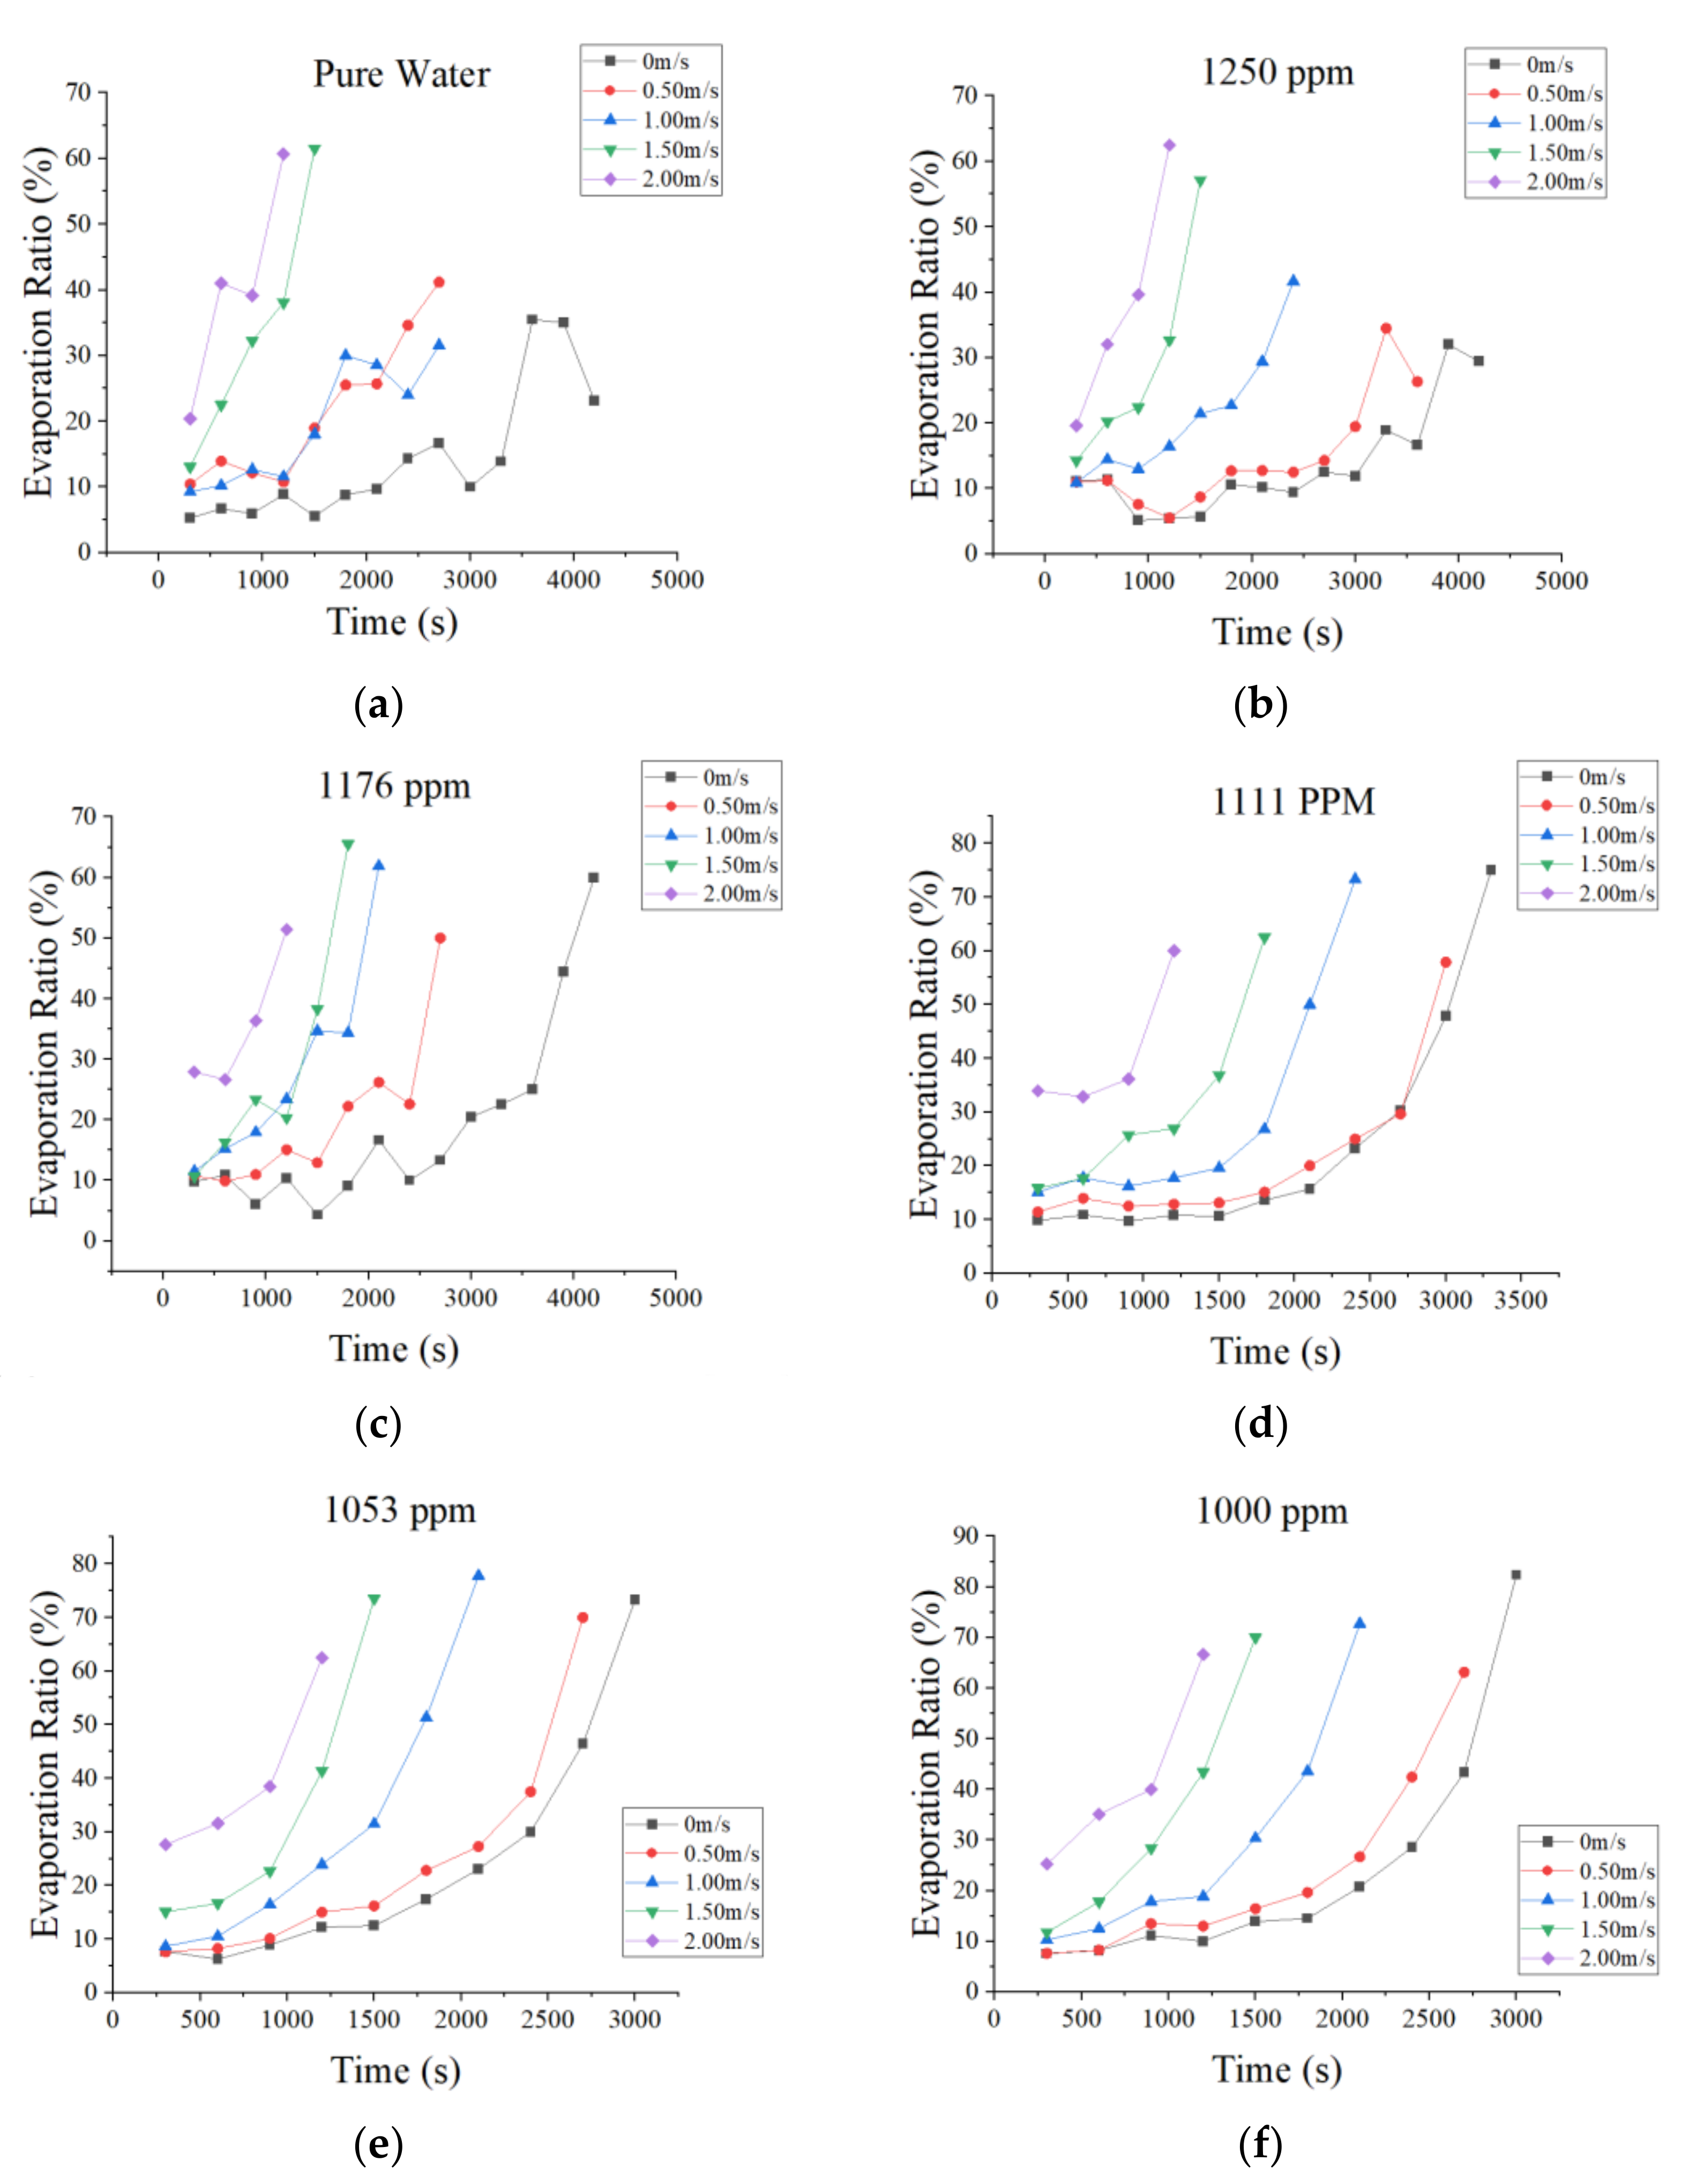
3.3. Dynamic Evaporation Rate
Birdi established the evaporation mathematical model for spherical droplets placed in open space according to Fick’s diffusion law [
32]. Rowen applied the model to droplets with a spherical cap and fixed geometries. The evaporation formula is as follows [
33]:
where
m is the mass of a droplet,
t is the evaporation time,
ρ is the density of the liquid,
V is the volume of the droplet,
D is the diffusion coefficient of the vapor,
c is the vapor concentration, and the integral of the concentration gradient (
∇c) is taken over the surface (d
S) of the spherical cap.
When the vapor diffusion around the droplet is ignored, the vapor concentrations at the droplet boundary (
c0) and the vapor diffusion far from the droplet (
c∞) are approximated to be constant, and the radially outward vapor concentration gradient across the droplet boundary can be described as [
27]:
where
Rs is the radius of curvature of the spherical cap droplet. Based on Equations (1) and (2), Rowan obtained:
where
λ = 2 π
D (
c∞ −
c0)/
ρ and h is the height of the spherical cap droplet.
In this way, the evaporation rate can be obtained via the following equation:
In this study, the dynamic evaporation ratio
(%) is used to evaluate evaporation, which is given by:
where
is evaporation quantity mm
3;
, and
are the droplet volume (mm
3) and diameter (μm) at
time, respectively; and
and
are the droplet volume (mm
3) and diameter (μm) at
time, respectively.
Figure 5 shows the evaporation rate of different liquids on peach leaves. The droplet evaporation rate increased with an increase in wind speed. When the wind speeds were faster, the evaporation rate was greater. When the evaporation process reached about half way, the evaporation rate curve tended to be flat and then continued to ascend. Different concentrations of thiophanate-methyl solutions were similar to pure water. For the 1111, 1053, and 1000 ppm thiophanate-methyl solutions, the maximum stage in the evaporation process was the last 300 s under any wind speed. This is because in the progress of evaporation, the volume of droplets in the final 300 s was the smallest, but the escape speed of the molecules from the droplet surface did not decrease. Therefore, the evaporation rate increased gradually with time.
Figure 6 shows the average evaporation rate of six different liquids under different wind speeds. In
Figure 6, the evaporation rate of droplets increased with the decrease in the concentration of thiophanate-methyl. When the concentration of thiophanate-methyl was 1250 ppm and 1176 ppm, the evaporation rate was lower than that of pure water droplets. When the concentration of thiophanate-methyl was 1111 ppm and the wind speed was 0 m/s, the evaporation rate was faster than for pure water. When wind was present, the average evaporation rate of thiophanate-methyl droplets was lower than that of pure water. When the wind speed was lower than 1.5 m/s, the evaporation rate of 1053 ppm and 1000 ppm thiophanate-methyl droplets is higher than for the pure water droplets. When the wind speed was greater than 1.5 m/s, the evaporation rate of pure water droplets was equal to that of 1053 ppm and 1000 ppm thiophanate-methyl droplets. When the wind speed reached 2.0 m/s, the evaporation rate of 1053 ppm droplets was equal to the average evaporation rate of pure water.
The evaporation rate of the 1250/1176/1111 ppm thiophanate-methyl solutions was significantly higher than that of pure water 300 s after dropping on the leaf surface. It increased with the decrease in thiophanate-methyl concentration. However, when the concentration of thiophanate-methyl solution exceeded 1111 ppm and reached 1053 and 1000 ppm, the evaporation rate increased. In the evaporation process, the higher the concentration of thiophanate-methyl solution, the greater the difference in the evaporation rate between it and pure water. From 1111 ppm, it accelerated with a decrease in concentration. Therefore, we know that a specific concentration of thiophanate-methyl solution can slow down the evaporation rate of droplets. When the concentration exceeded a particular value, the evaporation of thiophanate-methyl droplets will be shorted. Overall, the biggest enhancement in the evaporation ratio was 2.83 times, which appeared in the pure water and 1250 ppm thiophanate-methyl solution. The smallest wind enhancement in the evaporation ratio was 1.74 times for the 1111 ppm thiophanate-methyl solution.
4. Conclusions
The evaporation process of thiophanate-methyl is shorter than for pure water. In controlled conditions, RH and temperature are unchanged. Changing the wind speed flow to droplets would reduce the evaporation time. In this research, the time taken for pure water droplets at 0 m/s wind speed was 3.44 times more than that of 2.0 m/s. As the wind speeds increased, the evaporation rate became greater. The dynamic evaporation reduced with decreasing the concentration of thiophanate-methyl and increasing the wind speed. In addition, the relationship of the enhancements ratio with the wind speed and concentration of thiophanate-methyl solution shows it can be improved up to 2.83 times with different wind speeds.
In conclusion, the choice of the concentration of pesticides is essential for spraying applications at different wind speed conditions, particularly in orchard plant protection spraying. It can be inferred that a high concentration should be applied under a high wind speed to obtain a long evaporation process and improve the utilization of thiophanate-methyl. The evaporated composition of droplets is awaiting further research.