Article

Effect of White LED Light on the Growth of Apple Seedlings in Controlled Environment System

1
Department of Controlled Agriculture, Division of Future Agriculture Convergence, Kangwon National University, Chuncheon 24341, Korea
2
Plan T Farm Co., Ltd., Pyeongtaek 17706, Korea
3
UNI Plantech Co., Ltd., Kimje 54324, Korea
4
Department of Horticulture, Gyengnam National University of Science and Technology, Jinju 52725, Korea
*
Authors to whom correspondence should be addressed.
Horticulturae 2022, 8(8), 692; https://doi.org/10.3390/horticulturae8080692
Submission received: 24 January 2022 / Revised: 8 March 2022 / Accepted: 17 March 2022 / Published: 1 August 2022
(This article belongs to the Section Fruit Production Systems)

Abstract

:
Plant growth in a controlled environment system is highly dependent on the availability of light. The light-emitting diode (LED) is capable of providing the needed quality and quantity of light for the plant. The purpose of this study was to determine the effect of white LED light intensity on the growth of in vitro propagated apple (M-9) seedlings in a controlled environment system. Seedlings were grown for 30 days under five different white LED light intensities: 100–500 (L1), 250–500 (L2), 500–500 (L3), 250–250 (L4), and 100–100 (L5). Our findings indicate that seedlings treated with L3 grew substantially taller than seedlings treated with L1, L2, or L5. The number of leaves, stem diameter, shoot fresh weight, root fresh weight, and shoot dry weight of L3 treated seedlings were considerably greater than those growing in other treatments. Furthermore, root length, root dry weight, chlorophyll content, and photosynthesis rate were considerably increased in the L3 treatment group compared to the L5 treatment group. However, there was no significant difference in the stomatal conductance or transpiration rate of apple seedlings between the light treatments. Moreover, a positive correlation was seen between stomatal conductance and transpiration rate. These results suggest that light intensity PPFD 500-500 were favorable for the initial growth of in vitro propagated apple seedlings.

1. Introduction

Global warming caused by drastic climate change accompanied different abiotic stress conditions for plants [1]. It poses critical challenges for food security and sustainability [2]. At the same time, the population of the world coupled with the expansion in land use for residential and commercial purposes has led to the continual decline of agricultural farmland [3]. Furthermore, in 2050, around 60% of additional food production will need for globally [4]. Under such circumstances, farmers are now turning to new farming technology, controlled environment systems. A controlled environment system is a technology for plants grown in environmentally-controlled structures, such as greenhouses, growth chambers and high tunnels [5].
Apple is one of the most valuable fruit crops around the world. In the Korean horticulture industry, apple plays a significant role and it was estimated that around 33,600 ha of land of Korea were cultivated for apple production [6]. Hence, healthy seedlings are a primary requirement for profitable apple production [7]. Morphological traits in the seedling stage help to identify healthy and productive apple plants [8]. Tissue culture (in vitro) is an adequate technology for mass production of required quality seedlings [9]. Notably, in vitro propagated seedling’s proper acclimatization in ex vitro culture, by different environmental factors (temperature, light, humidity, etc.) is crucial to retain their further productivity [10]. Seedlings grown in a controlled environment are a preferable solution for ex vitro acclimatization.
Light is the primary environmental factor and source of energy, which greatly influences plant growth and development. Light intensity, photoperiod, and wavelength can affect the morphological and physiological response of a plant [11]. Furthermore, photosynthesis in a plant is regulated by its received light intensity [12]. Artificial lighting in the control environment system is expected to take advantage of crop production because it is unaffected by weather and it is possible to maintain the required unit for high yield. However, it is an expensive technology compared to traditional farming. High energy cost is associated with light supplementation and creates an obstacle for profitable production in a controlled environment system. On the other hand, LED light is a promising technology to improve light efficiency and help to replace traditionally used horticultural lighting (e.g., metal halide lamps and high-pressure sodium lamps). LEDs have distinct benefits including high photoelectric conversion efficiency [13]. In recent years, light emitting diodes (LEDs) have been proposed as a potential alternative light source for in vitro plant growth and development. Many studies use LEDs to support plant growth in controlled environment systems, such as plant tissue culture rooms and growth chambers [14,15,16].
Several pieces of research demonstrated the positive effect of LED light on the mineral element content in different plants [17,18,19,20,21]. In addition, some studies focused on plant cultivation under LEDs of blue (B) and red (R) light as they have the highest photon efficiency [22,23,24,25]. Particularly, maximum attention of LED light-related research in plant science, taken for leafy vegetables. However, the effects of LED light on the morphology and productivity of fruit-producing horticultural crops still need to be investigated. Furthermore, a research report about the effect of the intensity and color of the light-emitting diode on apple plant seedlings is still lacking.
The light intensity and spectrum are the main crucial triggers for plant growth and development [26]. Notably, as a monochromatic light source, the intensity and spectrum of LEDs are possible to adjust based on plant requirements. For this reason, growers need to upgrade their knowledge about suitable light conditions for cost-effective apple seedling production in a control environment system. Therefore, the objective of this study was to investigate the influence of white LED light intensity on the growth parameters at the initial stage of apple seedlings which were propagated by in vitro method.

2. Materials and Methods

2.1. Plant Material and Growth Conditions

This experiment was performed under controlled environment conditions in Kangwon National University, Chuncheon, South Korea (latitude, 37°48′ N, longitude, 127°52′ E) using in vitro propagated apple (M-9) seedlings. Seedlings were transplanted into a plug tray (every tray has 72 holes, hole size 5 cm depth and 4 cm width) containing an oasis block (sponge-like floral foam, length 2.5 cm, width 2.5 cm and height 3.0 cm) and acclimatized in a container (length 60 cm, width 40 cm and height 20 cm) filled with water and connected with an air pump (DK-9000, Dae-kwang electronics, Seoul, Korea). Acclimatization was carried out for 14 days under a controlled environment (temperature 25 ± 2 °C, light intensity 30 μmol·m−2·s−1, photoperiod 16 h/8 h and relative humidity was gradually decreased from 98% to 84%).

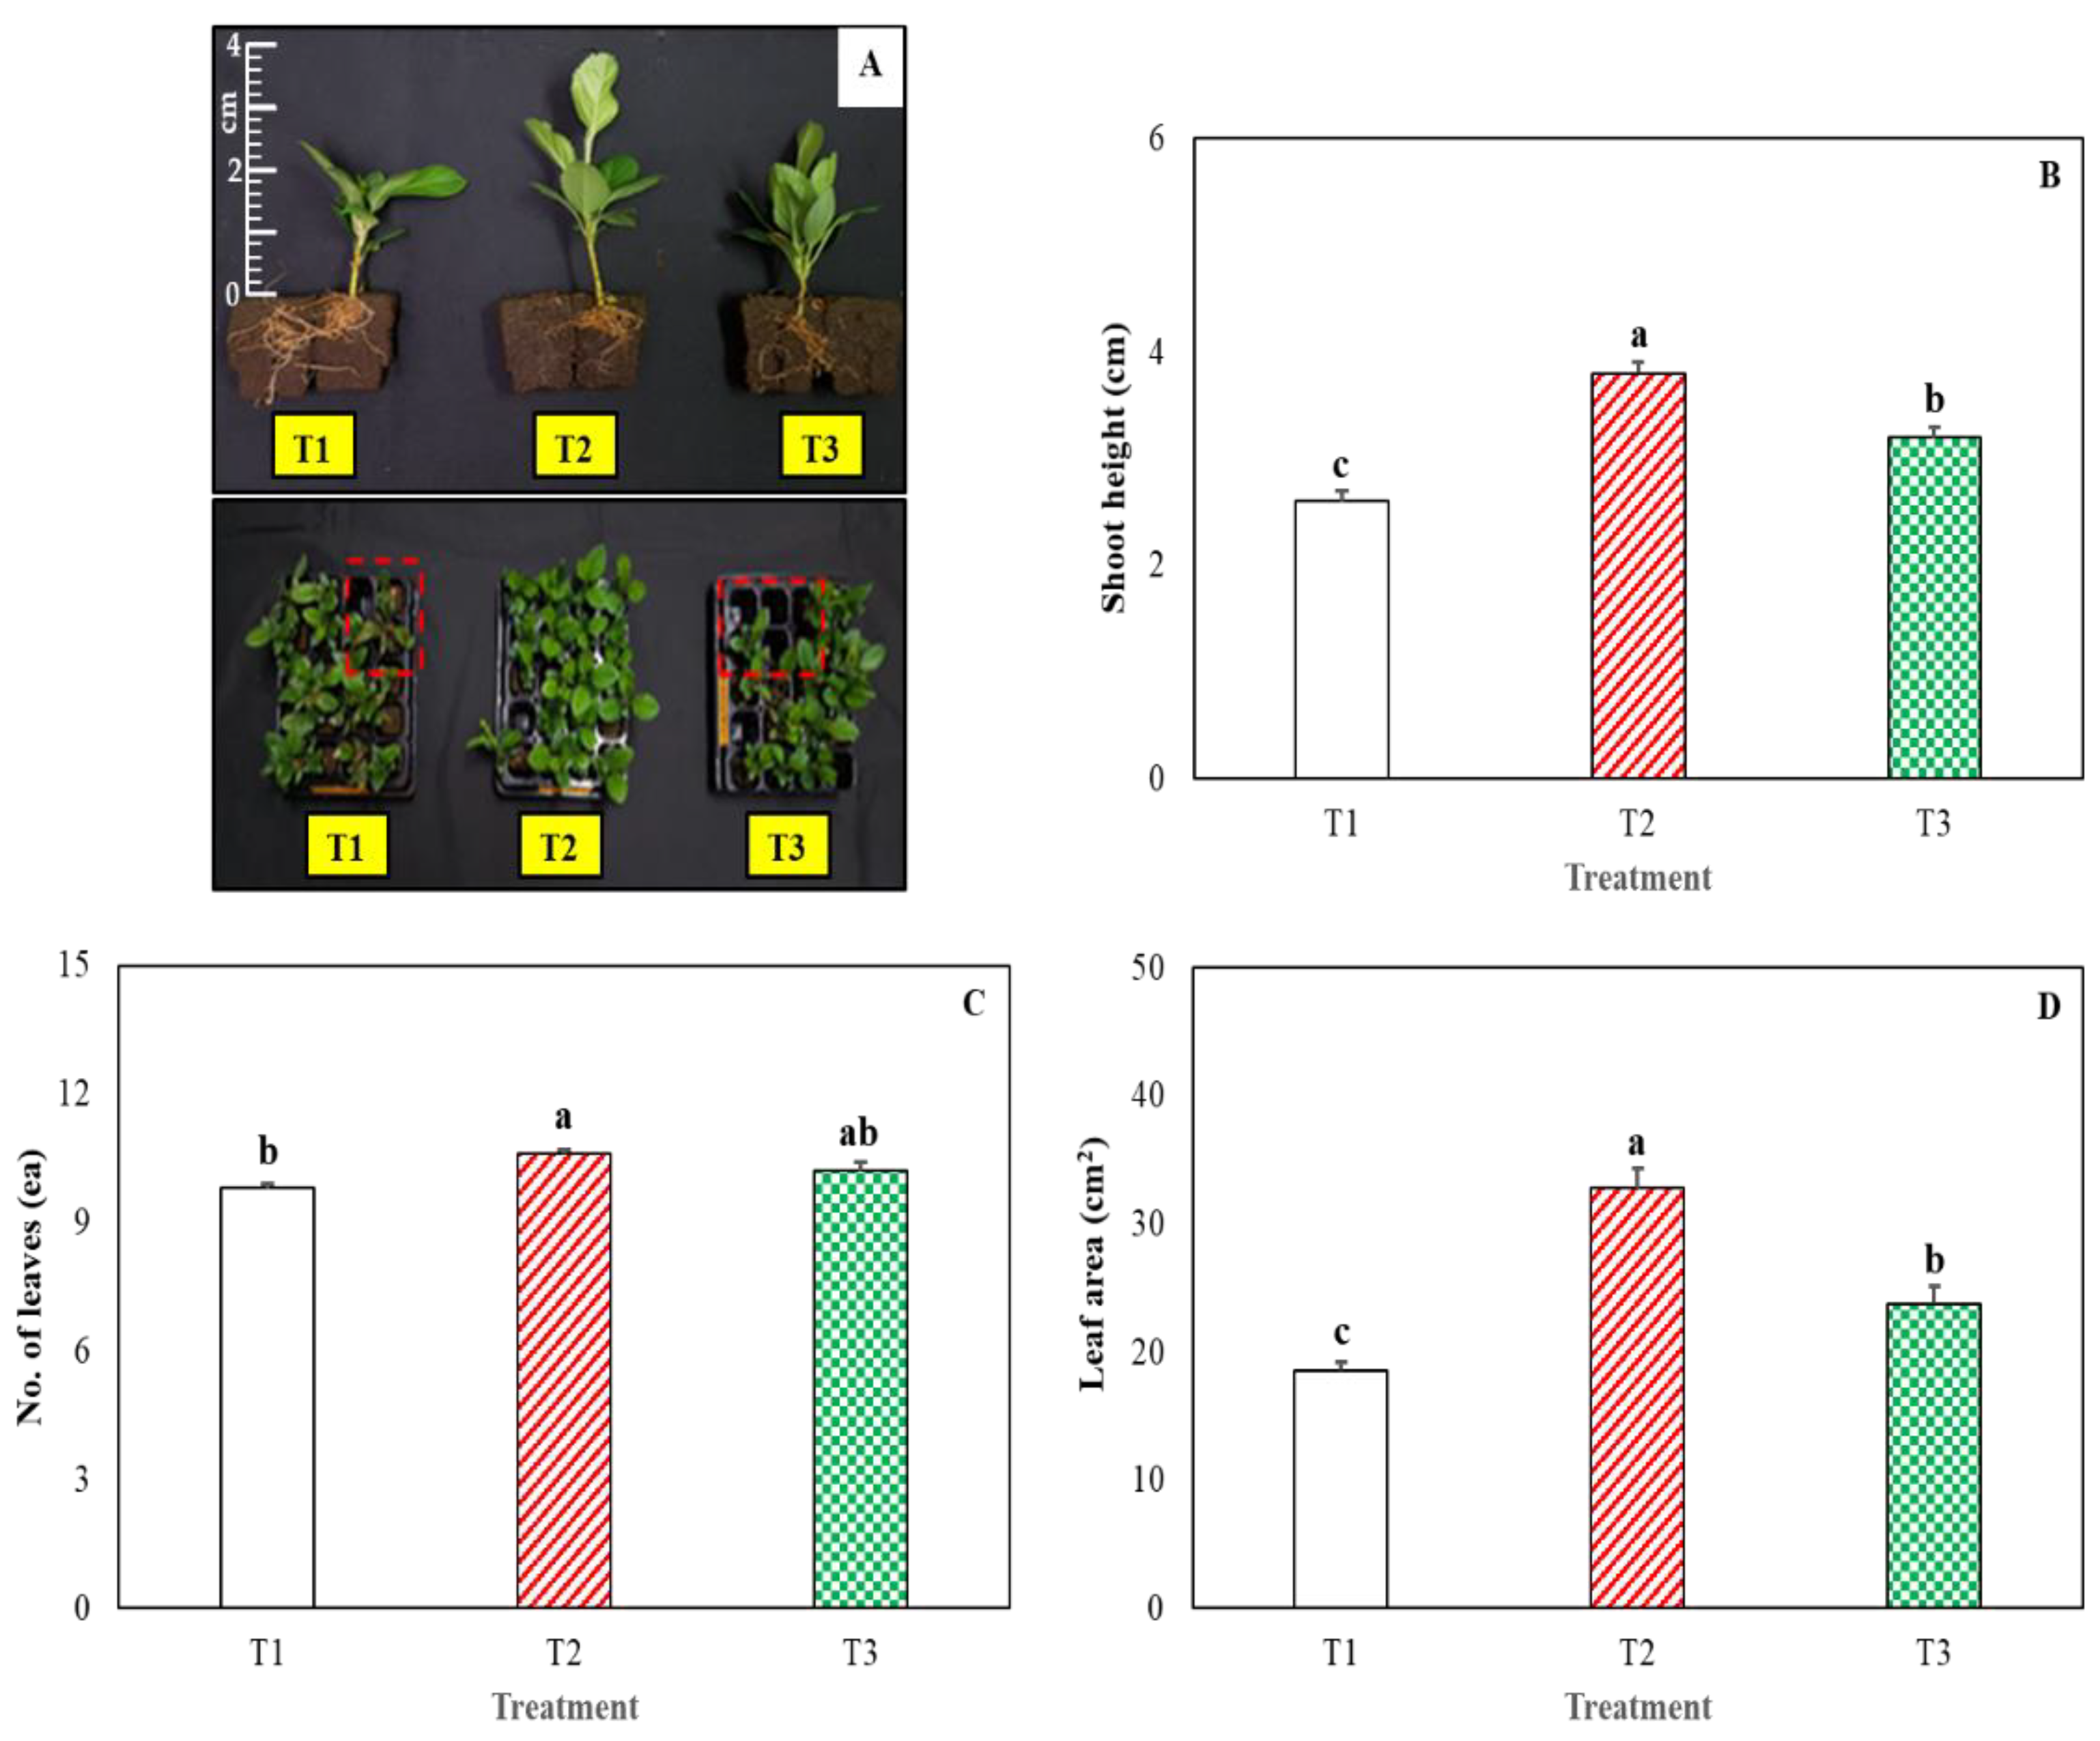
2.2. Preliminary Temperature Treatment

After 14 days of acclimatization, to find vigorous seedlings from their favorable growing temperature we conducted a preliminary temperature treatment. The unique size of 40 seedlings (each seedling having three leaves, shoot height 2 cm and stem diameter 1.4 mm) were transplanted into a growth chamber (SJ-503PH, Sejong Scientific Co. Ltd., Bucheon, Korea) for three different temperature treatments set as 18/18 °C, 23/18 °C and 30/18 °C for day/night (16 h/8 h photoperiod). Twenty seedlings were used in every treatment and the experiment was conducted twice. Light intensity and relative humidity of growth chamber were maintained 100 μmol·m−2·s−1 and 80 ± 5%, respectively. The electrical conductivity of a nutrient solution (Mg-Ca-K-P-N = 2.0-7.0-5.0-3.5-13.1 mEq·L−1, Aichi Prefecture, Japan) was 0.8 dS·m−1 and pH was 5.8 ± 0.2. The survival rate of seedlings was recorded and observed maximum in T2 treated seedlings at seven days after treatment (Table 1). At twenty days after treatment, the survival rate of T2 treated seedlings was higher than T3 treated seedlings.
Shoot height, the number of leaves and leaf area are important traits to identify a seedling’s vigor. At 20 days after temperature treatment, shoot height and leaf area were significantly higher in T2 treated seedlings compared to T1 and T3 treated seedlings (Figure 1). Leaf number was higher in T2 treated seedlings than T1 (Figure 1C). Other growth parameters, such as leaf length, leaf width, stem diameter, chlorophyll content, shoot fresh weight and root fresh weight were also measured (Table 2). All growth parameters cumulatively indicated T2 treated seedlings were more vigorous. For this reason, we selected seedlings grown in the T2 temperature for the final experiment (light treatment).

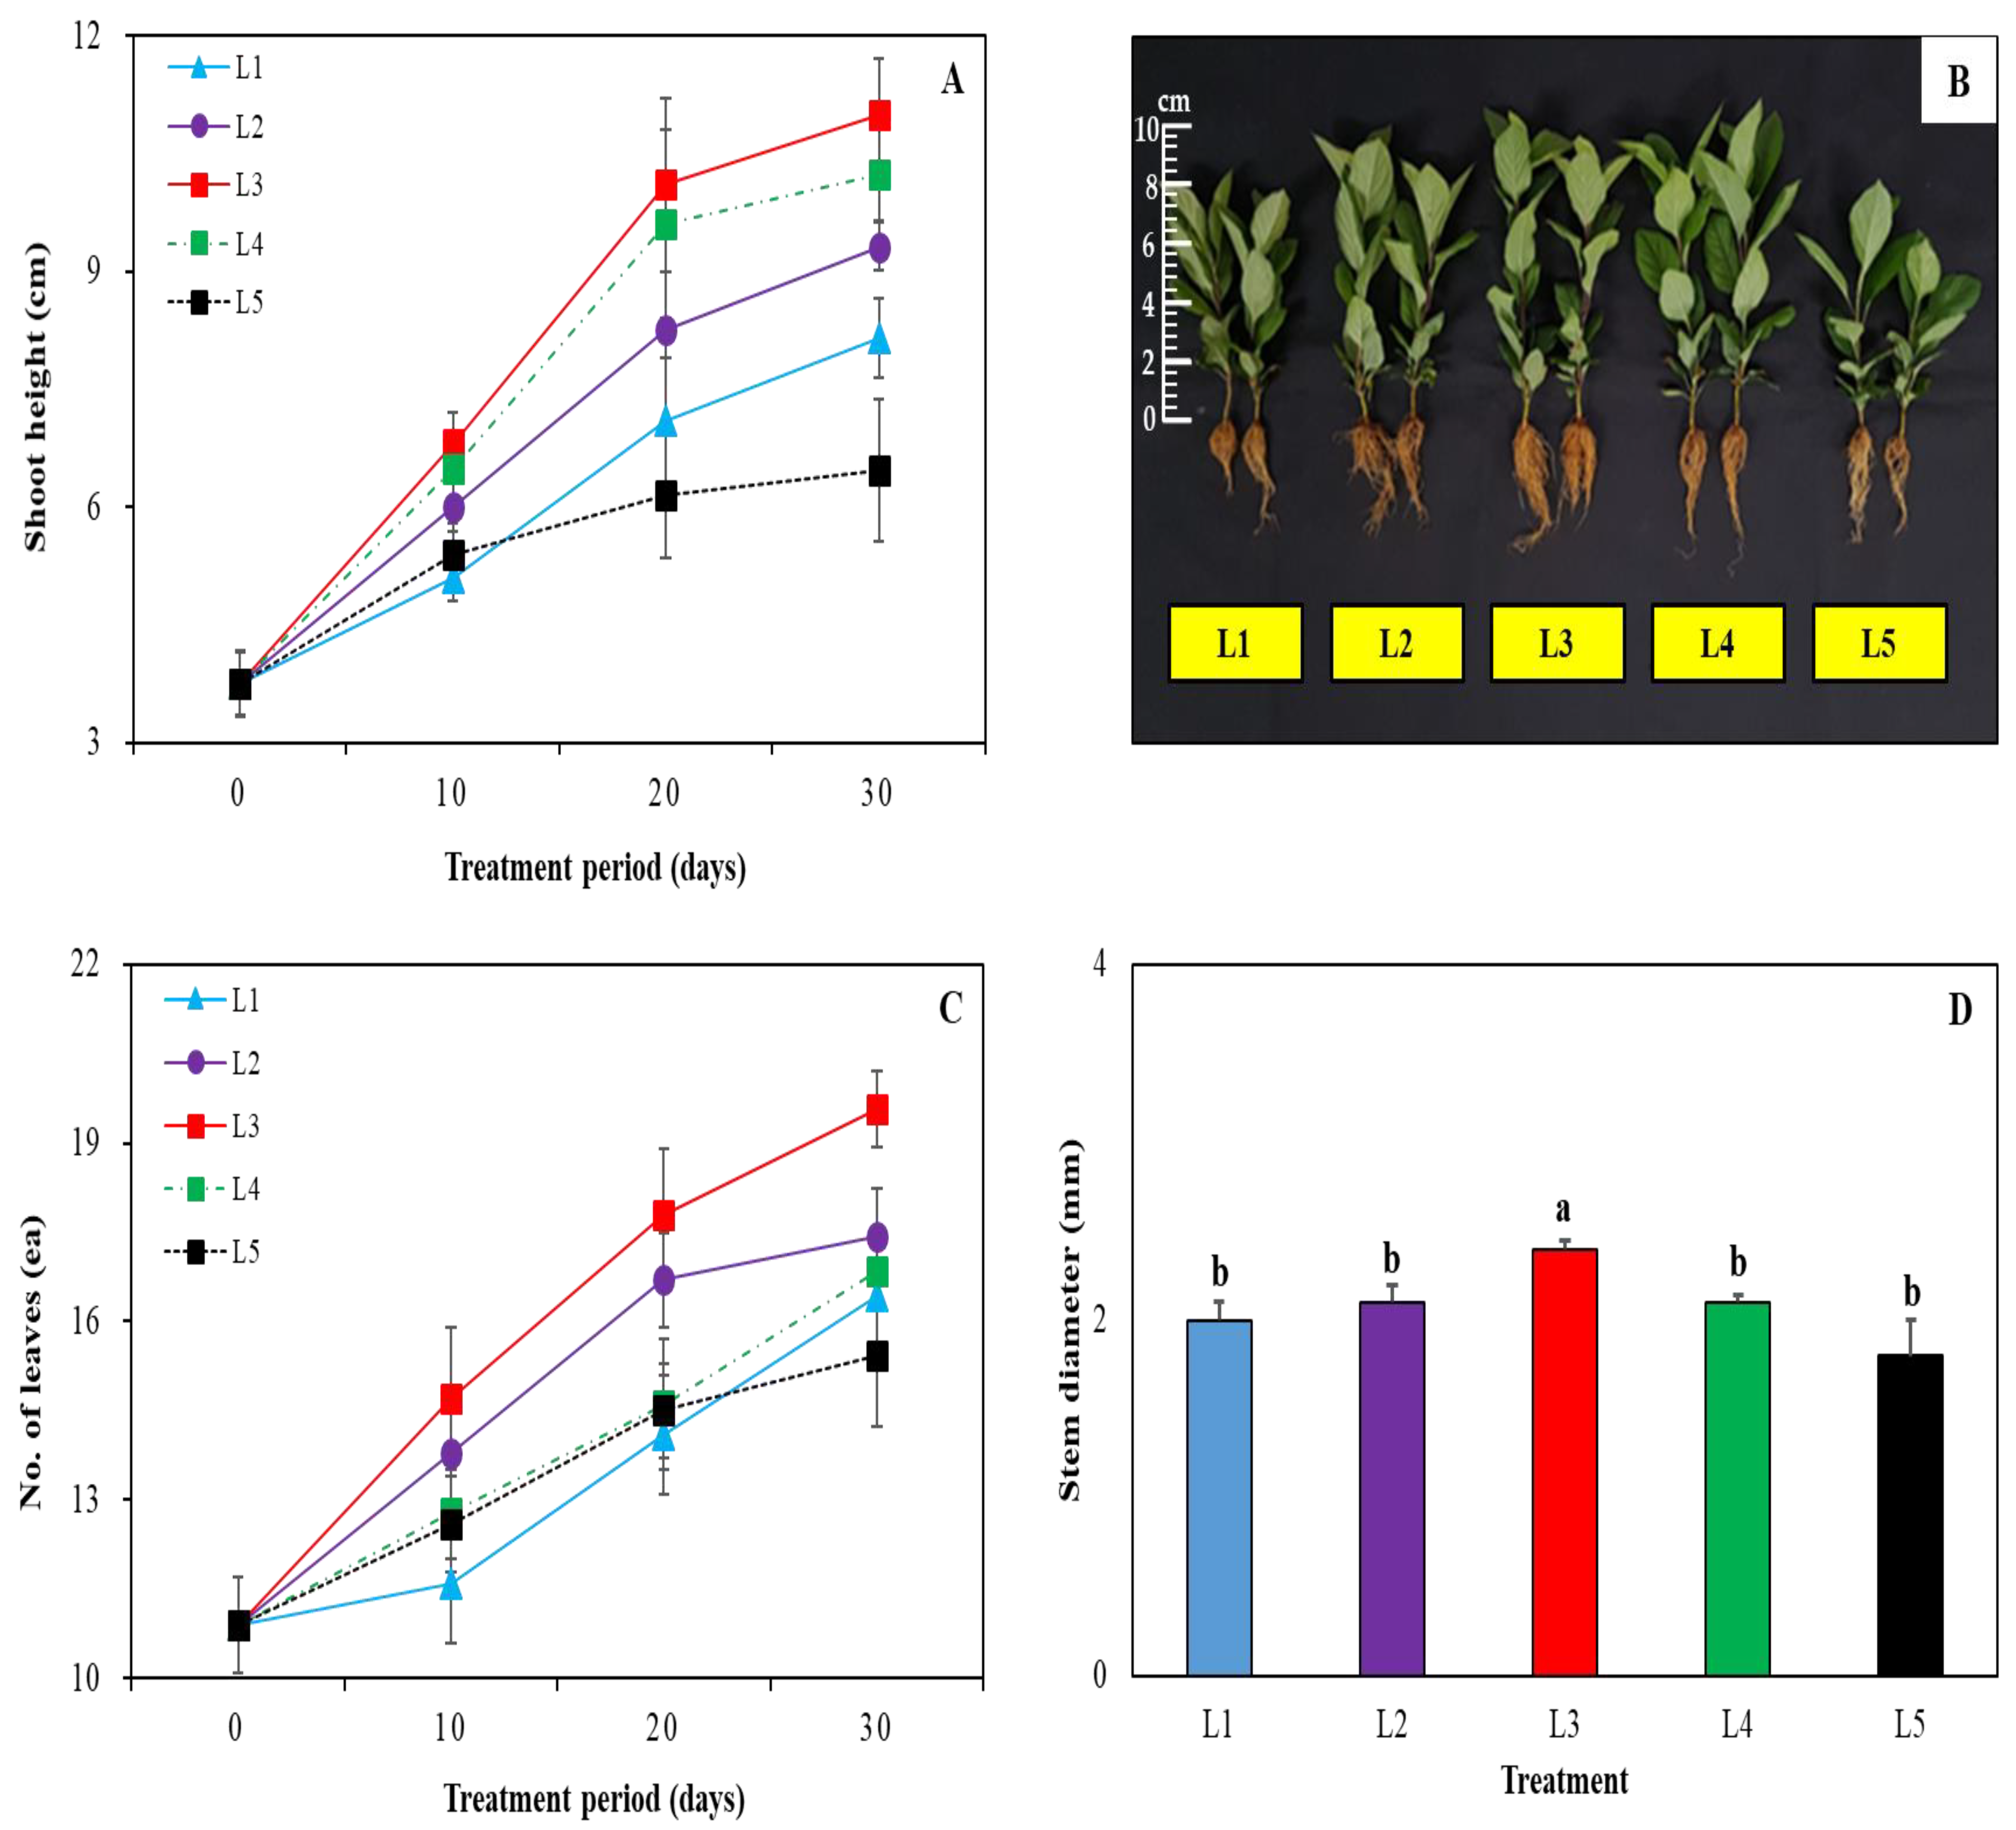
2.3. Treatment (Light Effect)

After 20 days of preliminary temperature treatment, unique size (approximately 10 leaves, shoot height 3.8 cm and stem diameter 1.7 mm) of healthy apple seedlings were selected and transplanted into plug tray (32 holes in a tray, hole size 5.5 cm depth and 5.5 cm width) filled with substrate media. Substrate media was made by mixing of peat moss (Berger BPP, 100% sphagnum peat moss, pH 5.4–6.2) and perlite (Newpershine, GFC Co., Chungnam, Korea) The ratio of peat moss: perlite was 9:1. For 30-days treatment, five different light intensities were maintained (Table 3). The bar type of white LED light (ZVAS, Sunghyun Hightech Co. Ltd., Hwaseong, Korea) was used and the photoperiod was set at 16 h/8 h for day/night periods. In this white LED, the spectral fraction (photon flux, µmol·m−2·s−1) of green, blue and red are 51.7%, 24.6%, and 21.4%, respectively [27]. Six white LEDs were fixed at 35 cm height from the plug tray. Light intensity was adjusted (length 45 cm × width 120 cm). The environment condition was controlled (temperature 25 ± 2 °C, relative humidity 60 ± 5%). Growth parameters and SPAD values were investigated at 10-day intervals. Photosynthesis rate was measured on the 30th day of treatment.

2.4. Measurement of Plant Growth Parameters

Shoot height of the plant was measured from the top of the growing media to the plant tip using a tape ruler. Stem diameter was measured in the base of the plant (1 cm above the growing medium) using a digital caliper (CD-20APX; Mitutoyo Corp., Kanagawa, Japan). The number of leaves was counted manually (except those less than 1 cm). Leaf length and leaf width (fully expanded leaf of a plant) were measured by a ruler. Chlorophyll meter SPAD-502 (Konica-Minolta, Osaka, Japan) was used for chlorophyll measurement. Photosynthesis rate, stomatal conductance and transpiration rate were measured by using a portable photosynthesis meter (LI-6400XT, LI-COR Inc., Lincoln, NE, USA). Photosynthesis rate was measured in a leaf chamber at 23 °C leaf temperature, 400 μmol·mol−1 CO2.
Plants were picked up from the plug tray then carefully cleaned by water to remove different materials and substrate medium. The shoot and root of the plant were separated for further investigation. A ruler was used for measuring root length. An electronic balance (CUW420HX, CAS corporation, Yangju, Korea) was used for measuring shoot fresh weight and root fresh weight. Dry weights of the shoots and roots were calculated after drying them in an oven (JEIO TECH OF-22GW, Daejeon, Korea) at 65 °C to a constant weight. Shoot dry weight and root dry weight were measured using an electronic balance.

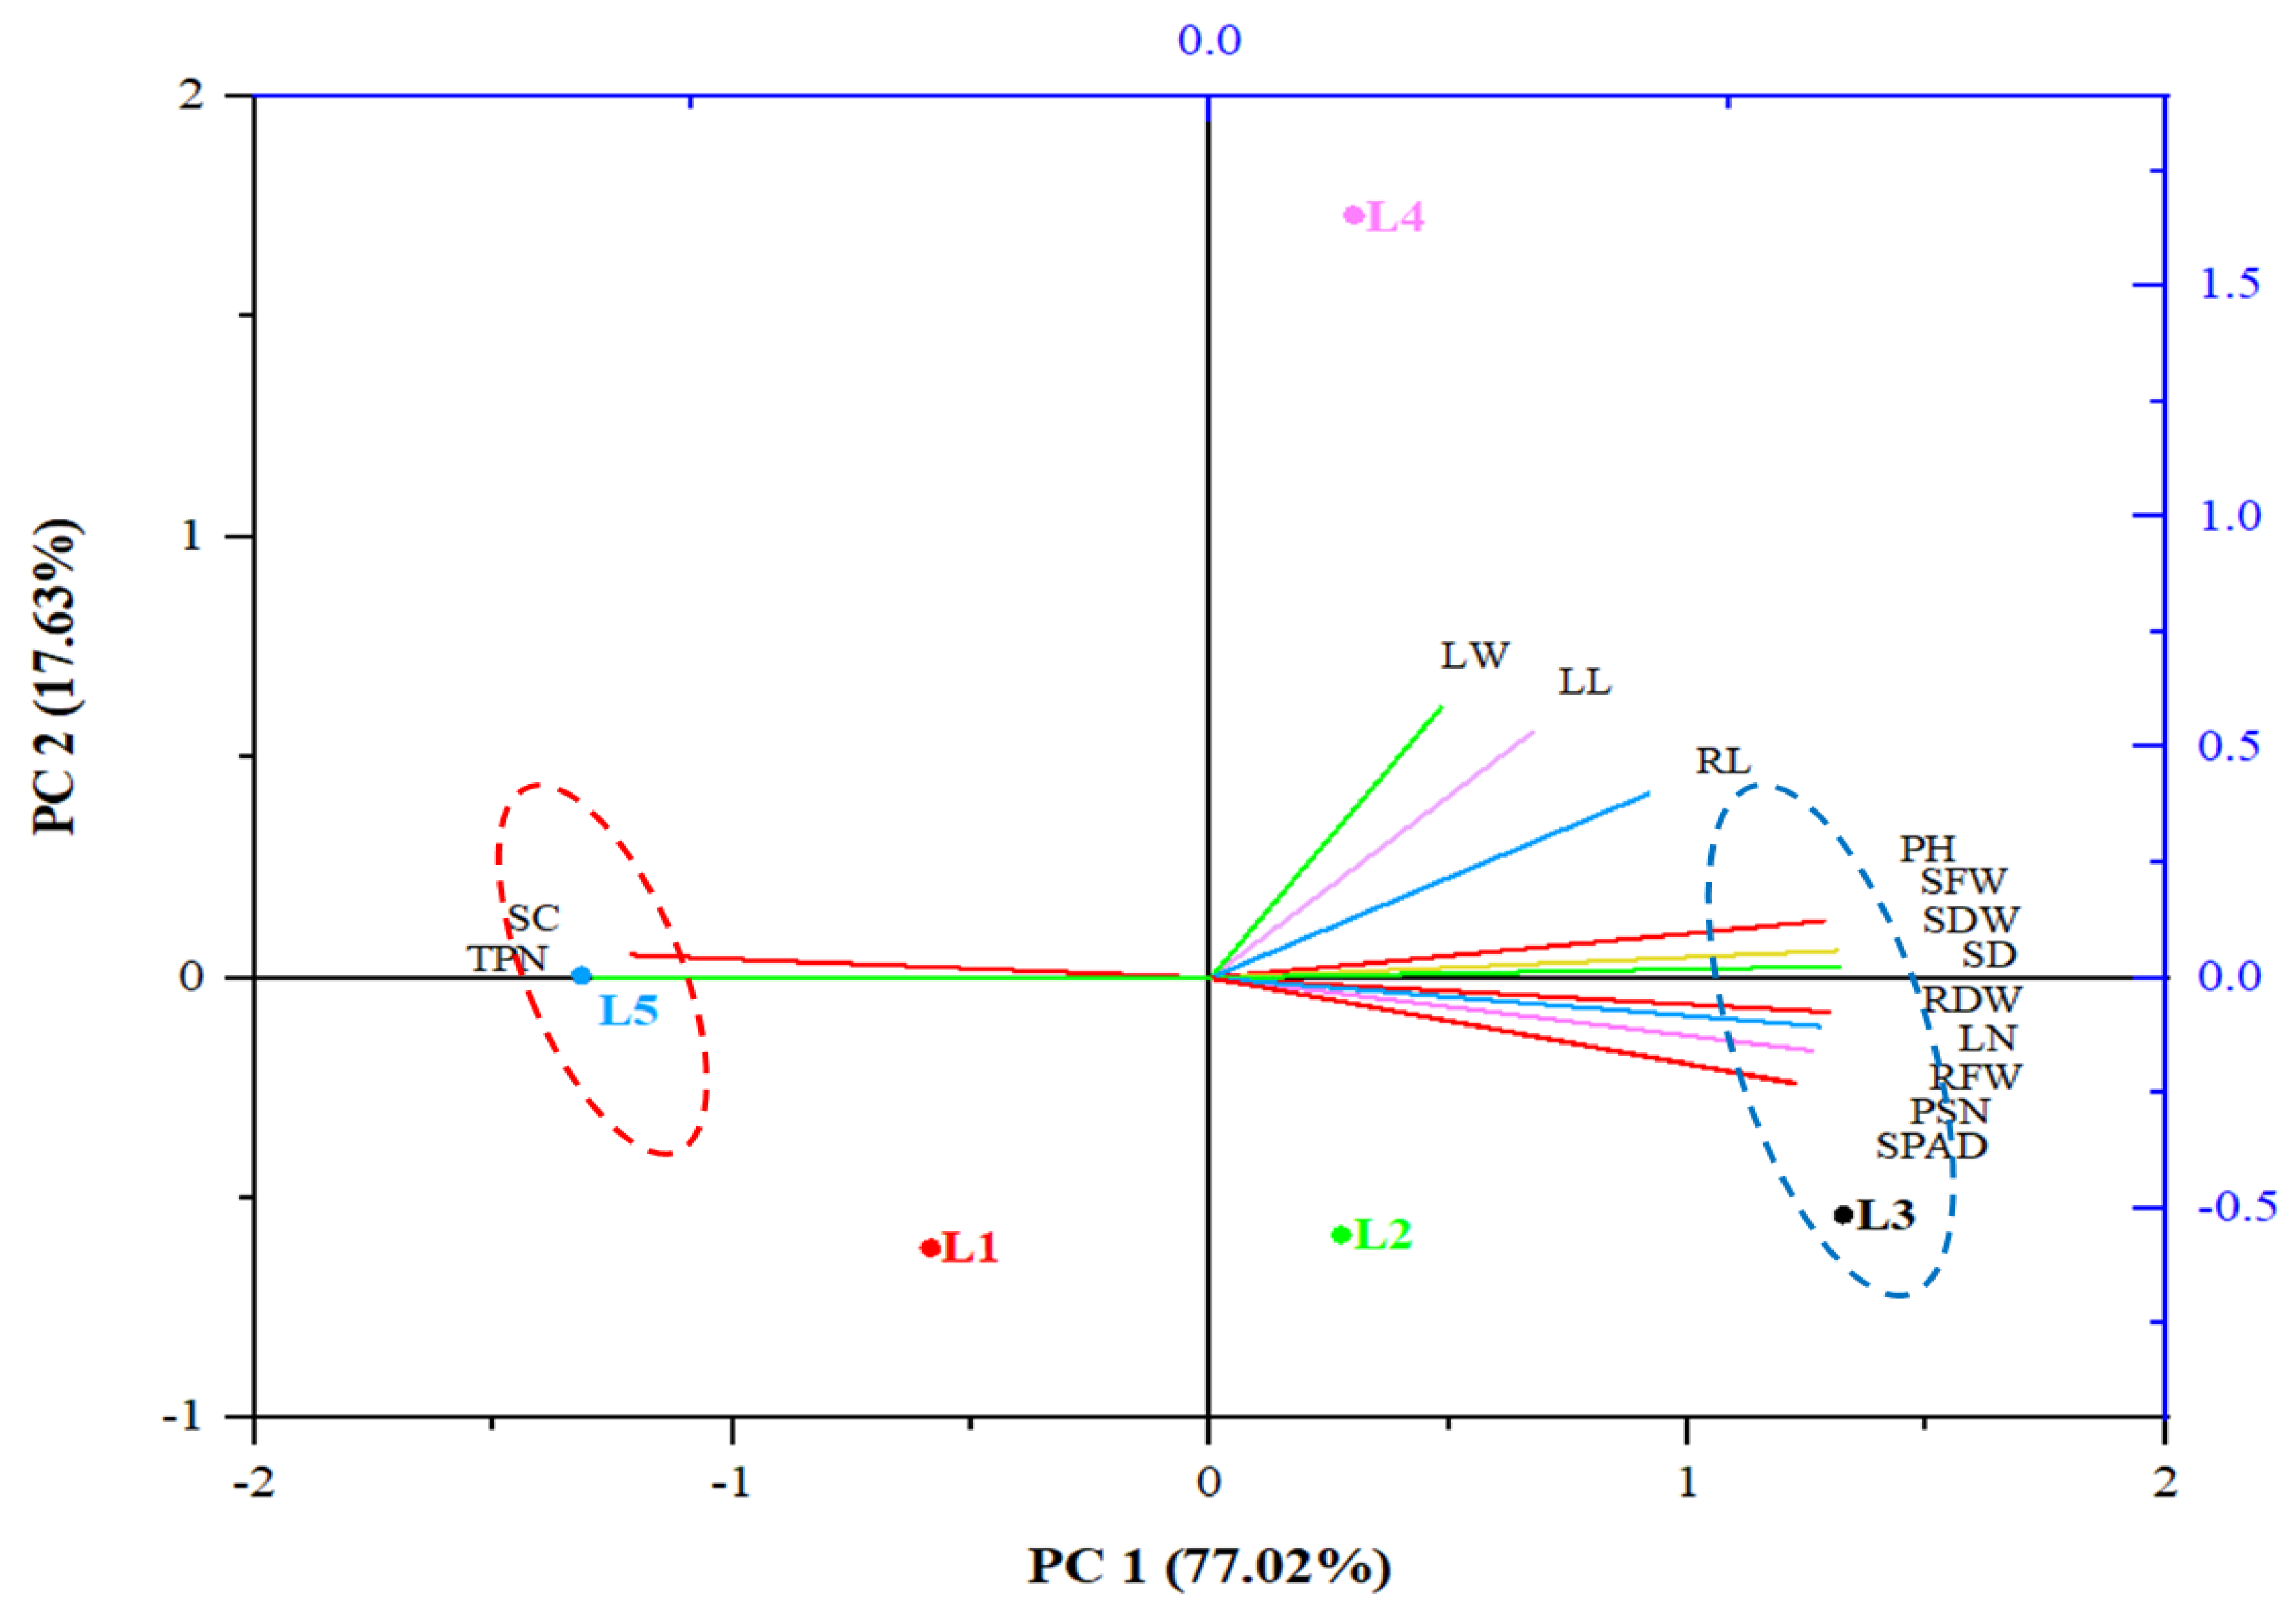
2.5. Statistical Analysis

The experiment was conducted in a completely randomized design with five single plant replicates per treatment. Effects of treatments were analyzed using the SAS program (Statistical analysis system, version 9.3, SAS Institute, Cary, NC, USA). Significant differences among the means were examined using ANOVA (Analysis of variance) followed by DMRT (Duncan’s Multiple Range Test) at a 5% level (p ≤ 0.05). OriginLab 10.0 software (Origin Lab, Northampton, MA, USA) was used for principal component analysis (PCA).

3. Results and Discussion

From 10 days of light treatment, shoot height was higher in L3 treated seedlings compared to L1 and L5 (Figure 2A). At 30 days after treatment, it was significantly 35%, 18% and 70% taller compared to L1, L2 and L5 treated seedlings, respectively (Figure 2A, B). Furthermore, from 20 days of treatment, the number of leaves was higher in the L3 treated seedlings than those grown in L1 and L5 treatments (Figure 2C). At 30 days after treatment, it was 27% significantly higher in L3 treated seedlings than L5 treated seedlings. Research about the apple seedling’s response under different light intensities (in white) is consistently inadequate. However, some researchers performed experiments to know the effect of light intensity on other horticultural plants. Kang et al. [28] showed that 35 days after treatment in a plant factory system, shoot height and number of leaves of lettuce were increased under high light intensity (290 μmol·m−2·s−1) than low light intensities (200, 230 and 260 μmol·m−2·s−1). Red firespike grown in greenhouse conditions showed shoot height and number of leaves was higher in high light intensity than 45% and 65% shaded conditions [29]. Robinson et al. [30] reported that the growth of apple plants in an orchard is higher when light availability is high. Rezazadeh et al. [29] reported height and leaf numbers of the plant increased under high light intensity due to receiving high irradiance in a 24 h cycle and resulting in more photosynthesis. Moreover, low light intensity inhibits plant growth by affecting gas exchange [31].
At 30 days after light treatment, leaf length was significantly higher in L4 treatment than others and not significantly different between L1, L2, L3 and L5 treatments (Table 4). Leaf width was not significantly different between the treatments. The stem diameter of a seedling is a general indicator of plant survival ability [32]. Earlier research in different plant seedlings, showed plants having larger stem diameters tend to better survival than plants having small stem diameters [33,34]. After 30 days of treatment, stem diameter was significantly 20%, 14%, 14% and 33% higher in L3 treated apple seedlings compared to those grown in L1, L2, L4 and L5 treatment, respectively (Figure 2D). Continuous high light intensity at the same range is the reason for the greater stem diameter in L3 treated apple seedlings than others. Fan et al. [35] reported, after 30 days of combined red and blue light treatment, the stem diameter of tomato seedlings was 5–20% higher in 450 μmol·m−2·s−1 compared to those grown in 50, 150, 200 and 300 μmol·m−2·s−1.
Light conditions influence the root growth of a plant by interfering in root-environment interaction including nutrient uptake [36]. At 30 days after light treatment root length of L3 treated apple seedlings was 16%, 9% and 10% higher than L1, L2 and L5 treated seedlings (Table 4). Increased shoot height and leaf number in L3 treated seedlings may be the reasons for higher growth in below-ground roots than others. Because shoot growth and root growth of a plant are interrelated. Durand et al. [37] showed balance source: sink ratio of a plant depends on its root growth, nutrient uptake and carbohydrate accumulation in leaves. Lactuca indica L. grown in 500 PPFD showed higher root length compared to 50 PPFD, 100 PPFD and 250 PPFD in 18-days treatment [38]. Furthermore, fresh weight of shoot and root, and dry weight of root were significantly greater in L3 treated plants than those grown under L1, L2, L4 and L5 treatments (Table 4). In addition, the root dry weight of seedlings was considerably higher in the L3 treatment compared to other treatments (except L2). Shoot fresh weight was lowest in L5 treated seedlings. It recommends, light intensity 100 PPFD is not suitable for the initial growth of apple seedlings. Xu et al. [39] reported, good root and shoot growth of plant indicate effective utilization of light wavelength by photosynthesis process.
The chlorophyll content of leaves is an indicator of the vigor of plants and is influenced by the light intensity [40]. After 30 days of treatment, chlorophyll content (SPAD) was significantly around 20% higher in L3 treated apple seedlings than those grown in L4 and L5 treatments (Table 5). The chlorophyll content is also considered for the photosynthetic capacity of a plant [41]. The photosynthesis rate of L3 treated seedlings was significantly higher than those grown in L4 and L5 treatments (Table 5). It was two times higher in L3 treated seedlings compared to those grown in L5 treatment. High leaf growth and chlorophyll content in L3 treated apple seedlings are the reasons for higher photosynthesis activity compared to other treatments. Martin et al. [42] reported that the photosynthesis rate of a plant greatly depends on its received light intensity. In addition, Weston et al. [43] reported, photosynthetic light acclimatization of a plant depends on its leaf morphology and physiology.
Stomatal conductance was not significantly different between the treatments (Table 5). Maybe the treatment period of 30 days and the small number of replicates (5) is not enough to show the significant variation of stomatal conductance of apple seedlings in these ranges of light intensities. Furthermore, the transpiration rate of apple seedlings was also not significant between the treatments (Table 5). Unaffected stomatal conductance in this experiment is the reason for the unaffected transpiration rate. Prado et al. [44] reported that the transpiration activity of plants greatly depends on their stomatal conductance.
The principal component analysis (PCA) was also implemented to uncover the correlation of the different growth parameters of apple seedlings with the different light treatments (Figure 3). From Figure 3 it is illustrated that PC1 indicates 77.02% variability and PC2 indicates 17.63% variability. This PCA biplot represents clear segregation into two clusters among the parameters. The graph indicates that shoot height, shoot fresh weight, stem diameter, leaf number, and root fresh weight was positively correlated and their response is closer to L3 treatment than others. Furthermore, from the graph, it was observed that there was a positive correlation between transpiration rate and stomatal conductance of apple seedlings. Our previous study about the influence of container size and substrate composition on the growth of apple seedlings showed that stomatal conductance and transpiration rate were positively correlated [45]. Other research also documented that the transpiration rate and stomatal conductance of plants have a positive correlation [46,47]. This hypothesis is supported by the present findings.

4. Conclusions

White LED light intensity 500–500 PPFD was favorable for the seedling stage of the apple plant. Comparatively, low light intensity delays plant growth and development. In addition, light intensity 100–100 PPFD was not preferable for apple seedlings. These findings improved our knowledge about white LED light intensity for the initial growth of apple seedlings propagated by an in vitro method, and it will be helpful for large-scale seedling production. In future research, we will investigate the effect of different colors of LED light on the biomolecular and hormonal responses in apple seedlings and take ten representative plants which help to overcome the limitation of comparison about a small number of replicates.

Author Contributions

K.Y.C. designed the experiment and supervised the study. J.K.K. did experimental works. Y.J.Y. and J.K.N. participate in data collection and data analysis. M.R.A.S. and S.J.P. drafted the manuscript. All authors have read and agreed to the published version of the manuscript.

Funding

Research fund was received from Advanced Production Technology Development Program (116053-03).

Data Availability Statement

Not applicable.

Acknowledgments

This research was supported by Korea Institute of Planning and Evaluation for Technology in Food, Agriculture, Forestry (IPET) through Technology Commercialization Support Program (821039-03).

Conflicts of Interest

No conflict of interest.

References

  1. Zandalinas, S.I.; Fritschi, F.B.; Mittler, R. Global warming, climate change, and environmental pollution: Recipe for a multifactorial stress combination disaster. Trends Plant Sci. 2021, 26, 588–599. [Google Scholar] [CrossRef]
  2. Anderson, J.T.; Song, B.H. Plant adaptation to climate change—Where are we? J. Syst. Evol. 2020, 58, 533–545. [Google Scholar] [CrossRef]
  3. Borrelli, P.; Robinson, D.A.; Panagos, P.; Lugato, E.; Yang, J.E.; Alewell, C.; Wuepper, D.; Montanarella, L.; Ballabio, C. Land use and climate change impacts on global soil erosion by water (2015–2070). Proc. Natl. Acad. Sci. USA 2020, 117, 21994–22001. [Google Scholar] [CrossRef]
  4. Alexandratos, N.; Bruinsma, J. World Agriculture Towards 2030/2050: The 2012 Revision. 2012. Available online: https://ageconsearch.umn.edu/record/288998 (accessed on 16 December 2021).
  5. Niu, G.; Masabni, J. Plant production in controlled environments. Horticulturae 2018, 4, 28. [Google Scholar] [CrossRef] [Green Version]
  6. Choi, S.; Hinkle, A.F. South Korea: 2017 Apple Report-Revised. Gain Report No. KS1733. 2017. Available online: https://www.fas.usda.gov/data/south-korea-2017-apple-report-revised (accessed on 23 November 2018).
  7. Yoon, T.M.; Kim, K.R.; Uhm, J.Y.; Byun, J.K. The extension results of the cultivation systems for dwarf apple trees and following tasks. In Proceedings of the 23rd Apple Festival for the Establishment of Dwarf Apple Orchards, North Kyungsang Province and Daegu Kyungbuk Apple Cooperative, Daegu, Korean, 21 December 2021; pp. 9–235. [Google Scholar]
  8. Hajnajari, H.; Chashnidel, B.; Vahdati, K.; Ebrahimi, M.; Nabipour, A.; Fallahi, E. Heritability of morphological traits in apple early-ripening full-sib and half-sib offspring and its potential use for assisted selection. HortScience 2012, 47, 328–333. [Google Scholar] [CrossRef]
  9. Merkle, S.A.; Nairn, C.J. Hardwood tree biotechnology. In Vitro Cell. Dev. Biol. Plant. 2005, 41, 602–619. [Google Scholar] [CrossRef]
  10. Chandra, S.; Bandopadhyay, R.; Kumar, V.; Chandra, R. Acclimatization of tissue cultured plantlets: From laboratory to land. Biotechnol. Lett. 2010, 32, 1199–1205. [Google Scholar] [CrossRef]
  11. Son, K.H.; Oh, M.M. Leaf shape, growth, and antioxidant phenolic compounds of two lettuce cultivars grown under various combinations of blue and red light-emitting diodes. HortScience 2013, 48, 988–995. [Google Scholar] [CrossRef]
  12. Slattery, R.A.; VanLoocke, A.; Bernacchi, C.J.; Zhu, X.G.; Ort, D.R. Photosynthesis, light use efficiency, and yield of reduced-chlorophyll soybean mutants in field conditions. Front. Plant Sci. 2017, 8, 549. [Google Scholar] [CrossRef] [PubMed] [Green Version]
  13. Bian, Z.; Jiang, N.; Grundy, S.; Lu, C. Uncovering LED light effects on plant growth: New angles and perspectives-LED light for improving plant growth, nutrition and energy-use efficiency. Acta Hortic. 2017, 1227, 491–498. [Google Scholar] [CrossRef] [Green Version]
  14. Yeh, N.; Chung, J.P. High-brightness LEDs—Energy efficient lighting sources and their potential in indoor plant cultivation. Renew. Sustain. Energy Rev. 2009, 13, 2175–2180. [Google Scholar] [CrossRef]
  15. Dutta Gupta, S.; Jatothu, B. Fundamentals and applications of light-emitting diodes (LEDs) in vitro plant growth and morphogenesis. Plant Biotechnol. Rep. 2013, 7, 211–220. [Google Scholar] [CrossRef]
  16. Manivannan, A.; Soundararajan, P.; Halimah, N.; Ko, C.H.; Jeong, B.R. Blue LED light enhances growth, phytochemical contents, and antioxidant enzyme activities of Rehmannia glutinosa cultured in vitro. Hortic. Environ. Biotechnol. 2015, 56, 105–113. [Google Scholar] [CrossRef]
  17. Shin, Y.-S.; Lee, M.-J.; Lee, E.-S.; Ahn, J.-H.; Do, H.-W.; Choi, D.-W.; Jeong, J.-D.; Lee, J.-E.; Kim, M.-K.; Park, J.-U.; et al. Effect of light emitting diodes treatment on growth and mineral contents of lettuce (Lactuca sativa L. ‘Chung Chi Ma’). Korean J. Org. Agric. 2013, 21, 659–668. [Google Scholar] [CrossRef]
  18. Kopsell, D.A.; Sams, C.E.; Barickman, T.C.; Morrow, R.C. Sprouting broccoli accumulate higher concentrations of nutritionally important metabolites under narrow-band light-emitting diode lighting. J. Am. Soc. Hortic. Sci. 2014, 139, 469–477. [Google Scholar] [CrossRef]
  19. Choi, M.-K.; Chang, M.-S.; Eom, S.-H.; Min, K.-S.; Kang, M.-H. Physicochemical composition of buckwheat microgreens grown under different light conditions. J. Korean Soc. Food Sci. Nutr. 2015, 44, 709–715. [Google Scholar] [CrossRef]
  20. Gerovac, J.R.; Craver, J.K.; Boldt, J.K.; Lopez, R.G. Light intensity and quality from sole-source light emitting diodes impact growth, morphology, and nutrient content of Brassica microgreens. HortScience 2016, 51, 497–503. [Google Scholar] [CrossRef] [Green Version]
  21. Sams, C.; Kopsell, D.; Morrow, R. Light quality impacts on growth, flowering, mineral uptake and petal pigmentation of marigold. Acta Hortic. 2016, 1134, 139–146. [Google Scholar] [CrossRef]
  22. Kopsell, D.A.; Sams, C.E. Increases in shoot tissue pigments, glucosinolates, and mineral elements in sprouting broccoli after exposure to short-duration blue light from light emitting diodes. J. Am. Soc. Hortic. Sci. 2013, 138, 31–37. [Google Scholar] [CrossRef] [Green Version]
  23. Xu, Y.; Liang, Y.; Yang, M. Effects of composite LED light on root growth and antioxidant capacity of Cunninghamia lanceolata tissue culture seedlings. Sci. Rep. 2019, 9, 9766. [Google Scholar] [CrossRef]
  24. Brazaitytė, A.; Miliauskienė, J.; Vaštakaitė-Kairienė, V.; Sutulienė, R.; Laužikė, K.; Duchovskis, P.; Małek, S. Effect of different ratios of blue and red LED light on brassicaceae microgreens under a controlled environment. Plants 2021, 10, 801. [Google Scholar] [CrossRef]
  25. Islam, M.; Ryu, B.R.; Azad, M.; Kalam, O.; Rahman, M.; Rana, M.; Kang, C.W.; Lim, J.D.; Lim, Y.S. Comparative growth, photosynthetic pigments, and osmolytes analysis of hemp (Cannabis sativa L.) seedlings under an aeroponics system with different LED light sources. Horticulturae 2021, 7, 239. [Google Scholar] [CrossRef]
  26. Azad, M.O.K.; Kjaer, K.H.; Adnan, M.; Naznin, M.T.; Lim, J.D.; Sung, I.J.; Park, C.H.; Lim, Y.S. The evaluation of growth performance, photosynthetic capacity, and primary and secondary metabolite content of leaf lettuce grown under limited irradiation of blue and red LED light in an urban plant factory. Agriculture 2020, 10, 28. [Google Scholar] [CrossRef] [Green Version]
  27. So, E.H.; An, J.H.; Kim, J.K.; Yoon, Y.J.; Park, S.J.; Na, J.K.; Choi, K.Y. Effect of artificial light sources on the growth of apple rootstock m.9 seedling. Prot. Hort. Plant Fac. 2018, 27, 341–348. [Google Scholar] [CrossRef]
  28. Kang, J.H.; KrishnaKumar, S.; Atulba, S.L.S.; Jeong, B.R.; Hwang, S.J. Light intensity and photoperiod influence the growth and development of hydroponically grown leaf lettuce in a closed-type plant factory system. Hortic. Environ. Biotechnol. 2013, 54, 501–509. [Google Scholar] [CrossRef]
  29. Rezazadeh, A.; Harkess, R.L.; Telmadarrehei, T. The effect of light intensity and temperature on flowering and morphology of potted red firespike. Horticulturae 2018, 4, 36. [Google Scholar] [CrossRef] [Green Version]
  30. Robinson, T.; Hoying, S.; Sazo, M.M.; DeMarree, A.; Dominguez, L. A vision for apple orchard systems of the future. N. Y. Fruit Quar. 2013, 21, 11–16. [Google Scholar]
  31. Zavala, J.A.; Ravetta, D.A. Allocation of photoassimilates to biomass, resin and carbohydrates in Grindelia chiloensis as affected by light intensity. Field Crops Res. 2001, 69, 143–149. [Google Scholar] [CrossRef]
  32. Grossnickle, S.C. Why seedlings survive: Influence of plant attributes. New For. 2012, 43, 711–738. [Google Scholar] [CrossRef]
  33. Rose, R.; Ketchum, J.S. Interaction of initial seedling diameter, fertilization and weed control on douglas-fir growth over the first four years after planting. Ann. For. Sci. 2003, 60, 625–635. [Google Scholar] [CrossRef] [Green Version]
  34. Morrissey, R.C.; Jacobs, D.F.; Davis, A.S.; Rathfon, R.A. Survival and competitiveness of quercus rubra regeneration associated with planting stocktype and harvest opening intensity. New For. 2010, 40, 273–287. [Google Scholar] [CrossRef]
  35. Fan, X.X.; Xu, Z.G.; Liu, X.Y.; Tang, C.M.; Wang, L.W.; Han, X.L. Effects of light intensity on the growth and leaf development of young tomato plants grown under a combination of red and blue light. Sci. Hortic. 2013, 153, 50–55. [Google Scholar] [CrossRef]
  36. Gelderen, K.V.; Kang, C.; Pierik, R. Light signaling, root development, and plasticity. Plant Physiol. 2018, 176, 1049–1060. [Google Scholar] [CrossRef] [Green Version]
  37. Durand, M.; Mainson, D.; Porcheron, B.; Maurousset, L.; Lemoine, R.; Pourtau, N. Carbon source–sink relationship in Arabidopsis thaliana: The role of sucrose transporters. Planta 2018, 247, 587–611. [Google Scholar] [CrossRef] [Green Version]
  38. Kim, J.K.; Kang, H.M.; Na, J.K.; Choi, K.Y. Changes in growth characteristics and functional components of Lactuca indica L. ‘sunhyang’ baby leaf vegetable by light Intensity and cultivation period. Hortic. Sci. Technol. 2019, 5, 579–588. [Google Scholar]
  39. Xu, Y.; Yang, M.; Cheng, F.; Liu, S.; Liang, Y. Effects of LED photoperiods and light qualities on in vitro growth and chlorophyll fluorescence of Cunninghamia lanceolata. BMC Plant Biol. 2020, 20, 269. [Google Scholar] [CrossRef]
  40. Ciganda, V.S.; Gitelson, A.A.; Schepers, J. How deep does a remote sensor sense? Expression of chlorophyll content in a maize canopy. Remote Sens. Environ. 2012, 126, 240–247. [Google Scholar] [CrossRef]
  41. Martin, M.; Noarbe, D.M.; Serrot, P.H.; Sabater, B. The rise of the photosynthetic rate when light intensity increases is delayed in ndh gene-defective tobacco at high but not at low CO2 concentrations. Front. Plant Sci. 2015, 6, 34. [Google Scholar] [CrossRef] [Green Version]
  42. Weston, E.; Thorogood, K.; Vinti, G.; López-Juez, E. Light quantity controls leaf-cell and chloroplast development in Arabidopsis thaliana wild type and blue-light-perception mutants. Planta 2000, 211, 807–815. [Google Scholar] [CrossRef]
  43. Li, Y.; He, N.; Hou, J.; Xu, L.; Liu, C.; Zhang, J.; Wang, Q.; Zhang, X.; Wu, X. Factors influencing leaf chlorophyll content in natural forests at the biome scale. Front. Ecol. Evol. 2018, 6, 64. [Google Scholar] [CrossRef] [Green Version]
  44. Prado, S.A.; Cabrera-Bosquet, L.; Grau, A.; Coupel-Ledru, A.; Millet, E.J.; Welcker, C.; Tardieu, F. Phenomics allows identification of genomic regions affecting maize stomatal conductance with conditional effects of water deficit and evaporative demand. Plant Cell Environ. 2018, 41, 314–326. [Google Scholar] [CrossRef] [PubMed]
  45. Kim, J.K.; Shawon, M.R.A.; An, J.H.; Yun, Y.J.; Park, S.J.; Na, J.K.; Choi, K.Y. Influence of substrate composition and container size on the growth of tissue culture propagated apple rootstock plants. Agronomy 2021, 11, 2450. [Google Scholar] [CrossRef]
  46. Dinh, T.H.; Takaragawa, H.; Watanabe, K.; Nakabaru, M.; Kawamitsu, Y. Leaf photosynthesis response to change of soil moisture content in sugarcane. Sugar Tech. 2019, 21, 949–958. [Google Scholar] [CrossRef]
  47. Yamori, W.; Kusumi, K.; Iba, K.; Terashima, I. Increased stomatal conductance induces rapid changes to photosynthetic rate in response to naturally fluctuating light conditions in rice. Plant Cell Environ. 2020, 43, 1230–1240. [Google Scholar] [CrossRef] [PubMed]
Figure 1. Effect of temperature treatment on the morphology of plants (A), shoot height (B), number of leaves (C) and leaf area (D) of apple seedlings at 20 days after treatment in a growth chamber. T1, T2 and T3 indicate day/night temperature 18/18 °C, 23/18 °C and 30/18 °C, respectively. The lines above the bar represent the standard error of the mean (n = 5). Means above each bar followed by the same letters are not significantly different by Duncan’s multiple range test (DMRT) at p ≤ 0.05.
Horticulturae 08 00692 g001
Figure 2. Effect of light intensity on the shoot height (A), growth morphology (B), number of leaves (C) and stem diameter (D) of apple seedlings at 30 days after treatment in a controlled environment. L1, L2, L3, L4 and L5 indicate light intensity (Table 3). Lines in the graph represent the standard error of the mean (n = 5). Means above each bar followed by the same letters are not significantly different by Duncan’s multiple range test (DMRT) at p ≤ 0.05.
Horticulturae 08 00692 g002
Figure 3. Principal component analysis (PCA) illustrates the variable treatment relationships among the five treatments of apple seedlings at 30 days after treatment in a controlled condition. L1, L2, L3, L4 and L5 indicate light intensity (Table 3). The lines starting from the central point of the biplots display the negative or positive associations of the different variables, and their proximity specifies the degree of correlation with specific treatment. PH-shoot height; LN-leaf number; LL-leaf length; LW-leaf width; RL-root length; SD-stem diameter; SFW-shoot fresh weight; RFW-root fresh weight; SDW-shoot dry weight; RDW-root dry weight; SPAD-SPAD value; PSN-photosynthesis rate; SC-stomatal conductance and TPN-transpiration rate.
Horticulturae 08 00692 g003
Table 1. Effect of temperature on the survival rate of apple seedlings at 20 days after treatment in a growth chamber. T1, T2 and T3 indicate day/night temperature 18/18 °C, 23/18 °C and 30/18 °C, respectively.
TreatmentSurvival Rate (%)
0 DAT7 DAT20 DAT
T1100 z a y95.0 b95.0 a
T2100 a100 a97.4 a
T3100 a92.1 b84.0 c
DAT = Days after treatment; z Each value is the means (n = 40). y Means within columns sharing the same letter are not significantly different based on Duncan’s multiple range test at p ≤ 0.05.
Table 2. Effect of temperature on the growth and chlorophyll content of apple seedlings at 20 days after treatment in a growth chamber. T1, T2 and T3 indicate day/night temperature 18/18 °C, 23/18 °C and 30/18 °C, respectively.
TreatmentLeaf (cm)Stem Diameter (mm)SPAD
(Value)
Fresh Weight (g)
LengthWidthShootRoot
T13.0 z b y1.8 b1.74 a30.1 a2.93 a0.38 a
T23.7 a2.4 a1.73 a29.6 a2.99 a0.37 a
T33.5 a2.4 a1.56 b31.6 a2.98 a0.38 a
z Each value is the means (n = 5). y Means within columns sharing the same letter are not significantly different based on Duncan’s multiple range test at p ≤ 0.05.
Table 3. Regulations of light intensity treatments on apple seedlings.
TreatmentPPFD (μmol·m−2·s−1)
0–10 Days11–20 Days21–30 Days
L1100250500
L2250500500
L3500500500
L4250250250
L5100100100
Table 4. Effect of light intensity on plant growth characteristics of apple seedlings at 30 days after treatment. L1, L2, L3, L4 and L5 indicate light intensity (Table 3).
TreatmentLeaf (cm)Root Length (cm)Fresh Weight (g/Plant)Dry Weight (g/Plant)
LengthWidthShootRootShootRoot
L15.4 z b y3.3 a8.6 b1.5 c0.3 b0.42 c0.05 c
L25.6 b3.3 a9.2 b1.9 bc0.4 b0.62 b0.08 ab
L35.7 b3.4 a10.0 a2.6 a0.6 a0.85 a0.12 a
L46.4 a3.7 a10.2 a2.1 b0.3 b0.64 b0.07 bc
L55.3 b3.3 a9.1 b1.1 d0.2 b0.32 c0.04 c
z Each value is the means (n = 5). y Means within columns sharing the same letter are not significantly different based on Duncan’s multiple range test at p ≤ 0.05.
Table 5. Effect of light intensity on photosynthesis rate, stomatal conductance, transpiration rate and SPAD apple seedlings at 30 days after treatment. L1, L2, L3, L4 and L5 indicate light intensity (Table 3).
TreatmentSPAD
(Value)
Photosynthesis
(µmol·CO2·m−2·s−1)
Conductance
(mol·H2O·m−2·s−1)
Transpiration
(mol·H2O·m−2·s−1)
L132.6 z b y8.55 ab0.18 a3.12 a
L234.9 ab9.17 a0.16 a2.79 a
L337.9 a9.88 a0.16 a2.67 a
L432.8 b7.54 b0.17 a2.87 a
L530.9 b4.24 c0.20 a3.23 a
z Each value is the means (n = 5). y Means within columns sharing the same letter are not significantly different based on Duncan’s multiple range test at p ≤ 0.05.
Publisher’s Note: MDPI stays neutral with regard to jurisdictional claims in published maps and institutional affiliations.

