Article

Maintaining Canopy Density under Summer Stress Conditions Retains PSII Efficiency and Modulates Must Quality in Cabernet Franc

by
Michele Faralli
1,2,*,
Roberto Zanzotti
3 and
Massimo Bertamini
1,2,*
1
Center Agriculture Food Environment (C3A), University of Trento, 38098 San Michele all’Adige, Italy
2
Research and Innovation Centre, Fondazione Edmund Mach, 38098 San Michele all’Adige, Italy
3
Technology Transfer Centre, Fondazione Edmund Mach, 38098 San Michele all’Adige, Italy
*
Authors to whom correspondence should be addressed.
Horticulturae 2022, 8(8), 679; https://doi.org/10.3390/horticulturae8080679
Submission received: 3 July 2022 / Revised: 19 July 2022 / Accepted: 21 July 2022 / Published: 26 July 2022
(This article belongs to the Section Viticulture)

Abstract

:
Shoot topping and other summer grapevine management practices are considered crucial for producing high-quality wine. However, in recent years, climate change is increasing the need to reassess these strategies, as excessive radiation and high temperatures can negatively impact canopy functionality and berry quality. Indeed, it has been hypothesized that limiting summer vegetative pruning may protect the bunch, via shading, and the leaf by maintaining a more favorable environment for leaf functionality (e.g., lower VPD, reduced high light stress) owing to a denser canopy. In this work, a series of canopy manipulation treatments (shoot topping vs. long-shoot bundling; secondary shoot trimming vs. untrimmed) were tested in a replicated factorial block design over two seasons in field-grown grapevine plants (cv. Cabernet Franc grafted in SO4). Overall, treatments in which secondary shoot removal and/or shoot topping were not applied produced a higher canopy area, increased pruning wood and leaf layers, and had a higher Fv/Fm on warm days when compared to pruned canopies. These were associated with a year-dependent modulation of quality parameters of the must in which long-shoot bundling treatment, overall, produced the highest polyphenol and anthocyanin contents and must acidity. Our data provide evidence of a potential usefulness of preserving dense canopies under high temperature – high irradiance conditions with desirable effects on leaf photosynthesis and must quality when long-shoot bundling was applied.

1. Introduction

Canopy management in grapevine plants is a critical practice that optimizes the photosynthesizing area during the reproductive and ripening processes while improving the microclimate conditions of the leaf and the bunch [1,2]. A series of summer canopy management approaches have been shown to be effective in terms of maintaining an acceptable ratio between canopy leaf area and bunch number [3], ameliorating assimilate allocation to productive shoots [4], and improving ventilation and reducing relative humidity around the berry [5]. However, these approaches can enhance canopy light penetration, increase the risk of prolonged leaf photoinhibition, and increase leaf-to-air vapor pressure deficit, leading to limited transpiration-driven evaporative cooling [2]. In addition, summer pruning can expose the bunch to direct sunlight, increasing the berry temperature and reducing must quality. For instance, shoot topping is a canopy management technique applied to grapevine post-flowering to reduce vine vigor and improve canopy ventilation [6]. Increased ventilation and exposure to sunlight has been shown to significantly reduce disease incidence [7] and to improve fruit quality [8] under specifically nonstressful environmental conditions. For instance, in shoot-topped vines in which secondary shoots where retained, the possible competition with berry ripening led to lower total soluble solids compared to the vines in which secondary shoots were removed [6]. However, Vandeleur, et al. [9] showed that a continued reduction in root hydraulic conductivity after shoot topping via rapid shoot-to-root signaling is present in grapevine plants. The same authors suggested that summer pruning operations during periods of high evaporative demand may result in reduced canopy cooling, thus nullifying the additional expected positive effect on transpiration [10] derived from a reduced source–sink ratio. This finding, when associated with increases in canopy radiative interception and bunch exposure to direct sunlight, may suggest a negative effect of intensive summer pruning in areas in which high temperature and high light stress occurs, or in vineyards in which row orientation exposes bunches to direct overexposure and heat peaking during the late afternoon [11].
It has been extensively demonstrated that grapevine berry ripening processes are influenced by temperature. For instance, the composition and quality of berries at harvest is greatly modulated by the ambient temperature occurring from veraison to harvest [12,13]. Indeed, high temperatures produce various direct and indirect effects on berry physiology with a string of interactions in the developmental stage. A quicker malic acid breakdown [14] and a decrease in anthocyanins associated with potential variations in acylation in red-berry cultivars [15] are the most challenging impacts of high temperatures on fruit quality. On the contrary, berry sugar concentration is enhanced under high developing temperatures, which can lead to excessively alcoholic wines [2], whereas extreme heat can halt sugar accumulation [16].
In this work, different canopy management approaches were applied in a commercial vineyard to test the hypothesis in which, assuming a successful pest management program, reducing canopy summer pruning (i.e., avoiding shoot topping and secondary shoot trimming) can reduce leaf photoinhibition via a denser canopy area and thus directly (or indirectly via shading effects) modulate must quality. Our work provides evidence of how canopy management in grapevine plants can modify must and shoot physiology, stressing the importance of canopy management in mitigating the impact of climate change on grapevine plants.

2. Materials and Methods

2.1. Experimental Site

The experiments were carried out over two consecutive years in 2019 and 2020 in a commercial vineyard located in San Michele all’Adige (TN, Italy) (Weizacher vineyard, 46.193485 N, 11.136731 E) within Fondazione Edmund Mach (cv. Cabernet franc grafted in SO4). The vineyard was planted in 2004 in a field with a 15 to 20% slope and east–west exposure. An analysis of the soil texture showed the soil to typically be a loamy soil with 39.8% of sand, 48.1% of silt, and 12.1% of clay. The density of planting was 5600 plants ha−1 (0.80 m × 2.10 m) and vines are trained to a Guyot system. Application of fungicides was carried out by the Fondazione Edmund Mach farm following standard vineyard practices in the Trentino region and no significant incidence of foliar disease was recorded in 2019 and 2020. Temperature and irradiance were monitored with a weather station 250 m away from the field site (shorturl.at/apUX7) and are reported in Figure 1.

2.2. Treatment Applications

Two adjacent rows were selected in both 2019 and 2020 to produce a factorial design in blocks in which 24 plants represented a block. A 2 × 2 factorial design was then applied with factors being shoot topping (ST), in which shoots were either trimmed or rolled around the last wire (shoot bundling, Figure 1D), or secondary shoot removal (SR), where secondary shoots were either left growing or manually removed (n = 36 plant per treatment). In all the treatments basal defoliation was applied around the bunches. Treatments and bunch-zone defoliation were applied for both years in June (24 of June in 2019 and 12 of June 2020) and subsequent manual canopy management (either shoot topping, secondary removal, or shoot bundling) was carried out every two weeks to maintain the treatments. In 2020, a separate and independent experiment (2020 b) on 10 vines was carried out in which bunch zone defoliation, secondary removal, and shoot topping were applied as for the previously described experiment, and south- or north-exposed bunches were compared. The experiment (n = 24 plant) was carried out in two adjacent rows.

2.3. Canopy Parameters and Productivity

In 2020, the leaf area of primary leaves (from the main shoot) and the leaf area of secondary leaves (from the secondary shoots) were assessed via ImageJ by randomly collecting one shoot per plant, destructively assessing the leaf area for each leaf, and multiplying the area obtained by the number of shoots available on each plant (n = 24). Total leaf area was calculated as the sum between the area of primary and secondary leaves. Productivity (kg/m2) was calculated as the ratio of bunch weight per plant (below) and the total leaf area. Shoot number per plant was visually counted for each plant as was the number of bunches at harvest (1 October in 2019 and 22 September 2020). For each plant, total bunch weight was assessed with a scale, while mean bunch weight was calculated as the ratio between the total bunch weight per plant and the number of bunches. Pruning wood was evaluated during winter pruning for both years and for each plant and assessed via a scale. Yield to pruning weight ratio (Ravaz index) and fertility were calculated as the ratio between bunch weight per plant and pruning wood and the ratio between the number of bunches per plant and the number of shoots per plant, respectively.

2.4. Point Quadrat Analysis

Point quadrat analyses were performed with a metal rod and by slowly inserting the rod inside the canopy horizontally in 2020. The number of contacts with leaves and bunches were recorded. Analyses were carried out on the basal, median, and apical parts of the canopy (n = 12 for each layer). Gaps within the canopy (%), interior leaves (%), and the number of leaf layers were then calculated as proposed in [17].

2.5. Chlorophyll Fluorescence Analysis and Leaf and Berry Temperature

Chlorophyll fluorescence analyses were carried out with either a PAM 2000 (2020) or a HandyPEA (2019). Data were collected between 10:00 and 17:00 in the 6–9th leaf of each tagged shoot. All leaves were dark-adapted before measurement for 30 min. The maximum quantum yield of PSII efficiency in dark-adapted samples (Fv/Fm) was calculated as Fv/Fm = (Fm − Fo)/Fm, where Fo and Fm represent the minimum and maximum fluorescence after a saturation pulse of 6000 µmol m−2 s−1 PAR, respectively. Data were collected on the 6–9th leaf of each tagged shoot (n = 30–40) and for 2020 data were collected either on the north- or south-exposed side of the row. In 2019, leaf temperature and fluorescence measurements were performed on the same leaves with a MultispeQ (PhotosynQ, East Lansing, MI, USA). Berry temperature was measured with an infrared thermometer (Handheld Infrared Laser Thermometer, 62 MAX+, FLUKE Corporation, Everett, Washington, WA, USA) on 15th of September 2020 in n = 30.

2.6. Must Quality Analysis

At harvest, bunches for all the treatments were harvested and the resulting bunches were assembled in n = 6. In the 2020 experiment, bunches from the north- and the south-exposed sides of the row were harvested. Bunches were then manually pressed in plastic bags for must extraction in both years. In 2020, another sampling was carried out (n = 3) in a separate experiment where intensively bunch-zone-defoliated vines were present to evaluate the direct effect of different exposures, and thus berry temperature, on must quality. Samples of fresh must were then analyzed for pH, total soluble solids (TSS) (°Brix), total acidity (TA) (g/L as tartaric acid), tartaric and malic acid concentration (g/L), and YAN (mg/L) using a WineScan infrared spectrophotometer (FOSS, Hillerϕd, Denmark). The extraction of the anthocyanin and polyphenol content of the peel was carried out using the method proposed in [18]. Briefly, the skins of berries were peeled and subjected to extraction for 24 h in 100 mL of methanol. After the first extraction, the extract was separated and 50 mL of methanol was added to the skins, which were subjected to further extraction for 2 h. Both extracts were combined and stored in a freezer at −30 °C until the analysis was carried out.

2.7. Statistical Analysis

Statistical analyses were carried out with Rstudio (R Core Team 2018, PBC, Boston, MA, USA, http://www.rstudio.com/, accessed on 20 June 2022). All data were checked for normality and homoscedasticity through visual assessment of distribution and residuals versus fitted values. When skew distribution was present, data were log-transformed. Data were then subjected to three-, two-, or one-way ANOVA depending on the factor number. Mean separation was carried out via Tukey’s test.

3. Results

3.1. Environmental Conditions

Environmental data from 2019 and 2020 (Figure 1A–C) showed similar average temperatures for the two field seasons, while 2019 was characterized by higher total precipitation (1306 mm) when compared to 2020 (1091 mm) and lower average daily radiation (12.66 and 13.88 MJ m−2, respectively). These differences were more pronounced over the post-veraison pre-harvest period (August–September) with 2020 showing higher temperatures and radiation on average when compared to 2019. Indeed, 2020 was characterized by faster phenological progress and an earlier harvest.

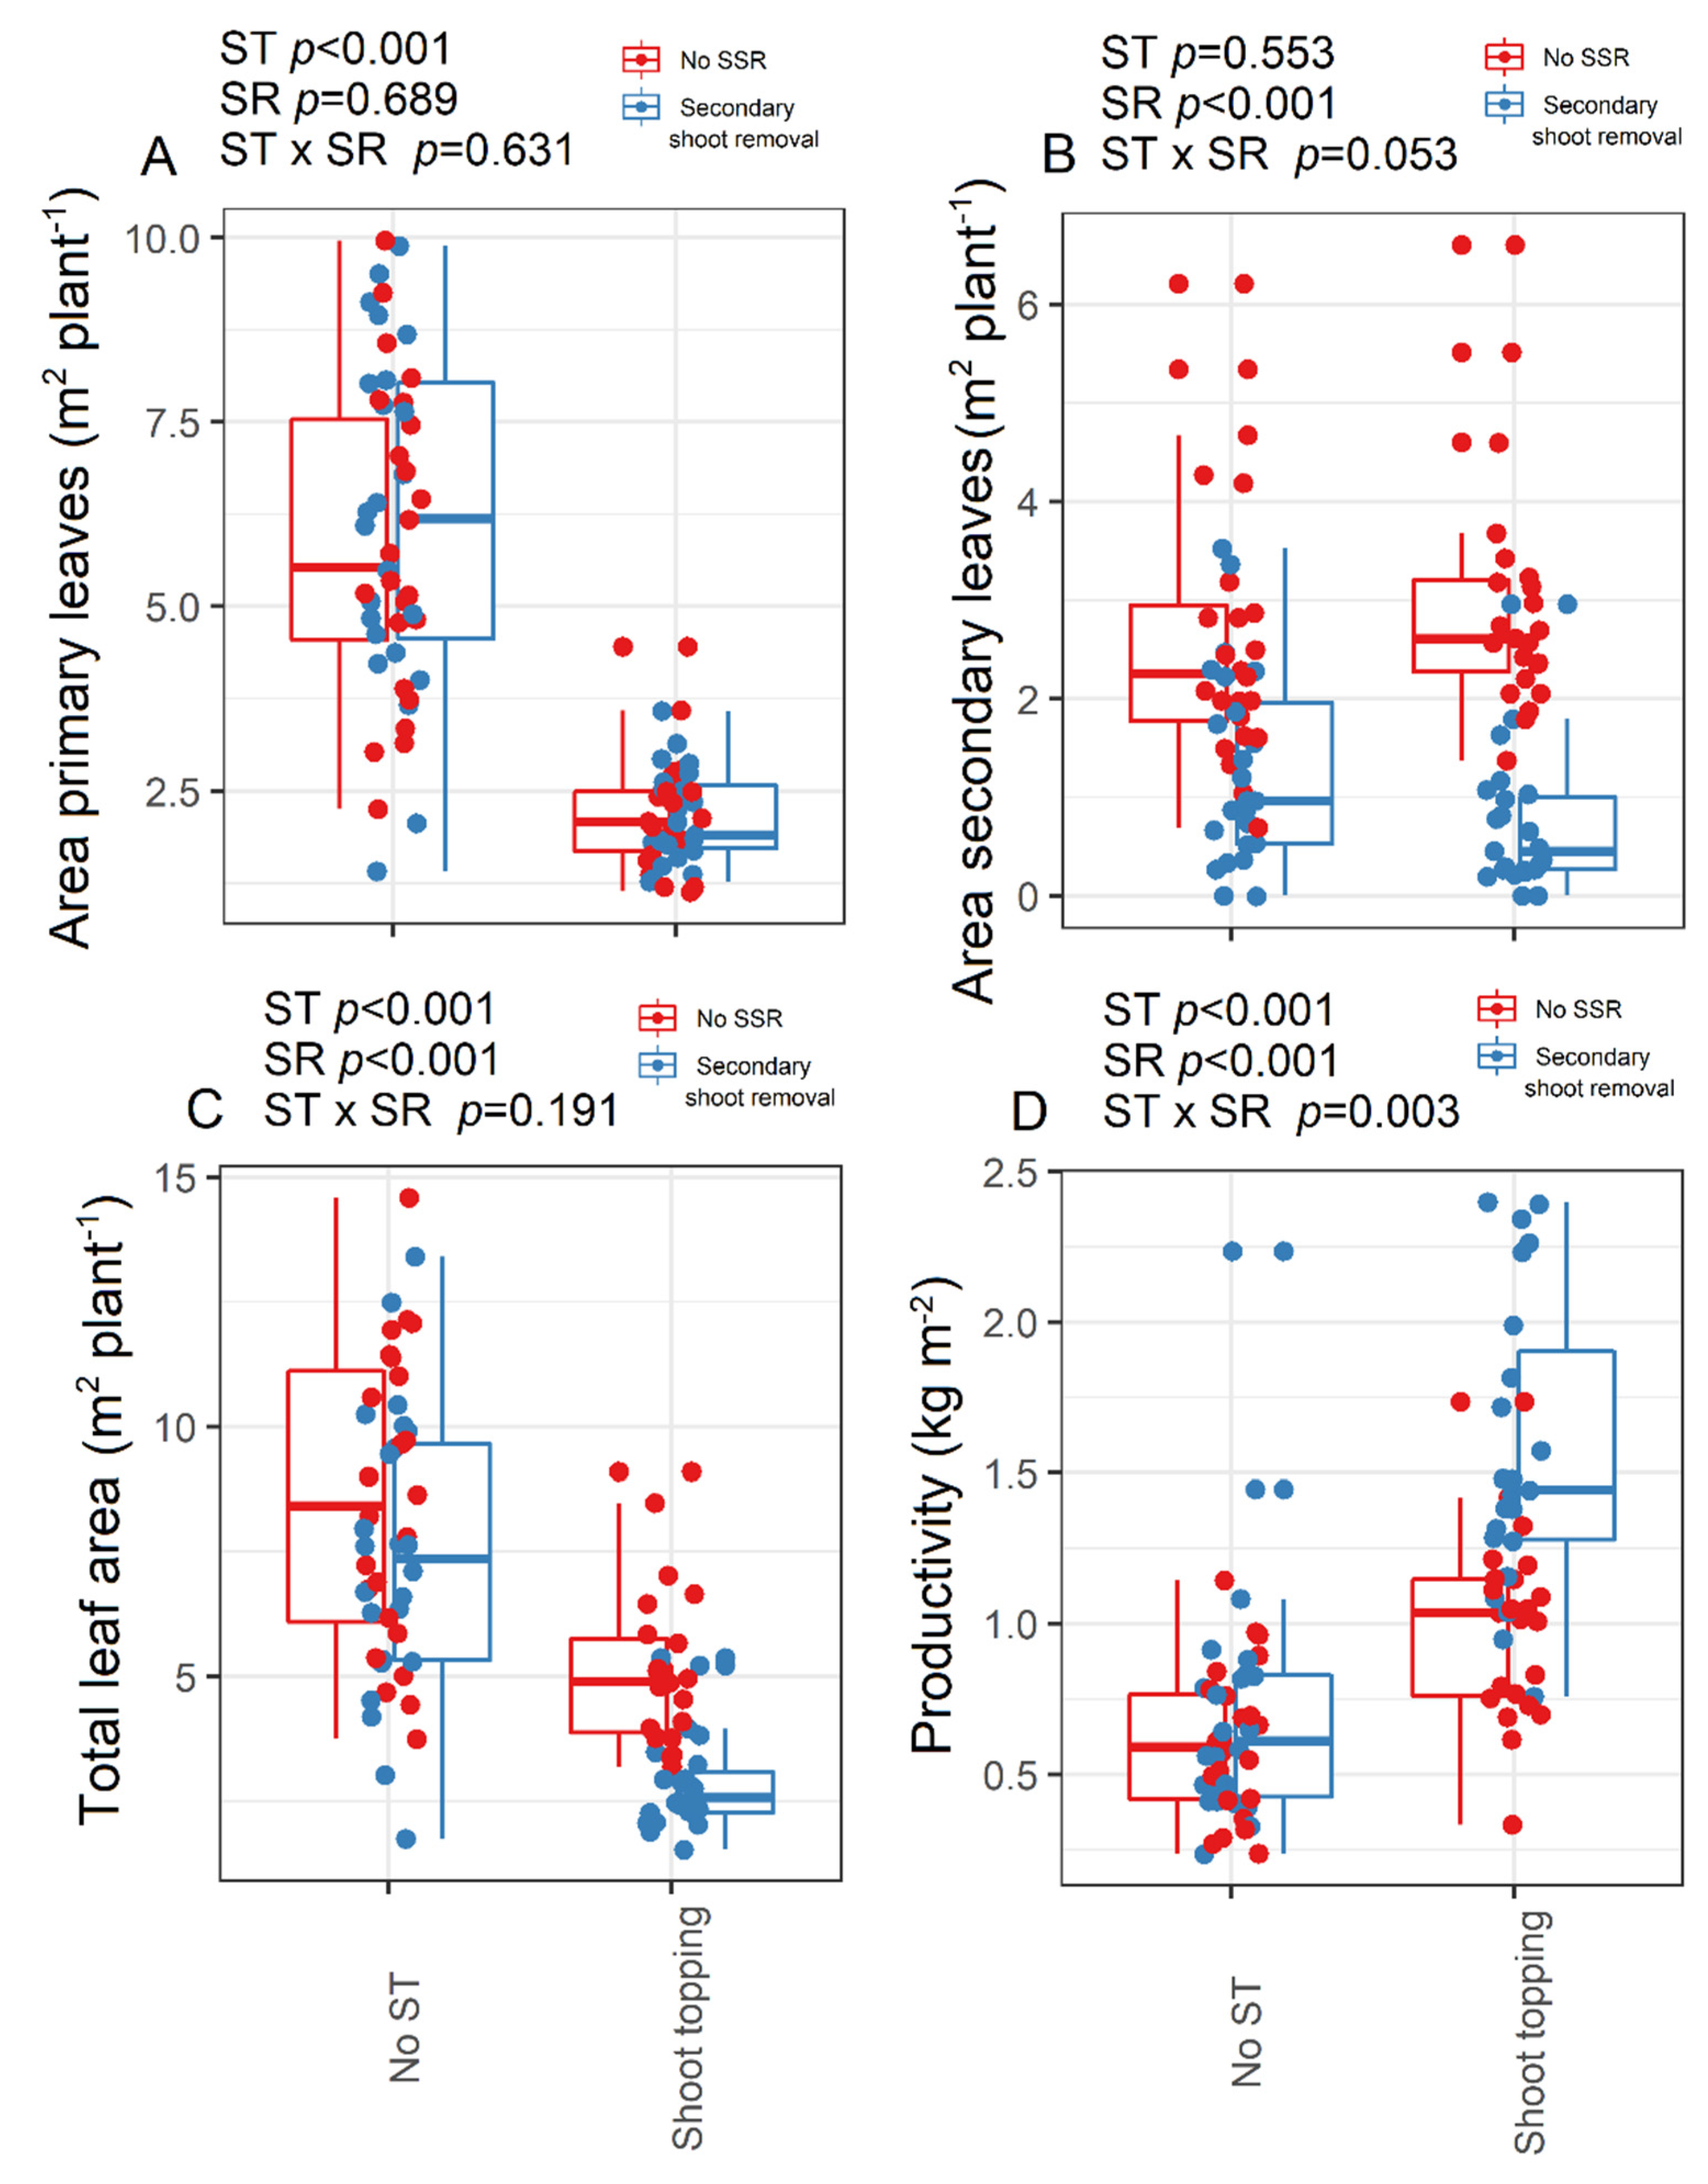
3.2. Canopy, Vegetative, and Productivity Traits

The application of shoot topping (Figure 1D) significantly reduced the leaf area of primary leaves (Figure 2, p < 0.001) and the total leaf area (p < 0.001) by up to 50% when compared to shoot bundling. Similarly, a reduction in the secondary leaf area was observed in plants where secondary shoots were removed, while no effects were observed for shoot topping. In general, the total leaf area was reduced by both shoot topping and secondary removal, leading to a higher bunch being produced for each unit of leaf area (p < 0.001).
Application of SSR and ST overall increased (p < 0.001) gaps within the canopy and for all the positions (Figure 3). When no SSR and shoot bundling were applied, a significant increase in interior leaves was observed although this was more pronounced in the apical and median positions of the canopy (p < 0.001). This was associated with a higher number of leaf layers (p < 0.001), which was higher in the apical part of the canopy and plants in which no ST and no SSR was applied. No effects were observed in the basal leaf position between treatments.
Treatment applications did not influence shoot number per plant (around nine on average), bunch number per plant (around 14 on average), bunch weight (around 250 g on average), or fertility (Table 1). However, a significant effect of the year was observed, with 2020 being characterized by a higher productivity (p < 0.001). In general, shoot topping reduced pruning wood in both years, leading to a higher Ravaz index, particularly in the 2020 season (p < 0.001).

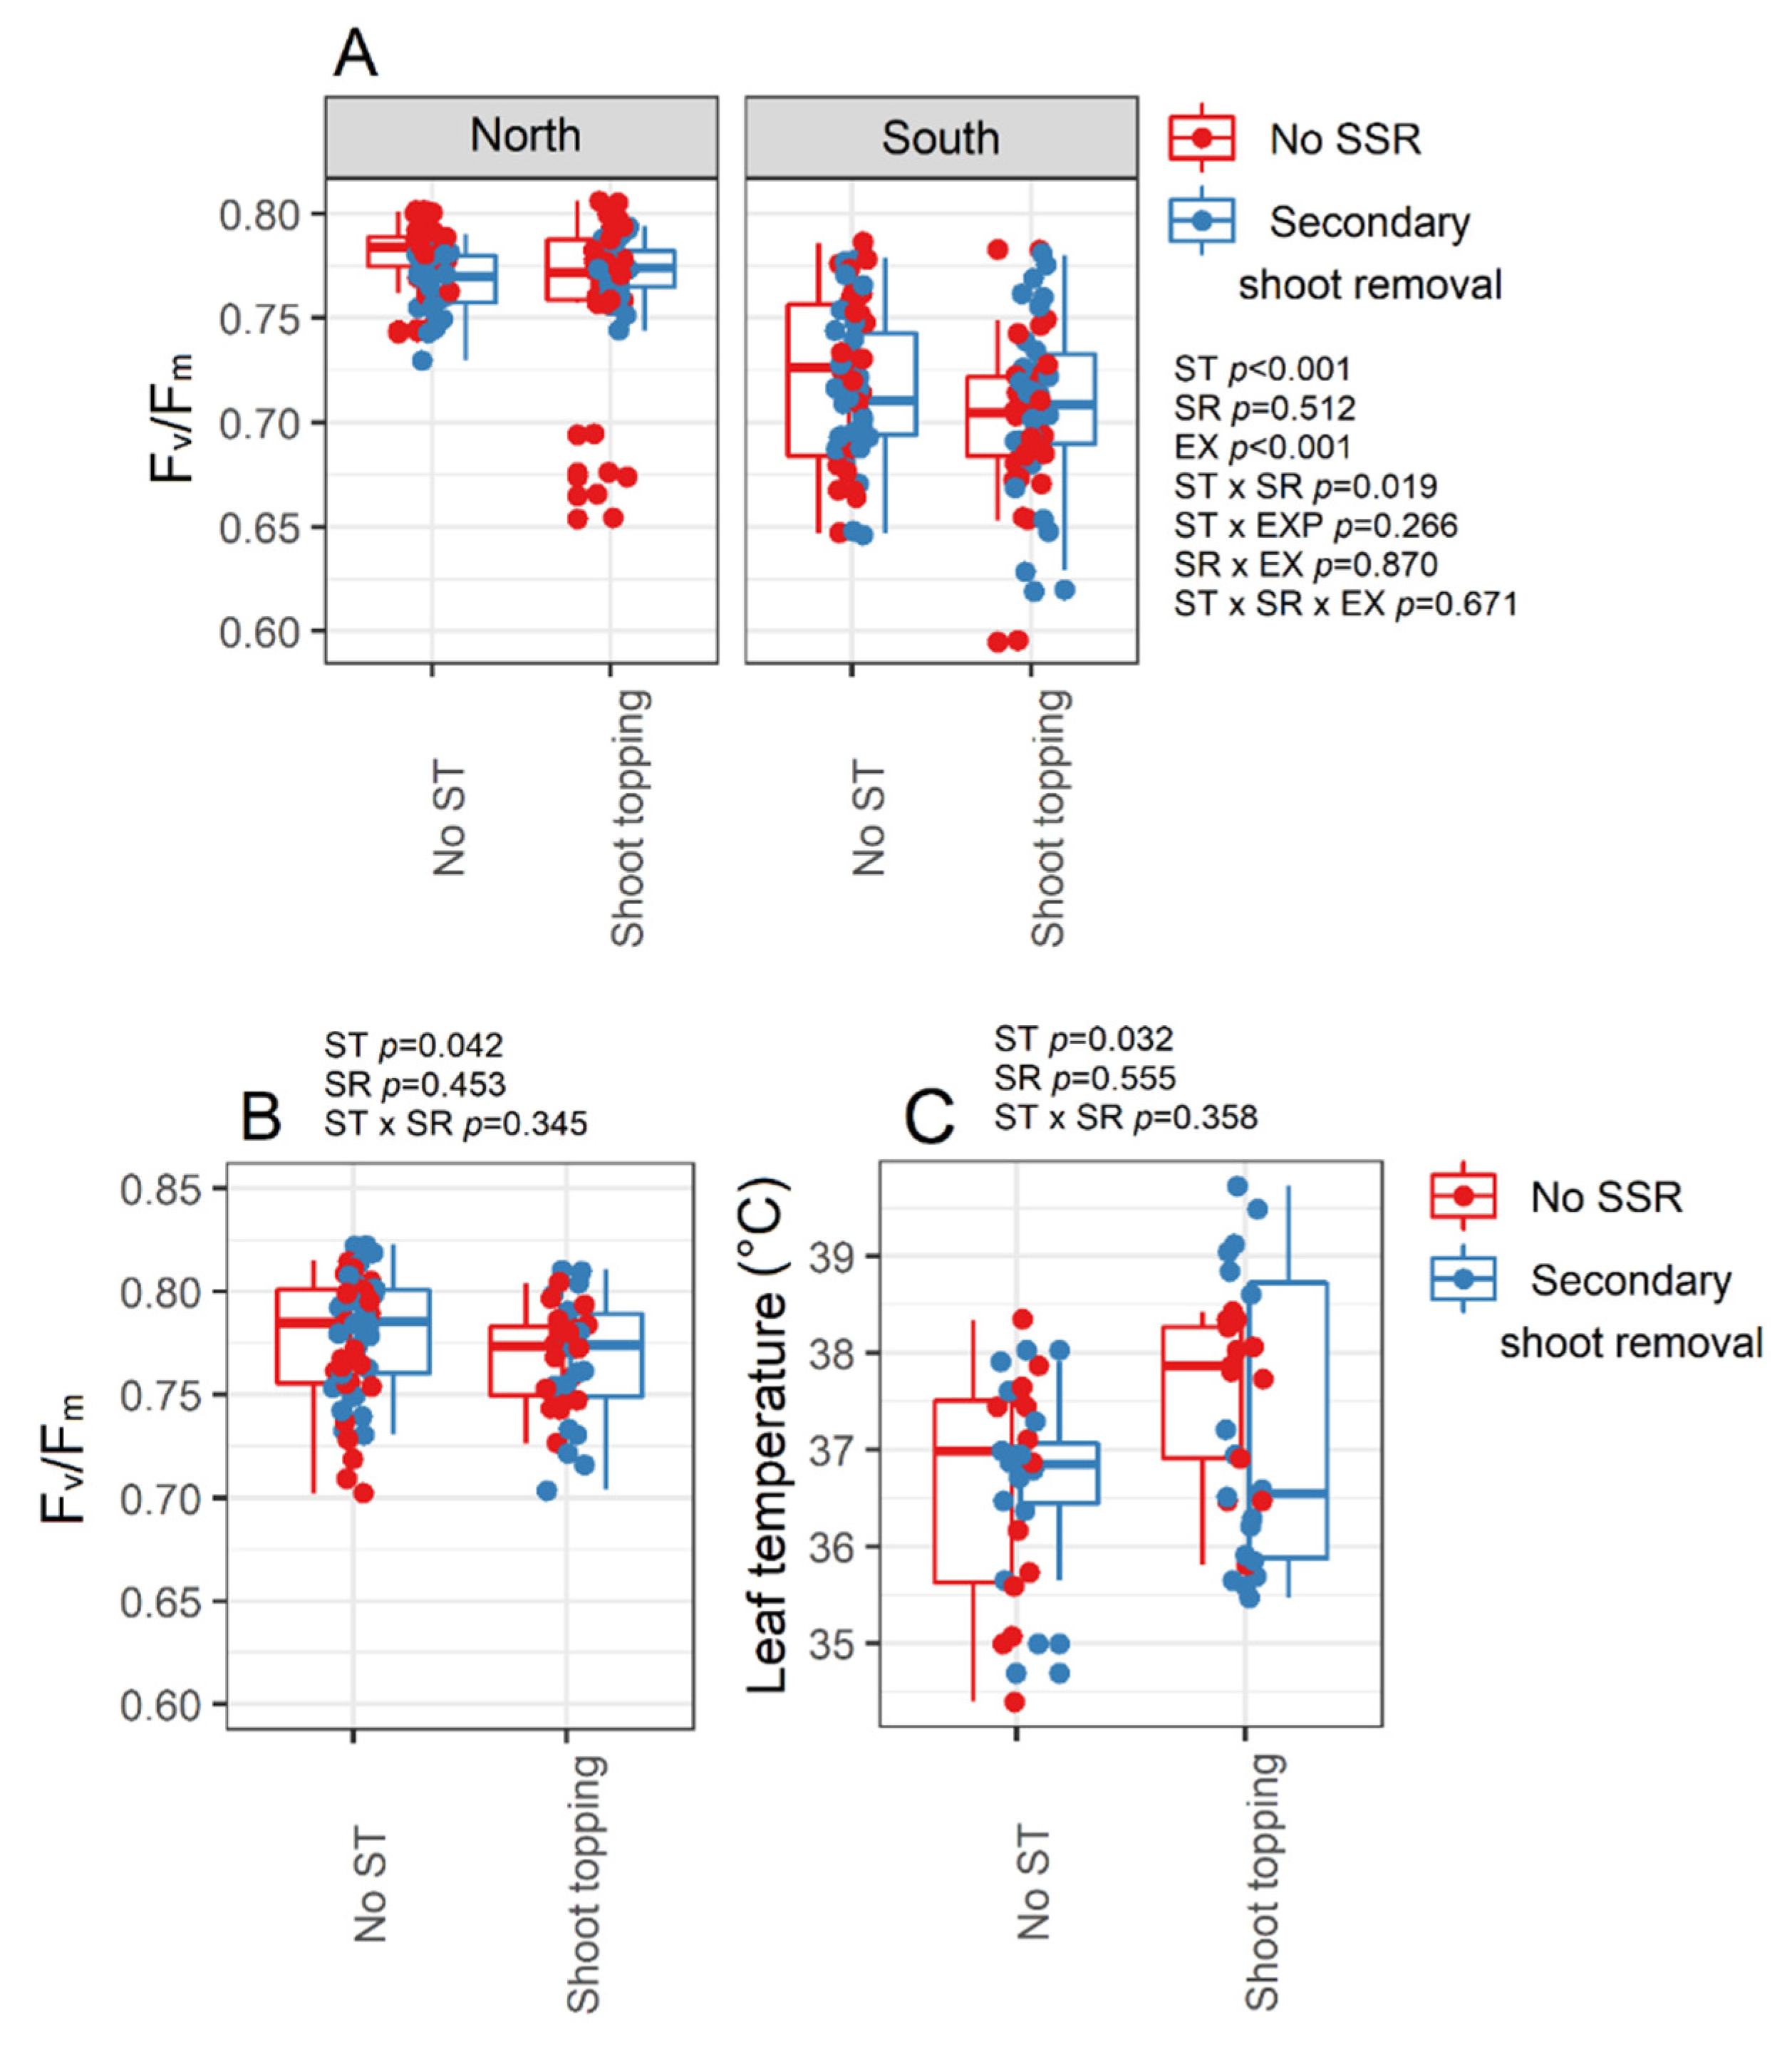
3.3. Chlorophyll Fluorescence Analysis

Maximum quantum yield of PSII in dark-adapted samples was significantly higher in the north-exposed side of the row when compared to the south side (Figure 4A). Significant reductions (p < 0.001) in Fv/Fm were observed in plants where shoot topping was applied in both 2019 and 2020. No effects were observed in plants where secondary shoots were removed. Significant differences were observed for leaf temperature with plants subjected to shoot topping highlighting higher temperatures than plants subjected to shoot bundling (p = 0.032).

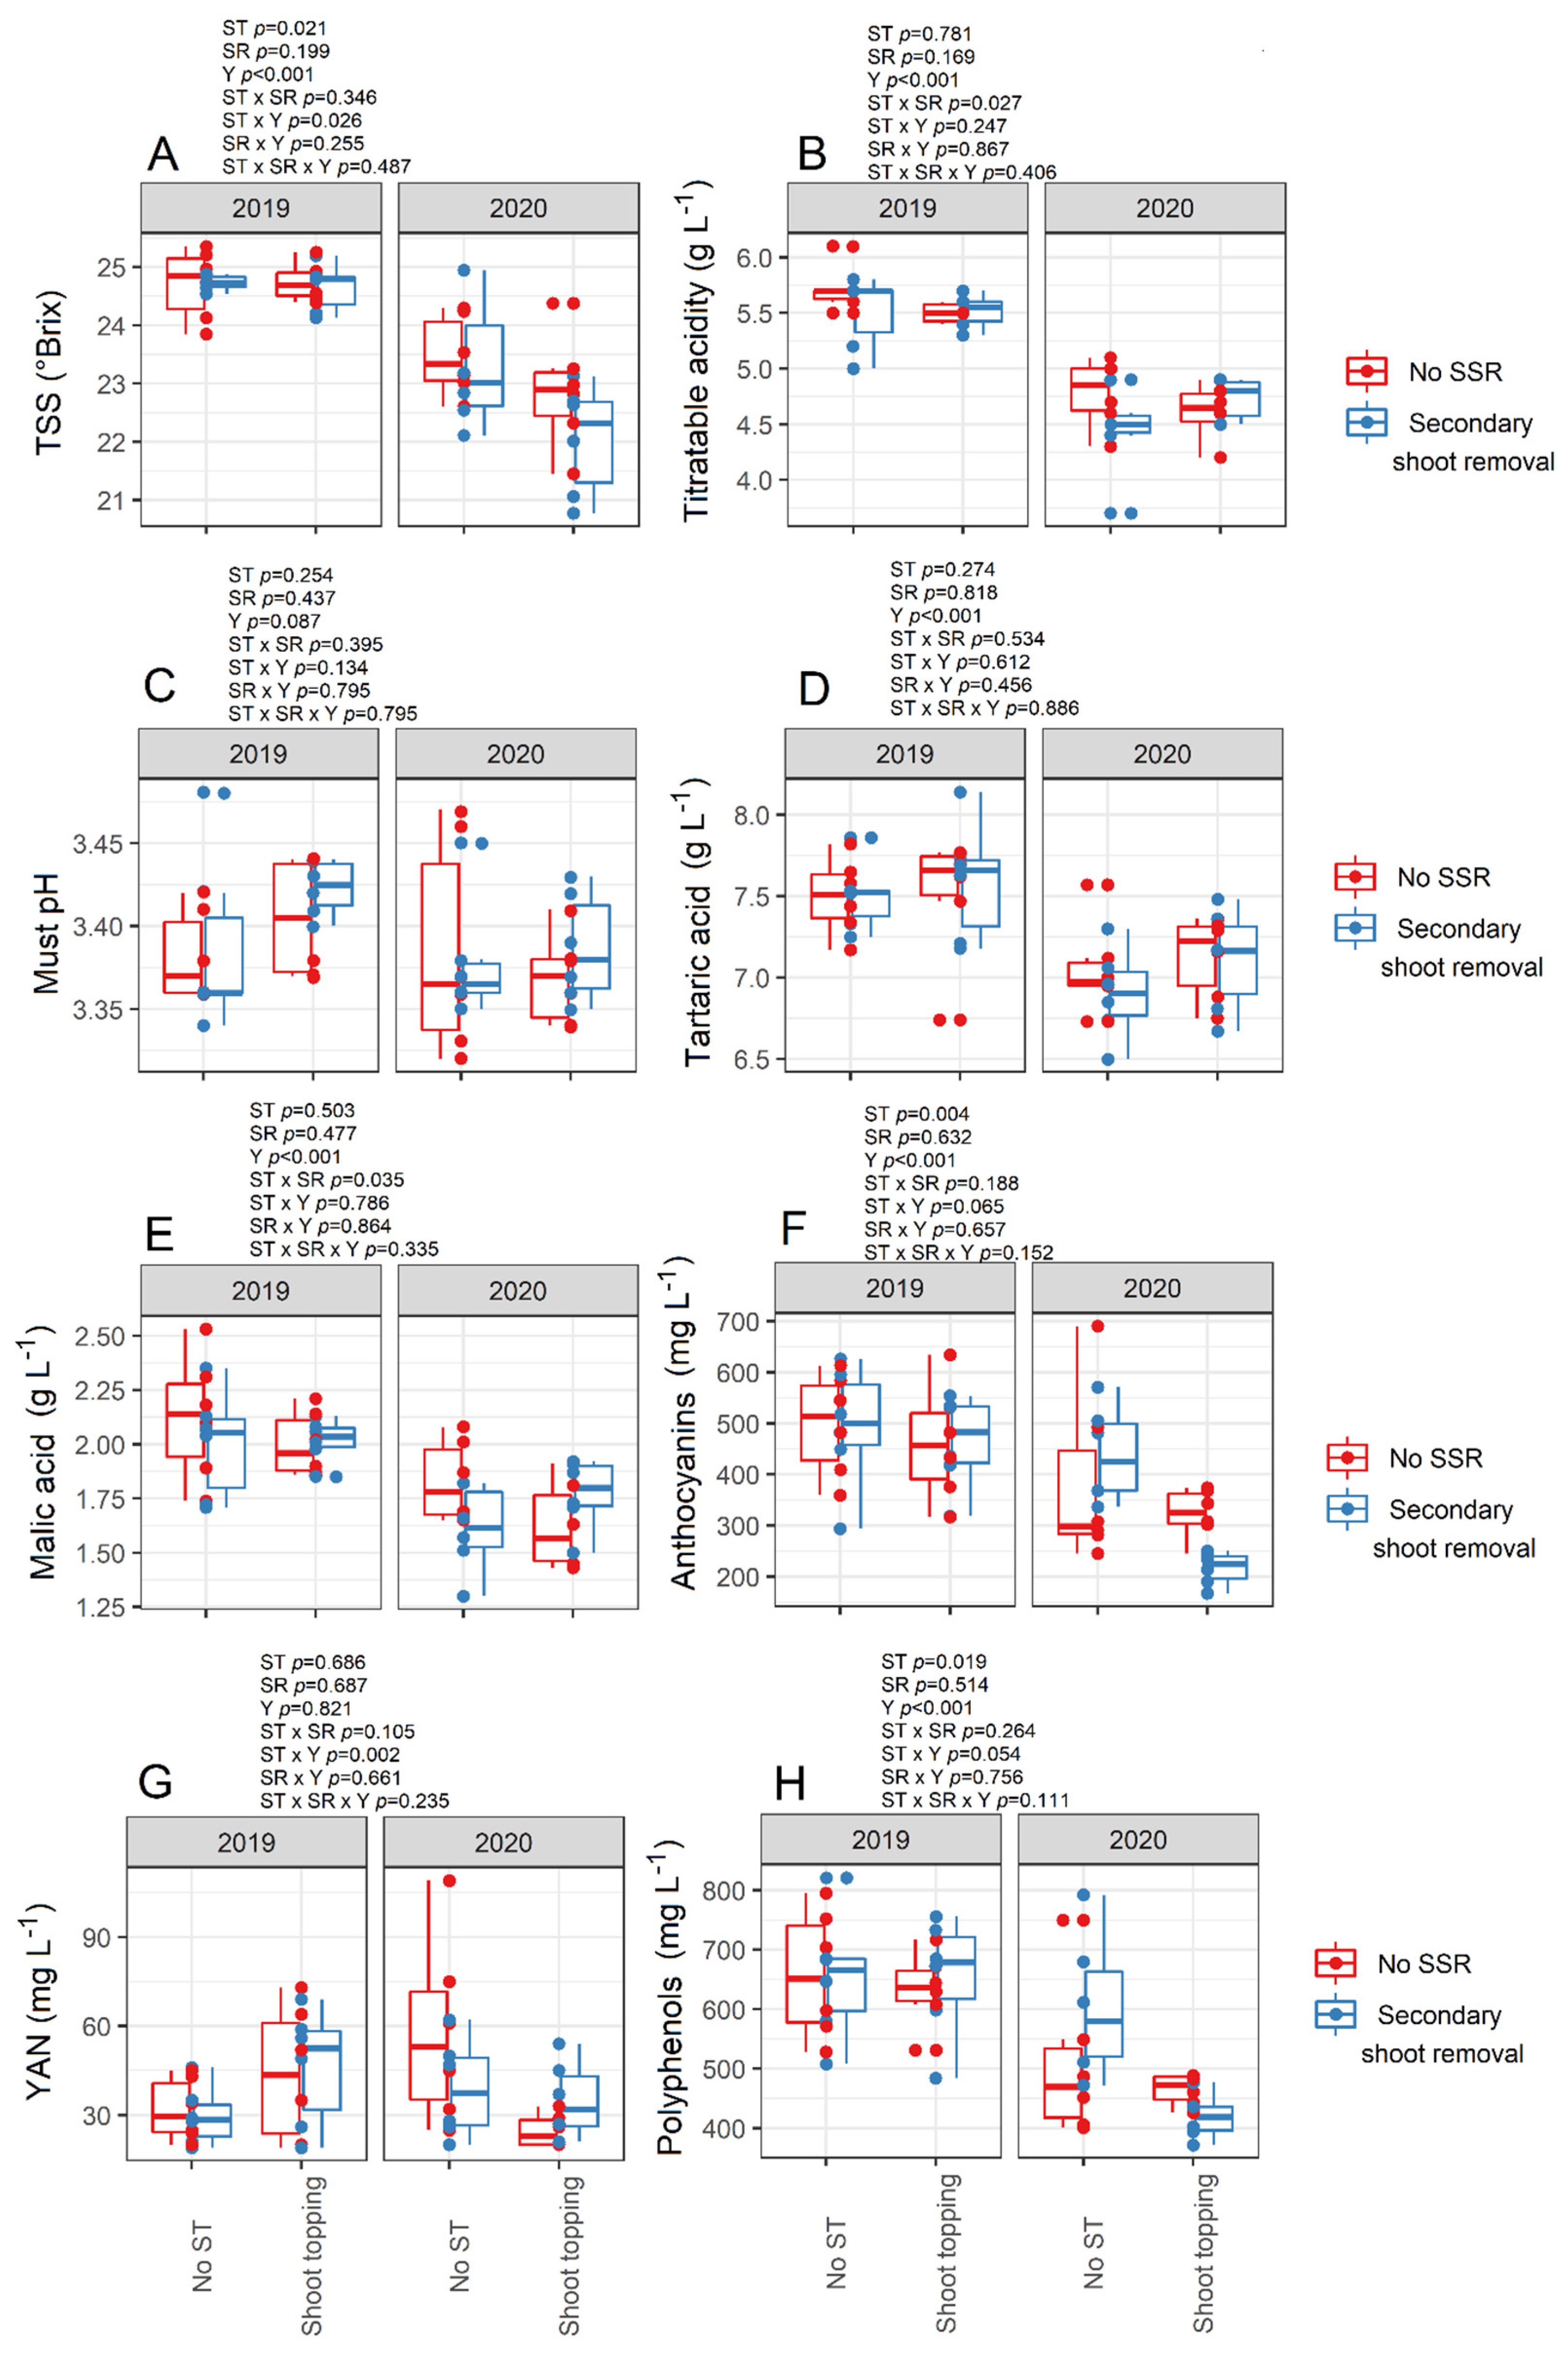
3.4. Must Quality and Berry Temperature

There were significant differences between the 2019 and 2020 seasons in terms of must quality, with 2020 (the warmer year) being characterized by lower TSS, titratable acidity, tartaric and malic acid, and anthocyanins and polyphenols as compared to 2019 (p < 0.001) (Figure 5). No differences were noted for YAN or must pH. The SR factor was not significant for any of the parameters assessed, although significant interactions were present with ST for titratable acidity and malic acid. ST had an overall significant effect on TSS, anthocyanins and polyphenols, with plants subjected to shoot topping also showing lower values when compared to shoot bundling. Significant interactions were observed between ST and Y for TSS and YAN, as the effect of shoot topping was more pronounced in 2020, with reduced TSS and YAN when compared to shoot bundling.
In 2020, significant effects were observed for berry temperature in south- and north-exposed bunches, with south-exposed bunches showing significantly higher berry temperatures (Table 2). Differences in berry temperature (i.e., bunch exposure to direct afternoon sunlight) were associated with reduced acidity and increases in pH, followed by reduced anthocyanins and polyphenols when compared to the north-exposed bunches.

4. Discussion

Summer pruning incorporates a series of management practices that allow vine vigor to be controlled and to balance productivity with grapevine vegetative growth [19]. While these practices (shoot topping, defoliation, secondary shoot topping) are also useful to avoid the development of powdery mildew and restrict the proliferation of other pathogens (e.g., Plasmopara viticola) via improving microclimatic conditions (e.g., [20]), they have been estimated to significantly contribute to the total vineyard management costs. Therefore, assuming the presence of an effective pest management scheme and considering the major impact of extreme weather conditions on berry quality [2], harmonizing the implementation of summer pruning techniques is critical both (i) to shield canopy functionality and the bunch from stressful environments and (ii) to reduce management costs. In our work, maintaining the canopy density led to a preserved quantum yield of PSII, which was mainly associated with an increase in leaf layers and leaf area when compared to vines subjected to shoot topping and/or secondary shoot removal. In particular, the data show how, even in relatively cool areas (north Italy), limiting summer pruning can be effective at counteracting the negative effects of specifically warm seasons (e.g., 2020) on leaf photosynthesis, must acidity, and berry color.

4.1. Can Shoot Bundling Be Effective at Reducing Photosynthetic Impairment under Multifactorial Summer Stresses?

Air temperature and humidity significantly drive physiological fitness in grapevine plants [21]. Under summer conditions, these signals interact with the light intercepted by the leaf [22], thus making it difficult to understand and evaluate the degree of stress tolerance within the canopy and the hierarchical effect of each specific individual environmental cue [23]. It has been shown that high temperatures and the subsequent decrease in air relative humidity can impair photosynthetic capacity via direct damage to the photosystem II [21], following an increased stomatal limitation of photosynthesis [24] and owing to reduced leaf evaporative cooling, which increases leaf temperature to suboptimal values for photosynthesis [25]. These conditions are often experienced under oversaturating light conditions that exacerbate the aforementioned negative effects and contribute, in Mediterranean conditions, to chronic photoinhibition and leaf chlorosis [26,27]. While genotypic variation in varieties [24] and scion x rootstocks combinations [28,29] have been shown to exhibit different degrees of tolerance to multiple summer stresses, which opens the possibility of selecting adapted genetic material in the long term, in the short term, canopy management can be targeted to mitigate summer stress conditions. Although relative humidity inside the canopy was not monitored, a tight positive association can be observed between Fv/Fm and the number of leaf layers present in the apical and median parts of the canopy. These data suggest that reducing PAR penetration in the canopy in combination with a higher leaf number, and therefore leaf self-shading, under multiple stress conditions can increase the relative humidity between leaves [19] and maintain acceptable VPD and light levels for photosynthesis [24]. This was particularly evident in the south-exposed side of the row where multiple stresses mostly occurred in the afternoon and where shoot bundling maintained higher Fv/Fm values with respect to vines in which shoot topping was applied. This is confirmed by the lower leaf temperature observed in plants in which shoot bundling was applied, suggesting the presence of higher leaf evaporative cooling, potentially driven by a more suitable environment for stomatal opening. Although the microclimatic effects imposed by the maintenance of a complex canopy may be numerous (high RH, higher transpiration, lower oversaturated leaves) and somehow undesirable under high pathogen pressure or in cool seasons [30], the exploitation of these approaches may enhance the tolerance of source leaves subjected to combined radiative and temperature stress. Further work will focus on determining the physiological basis underlying the preferable response of a dense canopy under different degrees of stress intensity.

4.2. Dense Canopies Reduce Malic Acid Breakdown and Anthocyanins Degradation under Hot Summer Conditions

Uncoupled ripening processes are one of the major issues related to climatic changes and berry quality [11,31]. High temperatures accelerate sugar accumulation in the berry [32], although the effects of temperature on final sugar accumulation does not seem to be a primary determinant of quicker ripening kinetics [33]. Indeed, Brix levels higher than 24° are unlikely due to assimilate transport from the leaves, but the total soluble solid concentration due to evaporative loss [34] often increased under multiple stress conditions. Similarly, while tartaric acid concentration does not seem to be affected by increasing temperatures or radiative stress, malic acid levels are closely associated with environmental conditions and decrease with increasing air temperatures [31]. Reduced must acidity is also associated with berry pH and is strongly affected by potassium accumulation. Potassium is reallocated in berry cells with a direct exchange for protons and from other above-ground vegetative vine organs and its levels increases with increasing air temperature [35]. Lower anthocyanin levels putatively associated with a decrease in synthesis and an increase in degradation were observed when high-temperature conditions occur post-veraison, as the activity of enzymes involved in anthocyanin biosynthesis is affected by elevated temperature [15]. Therefore, since environmental cues and microclimatic conditions play a critical role in defining berry quality, redefining summer pruning techniques to minimize uncoupled ripening processes is of critical importance [2]. In our work, when harvest was carried out in 2020 both in bunches exposed to the north and south side of the row, negative trends were observed, which were strongly associated with berry temperature pre-harvest. In essence, in Cabernet Franc, south-exposed bunches (i.e., bunches subjected to high temperatures and radiative stress in the afternoon) showed similar Brix levels compared to the north-exposed bunches, yet a reduction in the acidity, mainly associated with potassium concentration and reduced anthocyanin and polyphenol levels, was also observed. In the canopy manipulation experiments, and especially in 2020 when post-veraison occurred in warmer conditions, similar trends were observed. Brix was generally higher in vines subjected to shoot bundling, suggesting that, under the conditions applied in this work, multiple stresses potentially hastened TSS accumulation in vines with lower leaf layers, thus reducing bunch shading from leaves and producing higher temperatures, as was previously proposed. In 2020, the uncoupling between ripening was much more evident than in 2019, with lower Brix values associated with lower must acidity. This was obvious in vines subjected to shoot topping, with a significant ST x SR interaction, which may suggest potential trade-offs between shoot bundling and secondary removal on must acidity and hence the microclimate around the bunch. Bergqvist et al., (2001) showed that anthocyanins and phenolics increased linearly with light exposure on the north-facing side, whereas they declined when cluster exposure on the south side exceeded a PAR of 1000 μmol m−2 s−1, suggesting a biphasic anthocyanin response to increases in temperature [36]. In our work, a dense canopy with a higher bunch shading potential was also associated with higher anthocyanin and polyphenol values, suggesting lower anthocyanin degradation due to less stressful microclimatic conditions in dense canopies.

5. Conclusions

Our work provides evidence for the importance of canopy management in protecting leaves and bunches from environmental stresses, with dense canopies being associated with lower photoinhibition and ameliorated must quality. Avoiding shoot topping and secondary shoot trimming produces canopies with higher leaf layers, which can preserve photosynthesis and evaporative cooling on warm days. A higher canopy density also produced a mitigative effect on anthocyanin degradation and Brix accumulation, especially on the warmer year. However, in years characterized by a marked uncoupled ripening, interactions were observed between treatments, with malic acid breakdown generally being associated with canopies with lower leaf layers, although different trends for secondary shoot removal were detected. In addition, these practices should be carefully and specifically evaluated in each season as the expected increase in relative humidity in a dense canopy might increase pest incidence and severity in seasons characterized by elevated rainfall. We speculate that rethinking summer management practices in grapevine plants with a focus on the conservation of the leaf area may help in reducing the negative impacts of climate change on berry ripening while limiting expensive field operations.

Author Contributions

Conceptualization, M.B. and R.Z.; methodology, M.F., M.B. and R.Z.; validation, M.F., M.B. and R.Z.; formal analysis, M.F.; investigation, M.F., M.B. and R.Z.; resources, M.B. and R.Z.; data curation, M.F., M.B. and R.Z.; writing—original draft preparation, M.F.; writing—review and editing, M.F., M.B. and R.Z.; visualization, M.F.; funding acquisition, M.B. and R.Z. All authors have read and agreed to the published version of the manuscript.

Funding

This research received no external funding.

Institutional Review Board Statement

Not applicable.

Informed Consent Statement

Not applicable.

Data Availability Statement

The data presented in this study are available on request from corresponding authors.

Acknowledgments

The authors would like to thank Giulio Marchetti, Marco Zanconte, Giada Boscaini and Mattia Masiero for their precious help during the field sampling.

Conflicts of Interest

The authors declare no conflict of interest.

References

  1. Wang, X.; De Bei, R.; Fuentes, S.; Collins, C. Influence of Canopy Management Practices on Canopy Architecture and Reproductive Performance of Semillon and Shiraz Grapevines in a Hot Climate. Am. J. Enol. Vitic. 2019, 70, 360–372. [Google Scholar] [CrossRef]
  2. Palliotti, A.; Tombesi, S.; Silvestroni, O.; Lanari, V.; Gatti, M.; Poni, S. Changes in vineyard establishment and canopy management urged by earlier climate-related grape ripening: A review. Sci. Hortic. 2014, 178, 43–54. [Google Scholar] [CrossRef]
  3. Dry, P.R. Canopy management for fruitfulness. Aust. J. Grape Wine Res. 2000, 6, 109–115. [Google Scholar] [CrossRef]
  4. Geller, J.P.; Kurtural, S.K. Mechanical Canopy and Crop-Load Management of Pinot gris in a Warm Climate. Am. J. Enol. Vitic. 2013, 64, 65–73. [Google Scholar] [CrossRef]
  5. Verdenal, T.; Zufferey, V.; Dienes-Nagy, A.; Bourdin, G.; Gindro, K.; Viret, O.; Spring, J.-L. Timing and Intensity of Grapevine Defoliation: An Extensive Overview on Five Cultivars in Switzerland. Am. J. Enol. Vitic. 2019, 70, 427–434. [Google Scholar] [CrossRef]
  6. Poni, S.; Giachino, E. Growth, photosynthesis and cropping of potted grapevines (Vitis vinifera L. cv. Cabernet Sauvignon) in relation to shoot trimming. Aust. J. Grape Wine Res. 2000, 6, 216–226. [Google Scholar] [CrossRef]
  7. Petrie, P.R.; Trought, M.C.T.; Howell, G.S.; Buchan, G.D. The effect of leaf removal and canopy height on whole-vine gas exchange and fruit development of Vitis vinifera L. Sauvignon Blanc. Funct. Plant Biol. 2003, 30, 711–717. [Google Scholar] [CrossRef]
  8. Hunter, J.; De Villiers, Q.; Watts, J. The effect of partial defoliation on quality characteristics of Vitis vinifera L. cv. Cabernet Sauvignon grapes. II. Skin color, skin sugar, and wine quality. Am. J. Enol. Vitic. 1991, 42, 13–18. [Google Scholar]
  9. Vandeleur, R.; Sullivan, W.; Athman, A.; Jordans, C.; Gilliham, M.; Kaiser, B.; Tyerman, S.D. Rapid shoot-to-root signalling regulates root hydraulic conductance via aquaporins. Plant Cell Environ. 2014, 37, 520–538. [Google Scholar] [CrossRef]
  10. Hunter, J.; Visser, J. The Effect of Partial Defoliation, Leaf Position and Developmental Stage of the Vine on the Photosynthetic Activity of Vitis vinifera L. cv Cabernet Sauvignon. S. Afr. J. Enol. Vitic. 1988, 9. [Google Scholar] [CrossRef] [Green Version]
  11. Hunter, J.; Volschenk, C.; Mania, E.; Castro, A.V.; Booyse, M.; Guidoni, S.; Pisciotta, A.; Di Lorenzo, R.; Novello, V.; Zorer, R. Grapevine row orientation mediated temporal and cumulative microclimatic effects on grape berry temperature and composition. Agric. For. Meteorol. 2021, 310, 108660. [Google Scholar] [CrossRef]
  12. Cohen, S.D.; Tarara, J.M.; Gambetta, G.A.; Matthews, M.A.; Kennedy, J.A. Impact of diurnal temperature variation on grape berry development, proanthocyanidin accumulation, and the expression of flavonoid pathway genes. J. Exp. Bot. 2012, 63, 2655–2665. [Google Scholar] [CrossRef] [PubMed] [Green Version]
  13. Tarara, J.M.; Lee, J.; Spayd, S.E.; Scagel, C.F. Berry temperature and solar radiation alter acylation, proportion, and concentration of anthocyanin in Merlot grapes. Am. J. Enol. Vitic. 2008, 59, 235–247. [Google Scholar]
  14. Rienth, M.; Torregrosa, L.; Sarah, G.; Ardisson, M.; Brillouet, J.-M.; Romieu, C. Temperature desynchronizes sugar and organic acid metabolism in ripening grapevine fruits and remodels their transcriptome. BMC Plant Biol. 2016, 16, 164. [Google Scholar] [CrossRef]
  15. Mori, K.; Goto-Yamamoto, N.; Kitayama, M.; Hashizume, K. Loss of anthocyanins in red-wine grape under high temperature. J. Exp. Bot. 2007, 58, 1935–1945. [Google Scholar] [CrossRef]
  16. Greer, D.H.; Weedon, M.M. The impact of high temperatures on Vitis vinifera cv. Semillon grapevine performance and berry ripening. Front. Plant Sci. 2013, 4, 491. [Google Scholar] [CrossRef] [Green Version]
  17. Richard, E.; Smart, R.E. Principles of Grapevine Canopy Microclimate Manipulation with Implications for Yield and Quality. A Review. Am. J. Enol. Vitic. 1985, 36, 230–239. [Google Scholar]
  18. Mattivi, F.; Guzzon, R.; Vrhovsek, U.; Stefanini, A.M.; Velasco, R. Metabolite Profiling of Grape: Flavonols and Anthocyanins. J. Agric. Food Chem. 2006, 54, 7692–7702. [Google Scholar] [CrossRef]
  19. Poni, S.; Gatti, M.; Palliotti, A.; Dai, Z.; Duchêne, E.; Truong, T.-T.; Ferrara, G.; Matarrese, A.M.S.; Gallotta, A.; Bellincontro, A.; et al. Grapevine quality: A multiple choice issue. Sci. Hortic. 2018, 234, 445–462. [Google Scholar] [CrossRef] [Green Version]
  20. Austin, C.N.; Wilcox, W.F. Effects of Fruit-Zone Leaf Removal, Training Systems, and Irrigation on the Development of Grapevine Powdery Mildew. Am. J. Enol. Vitic. 2011, 62, 193–198. [Google Scholar] [CrossRef]
  21. Bertamini, M.; Faralli, M.; Varotto, C.; Grando, M.; Cappellin, L. Leaf Monoterpene Emission Limits Photosynthetic Downregulation under Heat Stress in Field-Grown Grapevine. Plants 2021, 10, 181. [Google Scholar] [CrossRef]
  22. Zandalinas, S.I.; Mittler, R. Plant responses to multifactorial stress combination. New Phytol. 2022, 234, 1161–1167. [Google Scholar] [CrossRef] [PubMed]
  23. Faralli, M.; Lawson, T. Natural genetic variation in photosynthesis: An untapped resource to increase crop yield potential? Plant J. 2020, 101, 518–528. [Google Scholar] [CrossRef] [PubMed]
  24. Faralli, M.; Bontempo, L.; Bianchedi, P.L.; Moser, C.; Bertamini, M.; Lawson, T.; Camin, F.; Stefanini, M.; Varotto, C. Natural variation in stomatal dynamics drives divergence in heat stress tolerance and contributes to the seasonal intrinsic water-use efficiency in Vitis vinifera (subsp. sativa and sylvestris). J. Exp. Bot. 2021, 73, 3238–3250. [Google Scholar] [CrossRef] [PubMed]
  25. Costa, J.M.; Ortuño, M.F.; Lopes, C.M.; Chaves, M.M. Grapevine varieties exhibiting differences in stomatal response to water deficit. Funct. Plant Biol. 2012, 39, 179–189. [Google Scholar] [CrossRef]
  26. Palliotti, A.; Silvestroni, O.; Petoumenou, D. Photosynthetic and photoinhibition behavior of two field-grown grapevine cultivars under multiple summer stresses. Am. J. Enol. Vitic. 2009, 60, 189–198. [Google Scholar]
  27. Bertamini, M.; Muthuchelian, K.; Nedunchezhian, N. Photoinhibition of Photosynthesis in Sun and Shade Grown Leaves of Grapevine (Vitis vinifera L.). Photosynthetica 2004, 42, 7–14. [Google Scholar] [CrossRef]
  28. Serra, I.; Strever, A.; Myburgh, P.A.; Deloire, A. The interaction between rootstocks and cultivars (Vitis vinifera L.) to enhance drought tolerance in grapevine. Aust. J. Grape Wine Res. 2014, 20, 1–14. [Google Scholar] [CrossRef]
  29. Faralli, M.; Bianchedi, P.L.; Bertamini, M.; Varotto, C. Rootstock Genotypes Shape the Response of cv. Pinot gris to Water Deficit. Agronomy 2020, 11, 75. [Google Scholar] [CrossRef]
  30. Kraus, C.; Pennington, T.; Herzog, K.; Hecht, A.; Fischer, M.; Voegele, R.T.; Hoffmann, C.; Töpfer, R.; Kicherer, A. Effects of canopy architecture and microclimate on grapevine health in two training systems. Vitis 2018, 57, 53–60. [Google Scholar]
  31. de Orduña, R.M. Climate change associated effects on grape and wine quality and production. Food Res. Int. 2010, 43, 1844–1855. [Google Scholar] [CrossRef]
  32. Jones, G.V.; White, M.A.; Cooper, O.R.; Storchmann, K. Climate Change and Global Wine Quality. Clim. Change 2005, 73, 319–343. [Google Scholar] [CrossRef]
  33. Coombe, B.G. Distribution of solutes within the developing grape berry in relation to its morphology. Am. J. Enol. Vitic. 1987, 38, 120–127. [Google Scholar]
  34. Keller, M. The Science of Grapevines; Academic Press: Cambridge, MA, USA, 2020. [Google Scholar]
  35. Duchêne, É.; Dumas, V.; Butterlin, G.; Jaegli, N.; Rustenholz, C.; Chauveau, A.; Bérard, A.; Le Paslier, M.C.; Gaillard, I.; Merdinoglu, D. Genetic variations of acidity in grape berries are controlled by the interplay between organic acids and potassium. Theor. Appl. Genet. 2020, 133, 993–1008. [Google Scholar] [CrossRef]
  36. Bergqvist, J.; Dokoozlian, N.; Ebisuda, N. Sunlight exposure and temperature effects on berry growth and composition of Cabernet Sauvignon and Grenache in the Central San Joaquin Valley of California. Am. J. Enol. Vitic. 2001, 52, 1–7. [Google Scholar]
Figure 1. Dynamic of environmental conditions during 2019 and 2020. Average monthly temperature (A), cumulative monthly precipitation (B), and average monthly radiation (C). (D) An example of the application of shoot bundling or topping.
Horticulturae 08 00679 g001
Figure 2. Area of primary leaves (A), area of secondary leaves (B), total canopy area per plant (C), and plant productivity kg/m2 (D) in plants subjected to shoot topping or shoot bundling (no ST) where secondary shoots were either removed (secondary shoot removal) or not (no SSR) (n = 24). In the graphs, points represent raw data, horizontal lines within boxes indicate the median, and boxes indicate the upper (75%) and lower (25%) quartiles. Whiskers indicate the ranges of the minimum and maximum values. Data were analyzed with two-way ANOVA and p-values are shown in the graph (ST—shoot topping factor; SR—secondary removal factor; ST × SR—interaction).
Horticulturae 08 00679 g002
Figure 3. Gaps (A), interior leaves (B), and leaf layers (C) in plants subjected to shoot topping or shoot bundling (no ST) where secondary shoots were either removed (secondary shoot removal) or not (no SSR) (n = 24). In the graphs, points represent raw data, horizontal lines within boxes indicate the median, and boxes indicate the upper (75%) and lower (25%) quartiles. Whiskers indicate the ranges of the minimum and maximum values. Data were analyzed with two-way ANOVA while leaf position was evaluated as single factor with one-way ANOVA. p-values are shown in the graph (ST—shoot topping factor; SR—secondary removal factor; ST × SR—interaction).
Horticulturae 08 00679 g003
Figure 4. Maximum quantum yield of PS II in dark-adapted samples collected in 2020 with a PAM 2000 on the north- and south-exposed side of the row (A) and collected in 2019 with the HandyPEA (B) for plants subjected to shoot topping or shoot bundling (no ST) where secondary shoots were either removed (secondary shoot removal) or not (no SSR) (n = 24). (C) The dynamic of leaf temperature collected in 2019. In the graphs, points represent raw data, horizontal lines within boxes indicate the median, and boxes indicate the upper (75%) and lower (25%) quartiles. Whiskers indicate the ranges of the minimum and maximum values. Data were analyzed with three- (2020) and two-way (2019) ANOVA. p-values are shown in the graph (ST—shoot topping factor; SR—secondary removal factor; ST × SR—interaction).
Horticulturae 08 00679 g004
Figure 5. Total soluble solids (TSS, (A)), titratable acidity (B), must pH (C), tartaric acid (D), malic acid (E), total anthocyanins (F), yeast available nitrogen (G), and total polyphenols (H) in plants subjected to shoot topping or shoot bundling (no ST) where secondary shoots were either removed (secondary shoot removal) or not (no SSR) (n = 24). In the graphs, points represent raw data, horizontal lines within boxes indicate the median, and boxes indicate the upper (75%) and lower (25%) quartiles. Whiskers indicate the ranges of the minimum and maximum values. Data were analyzed with three-way ANOVA and p-values are shown in the graph (ST—shoot topping factor; SR—secondary removal factor; ST × SR—interaction).
Horticulturae 08 00679 g005
Table 1. Effect of shoot topping application and secondary removal on shoot number per plant, bunch number per plant, bunch weight per plant, mean bunch weight, pruning wood, Ravaz index, and fertility collected in 2019 and 2020. Data are means (n = 24). Data were analyzed with three-way ANOVA to assess interactions between years (ST—shoot topping factor; SR—secondary removal factor; Y—Year). p-value is shown in the text while ns express non-significant differences (p > 0.05). Different letters represent significant differences between treatments according to Tukey’s test.
Shoot Number per PlantBunch Number per PlantBunch Weight per Plant (kg)Mean Bunch Weight (g FW)Pruning Wood (g FW)Ravaz IndexFertility
2019Shoot toppingSSR9.7111.92 b3.16 b271.920.72 bc4.49 bc1.25 b
No SSR9.5411.08 b2.92 b272.520.69 bc4.37 bc1.18 b
No shoot toppingSSR9.7912.50 b3.23 b264.320.77 ab4.43 bc1.30 b
No SSR9.3311.71 b3.11 b272.040.85 ab3.92 c1.29 b
2020Shoot toppingSSR9.7017.39 a4.18 a252.400.60 c7.17 a1.78 a
No SSR9.6118.70 a4.79 a256.170.73 bc6.82 a1.94 a
No shoot toppingSSR9.7117.92 a4.44 a249.210.83 ab5.39 b1.85 a
No SSR9.2917.88 a4.66 a263.060.92 a5.34 b1.94 a
p-valueSTnsnsnsns<0.001<0.001ns
SRnsnsnsns0.015nsns
Yns<0.001<0.001nsns<0.001<0.001
ST × SRnsnsnsnsnsnsns
ST × Ynsnsnsnsns0.003ns
SR × Ynsnsnsnsnsnsns
ST × SR × Ynsnsnsnsnsnsns
Table 2. Effect of bunch exposure on berry temperature and quality parameters of the must: total soluble solids (TSS), must pH, titratable acidity, tartaric acid, malic acid, yeast available nitrogen, total anthocyanins, and total polyphenols collected in 2020 and for south- or north-exposed bunches. Data are means (n = 3). Data were compared with t-test.
Bunch ExposureBerry Temperature (°C)TSS (Brix°)pHTotal AcidityTartaric AcidMalic AcidPotassium (g L−1)Yeast-Assimilable N (mg L−1)Anthocyanins (mg L−1)Polyphenols (mg L−1)
(g L−1)(g L−1)(g L−1)
South35.2723.553.444.27.21.391.9635.33348.67529.33
North29.1422.073.294.637.211.431.7621.33481.33645.33
p-value0.0010.0550.0040.0070.4670.3940.0330.0650.0280.015
Publisher’s Note: MDPI stays neutral with regard to jurisdictional claims in published maps and institutional affiliations.

