Article

Root Morphological and Physiological Adaptations to Low Phosphate Enhance Phosphorus Efficiency at Melon (Cucumis melo L.) Seedling Stage

Key Laboratory of Urban Agriculture (South), Ministry of Agriculture, School of Agriculture and Biology, Shanghai Jiao Tong University, Shanghai 200240, China
*
Author to whom correspondence should be addressed.
Horticulturae 2022, 8(7), 636; https://doi.org/10.3390/horticulturae8070636
Submission received: 3 June 2022 / Revised: 7 July 2022 / Accepted: 12 July 2022 / Published: 14 July 2022

Abstract

:
The high phosphorus (P) acquisition ability of crops can reduce their dependence on artificial inorganic phosphate (Pi) supplementation under Pi-limited conditions. Melon (Cucumis melo L.) is vulnerable to Pi deficiency. This study was carried out to explore the morphological and physiological responses of melon to low-Pi stress under a hydroponic system. The results show that low-Pi stress significantly disturbed nutrient homeostasis, reduced P content, and resulted in iron accumulation in melon seedlings and brown iron plaque formation on the root surface. A nutrient pool of P and Fe formed on the roots to forage for more Pi under low-Pi conditions. Severe long-term low-Pi stress promoted primary root elongation and inhibited lateral root growth, which increased the longitudinal absorption zone of the roots. The decrease in P content of the roots upregulated the expression of the acid phosphatase (APase) gene and increased APase activity. The high-affinity phosphate transporter (Pht1) genes were also upregulated significantly. These morphological and physiological responses significantly increased Pi uptake rate and P utilization efficiency at the melon seedling stage. These findings will be useful for screening low-Pi-tolerant varieties and sustaining melon production in P-limited environments.

1. Introduction

Phosphorus (P) is a structural element of nucleic acids and phospholipids, and hence is a key component of energy transfer reactions and signal transduction events of all life on Earth [1]. Therefore, even marginal P deficiency has a crucial impact on plant growth and development. Although total P content in soils is large, only a small fraction is available for biological utilization. It is either bound to incompletely weathered mineral particles, adsorbed on mineral surfaces, or made unavailable by secondary mineral formation (occluded P) [2]. It has been reported that Pi deficiency covered almost 30% of the global cropland area in the 2010s [3]. This is made worse by the fact that the global P shortage will be aggravated by soil erosion [4]. Therefore, limited inorganic phosphate (Pi) availability is considered one of the greatest obstacles in agricultural production. In the last few decades, the amount of fertilizer applied has dramatically increased, resulting in the consumption of approximately 50 million tons of Pi fertilizer annually [5]. Although Pi fertilizer is used worldwide for improved crop yield, only 15–30% of applied P fertilizer is absorbed by the target plants [6]. Major P loss from agricultural systems has caused many problems, such as eutrophication of terrestrial systems [7]. It is predicted that the world’s P mineral resources will be depleted in several decades [8]. Therefore, growth and development in low-Pi environments will be a common challenge for crops.
Plants have evolved various morphological, physiological, and biochemical adaptations to improve Pi acquisition and utilization under Pi-deficient conditions [9,10]. Modifications to root architecture, organic acid, acid phosphate exudation, and root–microbial symbioses can aid plants in forging for Pi under low-Pi conditions [11,12]. In Arabidopsis, of 73 accessions originating from a wide range of habitats, one-half were reported to have a reduced primary root and fewer lateral roots, and 25% were not responsive to phosphate availability when phosphate-starved [13]. The secretion of large amounts of organic acid by the proteoid roots of Pi-deficient white lupin (Lupinus albus L.) is an efficient strategy for chemical mobilization of sparsely available P in the rhizosphere [14]. In addition, rice (Oryza sativa L.) grows well by inducing root elongation [15], the acidification in the rhizosphere, and increasing root exudation of low-molecular-weight organic anions under Pi-deficient conditions [16]. It has also been reported that P-efficient genotypes secreted higher amounts of organic acids, serving either as nutrients for rhizobacteria, or being involved in P solubilization, in beans (Phaseolus vulgaris L.) [17]. Furthermore, P deficiency in beans leads to decreased root growth angles and shallower root systems [18]. The P-efficient maize (Zea mays L.) genotype has a better adaptation to low-Pi conditions by altering the exudation of citric acid and P uptake rate [19]. Transcriptomic and proteomic studies have identified many genes and proteins affected directly by Pi deficiency in plants [20,21]. However, most studies have focused on the roots of model crop species, such as Arabidopsis, rice, and white lupin [22,23,24].
Melon (Cucumis melo L.) is a popular horticulture crop worldwide, with 27.5 million tons produced annually [25]. It is cultivated widely in tropical and subtropical areas, where Pi deficiency is common. P plays an important role in melon vegetative growth and fruit formation. Several melon species were screened for variations in root architecture due to Pi deficiency, and it was found that the accessions, which had larger and more branched roots, had more efficient P uptake [26]. Soon afterward, a few P-responsive genes, Cm-PAP10.1, Cm-PAP10.2, Cm-RNS1, Cm-PPCK1, Cm-SQD1, Cm-DGD1, and Cm-SPX2, were reported to be upregulated under Pi starvation conditions [27]. Although these findings have been reported in melon species, other physiological responses, and the expression of phosphate transporter genes under Pi-deficient environments are still ambiguous in melons.
In the present research, we carried out three levels of phosphate treatments on a cultivar that is tolerant to Pi deficiency under hydroponic cultivation conditions. This study aimed to explore two factors: (1) the effects of low-Pi stress on melon growth and nutrition homeostasis; and (2) the morphological and physiological adaptations induced by low-Pi stress in the melon root. Based on our analysis, we expect that the experimental results of this study may offer some new insights into the adaption of melon seedlings to Pi deficiency. It may help melon breeders to screen and breed new P-efficient melon cultivars and other closely related crops.

2. Materials and Methods

2.1. Plant Materials and Experimental Design

2.1.1. Experiment 1: Low-Pi Stress Test

The melon cultivar ‘Lvtianshi’ was selected because it is widely planted south of the Yangtze River in China, where Pi deficiency is common. This melon cultivar was tolerant of Pi deficiency in the cultivar screening test. Hydroponic experiments were conducted in the greenhouse of Shanghai Jiao Tong University. Uniform seedlings with fully expanded cotyledons were transplanted into 15 L shallow-mouth plastic trays (40 plants per tray) filled with 10 L half-strength modified Hoagland’s nutrient solution. The nutrient solution consisted of 3 mM KNO3, 2.5 mM Ca(NO3)2, 1.0 mM MgSO4·7H2O, 25 μM KCl, 12.5 μM H3BO3, 1 μM MnSO4, 1 μM ZnSO4, 0.25 μM CuSO4, 0.25 μM H2MoO4, and 13.4 μM FeSO4/Na2EDTA, with a pH of 6.4 ± 0.2. Based on the previous research and preliminary experiments, 0.025 mM (P0.025) and 0.001 mM (P0.001) KH2PO4 were selected as the doses for low-Pi treatments, whereas the control (CK) was 0.25 mM (P0.25) KH2PO4 [28]. Low-Pi media were prepared by substituting K2SO4 for KH2PO4, such that the concentration of K in the media was 3 mM for all treatments. There were seven trays per biological replicate, with three replicates per treatment. The nutrient solutions were refreshed every 3 days (d), and the trays were also rearranged randomly. The plants were cultivated in a growth cabinet with 28 °C/18 °C day/night temperature, 14 h light/10 h dark, and relative humidity of 50–75%. The experiment was established as a completely randomized design. At 0 h, 12 h, 1 d, 2 d, 4 d, 7 d, and 14 d after treatment, samples were harvested and prepared for morphological, physiological, and biochemical assays, with at least three subsamples per assay.

2.1.2. Experiment 2: Short-Term Phosphate Absorption Test

To explore the effect of the adaptations on phosphate absorption, short-term absorption tests were carried out at 7 d and 14 d after low-Pi stress. Three seedlings per treatment were selected. Each sample was rinsed carefully several times with tap water, distilled water, and ultrapure water, in turn, to remove nutrient residues. Then, the seedling roots were placed into the brown jars filled with 100 mL of P0.25 nutrient solution, with one seedling per jar. The shoots were exposed to natural light, and the jars were tightly sealed with tinfoil. The roots absorbed the nutrients for 4 h under natural growth conditions from 10:00 a.m. to 2:00 p.m. The roots were removed from the jars. The remaining nutrient solutions were supplemented with deionized water to 100 mL. The original nutrient solutions and nutrient solutions supplemented with deionized water were collected for subsequent determination.

2.2. Measurement of Shoot Morphological Indicators

Plant height (cm) was measured using vernier calipers (530-101 N15, Mitutoyo, Japan). Leaf area (cm2) was calculated via ImageJ (ImageJ 1.48, Bethesda, MD, USA).

2.3. Measurement of Dry Weight and the Root: Shoot Ratio

The harvested plant samples were separated into shoots and roots at the root–hypocotyl junction, and dried at 70 °C to a constant weight [29]. The dry weights (DW, mg) of the shoots and roots were measured with an electronic balance (Auy120, Shimadzu, Japan). The root: shoot ratio was calculated as the ratio of root dry weight to shoot dry weight.

2.4. Measurement of Root Morphology Traits

The roots were first scanned to produce an image (Epson Perfection V700 Photo scanner, Epson, Japan). The total root length (TRL, cm), surface area (SA, cm2), volume (V, cm3), average diameter (D, mm), primary root length (PRL, cm), and first-order lateral root zone length (LRZL, cm) were analyzed using WinRHIZO (Regent Instruments Inc., Sainte-Foy, QC, Canada).

2.5. Measurement of Nutrient Element Content

The contents of P, K, Ca, Fe, and S (mg g−1 DW) were determined by inductively coupled plasma atomic emission spectroscopy (ICP 7600, Thermo Fisher Scientific, Waltham, MA, USA) after digestion in a mixture consisting of 65% (v/v) HNO3 and 72% (v/v) HClO4 (5:1, v/v) at 220 °C in a microwave oven [30]. The N content (mg g−1 DW) was determined using an elemental analyzer (Vario EL Cube, Elementar, Hanau, Germany).

2.6. Measurement of Acid Phosphatase Activity and Root Vitality

Acid phosphatase (APase) activity in the root (mg g−1 DW h−1) and rhizosphere (mg g−1 FW h−1) was measured using the disodium p-nitrophenyl phosphate method [31]. The spectrophotometric assay was carried out at pH 5.5 and 20 °C. The enzyme concentration and incubation time (15 min) were adjusted to optimize the reaction to the linear portion of the produced standard curve. Activity was quantified by comparing the absorption at 410 nm to a standard curve of diluted p-nitrophenol solutions and NaOH.
Root vitality (µg g1 FW h1) was measured using the triphenyl tetrazolium chloride (TTC) method, with some modifications [32]. Briefly, root samples (0.5 g) were immersed in 10 mL of an equal mixture of 0.4% TTC solution and phosphate-buffered solution, and incubated in the dark at 37 °C for 1–3 h. The reaction was terminated with 2 mL 1 mM sulfuric acid. The roots were taken out, and any water on the root surfaces was blotted away. The roots were ground with 3 mL ethyl acetate, and finally brought to a volume of 10 mL. The absorbance was measured at 485 nm relative to a blank. The reduction in tetrazolium was obtained by checking against the standard curve. Root vitality was expressed by the reduction in intensity of tetrazolium per unit root fresh weight (FW) per hour.

2.7. Gene Expression Analysis

The gene expression patterns of the APase and PHT1 families were analyzed using the quantitative real-time polymerase chain reaction (qRT-PCR) [33]. Root samples were collected from 0 h to 14 d after low-Pi treatment. RNA was extracted by plant RNA isolation reagent (Tiangen Biotech, Beijing, China), and cDNA was synthesized using PrimeScriptTM RT Master Mix. Quantitative RT-PCR was performed using a SYBR® Premix Ex TaqTM Kit (Tiangen Biotech, China) with a Roche LightCycler 96 real-time PCR machine (Roche, Basel, Switzerland) with six replicates. Relative quantification of gene expression levels was conducted as described previously using the 2−ΔΔCt method [34]. Actin was employed as an internal control [35,36]. The primers used for qRT-PCR are listed in Table 1.

2.8. Calculation of Pi Uptake Rate and P Utilization Efficiency

The Pi uptake rate (PUR) was calculated according to the change in the P concentration before and after absorption using a modified form of a previously described method [37].
PUR (µg Pi cm−1 TRL h−1) = (C1 − C2) × v/(TRL × t)
Here, C1 is the Pi concentration of the original nutrient solution, and C2 is the Pi concentration of the nutrient solutions supplemented with deionized water after the short-term absorption test. The v is the total nutrient solution volume of 100 mL. TRL is the total length of a root, and t is the uptake time.
P utilization efficiency (PUE) refers to the amount of biomass produced per unit increase in P nutrition [38].
PUE (g DW mg−1 P) =ΔDW/ΔP
Here, DW is the dry weight of the plant, and ΔDW is the increase in dry weight per unit of time. P is the P content in the plant, and ΔP is the increase in P content per unit of time.

2.9. Statistical Analyses

Statistical analysis was performed in SPSS Statistics 22.0 (IBM, Chicago, IL, USA). The means were analyzed using one-way ANOVA with Tukey’s test (p < 0.05). All figures were drawn with OriginPro 2016 (OriginLab, Northampton, MA, USA).

3. Results

3.1. Growth of Melon Seedlings under Low-Pi Stress

The morphological parameters of the melon seedlings with different low-Pi treatments are shown in Figure 1. After 7 days of low-Pi treatment, there was no significant difference in plant height (Figure 1A), leaf area (Figure 1B), or shoot DW (Figure 1C) among treatments. However, the root DW under P0.001 was significantly higher than CK and P0.025 (Figure 1D). The root: shoot ratio under P0.001 was significantly higher than CK and P0.025 (Figure 1E). At 14 d of low-Pi stress, the plant heights under P0.025 and P0.001 were significantly lower than that of the control. There was no significant difference in leaf area, root DW, shoot DW, or root: shoot ratio between P0.025 and CK. These results indicate that mild low-Pi stress did not inhibit the growth of melon seedlings. Compared with CK, the leaf area and the DW of roots and shoots were significantly reduced under P0.001. The root: shoot ratio under P0.001 was significantly increased compared with CK, suggesting that the growth of shoots and roots was inhibited by P0.001; root growth was slightly less inhibited than shoots.

3.2. Nutrient Homeostasis in Melon Seedlings under Low-Pi Stress

The element contents in roots (r) and shoots (s) were measured under different treatments (Table 2). At 7 d of low-Pi stress, the total P content of CK was significantly higher than that of the low-Pi stress, and the P content in the shoots (Ps) was higher than that in the roots (Pr). Pr was slightly higher than Ps under P0.001. Fer under P0.025 and P0.001 was higher by 87.3% and 33.8%, than CK, respectively. This result indicates that the low-Pi stress promoted the absorption of iron. In addition, Fes under P0.001 was significantly higher than under P0.025 and CK by 37.0% and 30.2%, respectively, suggesting that P0.001 promoted iron transport to the shoots. At 7 d of treatment, there was no significant difference in the nitrogen content of shoots (Ns) and roots (Nr) among the treatments. Sr and Cas under P0.001 were significantly lower than under P0.025 and CK. Overall, P0.025 decreased the P content without affecting the content of other elements. However, P and Cas content under P0.001 were signally lower than CK at 7 d of low-Pi stress.
At 14 d of low-Pi stress, more P was stored in the roots and less P was exported to the shoots under low-Pi treatment conditions. Under P0.025, Fer and Sr were markedly higher than CK. The Ns and Nr under P0.001 were significantly lower than when under CK or P0.025 conditions. Fer and Fes under P0.001 were higher than CK. Low Pi promoted the absorption of Fe; this may be one of the adaptations by which melon seedlings are adapted to low-Pi stress. The Nr, Kr, and Car showed no obvious difference between CK and P0.025. However, it was revealed that 25 μM was a P concentration sufficient for melon seedling growth. The Ns, Ss, and Ks contents under P0.001 were significantly lower than under CK and P0.025, and Kr and Car were significantly higher than in CK. This indicates that low-Pi disturbed the nutrient homeostasis in melon plants. P0.025 and P0.001 stress reduced the P content, whereas P0.001 also affected the contents of other nutrient elements in melon seedlings.

3.3. Root Morphology Changes under Low-Pi Stress

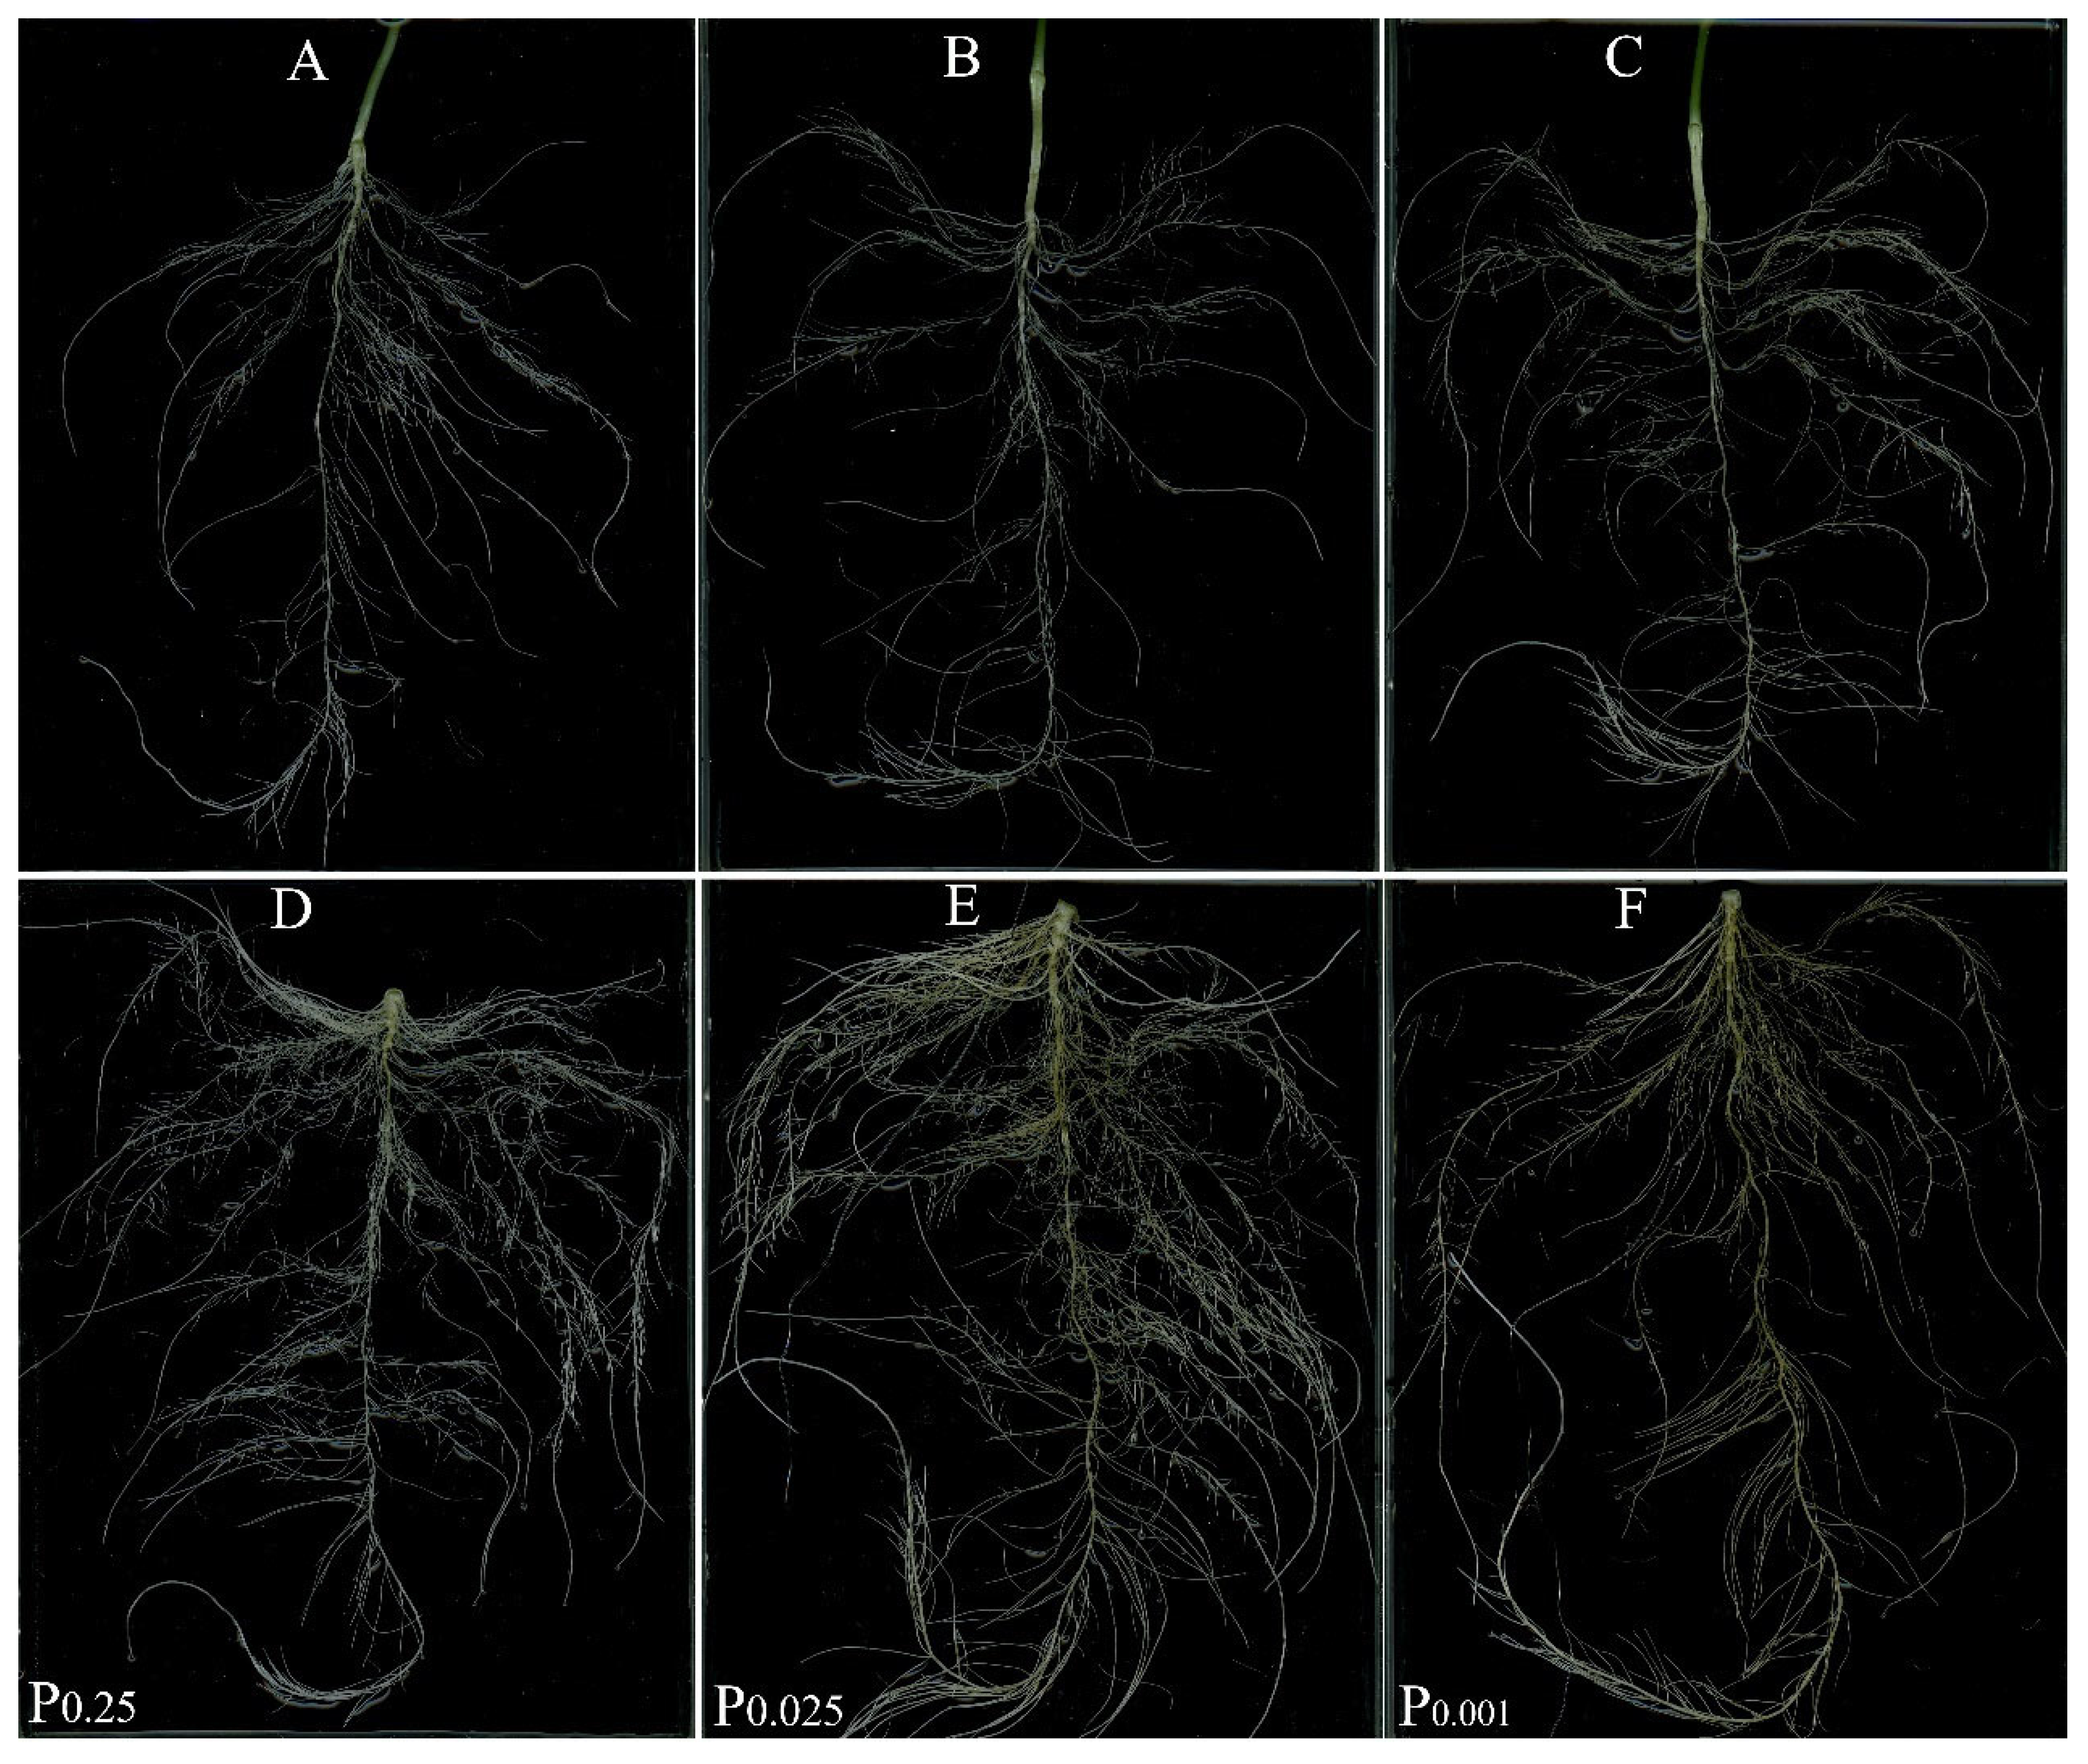
Root morphology changed under low-Pi stress (Figure 2 and Table 3). At 7 d of low-Pi treatment, P0.001 significantly promoted root growth. The total length (TRL), surface area (SA), volume (V), and average diameter (D) were significantly higher than in the CK and P0.025 treatments (Table 3). However, no obvious differences in the primary root length (PRL) and first-order lateral root zone length (LRZL) were found among treatments. With prolonged stress, TRL, SA, V, and D of the roots under P0.001 were significantly lower than under CK and P0.025 at 14 d. Low-Pi stress significantly promoted the elongation of the primary root. PRL under P0.025 and P0.001 increased by 15.0% and 29.6% compared with CK, respectively. Severe, long-term low-Pi stress induced primary root elongation and inhibited lateral root growth.
In addition, a reddish-brown iron plaque on the melon root began to form after low-Pi stress for 7 d (Figure 2C). The thickness of the iron plaque continuously increased with the prolonged stress time (Figure 2E,F). Fe deposition on the melon root was confirmed under low-Pi treatment.

3.4. Gene Expression and Activity of Acid Phosphatase (APase) under Low-Pi Stress

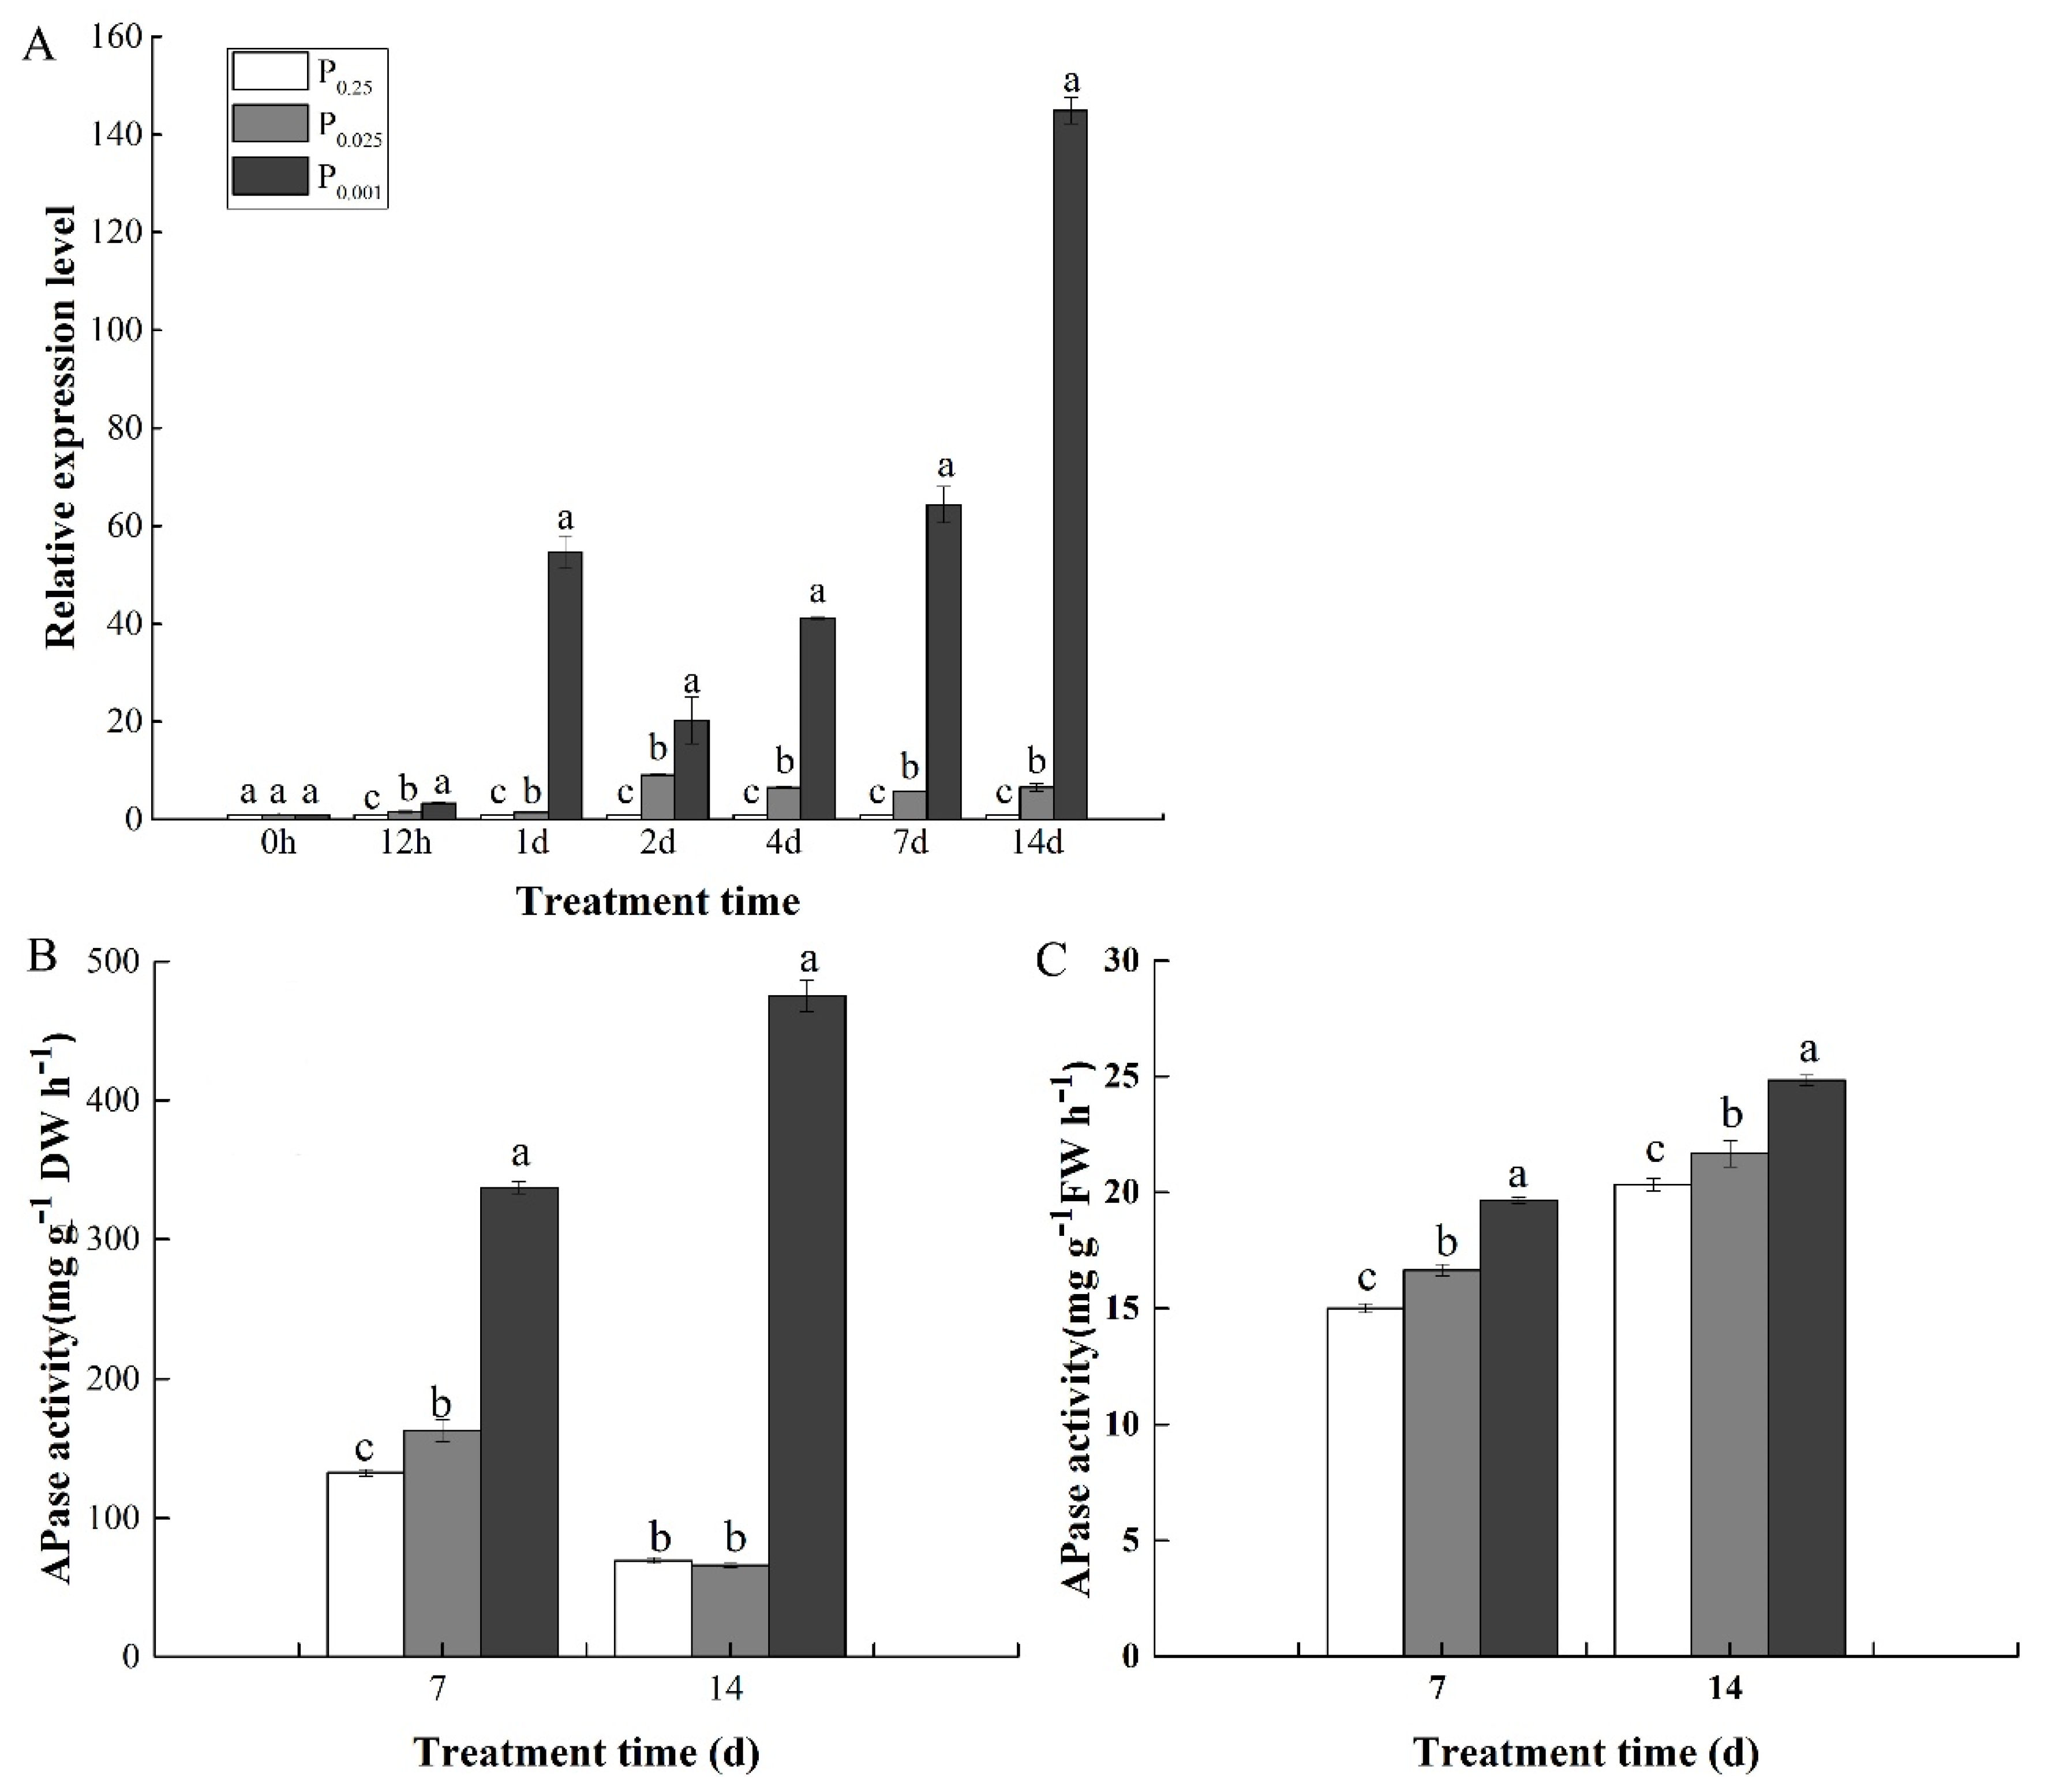
The expression level of the APase gene in roots was measured at different time points (Figure 3A), and we found that 12 h of low-Pi treatment significantly induced the expression of the APase gene. In addition, the expression level of the APase gene significantly increased with the prolongation of low-Pi stress, especially under P0.001 stress.
To further validate the induction of APase by low-Pi stress, the activity of APase was measured outside (secreted) and inside the roots (Figure 3B,C). The results show that the APase activity was significantly higher under low-Pi stress than CK. The secreted APase activity under P0.001 was markedly higher than CK and P0.025 at the 7th day of treatment. However, there were no significant differences between P0.025 and CK at 14 d of treatment. The activity of secreted APase under P0.001 was 6.8-fold higher that in CK. With the prolongation of P0.001 stress, the secreted APase activity increased. The root APase activity was significantly higher under low-Pi stress than CK, and increased with prolonged stress. In summary, the APase activity corresponded to its gene expression in the roots.

3.5. Expression of High-Affinity Phosphate Transporter Genes under Low-Pi Stress

The expression levels of PHT1;3, PHT1;4, and PHT1;7 in the roots at different time points of low-Pi stress were determined. As shown in Figure 4, the transcript level of PHT1;3 was positively correlated with the degree of low-Pi stress; for example, P0.001 rapidly induced the expression of PHT1;3 (Figure 4A). The expression level of PHT1;4 under P0.025 was significantly higher than CK at 2 d, 4 d, 7 d, and 14 d. At 12 h, 1 d, 2 d, 4 d, 7 d, and 14 d, the expression level of PHT1;4 under P0.001 was 2.0-, 5.5-, 4.8-, 14.2-, 6.7-, and 37.2-fold greater than for CK, respectively (Figure 4B). The expression level of PHT1;7 was significantly lower under P0.025 than CK at 12 h, 1 d, and 4 d. At 7 d and 14 d, the PHT1;7 expression level was markedly higher than CK. The expression of PHT1;7 was significantly higher under P0.001 than CK at 1 d, 2 d, 4 d, 7 d, and 14 d after treatment (Figure 4C).

3.6. Root Vitality under Low-Pi Stress

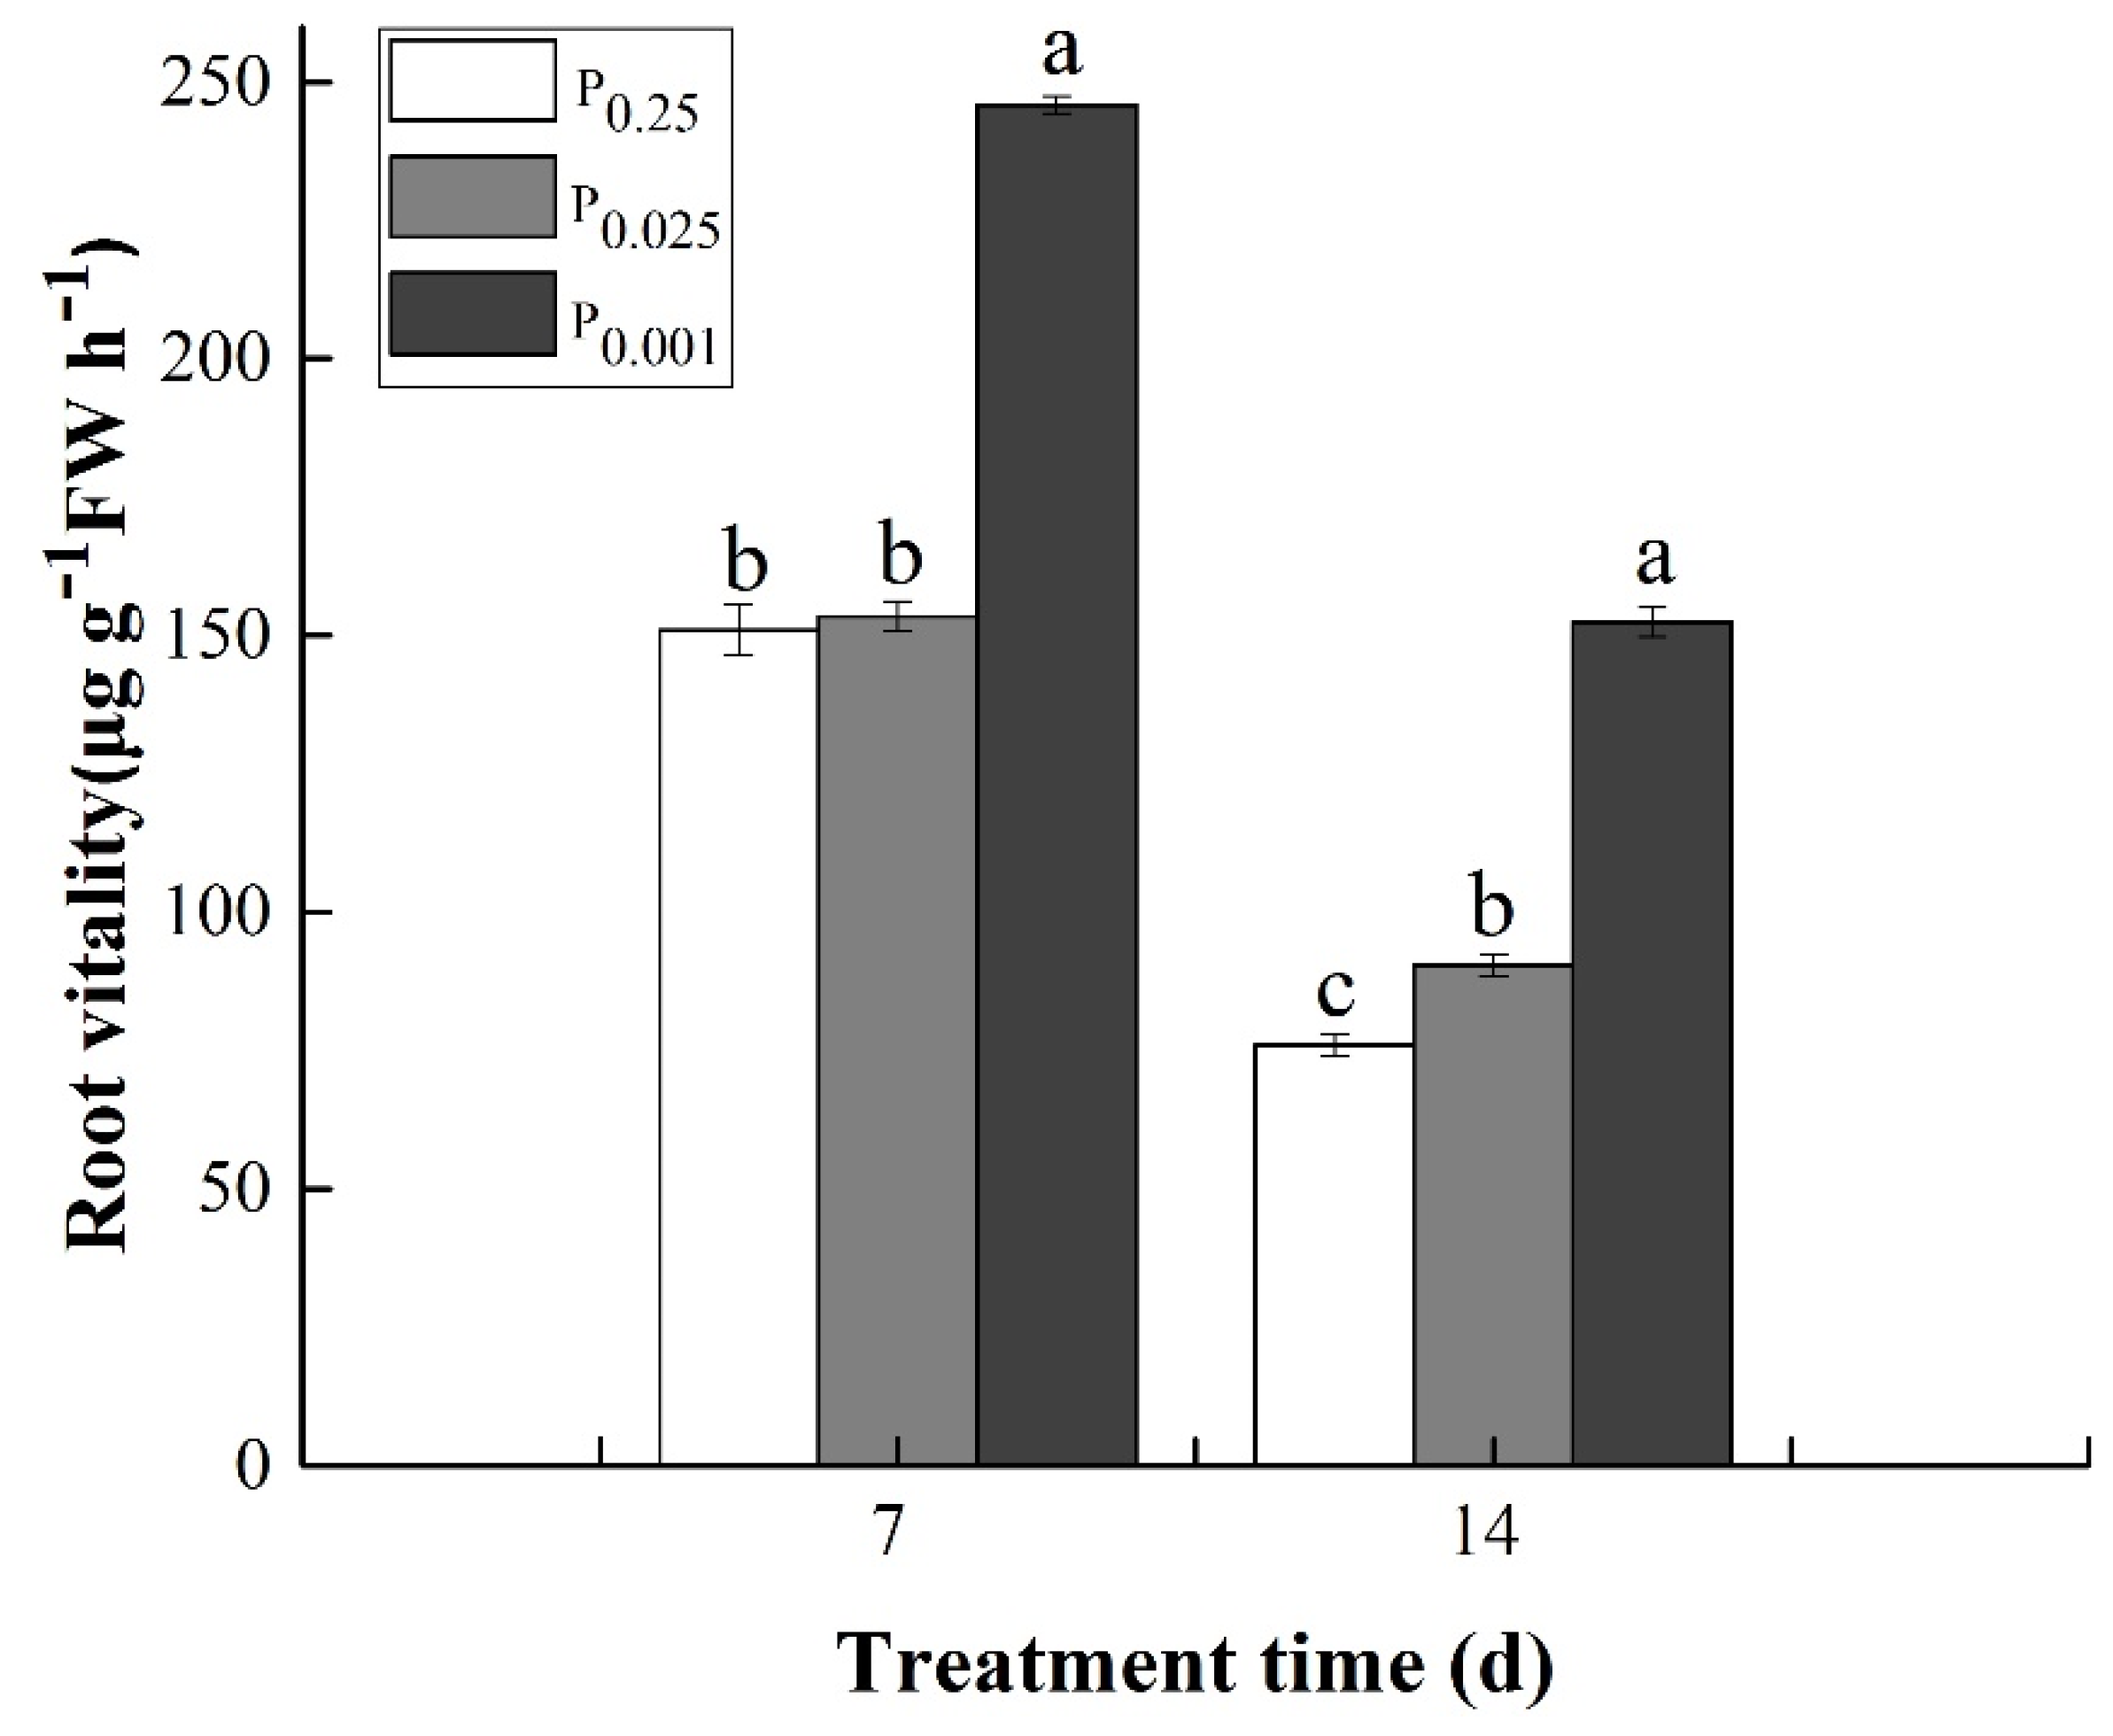
The root vitality of the melons varied under different low-Pi treatments (Figure 5). At 7 d of treatment, the root vitality of P0.001 was 1.6 times more than that of CK, and there were no significant differences between P0.025 and CK. The root vitality under P0.025 and P0.001 was 1.2 and 2.0 times more than that of CK at 14 d of treatment, respectively. These results indicate that low-Pi stress significantly increased the root vitality of melon seedlings.

3.7. PUR and PUE under Low-Pi Stress

To investigate the effect of low-Pi adaptations on phosphate uptake and utilization by the roots, short-term PUR and PUE values were determined (Table 4). Low-Pi stress significantly increased the PUR. At 7 d of low-Pi stress the PUR was significantly higher under P0.001 and P0.025 than CK. The PUR was 1.2-fold greater than CK under P0.001 at 14 d of low-Pi stress. The PUE significantly increased under low-Pi. PUE under P0.001 and P0.025 was 7.0- and 1.9-fold greater than CK, respectively, at 7 d of low-Pi stress. PUE under P0.001 and P0.025 was 12.0- and 3.2-fold greater than CK at 14 d after low-Pi stress. These results indicate that the adaptations of melon roots to low-Pi stress were beneficial to Pi uptake and utilization.

4. Discussion

Phosphorus uptake and utilization directly affects crop growth and development. To improve the efficiency of phosphate uptake and utilization under low-Pi conditions, melon seedlings exhibited a series of adaptive responses, such as an increase in the primary root length, root: shoot ratio, iron uptake by the roots, acid phosphate activity, and in the expression of high-affinity phosphate transporter genes. These results could lay a foundation to screen and breed P-efficient melon cultivars. New insights revealed in the present study are discussed below.

4.1. Effect of Low-Pi Stress on Nutrient Homeostasis in Melon Seedlings

Pi deficiency affected the nutrient contents in melon seedlings. Under Pi-sufficient conditions, the P content in plant tissue accounts for approximately 0.4–1.5% of the dry weight [40]. The P content ranging from 0.2–0.4% under P0.001 was significantly lower than the 1.0–1.4% content under CK (Table 2). P0.001 decreased the contents of Ns, Ks, Cas, and Ss. The reduced absorption of macronutrients might be caused by low sink demand and limited leaf expansion under low-Pi (Figure 1B,C) [39,41,42].
Low-Pi stress brought about Fe accumulation in melon plants. Similarly, depleting Pi in the medium results in a significant increase in Fe content in Arabidopsis and rice [43,44]. It has been reported that low-Pi triggers the molecular responses related to iron transport, homeostasis, and accumulation in Arabidopsis [45]. Interestingly, the brown iron plaque formed on the root surface (Figure 2E), which has also been confirmed in rice [44]. However, the brown iron plaque gradually disappeared after the melon seedlings in the Pi-depleted medium were transplanted to the Pi-sufficient medium (data unpublished). The brown iron plaque under P starvation on rice roots is a chemical reaction process induced by root activity [46]. Our results also support this view. The root vitality under severe low-Pi stress was significantly higher than CK (Figure 5). This is beneficial for the oxidation of ferrous iron to ferric iron, and the precipitation of ferric oxide on the root surface. Oxidized Fe compounds have high capacities for P binding. The iron plaque is an amphoteric colloid with special electrochemical properties and a large surface area, which can adsorb or coprecipitate various nutrients and heavy metal elements [47,48]. Thus, it serves as a nutrient reservoir of rhizosphere P, slowly releasing P into the root for plant absorption. It has been reported that the P contents in plant roots are significantly correlated with the amount of Fe plaque [46]. However, the mechanism of the Fe plaque in the P uptake process is still unclear, and needs to be researched further.

4.2. The Longer Primary Root Was Induced by Low-Pi Stress in Melon Seedlings

Plants alter the growth and development of roots to form a root system whose architecture is best suited to foraging for mineral nutrients under nutrient-deficient conditions [49]. Low-Pi stress induced changes in root morphology of melon seedlings. Severe low-Pi stress at 7 d and moderate low-Pi stress at 14 d markedly promoted the root length, root surface area, and root volume to forage for more Pi and other nutrients. The lateral roots were significantly restrained in severe low-Pi stress (Figure 2F and Table 3). However, PRL was notably promoted by low-Pi stress (Figure 2F and Table 3). Pi starvation exerts dual effects in Arabidopsis; it can cause a decrease in PR growth and an increase in LR growth [50]. Pi deficiency causes a decline in taproot elongation of tobacco roots at the seedling stage [51]. However, rice has been found to display longer roots under low-P conditions [15]. Root growth was slightly enhanced a few days after Pi starvation, and was strongly reduced thereafter, in maize [52]. It has also been reported that deeply rooted genotypes produced more root biomass and higher taproot lateral branching density, which brings high root length under low-Pi stress in common beans [53]. Therefore, the adaptation of primary roots to low Pi shows species-specific and genotypic variations.
It has been reported that low Pi and Fe treatment still cause primary root lengthening, and Fe plays a small role in rice root morphological remodeling under low-Pi conditions [43]. The inhibition of primary root elongation in the Pi-deficient medium is caused by iron toxicity. However, elaborate investigations are needed to determine how the accumulated Fe affects PR growth. In addition, the regulation of Pi availability in terms of root development is complex, species-specific, and genotype-dependent, and involves interactions between the different hormone signaling pathways. Signal pathways that are activated by auxin, ethylene, cytokinin, gibberellin, strigolactone, jasmonic acid, nitric oxide, sugars, or the redox status of root meristem tissue, play an important role in the responses of the root structure to low Pi supply [23,54].

4.3. Pi Absorption and Activation under Low-Pi Conditions

In addition to reshaping root morphology to forage for nutrients, plants undergo physiological changes to promote phosphate absorption and recycling. APase and high-affinity phosphate transporters play an important role in the activation, efficient uptake, and transport of Pi under low-Pi stress [55]. Low-Pi stress induced an increase in APase activity in melon roots (Figure 3). The activity of APase secreted by roots of white lupin, cucumber, wheat, soybean, rice, peanut, and other crop species was previously found to be positively correlated with the degree of Pi deficiency [56]. However, the interaction effects on APase between P in the culture media and in the plant are unknown. It has been reported that the reduction in P concentrations in roots, the increase in APase activity, and the high expression of MfPAP1 in Pi-sufficient solution were caused by ACC [57]. Roche et al. found that plant nutrient status played a role in the signal triggering nutrient starvation responses, rather than nutrient availability in the soil [58]. We speculate that the low P level in the roots, rather than the external P level sensed by the roots, induces a change in phosphatase activity. The reduced PR further induces the expression of the APase gene, after which, the intracellular and secreted activity of APase increases.
Phosphate transporter 1 (PHT1) is a high-affinity phosphate transporter that plays a vital role in plant phosphate uptake, transport, distribution, and reuse [59,60]. The expression levels of CmPHT1;3, CmPHT1;4, and CmPHT1;7 were significantly upregulated under low-Pi stress (Figure 4), which is beneficial to improving Pi acquisition (Table 4). AtPHT1s uptake Pi both apoplastically and symplastically, accounting for about 90% in Pi-starved Arabidopsis plants [61,62]. OsPHT1;3 lines were able to take up Pi under low-Pi conditions even below 5 μM in rice [63]. Studies on Arabidopsis, rice, wheat, soybean, solanaceous plants, and other species have found that there are differences in the spatial and temporal expression patterns among members of the PHT1 family genes [64,65,66,67,68]. Most of the PHT1 genes were highly expressed in roots, especially in epidermal cells, including root hair cells, the root cap, and the outer cortex, to improve Pi uptake [69]. Some PHT1 genes are also expressed in other organs, and perform corresponding Pi transport functions [5,23,70]. However, the identification, expression patterns, and function analysis of PHT1 genes needs to be explored further in melon plants.

5. Conclusions

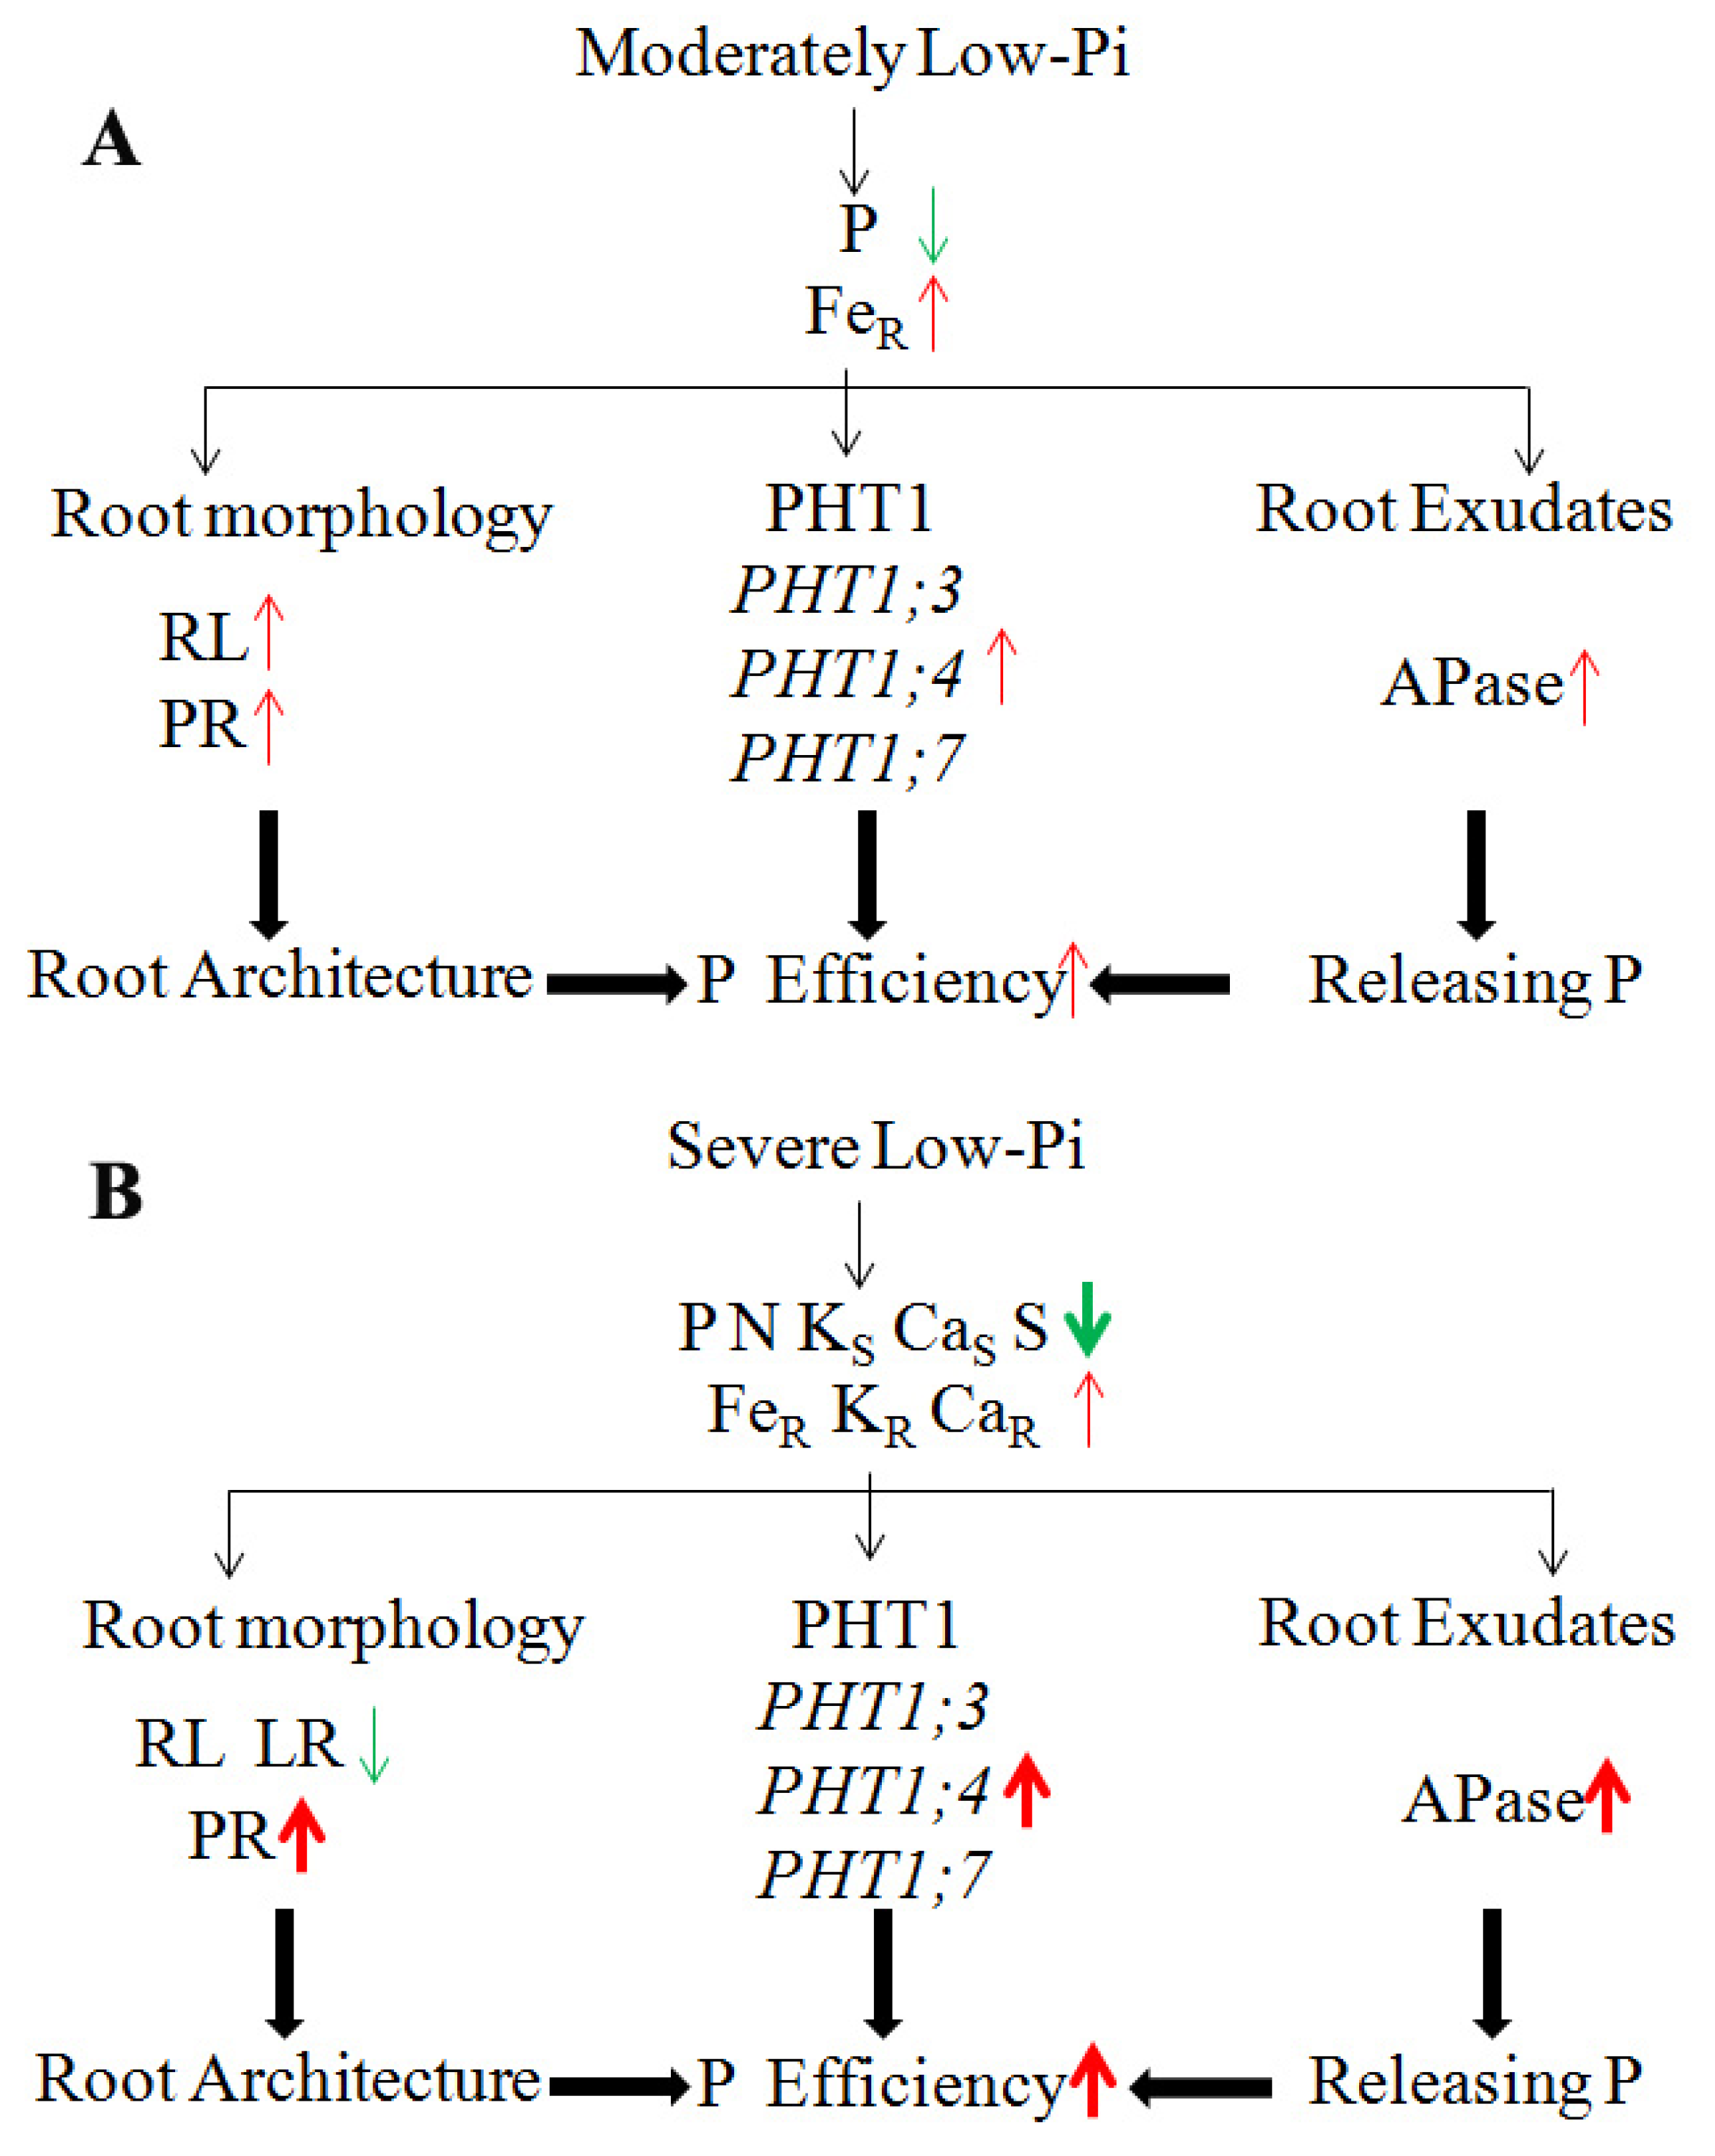
The adaptations in root morphology, physiological responses, and gene expression to low-Pi conditions were explored in a hydroponic trial at the melon seedling stage. P0.025 (moderate low-Pi stress) induced root growth and increased APase activity, and upregulated the expression of the PHT1 gene, which increased the efficiency of phosphate absorption and utilization in melon seedlings (Figure 6A). Therefore, the P content in melon seedlings was within the normal P demand range. Our results provide a theoretical basis for the reduced application of phosphate fertilizers at the melon seedling stage. Severe low-Pi stress (P0.001) disturbed nutrient homeostasis, resulting in Fe accumulation in melon seedlings, and a brown iron plaque formation on the root surface, a nutrient pool of P and Fe formed on the roots to forage for more Pi under low-Pi conditions (Figure 6B). The longer primary root was induced by low-Pi stress in melon seedlings, which increased the longitudinal absorption zone between roots and nutrients. CmPHT1;3, CmPHT1;4, and APase genes were the early response genes, and played significant roles in Pi absorption and activation. These morphological and physiological adaptations significantly increased the efficiency of Pi absorption and utilization.

Author Contributions

Conceptualization and funding acquisition, Q.N.; methodology, formal analysis, investigation, writing—original draft, writing review and editing, P.L.; supervision, project administration and data curation: J.W.; writing—review and editing: A.R. All authors have read and agreed to the published version of the manuscript.

Funding

This research was funded by the Earmarked Fund for Shanghai Modern Industry Technology Research System for Melon & Watermelon (2021).

Institutional Review Board Statement

Not applicable.

Informed Consent Statement

Not applicable.

Conflicts of Interest

The authors declare no conflict of interest.

References

  1. Rausch, C.; Bucher, M. Molecular mechanisms of phosphate transport in plants. Planta 2002, 216, 23–37. [Google Scholar] [CrossRef] [PubMed]
  2. Yang, X.; Post, W.M.; Thornton, P.E.; Jain, A. The distribution of soil phosphorus for global biogeochemical modeling. Biogeosciences 2013, 10, 2525–2537. [Google Scholar] [CrossRef] [Green Version]
  3. MacDonald, G.K.; Bennett, E.M.; Potter, P.A.; Ramankutty, N. Agronomic phosphorus imbalances across the world’s croplands. Proc. Natl. Acad. Sci. USA 2011, 108, 3086–3091. [Google Scholar] [CrossRef] [PubMed] [Green Version]
  4. Alewell, C.; Ringeval, B.; Ballabio, C.; Robinson, D.A.; Panagos, P.; Borrelli, P. Global phosphorus shortage will be aggravated by soil erosion. Nat. Commun. 2020, 11, 4546. [Google Scholar] [CrossRef] [PubMed]
  5. Lopez-Arredondo, D.L.; Leyva-González, M.A.; González-Morales, S.I.; López-Bucio, J.; Herrera-Estrella, L. Phosphate nutrition: Improving low-phosphate tolerance in crops. Annu. Rev. Plant Biol. 2014, 65, 95–123. [Google Scholar] [CrossRef]
  6. Andersson, H.; Bergström, L.; Djodjic, F.; Ulén, B.; Kirchmann, H. Topsoil and subsoil properties influence phosphorus leaching from four agricultural soils. J. Environ. Qual. 2013, 42, 455–463. [Google Scholar] [CrossRef] [Green Version]
  7. Lambers, H.; Ahmedi, I.; Berkowitz, O.; Dunne, C.; Finnegan, P.M.; Hardy, G.E.S.J.; Jost, R.; Laliberté, E.; Pearse, S.J.; Teste, F.P. Phosphorus nutrition of phosphorus-sensitive Australian native plants: Threats to plant communities in a global biodiversity hotspot. Conserv. Physiol. 2013, 1, cot010. [Google Scholar] [CrossRef] [Green Version]
  8. Cordell, D.; Drangert, J.; White, S. The story of phosphorus: Global food security and food for thought. Glob. Environ. Chang. 2009, 19, 292–305. [Google Scholar] [CrossRef]
  9. Kopriva, S.; Chu, C. Are we ready to improve phosphorus homeostasis in rice? J. Exp. Bot. 2018, 69, 3515–3522. [Google Scholar] [CrossRef] [Green Version]
  10. van de Wiel, C.C.M.; van der Linden, C.G.; Scholten, O.E. Improving phosphorus use efficiency in agriculture: Opportunities for breeding. Euphytica 2016, 207, 1–22. [Google Scholar] [CrossRef] [Green Version]
  11. Scheible, W.R.; Rojas Triana, M. Sensing, signalling, and control of phosphate starvation in plants: Molecular players and applications. Annu. Plant Rev. 2018, 48, 25–64. [Google Scholar] [CrossRef]
  12. Vengavasi, K.; Pandey, R.; Abraham, G.; Yadav, R.K. Comparative analysis of soybean root proteome reveals molecular basis of differential carboxylate efflux under low phosphorus stress. Genes 2017, 8, 341. [Google Scholar] [CrossRef] [PubMed] [Green Version]
  13. Chevalier, F.; Pata, M.; Nacry, P.; Doumas, P.; Rossignol, M. Effects of phosphate availability on the root system architecture: Large-scale analysis of the natural variation between Arabidopsis accessions. Plant Cell Environ. 2003, 26, 1839–1850. [Google Scholar] [CrossRef] [Green Version]
  14. Neumann, G.; Massonneau, A.; Martinoia, E.; Römheld, V. Physiological adaptations to phosphorus deficiency during proteoid root development in white lupin. Planta 1999, 208, 373–382. [Google Scholar] [CrossRef]
  15. Shimizu, A.; Yanagihara, S.; Kawasak, S.; Ikehashi, H. Phosphorus deficiency-induced root elongation and its QTL in rice (Oryza sativa L.). Theor. Appl. Genet. 2004, 109, 1361–1368. [Google Scholar] [CrossRef]
  16. Hoffland, E.; Wei, C.; Wissuwa, M. Organic anion exudation by lowland rice (Oryza sativa L.) at zinc and phosphorus deficiency. Plant Soil 2006, 283, 155–162. [Google Scholar] [CrossRef]
  17. Atemkeng, M.F.; Remans, R.; Michiels, J.; Tagne, A.; Ngonkeu, E.L.M. Inoculation with rhizobium etli enhances organic acid exudation in common bean (Phaseolus vulgaris L.) subjected to phosphorus deficiency. Afr. J. Agric. Res. 2011, 6, 2235–2242. [Google Scholar] [CrossRef]
  18. Bonser, A.M.; Lynch, J.; Snapp, S. Effect of phosphorus deficiency on growth angle of basal roots in Phaseolus vulgaris. New Phytol. 1996, 132, 281–288. [Google Scholar] [CrossRef]
  19. Tang, H.; Chen, X.; Gao, Y.; Hong, L.; Chen, Y. Alteration in root morphological and physiological traits of two maize cultivars in response to phosphorus deficiency. Rhizosphere 2020, 14, 100201. [Google Scholar] [CrossRef]
  20. Zhang, Z.; Liao, H.; Lucas, W.J. Molecular mechanisms underlying phosphate sensing, signaling, and adaptation in plants. J. Integr. Plant Biol. 2014, 56, 192–220. [Google Scholar] [CrossRef]
  21. Zhang, K.; Liu, H.; Tao, P.; Chen, H. Comparative proteomic analyses provide new insights into low phosphorus stress responses in maize leaves. PLoS ONE 2014, 9, e98215. [Google Scholar] [CrossRef] [PubMed]
  22. Cao, Y.; Jain, A.; Ai, H.; Liu, X.; Wang, X.; Hu, Z.; Sun, Y.; Hu, S.; Shen, X.; Lan, X.; et al. OsPDR2 mediates the regulation on the development response and maintenance of Pi homeostasis in rice. Plant Physiol. Biochem. 2020, 149, 1–10. [Google Scholar] [CrossRef] [PubMed]
  23. Chiou, T.; Lin, S. Signaling network in sensing phosphate availability in plants. Annu. Rev. Plant. Biol. 2011, 62, 185–206. [Google Scholar] [CrossRef] [Green Version]
  24. Xu, J.M.; Wang, Z.Q.; Wang, J.Y.; Li, P.F.; Jin, J.F.; Chen, W.W.; Fan, W.; Kochian, L.V.; Zheng, S.J.; Yang, J.L. Low phosphate represses histone deacetylase complex1 to regulate root system architecture remodeling in Arabidopsis. New Phytol. 2020, 225, 1732–1745. [Google Scholar] [CrossRef]
  25. Available online: https://www.fao.org/faostat/zh/#data/QC (accessed on 18 November 2021).
  26. Fita, A.; Nuez, F.; Picó, B. Diversity in root architecture and response to P deficiency in seedlings of Cucumis melo L. Euphytica 2011, 181, 323–339. [Google Scholar] [CrossRef]
  27. Fita, A.; Bowen, H.C.; Hayden, R.M.; Nuez, F.; Pico, B.; Hammond, J.P. Diversity in expression of phosphorus responsive genes in Cucumis melo L. PLoS ONE 2012, 7, e35387. [Google Scholar] [CrossRef] [PubMed]
  28. Cheng, L.; Tang, X.; Vance, C.P.; White, P.J.; Zhang, F.; Shen, J. Interactions between light intensity and phosphorus nutrition affect the phosphate-mining capacity of white lupin (Lupinus albus L.). J. Exp. Bot. 2014, 65, 2995–3003. [Google Scholar] [CrossRef] [PubMed] [Green Version]
  29. Hunter, M.; Leong, G.; Mitchell, J.; Dieters, M.; Fujinuma, R. Constant water table sub-irrigation of pots allows derivation of root weights (without physical recovery) and repeated measures of in situ growth and water use efficiencies. Plant Soil 2018, 425, 1–19. [Google Scholar] [CrossRef]
  30. Ogner, G.; Wickstrøm, T.; Remedios, G.; Gjelsvik, S.; Hensel, G.R.; Jacobsen, J.E.; Olsen, M.; Skretting, E.; Sørlie, B. The Chemical Analysis Program of the Norwegian Forest Research Institute 2000; Internal Report; Norwegian Forest Research Institute: Ås, Norway, 1999. [Google Scholar]
  31. Gilbert, G.A.; Knight, J.D.; Vance, C.P.; Allan, D.L. Acid phosphatase activity in phosphorus-deficient white lupin roots. Plant Cell Environ. 1999, 22, 801–810. [Google Scholar] [CrossRef]
  32. McMichael, B.L.; Burke, J.J. Metabolic activity of cotton roots in response to temperature. Environ. Exp. Bot. 1994, 34, 201–206. [Google Scholar] [CrossRef]
  33. Liu, B.; Zhao, S.; Li, P.; Yin, Y.; Niu, Q.; Yan, J.; Huang, D. Plant buffering against the high-light stress-induced accumulation of CsGA2ox8 transcripts via alternative splicing to finely tune gibberellin levels and maintain hypocotyl elongation. Hortic. Res. 2021, 8, 2. [Google Scholar] [CrossRef] [PubMed]
  34. Livak, K.J.; Schmittgen, T.D. Analysis of relative gene expression data using real-time quantitative PCR and the 2−ΔΔCT method. Methods 2001, 25, 402–408. [Google Scholar] [CrossRef] [PubMed]
  35. Wang, X.; Xu, B.; Zhao, L.; Gao, P.; Ma, H.; Luan, S. Expression analysis of Fusarium wilt resistance gene in melon by real-time quantitative PCR. Pak. J. Bot. 2014, 46, 713–717. [Google Scholar]
  36. Weng, J.; Rehman, A.; Li, P.; Chang, L.; Zhang, Y.; Niu, Q. Physiological and transcriptomic analysis reveals the responses and difference to high temperature and humidity stress in two melon genotypes. Int. J. Mol. Sci. 2022, 23, 734. [Google Scholar] [CrossRef]
  37. Colpaert, J.V.; Van Tichelen, K.K.; Van Assche, J.A.; Van Laere, A. Short-term phosphorus uptake rates in mycorrhizal and non-mycorrhizal roots of intact Pinus sylvestris seedlings. New Phytol. 1999, 143, 589–597. [Google Scholar] [CrossRef]
  38. Fageria, N.K.; Baligar, V.C. Phosphorus-use efficiency by corn genotypes. J. Plant Nutr. 1997, 20, 1267–1277. [Google Scholar] [CrossRef]
  39. Li, P.; Weng, J.; Zhang, Q.; Yu, L.; Yao, Q.; Chang, L.; Niu, Q. Physiological and biochemical responses of Cucumis melo L. chloroplasts to low-phosphate stress. Front. Plant Sci. 2018, 9, 1525. [Google Scholar] [CrossRef] [Green Version]
  40. Broadley, M.R.; Bowen, H.C.; Cotterill, H.L.; Hammond, J.P.; Meacham, M.C.; Mead, A.; White, P.J. Phylogenetic variation in the shoot mineral concentration of angiosperms. J. Exp. Bot. 2004, 55, 321–336. [Google Scholar] [CrossRef] [Green Version]
  41. Pieters, A.J.; Paul, M.J.; Lawlor, D.W. Low sink demand limits photosynthesis under Pi deficiency. J. Exp. Bot. 2001, 52, 1083–1091. [Google Scholar] [CrossRef] [Green Version]
  42. Meng, X.; Chen, W.W.; Wang, Y.Y.; Huang, Z.R.; Ye, X.; Chen, L.S.; Yang, L.T. Effects of phosphorus deficiency on the absorption of mineral nutrients, photosynthetic system performance and antioxidant metabolism in Citrus grandis. PLoS ONE 2021, 16, e0246944. [Google Scholar] [CrossRef]
  43. Baxter, I.R.; Vitek, O.; Lahner, B.; Muthukumar, B.; Borghi, M.; Morrissey, J.; Guerinot, M.L.; Salt, D.E. The leaf ionome as a multivariable system to detect a plant’s physiological status. Proc. Natl. Acad. Sci. USA 2008, 105, 12081–12086. [Google Scholar] [CrossRef] [PubMed] [Green Version]
  44. Ding, Y.; Wang, Z.; Ren, M.; Zhang, P.; Li, Z.; Chen, S.; Ge, C.; Wang, Y. Iron and callose homeostatic regulation in rice roots under low phosphorus. BMC Plant Biol. 2018, 18, 326. [Google Scholar] [CrossRef] [PubMed] [Green Version]
  45. Hirsch, J.; Marin, E.; Floriani, M.; Chiarenza, S.; Richaud, P.; Nussaume, L.; Thibaud, M.C. Phosphate deficiency promotes modification of iron distribution in Arabidopsis plants. Biochimie 2006, 88, 1767–1771. [Google Scholar] [CrossRef] [PubMed]
  46. Liu, W.J.; Hu, Y.; Zhu, Y.G.; Gao, R.T.; Zhao, Q.L. The mechanisms of iron plaque formation on the surface of rice roots induced by phosphorus starvation. Plant Nutr. Fertil. Sci. 2008, 14, 22–27. [Google Scholar]
  47. Jiang, F.Y.; Chen, X.; Luo, A.C. Iron plaque formation on wetland plants and its influence on phosphorus, calcium and metal uptake. Aquat. Ecol. 2009, 43, 879–890. [Google Scholar] [CrossRef]
  48. Yang, X.J.; Xu, Z.; Shen, H. Drying–submergence alternation enhanced crystalline ratio and varied surface properties of iron plaque on rice (Oryza sativa) roots. Environ. Sci. Pollut. Res. 2018, 25, 3571–3587. [Google Scholar] [CrossRef]
  49. Morris, E.C.; Griffiths, M.; Golebiowska, A.; Mairhofer, S.; Burr-Hersey, J.; Goh, T.; Wangenheim, D.; Atkinson, B.; Sturrock, C.; Lynch, J.; et al. Shaping 3D root system architecture. Curr. Biol. 2017, 27, R919–R930. [Google Scholar] [CrossRef] [Green Version]
  50. Lopez-Bucio, J.; Hernandez-Abreu, E.; Sanchez-Calderon, L.; Nieto-Jacobo, M.F.; Simpson, J.; Herrera-Estrella, L. Phosphate availability alters architecture and causes changes in hormone sensitivity in the Arabidopsis root system. Plant Physiol. 2002, 129, 244–256. [Google Scholar] [CrossRef] [Green Version]
  51. Zheng, X.; Zhang, Z.H.; Chen, X.; Jia, Z.; Yi, J.; Su, Y. Responses of root morphology and architecture to phosphorus deficiency at seedling stage of tobacco growth. Aust. J. Crop Sci. 2013, 7, 1967–1972. [Google Scholar]
  52. Mollier, A.; Pellerin, S. Maize root system growth and development as influenced by phosphorus deficiency. J. Exp. Bot. 1999, 50, 487–497. [Google Scholar] [CrossRef]
  53. Camilo, S.; Odindo, A.O.; Kondwakwenda, A.; Sibiya, J. Root traits related with drought and phosphorus tolerance in common bean (Phaseolus vulgaris L.). Agronomy 2021, 11, 552. [Google Scholar] [CrossRef]
  54. Ha, S.; Tran, L. Understanding plant responses to phosphorus starvation for improvement of plant tolerance to phosphorus deficiency by biotechnological approaches. Crit. Rev. Biotechnol. 2014, 34, 16–30. [Google Scholar] [CrossRef]
  55. Kumar, S.; Chugh, C.; Seem, K.; Kumar, S.; Vinod, K.K.; Mohapatra, T. Characterization of contrasting rice (Oryza sativa L.) genotypes reveals the Pi-efficient schema for phosphate starvation tolerance. BMC Plant Biol. 2021, 21, 282. [Google Scholar] [CrossRef]
  56. Tadano, T.; Sakai, H. Secretion of acid phosphatase by the roots of several crop species under phosphorus-deficient conditions. Soil Sci. Plant Nutr. 1991, 37, 129–140. [Google Scholar] [CrossRef]
  57. Li, Y.; Gao, Y.; Tian, Q.; Shi, F.; Li, L.; Zhang, W. Stimulation of root acid phosphatase by phosphorus deficiency is regulated by ethylene in Medicago falcata. Environ. Exp. Bot. 2011, 71, 114–120. [Google Scholar] [CrossRef]
  58. Roche, J.; Turnbull, M.H.; Guo, Q.; Novak, O.; Spath, J.; Gieseg, S.P.; Jameson, P.E.; Love, J. Coordinated nitrogen and carbon remobilization for nitrate assimilation in leaf, sheath and root and associated cytokinin signals during early regrowth of Lolium perenne. Ann. Bot. 2017, 119, 1353–1364. [Google Scholar] [CrossRef]
  59. Nussaume, L.; Kanno, S.; Javot, H.; Marin, E.; Nakanishi, T.M.; Thibaud, M. Phosphate import in plants: Focus on the PHT1 transporters. Front. Plant Sci. 2011, 2, 83. [Google Scholar] [CrossRef] [Green Version]
  60. Walder, F.; Brulé, D.; Koegel, S.; Wiemken, A.; Boller, T.; Courty, P.E. Plant phosphorus acquisition in a common mycorrhizal network: Regulation of phosphate transporter genes of the Pht1 family in sorghum and flax. New Phytol. 2015, 205, 1632–1645. [Google Scholar] [CrossRef]
  61. Remy, E.; Cabrito, T.R.; Batista, R.A.; Teixeira, M.C.; Sá-Correia, I.; Duque, P. The Pht1; 9 and Pht1; 8 transporters mediate inorganic phosphate acquisition by the Arabidopsis thaliana root during phosphorus starvation. New Phytol. 2012, 195, 356–371. [Google Scholar] [CrossRef]
  62. Ayadi, A.; David, P.; Arrighi, J.F.; Chiarenza, S.; Thibaud, M.C.; Nussaume, L.; Marin, E. Reducing the genetic redundancy of Arabidopsis PHOSPHATE TRANSPORTER1 transporters to study phosphate uptake and signaling. Plant Physiol. 2015, 167, 1511–1526. [Google Scholar] [CrossRef] [Green Version]
  63. Chang, M.X.; Gu, M.; Xia, Y.W.; Dai, X.L.; Dai, C.R.; Zhang, J.; Wang, S.C.; Qu, H.Y.; Yamaji, N.; Ma, J.F.; et al. OsPHT1; 3 mediates uptake, translocation, and remobilization of phosphate under extremely low phosphate regimes. Plant Physiol. 2019, 179, 656–670. [Google Scholar] [CrossRef] [PubMed] [Green Version]
  64. Chen, A.; Chen, X.; Wang, H.; Liao, D.; Gu, M.; Qu, H.; Sun, S.; Xu, G. Genome-wide investigation and expression analysis suggest diverse roles and genetic redundancy of Pht1 family genes in response to Pi deficiency in tomato. BMC Plant. Biol. 2014, 14, 61. [Google Scholar] [CrossRef] [PubMed] [Green Version]
  65. Ming, F.; Mi, G.H.; Lu, Q.; Yin, S.; Zhang, S.S.; Guo, B.; Shen, D.L. Cloning and characterization of cDNA for the Oryza sativa phosphate transporter. Cell. Mol. Biol. Lett. 2005, 10, 401–411. [Google Scholar] [PubMed]
  66. Qin, L.; Guo, Y.; Chen, L.; Liang, R.; Gu, M.; Xu, G.; Zhao, J.; Walk, T.; Liao, H. Functional characterization of 14 Pht1 family genes in yeast and their expressions in response to nutrient starvation in soybean. PLoS ONE 2012, 7, e47726. [Google Scholar] [CrossRef]
  67. Shin, H.; Shin, H.S.; Dewbre, G.R.; Harrison, M.J. Phosphate transport in Arabidopsis: Pht1;1 and Pht1;4 play a major role in phosphate acquisition from both low- and high-phosphate environments. Plant J. 2004, 39, 629–642. [Google Scholar] [CrossRef]
  68. Teng, W.; Zhao, Y.; Zhao, X.; He, X.; Ma, W.; Deng, Y.; Chen, X.; Tong, Y. Genome-wide identification, characterization, and expression analysis of PHT1 phosphate transporters in wheat. Front. Plant Sci. 2017, 8, 543. [Google Scholar] [CrossRef] [Green Version]
  69. Schünmann, P.H.D.; Richardson, A.E.; Smith, F.W.; Delhaize, E. Characterization of promoter expression patterns derived from the Pht1 phosphate transporter genes of barley (Hordeum vulgare L.). J. Exp. Bot. 2004, 55, 855–865. [Google Scholar] [CrossRef] [Green Version]
  70. Baker, A.; Ceasar, S.A.; Palmer, A.J.; Paterson, J.B.; Qi, W.; Muench, S.P.; Baldwin, S.A. Replace, reuse, recycle: Improving the sustainable use of phosphorus by plants. J. Exp. Bot. 2015, 66, 3523–3540. [Google Scholar] [CrossRef] [Green Version]
Figure 1. The morphological parameters of melon seedlings under low-Pi stress. P0.025, P0.001, and P0.25 referred to Pi treatments of 0.025 mM, 0.001 mM, and 0.25 mM Pi. (A) plant height; (B) leaf area; (C) shoot dry weight; (D) root dry weight; (E) root: shoot ratio. The error bars indicate the standard deviation (SD; n = 3). The lowercase letters indicate the significant differences in the parameter of the same treatment time among the treatments using one-way ANOVA with Tukey’s test (p < 0.05).
Horticulturae 08 00636 g001
Figure 2. The representative phenotype of melon seedling roots under low-Pi stress at the 7th day after treatment (AC) and the 14th day after treatment (DF). The roots were scanned to produce these images (EPSON Perfection V700 Photo scanner, Epson, Nagano, Japan) (n = 3, 3 subsamples of each replicate).
Horticulturae 08 00636 g002
Figure 3. The APase gene expression (A) and activity outside (secreted by) the roots (B) and in root tissue (C) under low-Pi stress. The error bars indicate the SD (n = 3). The lowercase letters indicate the significant differences in the parameter, at the same treatment time, among the treatments using one-way ANOVA with Tukey’s test (p < 0.05).
Horticulturae 08 00636 g003
Figure 4. Relative expression level of the PHT1 family genes PHT1;3 (A), PHT1;4 (B), and PHT1;7 (C) in melon roots under low-Pi stress. The error bars indicate the SD (n = 6). The lowercase letters indicate the significant differences in the parameter, at the same treatment time, among the treatments using one-way ANOVA with Tukey’s test (p < 0.05).
Horticulturae 08 00636 g004
Figure 5. Root vitality under low-Pi stress. The error bars indicate the SD (n = 3). The lowercase letters indicate the significant differences in the parameter, at the same treatment time, among the treatments using one-way ANOVA with Tukey’s test (p < 0.05).
Horticulturae 08 00636 g005
Figure 6. Adaptations through which the root system increased P efficiency at moderately low Pi (A) and severely low Pi (B). The size of each arrow represents the intensity. The red up arrow represents an increase. The green down arrow represents a decrease.
Horticulturae 08 00636 g006
Table 1. Sequences of the primers used for qRT-PCR.
Target Gene IDGene DescriptionSense Primer 5′→3′Anti-Sense Primer 5′→3′
ActinReference geneTCTATTCCAGCCATCTCTCGACCCTCCAATCCAAAC
cmo:103488012Purple acid phosphataseCGGAAGTCTATCAAGAAGGTCATGGAATGGATAACGATCTG
cmo:103483597PHT1;3CAATAGATTCTCAGCACCTTCGCCTCAACCTCTACTTGTAA
cmo:103483596PHT1;4GACATTAGAAGCCAACAGAAGGACTCAGGAACCAACAA
MELO3C022994PHT1;7GCATTCATCGCCGCTGTCTTGCAGTGTATCTCGCCGTCTC
Table 2. Nutrient element contents in the roots and shoots of melon seedlings grown under low-Pi stress. The values are presented as the mean ± SD (n = 3). The lowercase letters indicate significant differences in the parameter, at the same treatment time, among the treatments using one-way ANOVA with Tukey’s test (p < 0.05). Pr, Nr, Kr, Car, Fer, and Sr: P, N, K, Ca, Fe, and S content in the root, respectively. Ps, Ns, Ks, Cas, Fes, and Ss: P, N, K, Ca, Fe, and S content in the shoot, respectively. A The data of Pr and Ps at 14 d are published in [39].
Treatment Time (d)Pi Treatment(mM)Nutrient Element Contents (mg g−1 DW)
A PrA PsNrNsKrKsCarCasFerFesSrSs
70.2510.45 ± 0.23 a12.54 ± 0.29 a46.97 ± 0.42 a63.94 ± 0.15 a69.07 ± 2.58 a39.57 ± 2.29 a6.99 ± 0.34 a38.99 ± 0.25 b1.33 ± 0.02 c0.18 ± 0.02 b4.01 ± 0.07 a4.62 ± 0.45 b
0.0256.66 ± 0.37 b7.97 ± 0.24 b44.67 ± 0.30 a64.14 ± 0.04 a67.74 ± 1.53 a41.90 ± 1.44 a6.69 ± 0.42 a41.83 ± 1.21 a1.49 ± 0.14 b0.17 ± 0.03 b3.94 ± 0.09 a5.42 ± 0.16 a
0.0014.02 ± 0.14 c3.89 ± 0.21 c45.54 ± 0.05 a60.67 ± 0.11 a66.91 ± 2.98 a38.82 ± 1.34 a6.51 ± 0.31 a31.77 ± 1.59 c1.78 ± 0.04 a0.24 ± 0.02 a3.40 ± 0.21 b4.78 ± 0.06 b
140.2512.92 ± 0.21 a13.84 ± 0.31 a53.70 ± 1.29 a58.00 ± 2.58 a74.30 ± 2.02 b41.70 ± 1.39 b6.10 ± 0.16 b44.10 ± 1.91 a1.17 ± 0.03 b0.13 ± 0.04 b3.96 ± 0.15 b4.55 ± 0.33 a
0.0255.30 ± 0.37 b4.65 ± 0.15 b54.50 ± 1.48 a59.70 ± 2.45 a73.40 ± 2.03 b52.80 ± 1.23 a6.00 ± 0.24 b34.10 ± 1.25 b1.65 ± 005 a0.14 ± 0.05 b4.43 ± 0.20 a4.25 ± 0.45 a
0.0012.62 ± 0.42 c2.03 ± 0.13 c47.20 ± 1.40 b43.20 ± 1.79 b79.40 ± 1.94 a29.70 ± 1.04 c6.90 ± 0.35 a27.40 ± 1.20 c1.66 ± 0.03 a0.27 ± 0.03 a3.04 ± 0.07 c3.77 ± 0.26 b
Table 3. Total root length (TRL), root surface area (SA), root volume (V), root average diameter (D), primary root length (PRL), and lateral root zone length (LRZL) of melon seedlings. The values are presented as the mean ± SD (n = 3, 3 subsamples of each replicate). The lowercase letters indicate the significant difference in the parameter, at the same treatment time, among the treatments using one-way ANOVA with Tukey’s test (p < 0.05).
Treatment Time (d)Pi Treatment (mM)TRL
(cm plant−1)
SA
(cm2 plant−1)
V
(cm3 plant−1)
D
(mm)
PRL
(cm plant−1)
LRZL
(cm plant−1)
70.25643.84 ± 42.66 b66.35 ± 3.45 b0.54 ± 0.02 b0.33 ± 0.01 ab34.83 ± 2.41 a30.60 ± 2.68 a
0.025689.27 ± 25.13 b68.91 ± 3.68 b0.55 ± 0.04 b0.32 ± 0.01 b33.54 ± 4.96 a27.38 ± 4.69 a
0.001736.93 ± 27.18 a78.46 ± 2.31 a0.66 ± 0.04 a0.34 ± 0.01 a32.60 ± 1.76 a28.15 ± 1.56 a
140.251088.12 ± 48.09 b126.24 ± 14.00 ab1.17 ± 0.16 a0.36 ± 0.00 a39.45 ± 0.93c36.10 ± 2.08 b
0.0251288.80 ± 40.73 a145.50 ± 16.94 a1.30 ± 0.17 a0.36 ± 0.01 a45.34 ± 1.38 b39.19 ± 0.19 b
0.001961.77 ± 28.14c101.03 ± 9.20 b0.85 ± 0.10 b0.33 ± 0.01 b51.10 ± 2.05 a44.67 ± 2.10 a
Table 4. The Pi uptake rate (PUR) and P utilization efficiency (PUE) under low-Pi stress. The values are presented as the mean ± SD (n = 3). The lowercase letters indicate the significant differences in the parameter, at the same treatment time, among the treatments using one-way ANOVA with Tukey’s test (p < 0.05).
Treatment Time (d)Pi Treatment
(mM)
PUR (μg Pi cm−1 TRL)PUE (g DW mg−1 P)
70.250.0044 ± 0.0015 c0.0819 ± 0.0012 c
0.0250.0109 ± 0.0012 b0.1549 ± 0.0026 b
0.0010.0180 ± 0.0020 a0.5727 ± 0.0018 a
140.250.0319 ± 0.0030 b0.0725 ± 0.0022 c
0.0250.0327 ± 0.0021 b0.2327 ± 0.0038 b
0.0010.0399 ± 0.0026 a0.8678 ± 0.0048 a
Publisher’s Note: MDPI stays neutral with regard to jurisdictional claims in published maps and institutional affiliations.