
Are Fruit Surface Differences in Two Blueberry Cultivars Major Drivers of Contrasting Postharvest Dynamics?


 ,
,  , ,
, ,
Abstract
:1. Introduction
2. Materials and Methods
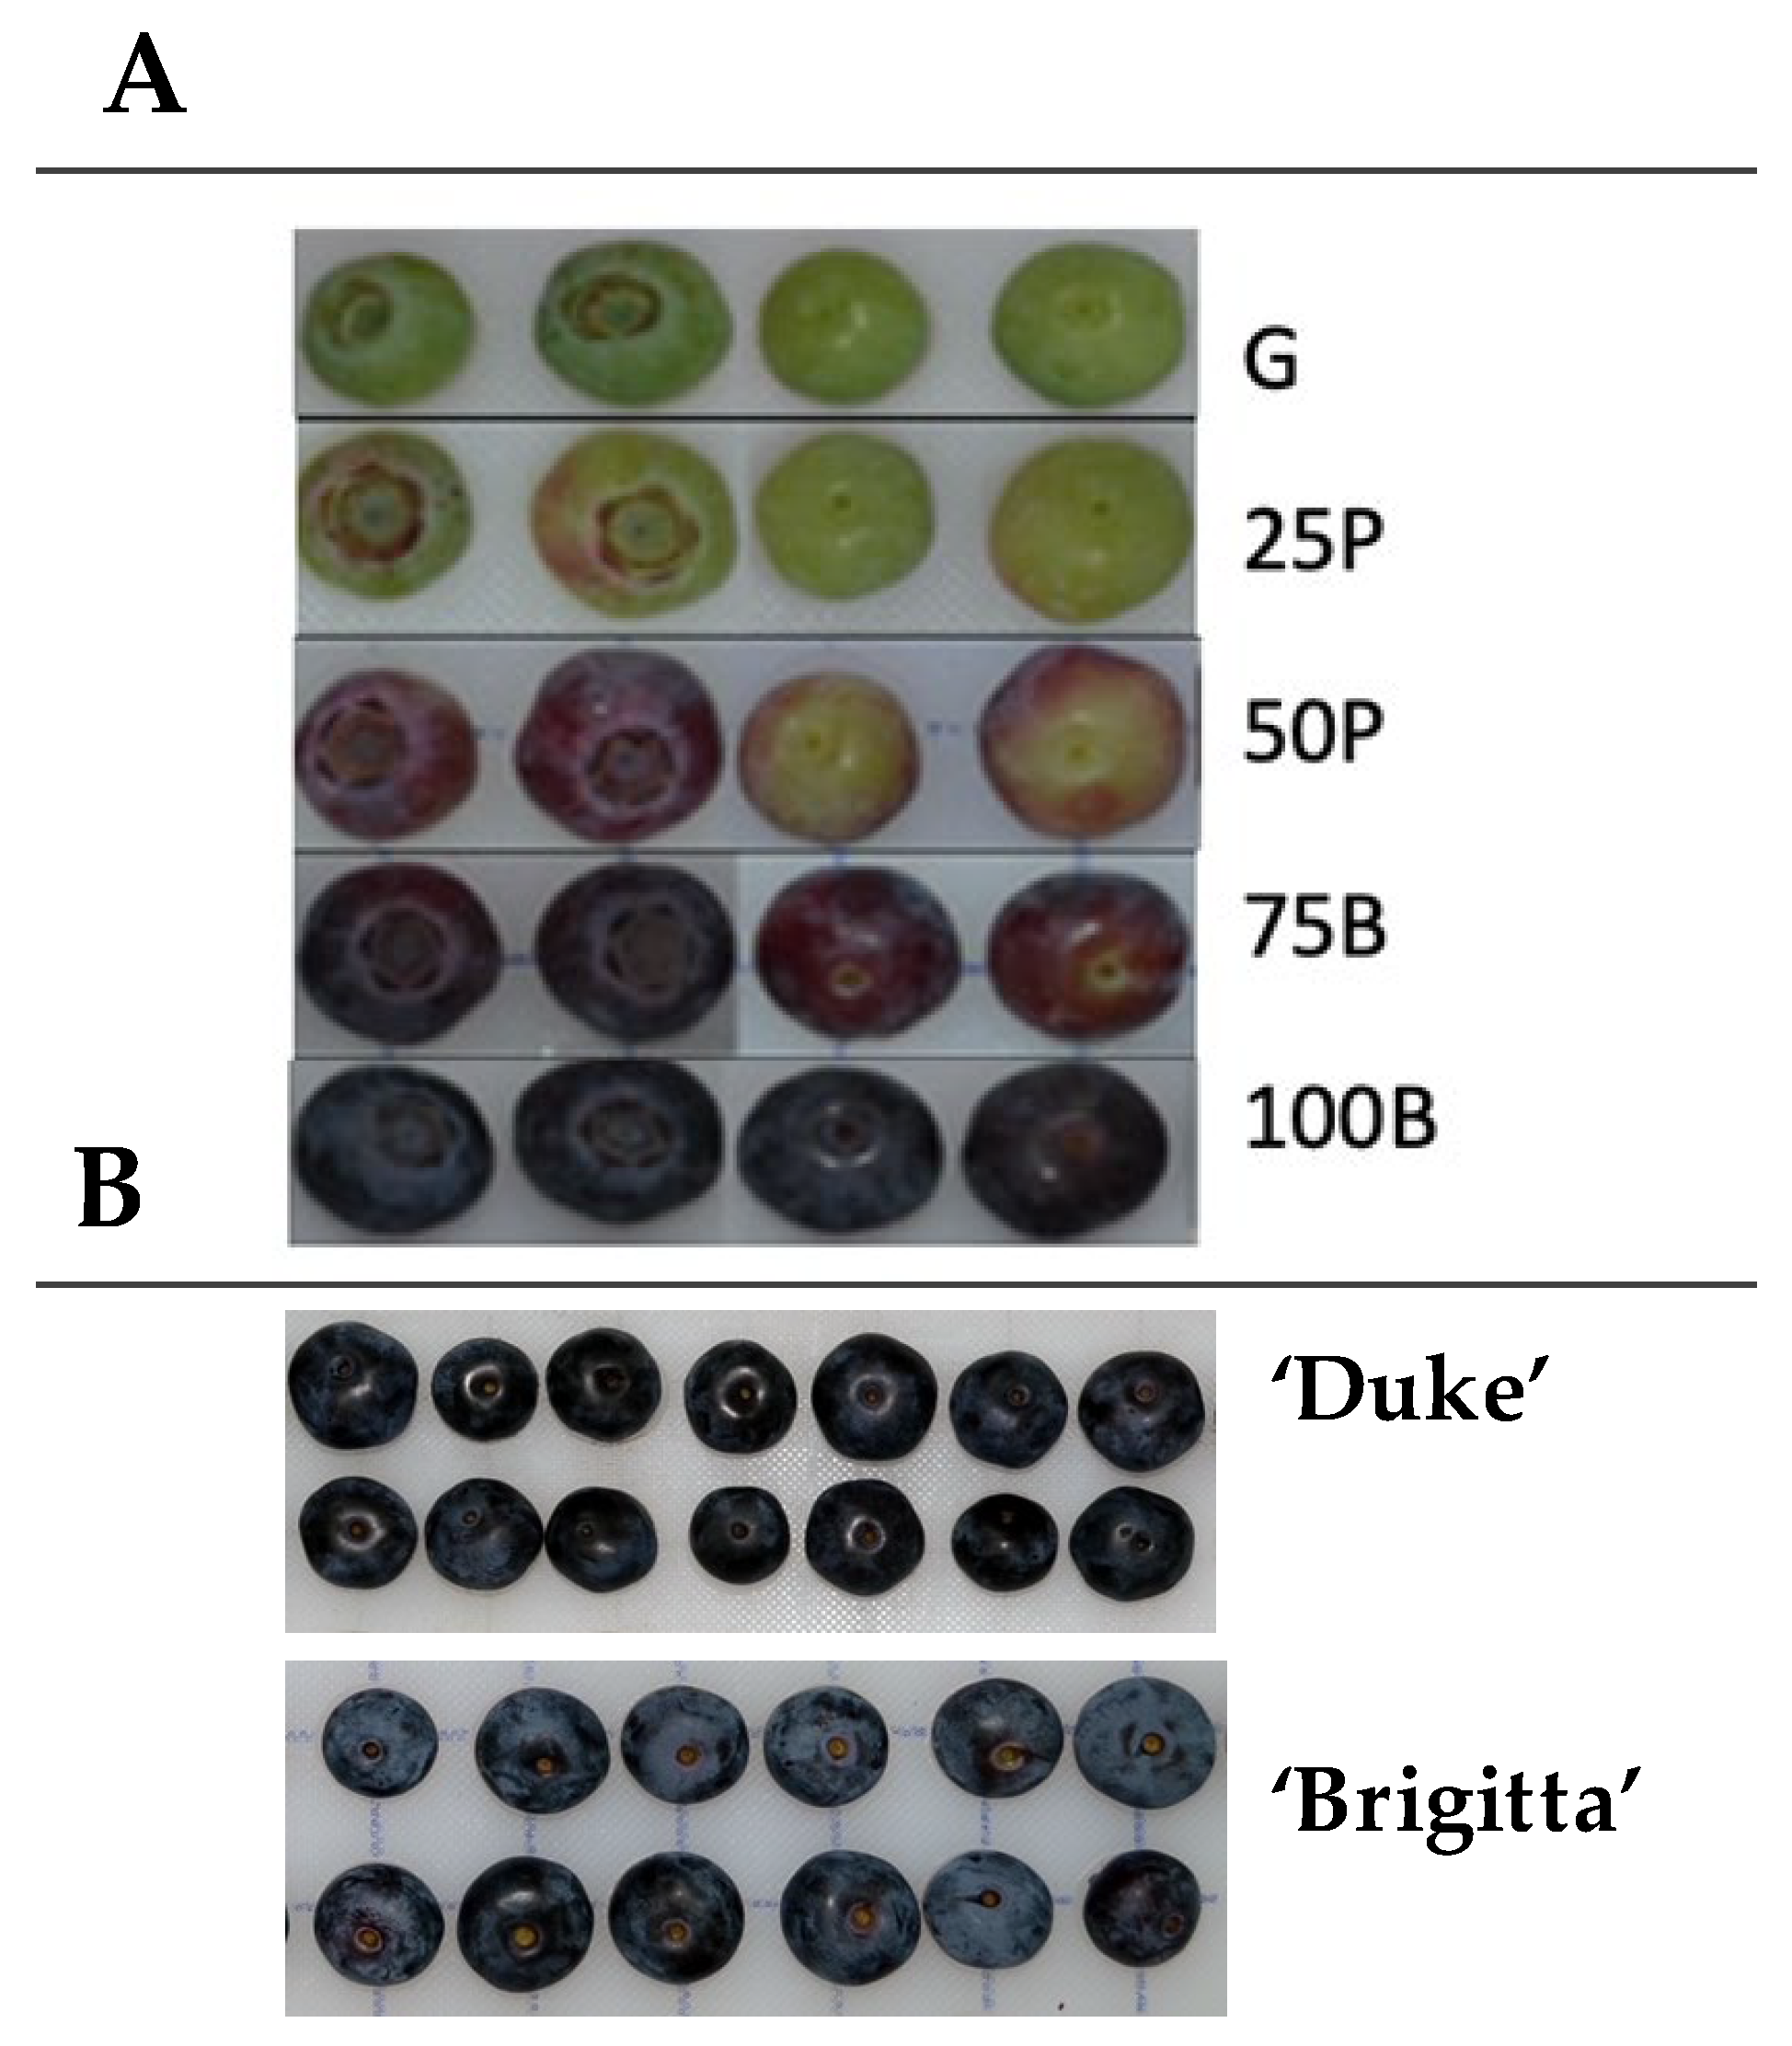
2.1. Plant Material and Study Setup
2.2. Maturity Parameters, Respiration Rate and Ethylene Production
2.3. Extraction, Identification and Quantification of Cuticular Waxes of Fruit
2.4. Extraction and Analysis of Cutin Monomers
2.5. Statistical Analysis
3. Results
4. Discussion
4.1. Differences between Cultivars
4.2. Differences between Developmental Stages
5. Conclusions
Author Contributions
Funding
Data Availability Statement
Acknowledgments
Conflicts of Interest
References
- Lobos, G.A.; Hancock, J.F. Breeding blueberries for a changing global environment: A review. Front. Plant Sci. 2015, 6, 782. [Google Scholar] [CrossRef] [PubMed] [Green Version]
- Edwards, T.W.; Sherman, W.B.; Sharpe, R.H. Fruit development in short and long cycle blueberries. HortScience 1970, 5, 274–275. [Google Scholar]
- Coombe, B.G. The development of fleshy fruits. Annu. Rev. Plant Physiol. 1976, 27, 207–228. [Google Scholar] [CrossRef]
- Birkhold, K.T.; Koch, K.E.; Darnell, R.L. Carbon and nitrogen economy of developing rabbiteye blueberry fruit. J. Am. Soc. Hort. Sci. 1992, 117, 139–145. [Google Scholar] [CrossRef] [Green Version]
- Cano-Medrano, R.; Darnell, R. Cell number and cell size in parthenocarpic vs. pollinated blueberry (Vaccinium ashei) fruits. Ann. Bot. 1997, 80, 419–425. [Google Scholar] [CrossRef] [Green Version]
- Galletta, G. Blueberries and cranberries. In Advances in Fruit Breeding; Janick, J., Moore, J.N., Eds.; Purdue University Press: West Lafayette, IN, USA, 1975; pp. 154–196. [Google Scholar]
- Gough, R. The Highbush Blueberry and its Management; Food Products Press, Haworth Press Inc.: New York, NY, USA, 1994; 272p. [Google Scholar]
- Galletta, G.J.; Ballinger, W.E.; Monroe, R.J.; Kushman, L.J. Relationships between fruit acidity and soluble solids level of highbush blueberry clones and fruit keeping quality. J. Am. Soc. Hortic. Sci. 1971, 6, 758–762. [Google Scholar]
- Shutak, V.G.; Gough, R.E.; Windus, N.D. The Cultivated Highbush Blueberry: Twenty Years of Research. Rhode Island Agricultural Experiment Station Bulletin; University of Rhode Island: Kingston, NY, USA, 1980; 48p. [Google Scholar]
- Ballinger, W.E.; Kushman, L.J.; Hamann, D.D. Factors affecting the firmness of highbush blueberries. J. Am. Soc. Hortic. Sci. 1973, 98, 583–587. [Google Scholar]
- Ballinger, W.E.; Maness, E.P.; Kushman, L.J. Anthocyanins in ripe fruit of the highbush blueberry, Vaccinium corymbosum L. J. Am. Soc. Hortic. Sci. 1970, 95, 283–285. [Google Scholar]
- Ballinger, W.E.; Maness, E.P.; Kushman, L.J.; Galletta, G.J. Anthocyanins in ripe fruit of a ‘pink-fruited’ hybrid of highbush blueberry, Vaccinium corymbosum L. J. Am. Soc. Hortic. Sci. 1972, 97, 381–384. [Google Scholar]
- El-Agamy, S.Z.A.; Aly, M.; Biggs, R.H. Fruit maturity as related to ethylene in ‘Delite’ blueberry. Proc. Fla. State Hort. Soc. 1982, 95, 245–246. [Google Scholar]
- Moggia, C.; González, C.; Lobos, G.A.; Valdés, M.; Lara, I.; Graell, J. Changes in quality and maturity of ‘Duke’ and ‘Brigitta’ blueberries during fruit development: Postharvest implications. Acta Hortic. 2018, 1194, 1495–1501. [Google Scholar] [CrossRef] [Green Version]
- Vicente, A.R.; Ortugno, C.; Rosli, H.; Powell, A.L.T.; Greve, L.C.; Labavitch, J.M. Temporal sequence of cell wall disassembly events in developing fruits 2. Analysis of blueberry (Vaccinium species). J. Agric. Food Chem. 2007, 55, 4125–4130. [Google Scholar] [CrossRef] [PubMed]
- Proctor, A.; Miesle, T.J. Polygalacturonase and pectinmethylesterase activities in developing highbush blueberries. HortScience 1991, 26, 579–581. [Google Scholar] [CrossRef] [Green Version]
- Angeletti, P.; Castagnasso, H.; Miceli, E.; Terminiello, L.; Concellón, A.; Chaves, A.; Vicente, A.R. Effect of preharvest calcium applications on postharvest quality, softening and cell wall degradation of two blueberry (Vaccinium corymbosum) varieties. Postharvest Biol. Technol. 2010, 58, 98–103. [Google Scholar] [CrossRef]
- Lara, I.; Belge, B.; Goulao, L.F. The fruit cuticle as a modulator of postharvest quality. Postharvest Biol. Technol. 2014, 87, 103–112. [Google Scholar] [CrossRef] [Green Version]
- Paniagua, A.C.; East, R.; Hindmarsh, J.P.; Heyes, J.A. Moisture loss is the major cause of firmness change during postharvest storage of blueberry. Postharvest Biol. Technol. 2013, 79, 13–19. [Google Scholar] [CrossRef]
- Sargent, S.A.; Brecht, J.K.; Forney, C.F. Blueberry harvest and postharvest operations: Quality maintenance and food safety. In Blueberries for Growers, Gardeners, Promoters; Childers, N.F., Lyrene, P.M., Eds.; E.O. Painter Printing Co.: DeLeon Springs, FL, USA, 2006; pp. 139–151. [Google Scholar]
- Alsmairat, N.; Contreras, C.; Hancock, J.; Callow, P.; Beaudry, R. Use of combinations of commercially relevant O2 and CO2 partial pressures to evaluate the sensitivity of nine highbush blueberry fruit cultivars to controlled atmospheres. HortScience 2011, 46, 74–79. [Google Scholar] [CrossRef]
- Paniagua, A.C.; East, R.; Heyes, J.A. Interaction of temperature control deficiencies and atmosphere conditions during blueberry storage on quality outcomes. Postharvest Biol. Technol. 2014, 95, 50–59. [Google Scholar] [CrossRef]
- NeSmith, D.S.; Prussia, S.E.; Tetteh, M.; Krewer, G. Firmness losses of rabbiteye blueberries (Vaccinium ashei Reade) during harvesting and handling. Acta Hort. 2002, 574, 287–293. [Google Scholar] [CrossRef]
- Lobos, G.A.; Bravo, C.; Valdés, M.; Graell, J.; Lara, I.; Beaudry, R.M.; Moggia, C. Within-plant variability in blueberry (Vaccinium corymbosum L.): Maturity at harvest and position within the canopy influence fruit firmness at harvest and postharvest. Postharvest Biol. Technol. 2018, 146, 26–35. [Google Scholar] [CrossRef]
- Moggia, C.; Graell, J.; Lara, I.; Schmeda-Hirschmann, G.; Thomas-Valdés, S.; Lobos, G.A. Fruit characteristics and cuticle triterpenes as related to postharvest quality of highbush blueberries. Sci. Hortic. 2016, 211, 449–457. [Google Scholar] [CrossRef] [Green Version]
- Moggia, C.; Graell, J.; Lara, I.; González, G.; Lobos, G.A. Firmness at harvest impacts postharvest fruit softening and internal browning development in mechanically damaged and non-damaged highbush blueberries (Vaccinium corymbosum L.). Front. Plant Sci. 2017, 8, 535. [Google Scholar] [CrossRef] [PubMed] [Green Version]
- Yan, Y.; Castellarin, S.D. Blueberry water loss is related to both cuticular wax composition and stem scar size. Postharvest Biol. Technol. 2022, 188, 111907. [Google Scholar] [CrossRef]
- Domínguez, E.; Cuartero, J.; Heredia, A. An overview on plant cuticle biomechanics. Plant Sci. 2011, 181, 77–84. [Google Scholar] [CrossRef]
- Jetter, S.; Schäffer, S.; Riederer, M. Leaf cuticular waxes are arranged in chemically and mechanically distinct layers: Evidence from Prunus laurocerasus L. Plant Cell Environ. 2000, 23, 619–628. [Google Scholar] [CrossRef]
- Moggia, C.; Peñaloza, O.; Torres, J.; Romero-Bravo, S.; Sepúlveda, D.; Jara, R.; Vivanco, S.; Valdés, M.; Zúñiga, M.; Beaudry, R.M.; et al. Within-plant variability in blueberry (Vaccinium corymbosum L.) II: Is a shorter harvest interval always the ideal strategy to maximize fruit firmness? Postharvest Biol. Technol. 2022, 186, 111815. [Google Scholar] [CrossRef]
- McGuire, R.G. Reporting of objective color measurements. HortScience 1992, 27, 1254–1255. [Google Scholar] [CrossRef] [Green Version]
- Saftner, R.; Polashock, J.; Ehlenfeldt, M.; Vinyard, B. Instrumental and sensory quality characteristics of blueberry fruit from twelve cultivars. Postharvest Biol. Technol. 2008, 49, 19–26. [Google Scholar] [CrossRef]
- Caligiani, A.; Malavasi, G.; Palla, G.; Marseglia, A.; Tognolini, M.; Bruni, R. A simple GC–MS method for the screening of betulinic, corosolic, maslinic, oleanolic and ursolic acid contents in commercial botanicals used as food supplement ingredients. Food Chem. 2013, 136, 735–741. [Google Scholar] [CrossRef]
- Belge, B.; Llovera, M.; Comabella, E.; Gatius, F.; Guillén, P.; Graell, J.; Lara, I. Characterization of cuticle composition after cold storage of ‘Celeste’ and ‘Somerset’ sweet cherry fruit. J. Agric. Food Chem. 2014, 62, 8722–8729. [Google Scholar] [CrossRef]
- Windus, N.D.; Shutak, V.G.; Gough, R.E. CO2 and C2H4 evolution by highbush blueberry fruit. HortScience 1976, 11, 515–517. [Google Scholar]
- NeSmith, D.S.; Núñez-Barrios, A.; Prussia, S.E.; Aggarwal, D. Postharvest berry quality of six rabbiteye blueberry cultivars in response to temperature. J. Am. Pomol. Soc. 2005, 59, 13–17. [Google Scholar]
- MacLean, D.D.; NeSmith, D.S. Rabbiteye blueberry postharvest fruit quality and stimulation of ethylene production by1-methylcyclopropene. HortScience 2011, 46, 1278–1281. [Google Scholar] [CrossRef]
- Kunst, L.; Samuels, L. Plant cuticles shine: Advances in wax biosynthesis and export. Curr. Opin. Plant Biol. 2009, 12, 721–727. [Google Scholar] [CrossRef]
- Lara, I. The fruit cuticle: Actively tuning postharvest quality. In Preharvest Modulation of Postharvest Fruit and Vegetable Quality; Siddiqui, M.W., Ed.; Academic Press Ltd./Elsevier Science Ltd.: London, UK, 2018; pp. 93–120. [Google Scholar] [CrossRef]
- Cho, J.Y.; Kim, C.M.; Lee, H.J.; Lee, S.H.; Cho, J.A.; Kim, W.S.; Park, K.H.; Moon, J.H. Caffeoyl triterpenes from pear (Pyrus pyrifolia Nakai) fruit peels and their antioxidative activities against oxidation of rat blood plasma. J. Agric. Food Chem. 2013, 61, 4563–4569. [Google Scholar] [CrossRef]
- Lara, I.; Belge, B.; Goulao, L. A focus on the biosynthesis and composition of cuticle in fruits. J. Agric. Food Chem. 2015, 63, 4005–4019. [Google Scholar] [CrossRef]
- Szakiel, A.; Pączkowski, C.; Pensec, F.; Bertsch, C. Fruit cuticular waxes as a source of biologically active triterpenoids. Phytochem. Rev. 2012, 11, 263–284. [Google Scholar] [CrossRef] [Green Version]
- Schreiber, L.; Riederer, M. Ecophysiology of cuticular transpiration: Comparative investigation of cuticular water permeability of plant species from different habitats. Oecologia 1996, 107, 426–432. [Google Scholar] [CrossRef]
- Leide, J.; Hildebrandt, U.; Vogg, G.; Riederer, M. The positional sterile (ps) mutation affects cuticular transpiration and wax biosynthesis of tomato fruits. J. Plant Physiol. 2011, 168, 871–877. [Google Scholar] [CrossRef]
- Parsons, E.P.; Popopvsky, S.; Lohrey, G.T.; Lü, S.; Alkalai-Tuvia, S.; Perzelan, Y.; Paran, I.; Fallik, E.; Jenks, M.A. Fruit cuticle lipid composition and fruit post-harvest water loss in an advanced backcross generation of pepper (Capsicum sp.). Physiol. Plant. 2012, 146, 15–25. [Google Scholar] [CrossRef]
- Belge, B.; Llovera, M.; Comabella, E.; Graell, J.; Lara, I. Fruit cuticle composition of a melting and a nonmelting peach cultivar. J. Agric. Food Chem. 2014, 62, 3488–3495. [Google Scholar] [CrossRef] [PubMed]
- Oliveira, A.F.M.; Meirelles, S.T.; Salatino, A. Epicuticular waxes from caatinga and cerrado species and their efficiency against water loss. An. Acad. Bras. Ciênc. 2003, 75, 431–439. [Google Scholar] [CrossRef] [PubMed]
- Pensec, F.; Pa̧czkowski, C.; Grabarczyk, M.; Woźniak, A.; Bénard-Gellon, M.; Bertsch, C.; Chong, J.; Szakiel, A. Changes in the triterpenoid content of cuticular waxes during fruit ripening of eight grape (Vitis vinifera) cultivars grown in the upper rhine valley. J. Agric. Food Chem. 2014, 62, 7998–8007. [Google Scholar] [CrossRef] [PubMed]
- Konarska, A. Development of fruit quality traits and comparison of the fruit structure of two Vaccinium corymbosum (L.) cultivars. Sci. Hortic. 2015, 194, 79–90. [Google Scholar] [CrossRef]
- Knoche, M.; Beyer, M.; Peschel, S.; Oparlakov, B.; Bukovac, M.J. Changes in strain and deposition of cuticle in developing sweet cherry fruit. Physiol. Plant. 2004, 120, 667–677. [Google Scholar] [CrossRef]
- Alkio, M.; Jonas, U.; Sprink, T.; van Nocker, S.; Knoche, M. Identification of putative candidate genes involved in cuticle formation in Prunus avium (sweet cherry) fruit. Ann. Bot. 2012, 110, 101–112. [Google Scholar] [CrossRef] [Green Version]


| Stages | Weight | Diam.a | Firmness | TSS b | TA c | TSS /TA | EP d | RRCO2 e | Color | Waxes | |
|---|---|---|---|---|---|---|---|---|---|---|---|
| (g) | (mm) | (N) | (%) | (%) | (ng kg−1 s−1) | (μg kg−1 s−1) | Chrome | L | (g m−2) | ||
| ‘Duke’ | |||||||||||
| G | 0.96 d | 12.9 d | 4.21 a | 7.5 d | 2.8 a | 2.7 e | 0.11 c | 13.9 bc | 34.1 a | 62.8 a | 2.28 a |
| 25P | 1.10 c | 13.5 c | 2.55 b | 10.2 c | 2.1 b | 4.9 d | 0.38 b | 19.2 ab | 19.1 b | 55.7 b | 2.21 ab |
| 50P | 1.15 c | 13.7 c | 2.20 b | 10.9 c | 1.9 b | 5.9 c | 0.31 bc | 19.4 a | 14.0 c | 43.7 c | 2.19 a |
| 75B | 1.42 b | 14.5 b | 1.80 c | 13.9 b | 1.2 c | 12.1 b | 0.50 a | 16.3 ab | 5.5 d | 36.3 d | 2.25 ab |
| 100B | 1.68 a | 15.2 a | 1.74 c | 16.3 a | 0.8 d | 20.9 a | 0.64 a | 13.9 bc | 4.8 e | 35.0 d | 1.99 b |
| Significance | ** | ** | ** | ** | ** | ** | ** | ** | ** | ** | ** |
| ‘Brigitta’ | |||||||||||
| G | 1.17 cd | 13.9 d | 4.39 a | 7.8 d | 2.0 a | 3.8 d | 0.04 c | 7.1 bc | 27.4 a | 62.2 a | 1.91 b |
| 25P | 1.13 d | 13.8 c | 3.43 b | 9.1 c | 1.8 a | 4.7 cd | 0.07 bc | 8.4 ab | 17.2 b | 55.2 b | 2.07 a |
| 50P | 1.29 c | 14.3 c | 2.08 c | 9.9 c | 1.5 b | 6.9 c | 0.19 a | 10.1 a | 13.2 c | 40.9 c | 1.94 b |
| 75B | 2.01 b | 16.3 b | 1.96 d | 13.6 b | 0.9 c | 15.1 b | 0.09 bc | 6.1 c | 5.3 d | 34.1 d | 1.79 c |
| 100B | 2.47 a | 17.1 a | 1.91 d | 14.6 a | 0.5 d | 26.7 a | 0.13 ab | 6.6 bc | 5.3 d | 34.2 d | 1.78 c |
| Significance | ** | ** | ** | ** | ** | ** | ** | * | ** | ** | ** |
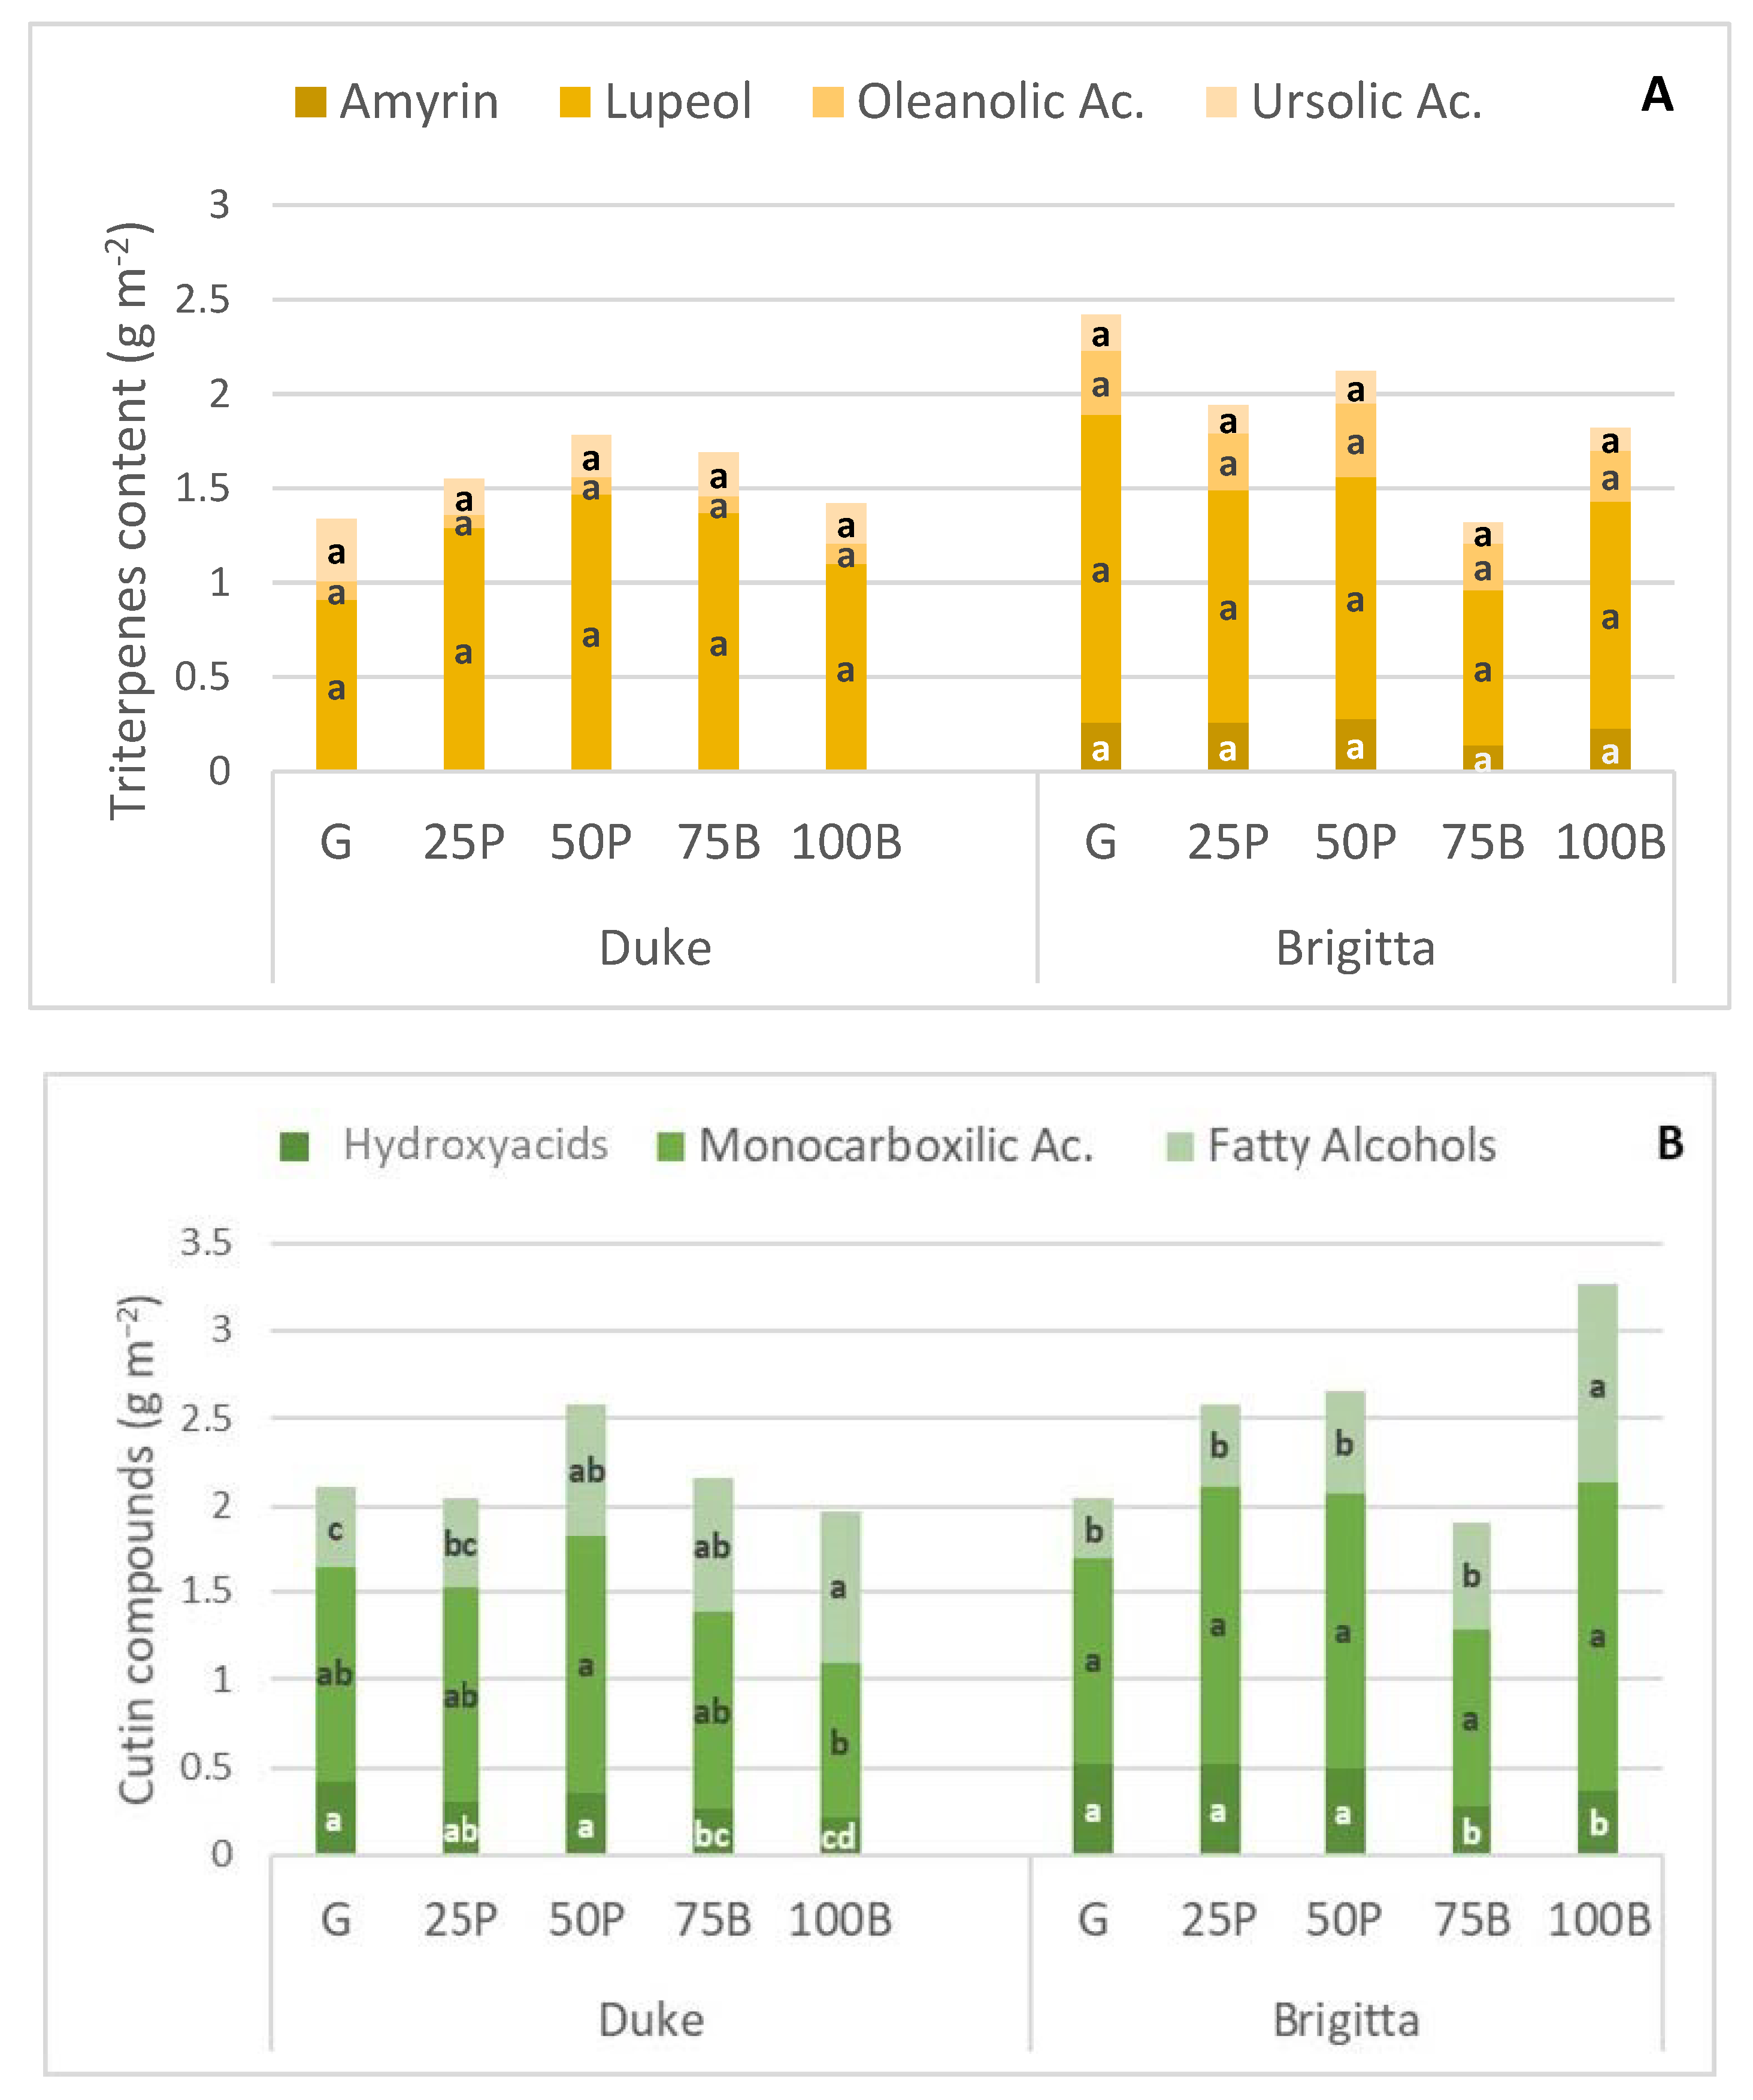
| Triterpenes (Relative %) | Cutin (Relative %) | ||||||
|---|---|---|---|---|---|---|---|
| α-Amyrin | Lupeol | Oleanolic Acid | Ursolic Acid | Hydroxyacids | Monocarboxilic Acids | Fatty Alcohols | |
| ‘Duke’ | |||||||
| G | N.d.1 | 32.6 ab | 2.3 ab | 10.9 a | 12.5 a | 37.2 a | 14.2 c |
| 25P | N.d. | 38.8 a | 1.6 b | 5.4 b | 10.4 ab | 40.3 a | 17.5 bc |
| 50P | N.d. | 23.9 b | 3.6 a | 9.7 ab | 9.6 b | 38.4 a | 20.0 b |
| 75B | N.d. | 24.1 b | 2.8 a | 8.9 ab | 8.6 b | 36.1 ab | 23.0 b |
| 100B | N.d. | 25.7 c | 4.0 a | 11.7 a | 8.0 b | 32.9 ab | 32.2 a |
| Significance | ** | ** | ** | ** | ** | ** | |
| ‘Brigitta’ | |||||||
| G | 14.5 a | 5.7 b | 18.2 a | 10.3 | 14.6 a | 33.1 | 9.7 b |
| 25P | 14.4 a | 5.9 b | 16.7 ab | 7.3 | 12.4 a | 37.7 | 11.4 b |
| 50P | 13.9 a | 5.8 b | 20.4 a | 9.01 | 11.3 a | 35.8 | 13.8 b |
| 75B | 9.1 b | 8.5 b | 14.6 ab | 7.8 | 9.8 ab | 33.2 | 21.8 a |
| 100B | 9.2 b | 4.4 a | 17.8 a | 7.3 | 7.9 b | 38.2 | 25.0 a |
| Significance | * | ** | * | n.s. | ** | n.s. | ** |
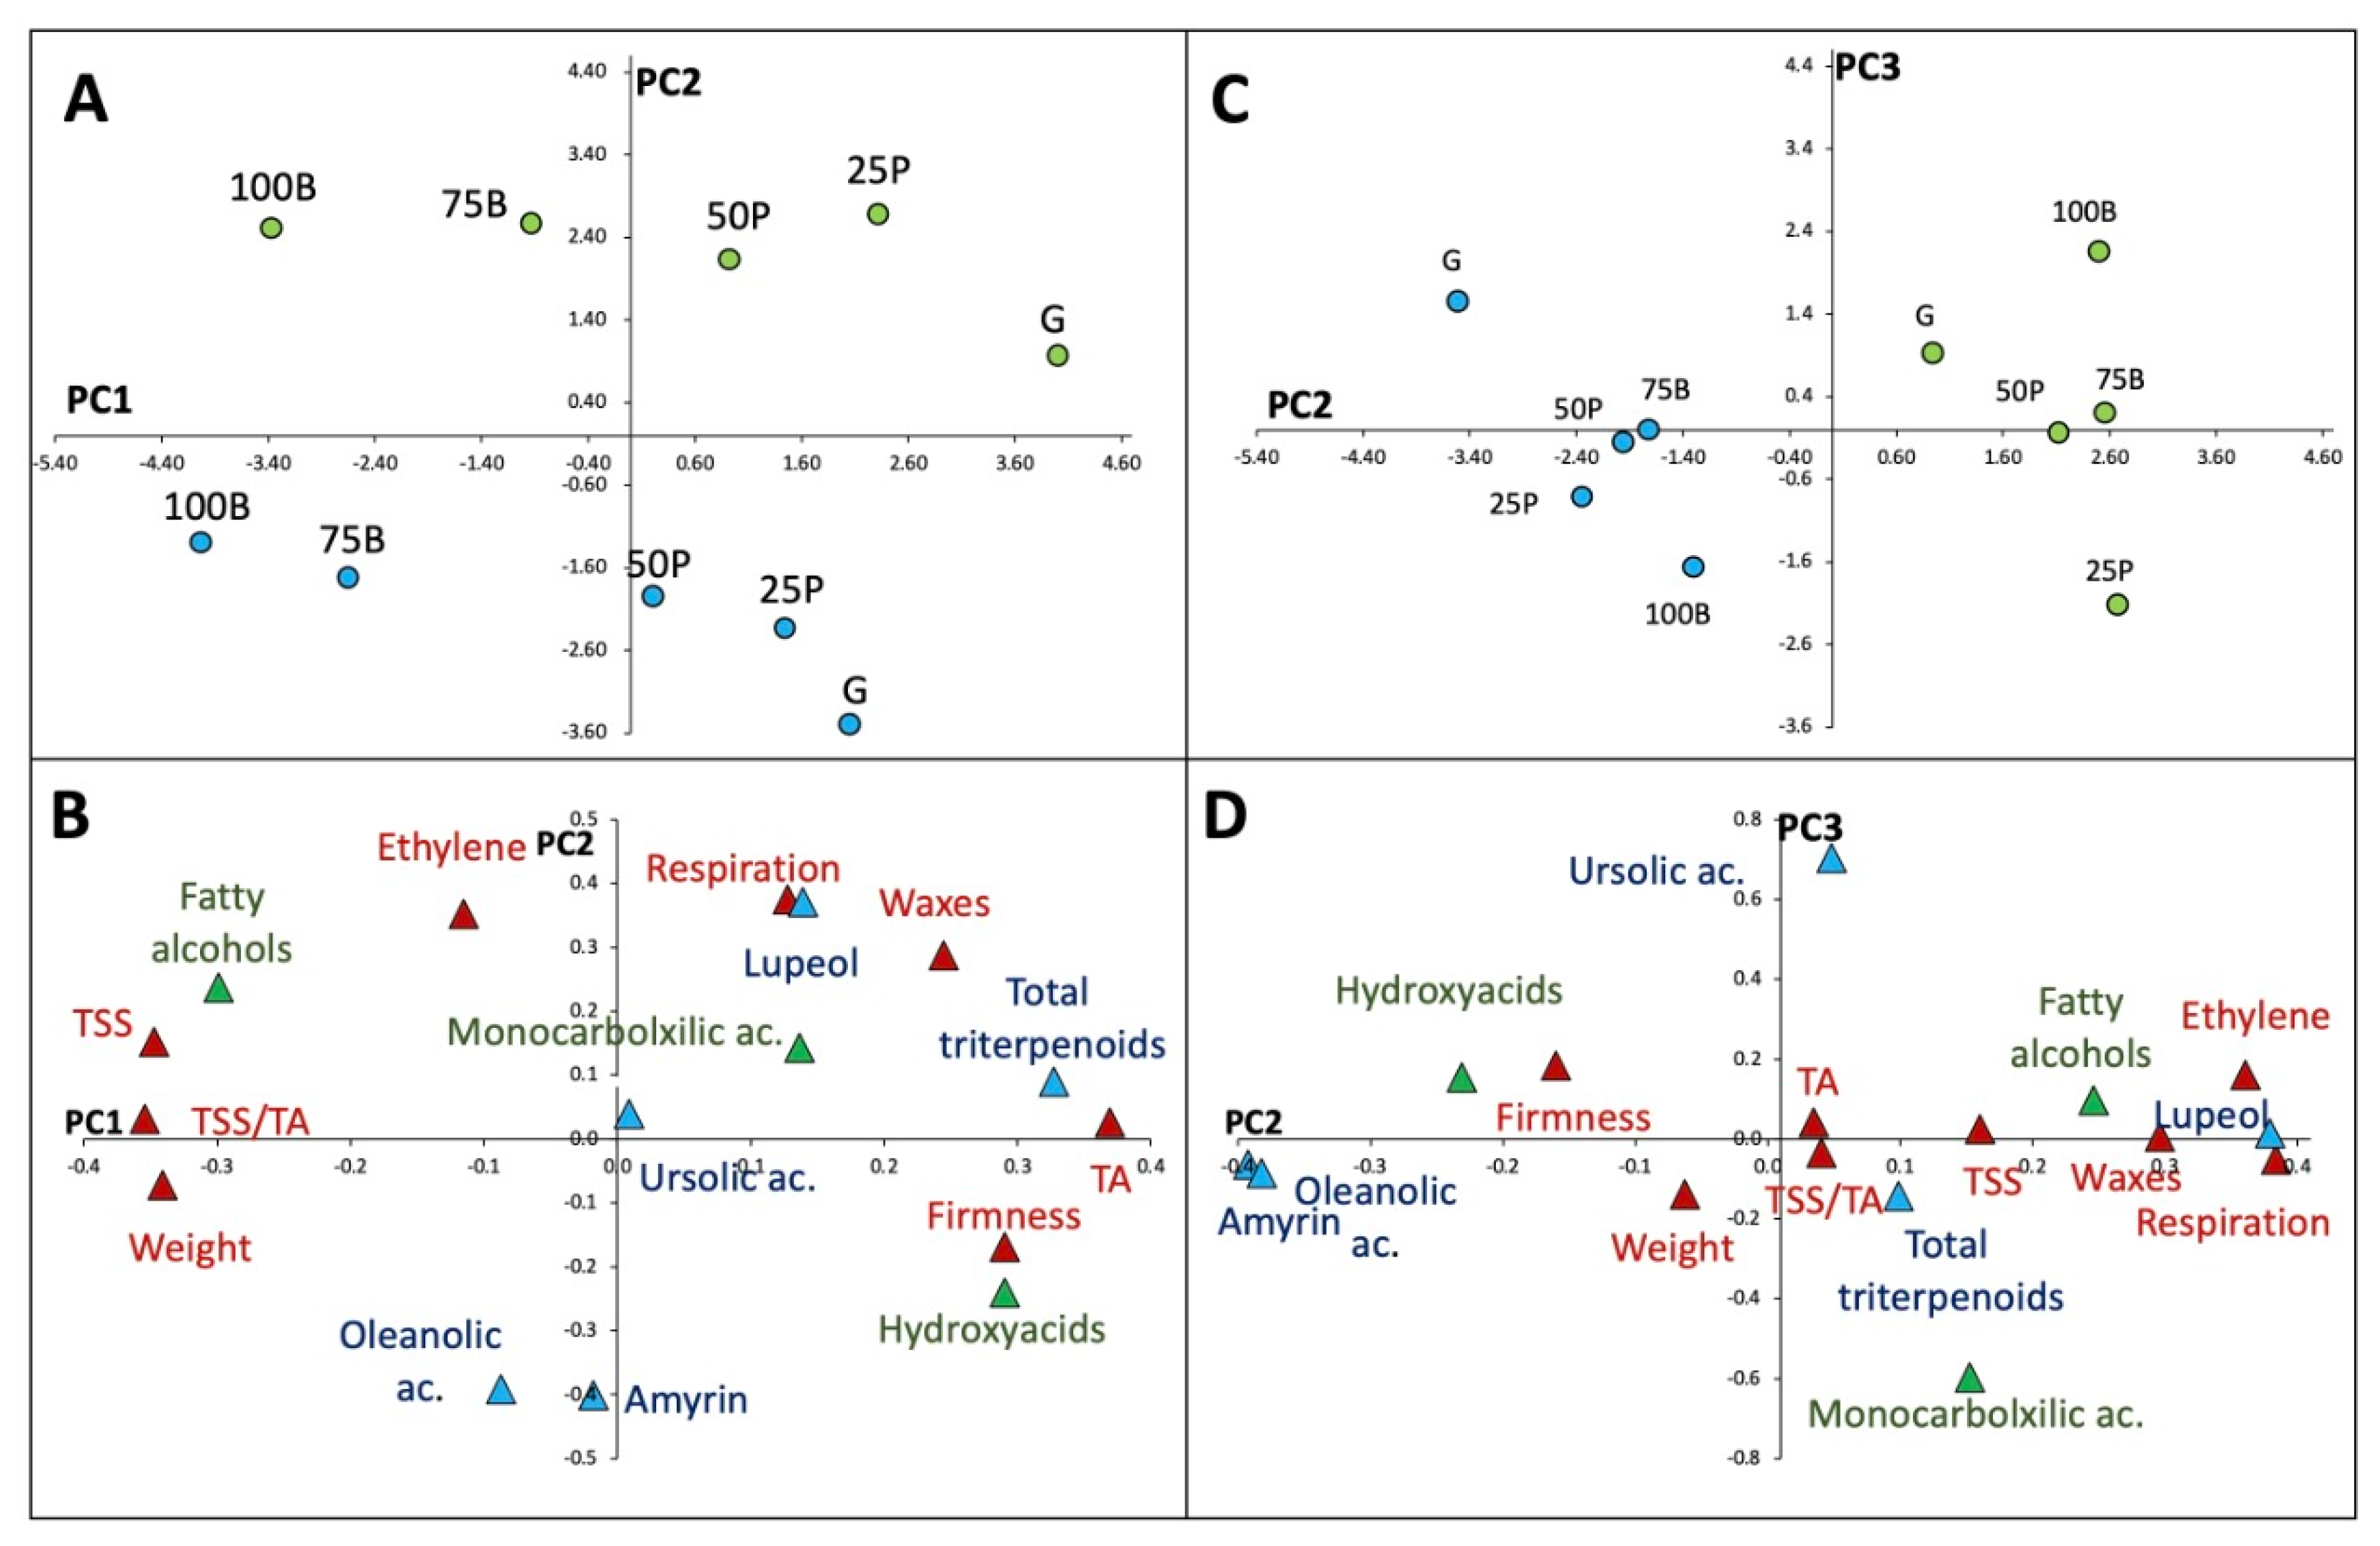
| Variable Contribution (%) | PC1 | PC2 | PC3 |
|---|---|---|---|
| Physicochemical Variables | |||
| Weight | 9.7 | 2.1 | 5.6 |
| Firmness | 8.3 | 5.0 | 7.3 |
| TSS | 9.9 | 4.5 | 1.0 |
| TA | 10.6 | 0.7 | 1.7 |
| TSS/TA | 10.1 | 0.9 | 1.4 |
| Ethylene | 3.3 | 10.4 | 6.4 |
| Respiration | 3.7 | 11.1 | 2.1 |
| Wax yields | 7.0 | 8.5 | 0.2 |
| Triterpenes | |||
| α-Amyrin | 0.5 | 11.9 | 2.6 |
| Lupeol | 4.0 | 11.0 | 0.5 |
| Oleanolic ac. | 2.5 | 11.6 | 3.5 |
| Ursolic ac. | 0.3 | 1.2 | 28.1 |
| Triterpenes (total) | 9.4 | 2.7 | 5.7 |
| Cutin component types | |||
| Hydroxyacids | 8.3 | 7.1 | 6.1 |
| Monocarboxilic acid | 3.9 | 4.2 | 23.9 |
| Fatty alcohols | 8.5 | 7.0 | 3.8 |
Publisher’s Note: MDPI stays neutral with regard to jurisdictional claims in published maps and institutional affiliations. |
© 2022 by the authors. Licensee MDPI, Basel, Switzerland. This article is an open access article distributed under the terms and conditions of the Creative Commons Attribution (CC BY) license (https://creativecommons.org/licenses/by/4.0/).
Share and Cite
Moggia, C.; Lara, I.; Graell, J.; Schmeda-Hirschmann, G.; Thomas-Valdés, S.; Lobos, G.A. Are Fruit Surface Differences in Two Blueberry Cultivars Major Drivers of Contrasting Postharvest Dynamics? Horticulturae 2022, 8, 607. https://doi.org/10.3390/horticulturae8070607
Moggia C, Lara I, Graell J, Schmeda-Hirschmann G, Thomas-Valdés S, Lobos GA. Are Fruit Surface Differences in Two Blueberry Cultivars Major Drivers of Contrasting Postharvest Dynamics? Horticulturae. 2022; 8(7):607. https://doi.org/10.3390/horticulturae8070607
Chicago/Turabian StyleMoggia, Claudia, Isabel Lara, Jordi Graell, Guillermo Schmeda-Hirschmann, Samanta Thomas-Valdés, and Gustavo A. Lobos. 2022. "Are Fruit Surface Differences in Two Blueberry Cultivars Major Drivers of Contrasting Postharvest Dynamics?" Horticulturae 8, no. 7: 607. https://doi.org/10.3390/horticulturae8070607
APA StyleMoggia, C., Lara, I., Graell, J., Schmeda-Hirschmann, G., Thomas-Valdés, S., & Lobos, G. A. (2022). Are Fruit Surface Differences in Two Blueberry Cultivars Major Drivers of Contrasting Postharvest Dynamics? Horticulturae, 8(7), 607. https://doi.org/10.3390/horticulturae8070607