Article

Comparative Examination of Phytonutrients and Antioxidant Activity of Commonly Consumed Nuts and Seeds Grown in Vietnam

1
Institute of Biotechnology and Food Technology, Industrial University of Ho Chi Minh City, Ho Chi Minh City 700000, Vietnam
2
Institute of Applied Technology, Thu Dau Mot University, Binh Duong 820000, Vietnam
3
Proteomics and Metabolomics Core Facility, Center for Biotechnology, University of Nebraska, Lincoln, NE 68503, USA
4
College of Agriculture, Can Tho University, Can Tho 900000, Vietnam
5
Faculty of Applied Technology, School of Engineering and Technology, Van Lang University, Ho Chi Minh City 700000, Vietnam
*
Author to whom correspondence should be addressed.
Horticulturae 2022, 8(6), 521; https://doi.org/10.3390/horticulturae8060521
Submission received: 27 May 2022 / Revised: 11 June 2022 / Accepted: 13 June 2022 / Published: 14 June 2022

Abstract

:
The aim of the present study was to determine the phenolics, carotenoids, B-vitamins, and antioxidant activity of nuts and seeds grown in Vietnam. The concentrations of carotenoids and B-vitamins may vary among the nuts and seeds. Watermelon seed contained the highest level of lutein while pumpkin seed was the β-carotene richest sample. Sachi inchi and sunflower seed comprised considerable levels of vitamin B1, B6, and B9. The phenolic analysis revealed that cashew contained the highest total amount of flavonoids (466.04 μg/g), with catechin, epicatechin, and procyanidin B2 predominating over the other flavonoids. Likewise, chlorogenic and neochlorogenic acids made up the highest total amount of phenolic acids in sunflower seed (1870.41 μg/g). Walnut appeared to possess the highest antioxidant activity evaluated by DPPH, ABTS, FRAP, and reducing power assays. The correlation analysis indicated strong positive correlations between total phenolic content with DPPH and FRAP values. Principal component analysis graphically showed the distant positioning of cashew and sunflower seed, highlighting their significantly higher levels of phenolics. The findings of the study would be useful to improve nutrient database contents for flavonoids and phenolic acids as well as to promote the consumption of nut and seed products in Vietnam.

1. Introduction

Nuts and seeds have been regular components of the human diet for thousands of years [1]. Along with vegetables, beans, fruits, and oils, nuts and seeds are essential parts of the Mediterranean heart-healthy diet. Currently, they are widely used all over the world in candies, ice cream, non-dairy milk alternatives, baked goods, or consumed as snacks [2]. Numerous studies have shown that the consumption of nuts and seeds was linked with reduced risks of cardiovascular diseases, improvements in cognitive functions of older people, and protection against certain cancers [3,4,5,6]. These health benefits are in part ascribable to phenolics which are found ubiquitously in those products. Phenolics are referred to as a major group of phytochemicals whose molecules consist of one or more benzene rings carrying hydroxyl groups. They are divided into subgroups, including tannins, lignans, stilbenes, flavonoids, phenolic acids, and phenolic aldehydes [7]. Phenolics are widely known to possess free radical scavenging activity. Furthermore, research has provided evidence that phenolics have the capacity to control the formation of free radicals in oxidative stress-associated human diseases [8,9]. For example, flavonoids, such as genistein, kaempferol, and quercetin, mitigate hyperglycemia-induced inflammatory responses and free radicals known to develop type 2 diabetes and cardiovascular complications [10,11]. Neuroinflammation, iron accumulation, and/or reduction in endogenous antioxidants are thought to trigger neurodegeneration in Parkinson’s disease [12,13]. Reportedly, flavonoids may possess the great potential to alleviate such neuronal injury, thereby retarding the development of diseases.
Historically, several nut tree species, such as cashew and peanut, were disseminated to Vietnam perhaps during the French colonization of the country in the 19th century [14,15]. Following the government’s encouragement, Vietnam’s nut processing industry began to emerge in the early 1980s. Currently, the country is one of the world’s largest producers and exporters of cashew [16]. In 2020, it exported more than 520 thousand tonnes of cashew kernel worth USD 3.2 billion [17]. Unlike cashew and peanut, macadamia is the tree species first introduced to Vietnam in the 1990s, and its cultivation on a commercial scale was started in 2000 [18]. Sacha inchi, a plant native to the Peruvian Amazon, was first grown in Vietnam about ten years ago. Walnut, which is known as one of the most commercially cultivated nut trees, has recently been planted in the northwestern part of Vietnam [19]. Unlike the other tree nuts, the production of walnut entirely depends on harvesting from wild trees.
Over the past few years, annual consumption and markets for nuts and seeds are growing. Consumers are more aware of the health benefits these products may provide. While data on the physicochemical properties and nutritional value of Vietnam-grown nuts and seeds have been well recorded, information about their phenolic compounds is very limited. Moreover, evidence has suggested that genetic and environmental factors may have an impact on the phytochemical contents of nuts and seeds. The aim of the study was to gain insight into phenolic compositions, carotenoids, B-vitamins, and the antioxidant activity of nuts and seeds grown in Vietnam. The results generated in the study would not just give a better understanding of how these constituents contribute to the health benefits of nut and seed consumption but also help promote increased usage of these products in the country.

2. Materials and Methods
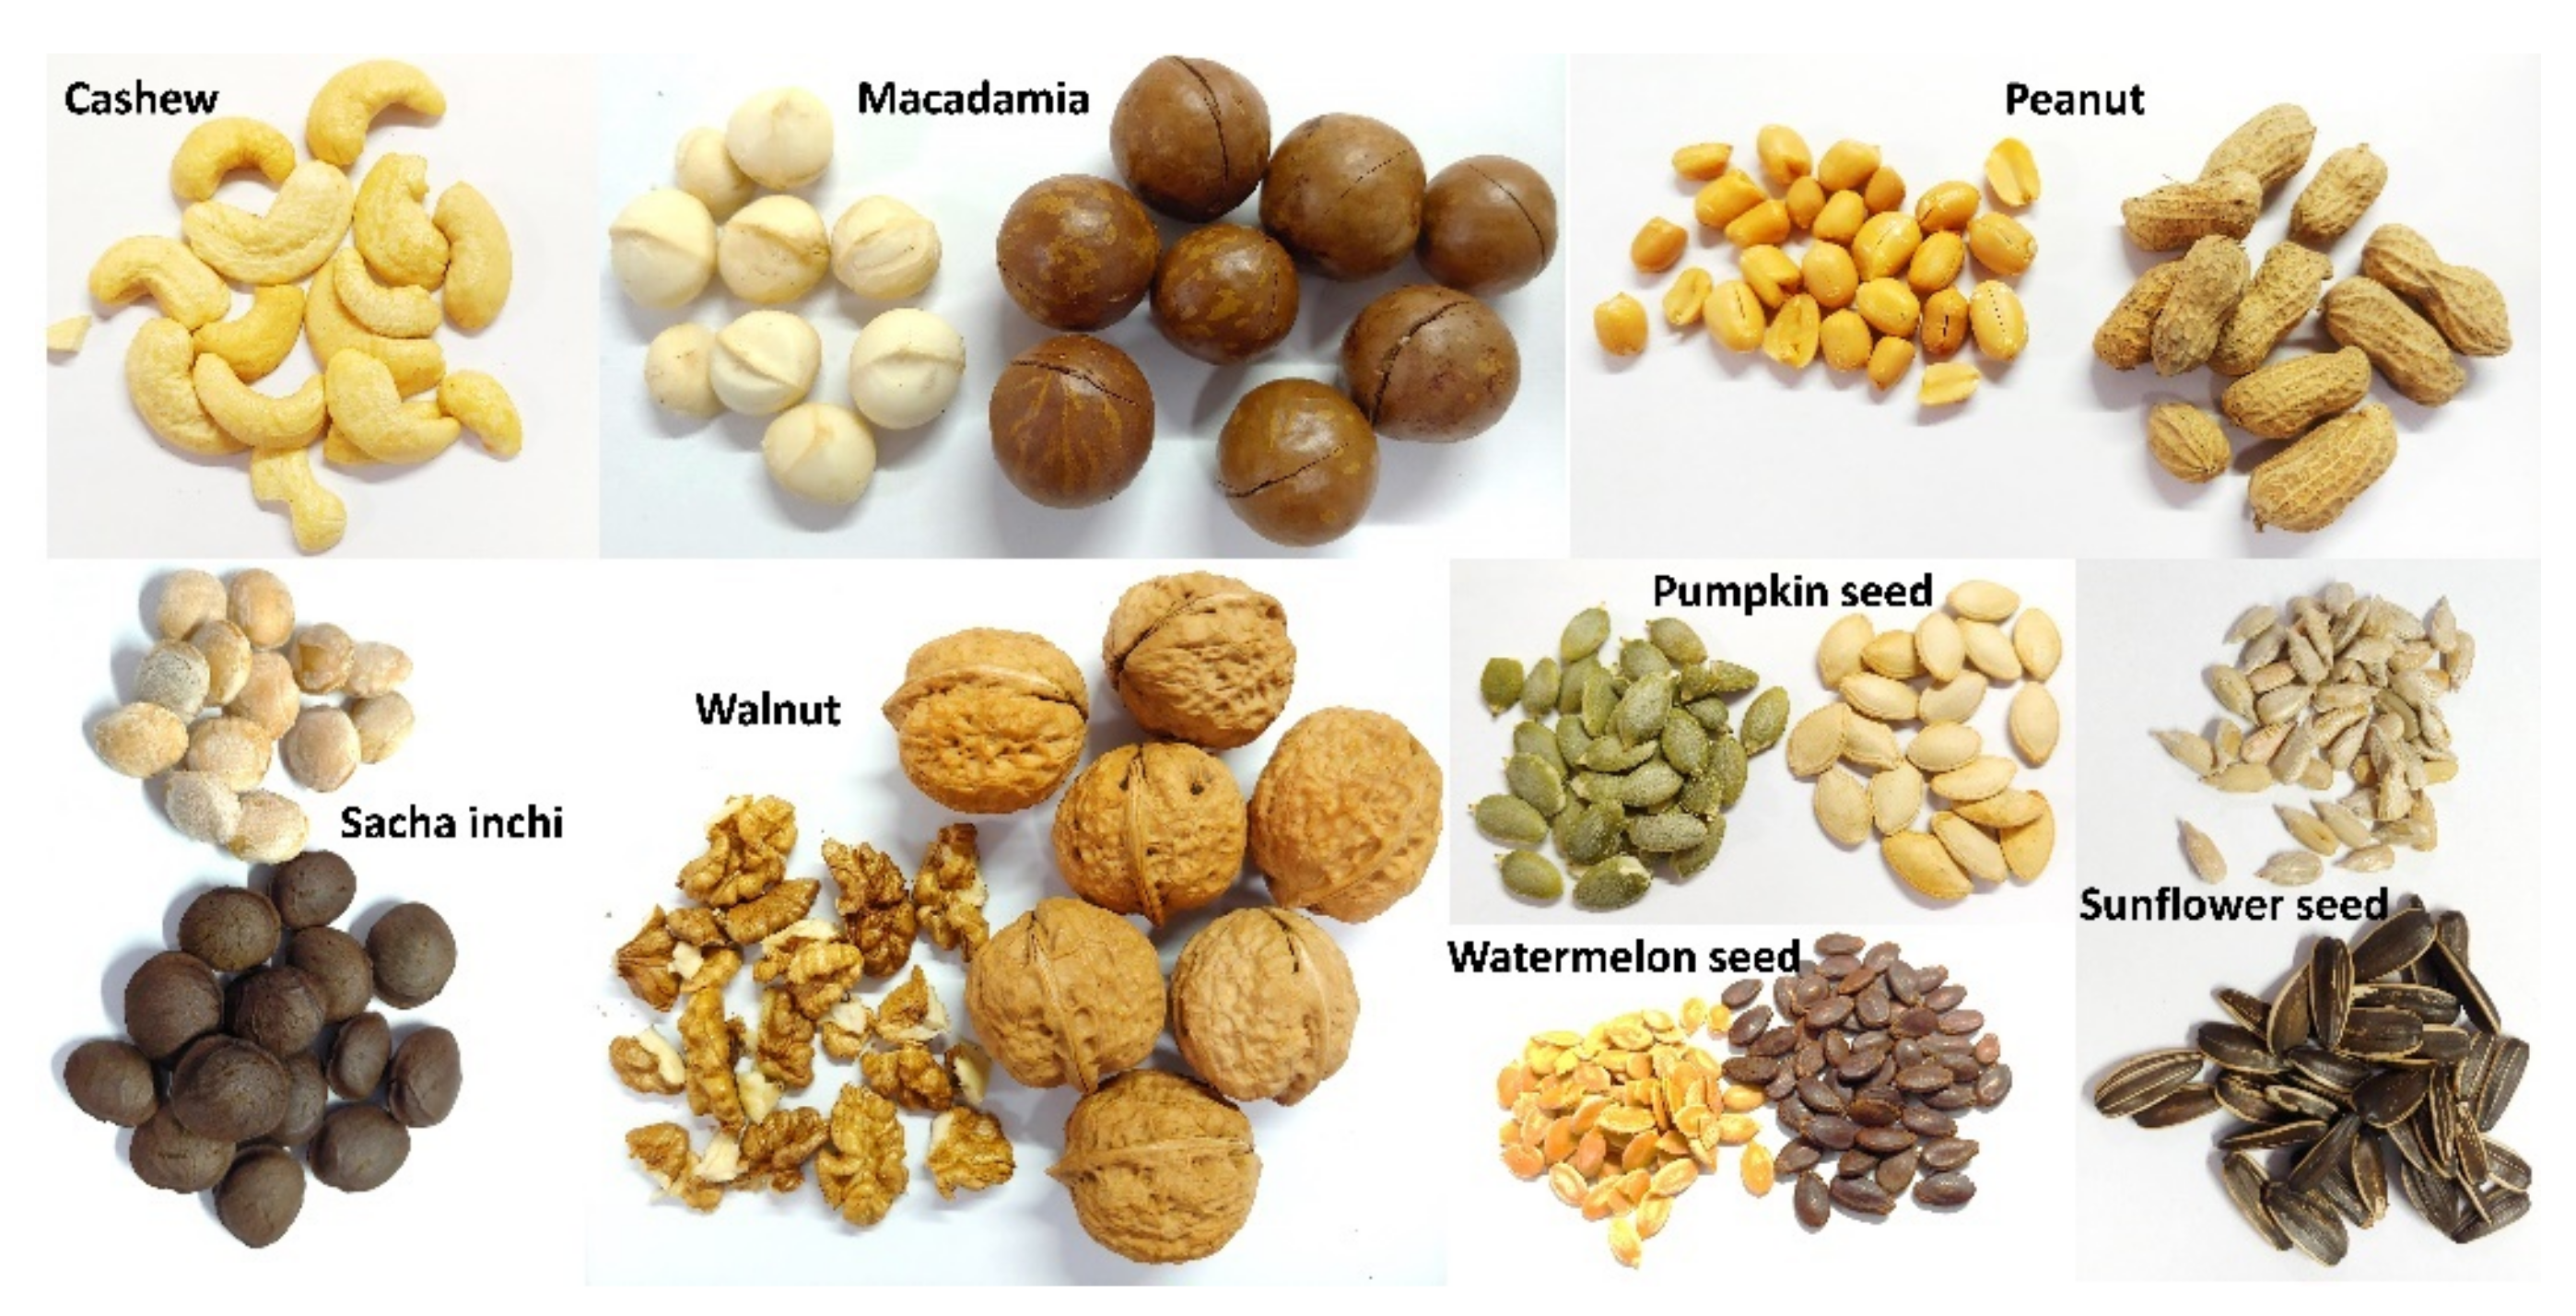
2.1. Samples

Eight nuts and seeds, including cashew, macadamia, peanut, sacha inchi, walnut, pumpkin seed, sunflower seed, and watermelon seed, were selected for the study (Figure 1, Table 1). The products were obtained from local suppliers throughout Vietnam. All the nuts and seeds, except cashew, were unshelled, prepackaged, and branded samples. After being collected, the samples were stored at −20 °C until analysis.

2.2. Chemicals

Analytical standards obtained from Sigma-Aldrich (St. Louis, MO, USA) include caffeic acid, cinnamic acid, chlorogenic acid, p-coumaric acid, daidzein, (−)-epicatechin, ferulic acid, gallic acid, genistein, hesperetin, kaempferol, phloretin, procyanidin A2, procyanidin B2, protocatechuic acid, quercetin, quercetin-3-O-glucoside, quercetin 3-O-galactoside, resveratrol, rutin, syringic acid, and vanillic acid. (+)-Catechin hydrate was purchased from Cayman Chemicals (Ann Arbor, Michigan, USA). Apigenin, luteolin, HPLC grade methanol, naringenin, and naringenin chalcone were purchased from Fisher Scientific (Pittsburgh, Pennsylvania, USA). Lutein and zeaxanthin were purchased from Chengdu Biopurify Phytochemicals Ltd. (Chengdu, Sichuan, China).

2.3. Determination of B-Vitamins

Each nut (1 g) was weighed into a screw-capped tube, then 1 mL of NaOH (0.1 M) and 10 mL of phosphate buffer (1 M, pH = 5.5) were added for hydrolysis. The mixture was kept in the dark for 24 h, followed by centrifugation (5500 rpm, 10 min). The supernatant was collected and filtered through a 0.45 micron Whatman Anotop filter (GE Healthcare, Germany). The filtrate obtained was injected into a high-performance liquid chromatograph (HPLC) [20].

2.4. Estimation of Carotenoids

β-carotene was estimated following the method described by Lichtenhaler et al. (1983) and D’Souza et al. (1992) [21,22]. An amount of each nut (1 g) was mixed with 10 mL of acetone in a screw-capped tube. The mixture was vortexed for 1 min and shaken for 24 h at ambient temperature in a horizontal shaker. The mixture was then centrifuged at 5500 rpm for 10 min. The upper phase was collected, and the absorbance was measured at 450 and 503 nm. The concentration of β-carotene (μg/g) was estimated as follows:
β-carotene = (4.367 × A450 − 2.947 × A503) × V/W
where V and W are the volume of the solvent (mL) and the amount of the sample (g), respectively.
Xanthophylls (lutein and zeaxanthin) in the samples were analyzed on an HPLC system. To extract these compounds, each ground sample was mixed with acetone at a ratio of 1:8 (g/mL) in a screw-capped tube. The extraction was conducted under dim light to avoid the degradation of carotenoids. The mixture was vigorously shaken on an orbital shaker for 24 h, followed by centrifugation for 15 min at 5500 rpm. The supernatant was collected and transferred into a vial before injection into HPLC. The analysis was performed using an Agilent 1260 Infinity II HPLC coupled to a diode-array detector. The separation was performed on a Waters Spherisorb S5 ODS1 (4.6 mm × 250 mm; 5 μm) chromatographic column. The gradient elution of the mobile phase, (A) 0.1 M Tris-HCl pH 8.0, (B) acetonitrile, (C) methanol, and (D) ethyl acetate, was as follows: between 0 and 15 min, the linear gradient was increased from 14–0% A, 84–15% B, 2–60% C, 0–25% D, and was maintained for 3 min; 18–19 min, 0–14% A, 15–84% B, 60–2% C, 25–0% D. The flow rate was 1.2 mL/min and the column was set at ambient temperature. The detection was set at 450 nm. The processing of chromatographic data was performed using the OpenLab Chemstation software platform (Agilent Technologies, CA, USA).

2.5. HPLC-MS/MS Analysis of Phenolic Compounds

The nuts and seeds were shelled, and the kernels obtained were used for analysis. An amount of a ground nut or seed (i.e., kernel) was weighed into an Eppendorf tube. Methanol was used to extract phenolics from the sample. The ratio of the sample and extractant was 100:3 (mg/mL). Two precleaned stainless steel beads (4.8 mm diameter, Biospect Products, OK, USA) were placed in the tube. The sample homogenization was performed in a homogenizer (TissueLyzer II, Qiagen, Germany) at 20 Hz for 10 min and centrifuged at 16000 rpm for 5 min. The supernatant was collected and evaporated using a SpeedVacTM vacuum concentrator (Thermo Scientific, MA, USA). The residue obtained was then resuspended in 100 μL of 30% methanol and transferred into an HPLC vial. Phenolics, including phenolic acids and flavonoids, in the sample, were identified using a Shimadzu Nexera X2 high-performance liquid chromatograph coupled to a Sciex QTRAP 6500+ mass spectrometer (HPLC-MS/MS). An Agilent Eclipse XDB C18 (100 mm × 3.0 mm; 3.5 μm particle size) reverse-phase column was used for chromatographic separation as previously described by Vu and Alvarez (2021) [23]. The mobile phase was constituted of 2% acetic acid (A) and 100% acetonitrile (B). The gradient elution was programmed as follows: 0–0.1 min, 6% B; 0.1–5 min, 6–17% B; 5−8 min, 17–20% B; 8–16 min, 90% B; 16–18 min, 90% B; 18–19 min, 6% B. The flow rate was set at 0.4 mL/min. For the quantitative purpose, a synthetic strigolactone (GR24) was used as an internal standard. The extraction efficiency was determined based on the extraction recovery rate of the internal standard. In detail, 10 μL of the internal standard (10 μM) was spiked and the recovery rate calculated was higher than 90%. Chromatographic data were processed using Analyst 1.6.3 (Sciex, MA, USA).

2.6. Evaluation of Antioxidant Activity

An amount of a sample was mixed with methanol at a ratio of 1:8 (g/mL) in a screw-capped tube. The mixture was shaken for 24 h and centrifuged for 15 min at 5500 rpm. The supernatant was obtained and used for estimating antioxidant activity.

2.6.1. DPPH Assay

A solution of DPPH in 80% methanol was prepared at a concentration of 40 μg/mL and kept in a refrigerator before further use. Ascorbic acid was used as a reference standard. A volume of the sample extract obtained above, or the ascorbic acid solution was mixed with the DPPH solution at a ratio of 2:3 (v/v). After incubation at 37 °C for 30 min in the dark, the mixture was spectrophotometrically measured at 517 nm [24]. The DPPH antioxidant activity was predicted using the calibration curve (y = 0.0456x + 0.0295; R2 = 0.98) constructed for ascorbic acid (0.625–10 μg/mL). The results are expressed in microgram ascorbic acid equivalents (AAE)/g fresh weight.

2.6.2. ABTS Assay

A mixture of ABTS (7 mM) and potassium persulfate (2.45 mM) at a ratio of 1:1 (v/v) was prepared and allowed for a 12–16 h incubation at ambient temperature in the dark, resulting in an ABTS radical working solution. The absorbance of this solution at 734 nm was adjusted to 0.75 ± 0.02 by a phosphate-buffered saline (pH = 7.4). The sample extract or the ascorbic acid solution was mixed with the ABTS working solution at a ratio of 1:30 and the absorbance was measured at 734 nm [25]. The ABTS antioxidant activity was estimated using the calibration curve (y = 0.006x − 0.0035; R2 = 0.99) constructed for ascorbic acid (3.125–100 μg/mL). The results are expressed in microgram ascorbic acid equivalents (AAE)/g fresh weight.

2.6.3. FRAP Assay

A TPTZ (2,4,6-Tris(2-pyridyl)-s-triazine) solution was prepared by dissolving 156 mg of TPTZ in 50 mL of 40 mM HCl. This solution was kept in a refrigerator and used within 2 weeks. A working FRAP solution was prepared by mixing 10 mL of acetate buffer (pH = 3.6), 1 mL of 10 mM TPTZ, and 1 mL of ferric chloride solution in a tube. The sample extract, reference standard solution (Trolox), or water (100 μL) was mixed with 2.4 mL of the working FRAP solution. The absorbance of the mixture was spectrophotometrically measured at 593 nm or 620 nm [24]. The standard curve (y = 0.0012x + 0.0297) constructed for Trolox (31.25 and 1000 μM) was used to calculate the FRAP antioxidant activity. The results are expressed in mM Trolox equivalents (TE)/g fresh weight.

2.6.4. Reducing Power Assay

The antioxidant activity was determined by reducing the power assay previously described by Xiao et al. (2014) [24]. In brief, the reaction mixture consisting of 0.5 mL of phosphate buffer (pH = 6.0), 0.2 mL of the sample extract or ascorbic acid solution, and 0.5 mL of 1% potassium ferricyanide was well shaken and incubated at 50 °C for 20 min. The mixture was added with 0.5 mL of trichloroacetic acid (10%) and then vortexed for 1 min. The supernatant (0.8 mL) and 1% ferric chloride (0.4 mL) were pipetted into a tube containing 2 mL of distilled water. The absorbance of the mixture was measured at 700 nm. The standard curve (y = 0.0018x + 0.0567; R2 = 0.99) was constructed between 100 and 500 μg/mL ascorbic acid. The results are expressed in mg ascorbic acid equivalents (AAE)/g fresh weight.

2.7. Statistical Analysis

All the measurements were performed in triplicate. The results obtained were expressed as mean ± standard error. One-way analysis of variance (ANOVA) was used to determine differences in phenolic contents among the studied nuts and seeds, followed by Tukey’s Studentized Range HSD test at a significant level of p < 0.05. Correlations between antioxidant activity, total phenolic content, and concentrations of phenolics in the samples were assessed. The statistical analyses were performed using XLSTAT 2016 software (Addinsoft, Paris, France). Principal component analysis (PCA) and heatmap were implemented using MetaboAnalyst 4.0 [26].

3. Results and Discussion

3.1. Carotenoids and B-Vitamins

The results indicated the presence of lutein, zeaxanthin, and β-carotene at significantly different concentrations noted among the samples (Table 2). Lutein was found in four of the nuts and seeds with the levels following the order: watermelon seed > cashew > sunflower seed ≈ walnut while zeaxanthin was detected only in the latter two. The results of cashew and walnut in the present study were comparable with those reported in prior research by Stuetz et al. (2017) [27]. Unlike xanthophylls, β-carotene was detected in all the nuts and seeds examined in the study. Pumpkin seed comprised the highest amount of this compound, with 100 g of the seed providing about 1% of the RDA (recommended dietary allowance) for β-carotene. Sacha inchi and walnut were composed of 49.6 and 48.0 μg/100 g, reaching 0.5% of the RDA for β-carotene. The other samples contained from 7.3 to 28.5 μg of β-carotene per 100 g, representing from <0.1% to 0.5% of the RDA.
Table 2 also showed the results of vitamin B1, B6, and B9 contents in the studied samples. The analysis of B-vitamins revealed vitamin B1 was the most abundant in sachi inchi and sunflower seed, reaching the RDA for these vitamins by 100 g of each sample. These two nuts and seeds were also found to comprise the highest levels of vitamin B6 and B9 compared to the others. Along with sacha inchi and sunflower seed, peanut contains all of the three B-vitamins, with an estimated consumption of 100 g providing from 23% to 50% of the RDA.

3.2. Flavonoids

As seen in Table 3, apigenin, which belongs to the flavone class, was detected at the highest concentration in watermelon seed (240.00 μg/100 g). Notably, the value was about 50–200 times as high as those in cashew, peanut, sacha inchi, and walnut. Besides, no significant differences in the levels of apigenin among these nuts were observed. This compound was not found in the two other seeds and macadamia. Prior research reported the level of apigenin in raw sunflower seed was 2.9 μg/g [28]. Other than that, very limited data about apigenin in oil nuts and seeds have been documented. Another flavone monitored in this study is luteolin which was present in all the samples. Similarly, the watermelon seed contained significantly higher levels of luteolin (1792.65 μg/100 g) compared to the other samples (2.67–12.14 μg/100 g). A previous study by Win et al. (2011) showed both raw and roasted peanuts did not contain luteolin [29]. Surprisingly, a recent study by Wu et al. (2021) reported no detection of free and bound forms of this compound in walnut kernel [30]. These discrepancies could partly be due to differences in nut origins, the phenolic extraction method, or HPLC analytical method (DAD vs. MS/MS).
Among the flavonoids examined in the study, catechin and epicatechin are classified as flavan-3-ols, also known as flavanols. The results showed that catechin and epicatechin in cashew (256.99 and 182.67 μg/g, respectively) were much more abundant than in the other species. In addition, these compounds were the most abundant flavonoids in cashew. The catechin level in cashew was comparable to those reported in prior research [31]. However, compared with a study conducted by Bittner et al. (2013), 3–4 times higher levels of catechin and epicatechin in cashew in the present study were observed [32]. For macadamia and peanut, comparable results were found in the studies. In general, the findings showed walnut in the present study had a concentration 3–5 times lower than those reported in previous studies [32,33,34,35]. Watermelon seed was the only sample that did not contain both catechin and epicatechin. Along with catechin and epicatechin, procyanidin B2, an important dimeric catechin, was included in the study. The results revealed that this compound was detected only in cashew, showing agreement with prior research [32].
Quercetin and its glycosides have previously been reported in many oil nuts, such as peanut and walnut [34,35]. In the present study, quercetin glucoside (Q3G) was detected in all the nuts and seeds, with concentrations ranging between 2.97 and 1043.49 μg/100 g (Table 3). Cashew had the highest content of Q3G, followed by walnut (416.09 μg/100 g). In a previous study, walnut commercially available in the U.S. contained about 367 μg of Q3G per 100 g of nut [34]. The figure for a China-cultivated walnut evaluated in a recent study was about 19.7 μg/100 g [30]. Sunflower seed was composed of a ten times higher amount of this flavonoid compared to the other seeds. Quercetin galactoside (Q3GA) was found only in cashew, walnut, and sunflower seed. Unlike Q3G, Q3GA in nuts and seeds has scarcely been investigated. Rutin, also known as quercetin rutinoside, was detected in peanut (97.75 μg/100 g) and sunflower seed (6.21 μg/100 g). Previously, rutin in various peanut cultivars grown in the U.S. was quantified, with mean concentrations ranging from 310 to 4230 μg/100 g [36]. The compound was also reported in seeds of some sunflower genotypes cultivated in Serbia, with levels ranging between 2300 and 5700 μg/100 g [37]. Recently, a study on phenolics in cashew has indicated the presence of rutin in the raw nut and the level slightly increased during the heating process [31]. The results yielded evidence that quercetin was present in all the species, except for sacha inchi and pumpkin seed. Similar to Q3G, quercetin was found at the highest level in cashew, followed by walnut. The compound was also more abundant in the nuts compared to the seeds. Unlike Q3G and Q3GA, quercetin has more often been included in research on nut phytochemicals. Of the compounds presented in Table 3, resveratrol was not found in walnut and pumpkin seed. The resveratrol level of peanut (14.18 μg/100 g) in the present study was comparable to those reported previously by Win et al. (2011) and Chukwumah et al. (2012) [29,36]. Prior research has revealed that cashew, walnut, pumpkin, and sunflower seeds contained about 110–1410 μg of resveratrol per 100 g [31,33]. The results also indicated the detection of genistein, hesperetin, kaempferol, naringenin, and phloretin in the studied nuts and seeds. These compounds were found at low concentrations and/or undetected in some of the samples. For example, kaempferol was present only in cashew at a level of 84.03 μg/100 g whereas it was not detected in the other samples. Several studies have shown the presence of kaempferol in cashew [31], peanut [29], walnut [30], and sunflower seed [33]. A comparable amount of genistein in peanut reported previously by Chukwumah et al. (2012) was found in the present study [36]. A study conducted by Wu et al. (2021) providing comprehensive information about walnut phenolics indicated a similar amount of naringenin in the nut in comparison with the results in the present study [30].
Limited information about the presence as well as the abundance of flavonoids in oil nuts and seeds is available in the literature. Moreover, the available data are not consistent among the studies. The discrepancy could be due to differences in sample preparation (defatted vs. non-defatted samples), extraction methods, and analytical instruments used for quantification. In addition, growing conditions, postharvest time, uses of local nut cultivars and horticultural traits of trees producing nuts/seeds are factors contributing to the variations [38].

3.3. Phenolic Acids

In the present study, ten phenolic acids belonging to two groups, namely hydroxycinnamic acids and hydroxybenzoic acids, were identified and quantified in the nuts and seeds (Table 4). Among the hydroxycinnamic acids examined, chlorogenic acid appeared to be the most abundant compound, with concentration values widely ranging from 2.62 to 1478.68 μg/g. While the results demonstrated this phenolic acid had the highest level in sunflower seed, a study by Pająk et al. (2014) conversely reported no detection [28]. Along with chlorogenic acid, the other hydroxycinnamic acids, excluding p-coumaric and ferulic acids, were found at the highest concentrations in sunflower seed compared to the other species, corroborating the findings of Kalogeropoulos et al. (2013) [33]. Despite being minor compounds in sunflower seed, p-coumaric and ferulic acids were found at the highest levels (138.25 μg/g and 5.43 μg/g, respectively) in peanut. As described above, gallic acid was the only phenolic acid undetected in pumpkin seed. Walnut was the nut that contained the most gallic acid (70.46 μg/g), followed by cashew (19.31 μg/g). No significant differences in gallic acid concentrations were observed for the other samples. For the other hydroxybenzoic acids, sunflower seed and macadamia syringic acid were similarly composed of the highest content of syringic acid while watermelon seed was the richest source of protocatechuic and vanillic acids.
The sum of flavonoids and phenolic acids in each sample was calculated and shown in Table 3 and Table 4. In comparison with the other nuts and seeds, cashew contained a much higher total amount of flavonoids (466.04 μg/g) to which catechin and epicatechin significantly contributed. Evidence showed this raw nut exerted stronger antioxidant efficacy than other nuts [39]. We also observed insignificant differences in total amounts of flavonoids among peanut, walnut, and watermelon seed (17.60–20.69 μg/g). While sunflower seed comprised a low level of flavonoids, it may be considered a rich source of phenolic acids with a total level of 1870.41 μg/g. The results also demonstrated that sacha inchi was composed of a considerably lower amount of phenolics compared to the other nuts and seeds examined in the study. We also estimated the total amount of phenolics (TPC) in the samples using the Folin–Ciocalteu reagent [30]. Through the calculation of the TPC of the extracts (Table 4), it was shown that walnut had the highest TPC (49.87 mg GAE/g), followed by sunflower seed (18.82 mg GAE/g).
Nuts and seeds rich in flavonoids and phenolic acids are recognized for their health benefits, in particular for reducing risks of heart disease. The US Food and Drug Administration (FDA) suggests one serving of nuts (42.5 g) per day may reduce the risk of heart disease. Similarly, an investigation into the consumption of nuts, such as peanut and walnut, among people living in the US and China indicated 17% to 21% lower risks of cardiovascular disease mortality [40]. Regular consumption of cashew (30 g) could reduce systolic blood pressure and improve HDL cholesterol levels among Asian Indians with type 2 diabetes [41]. Based on the phenolic contents described above, dietary intake of phenolics by consuming one serving of nuts or seeds was estimated and compared to typical daily intakes previously reported. The phenolics provided via consumption of one serving of nuts (42.5 g) or seeds (28.3 g) were able to cover 0.1–32% of the daily intake in comparison with 165.6 mg of flavonoid intake reported for Chinese adults [5].

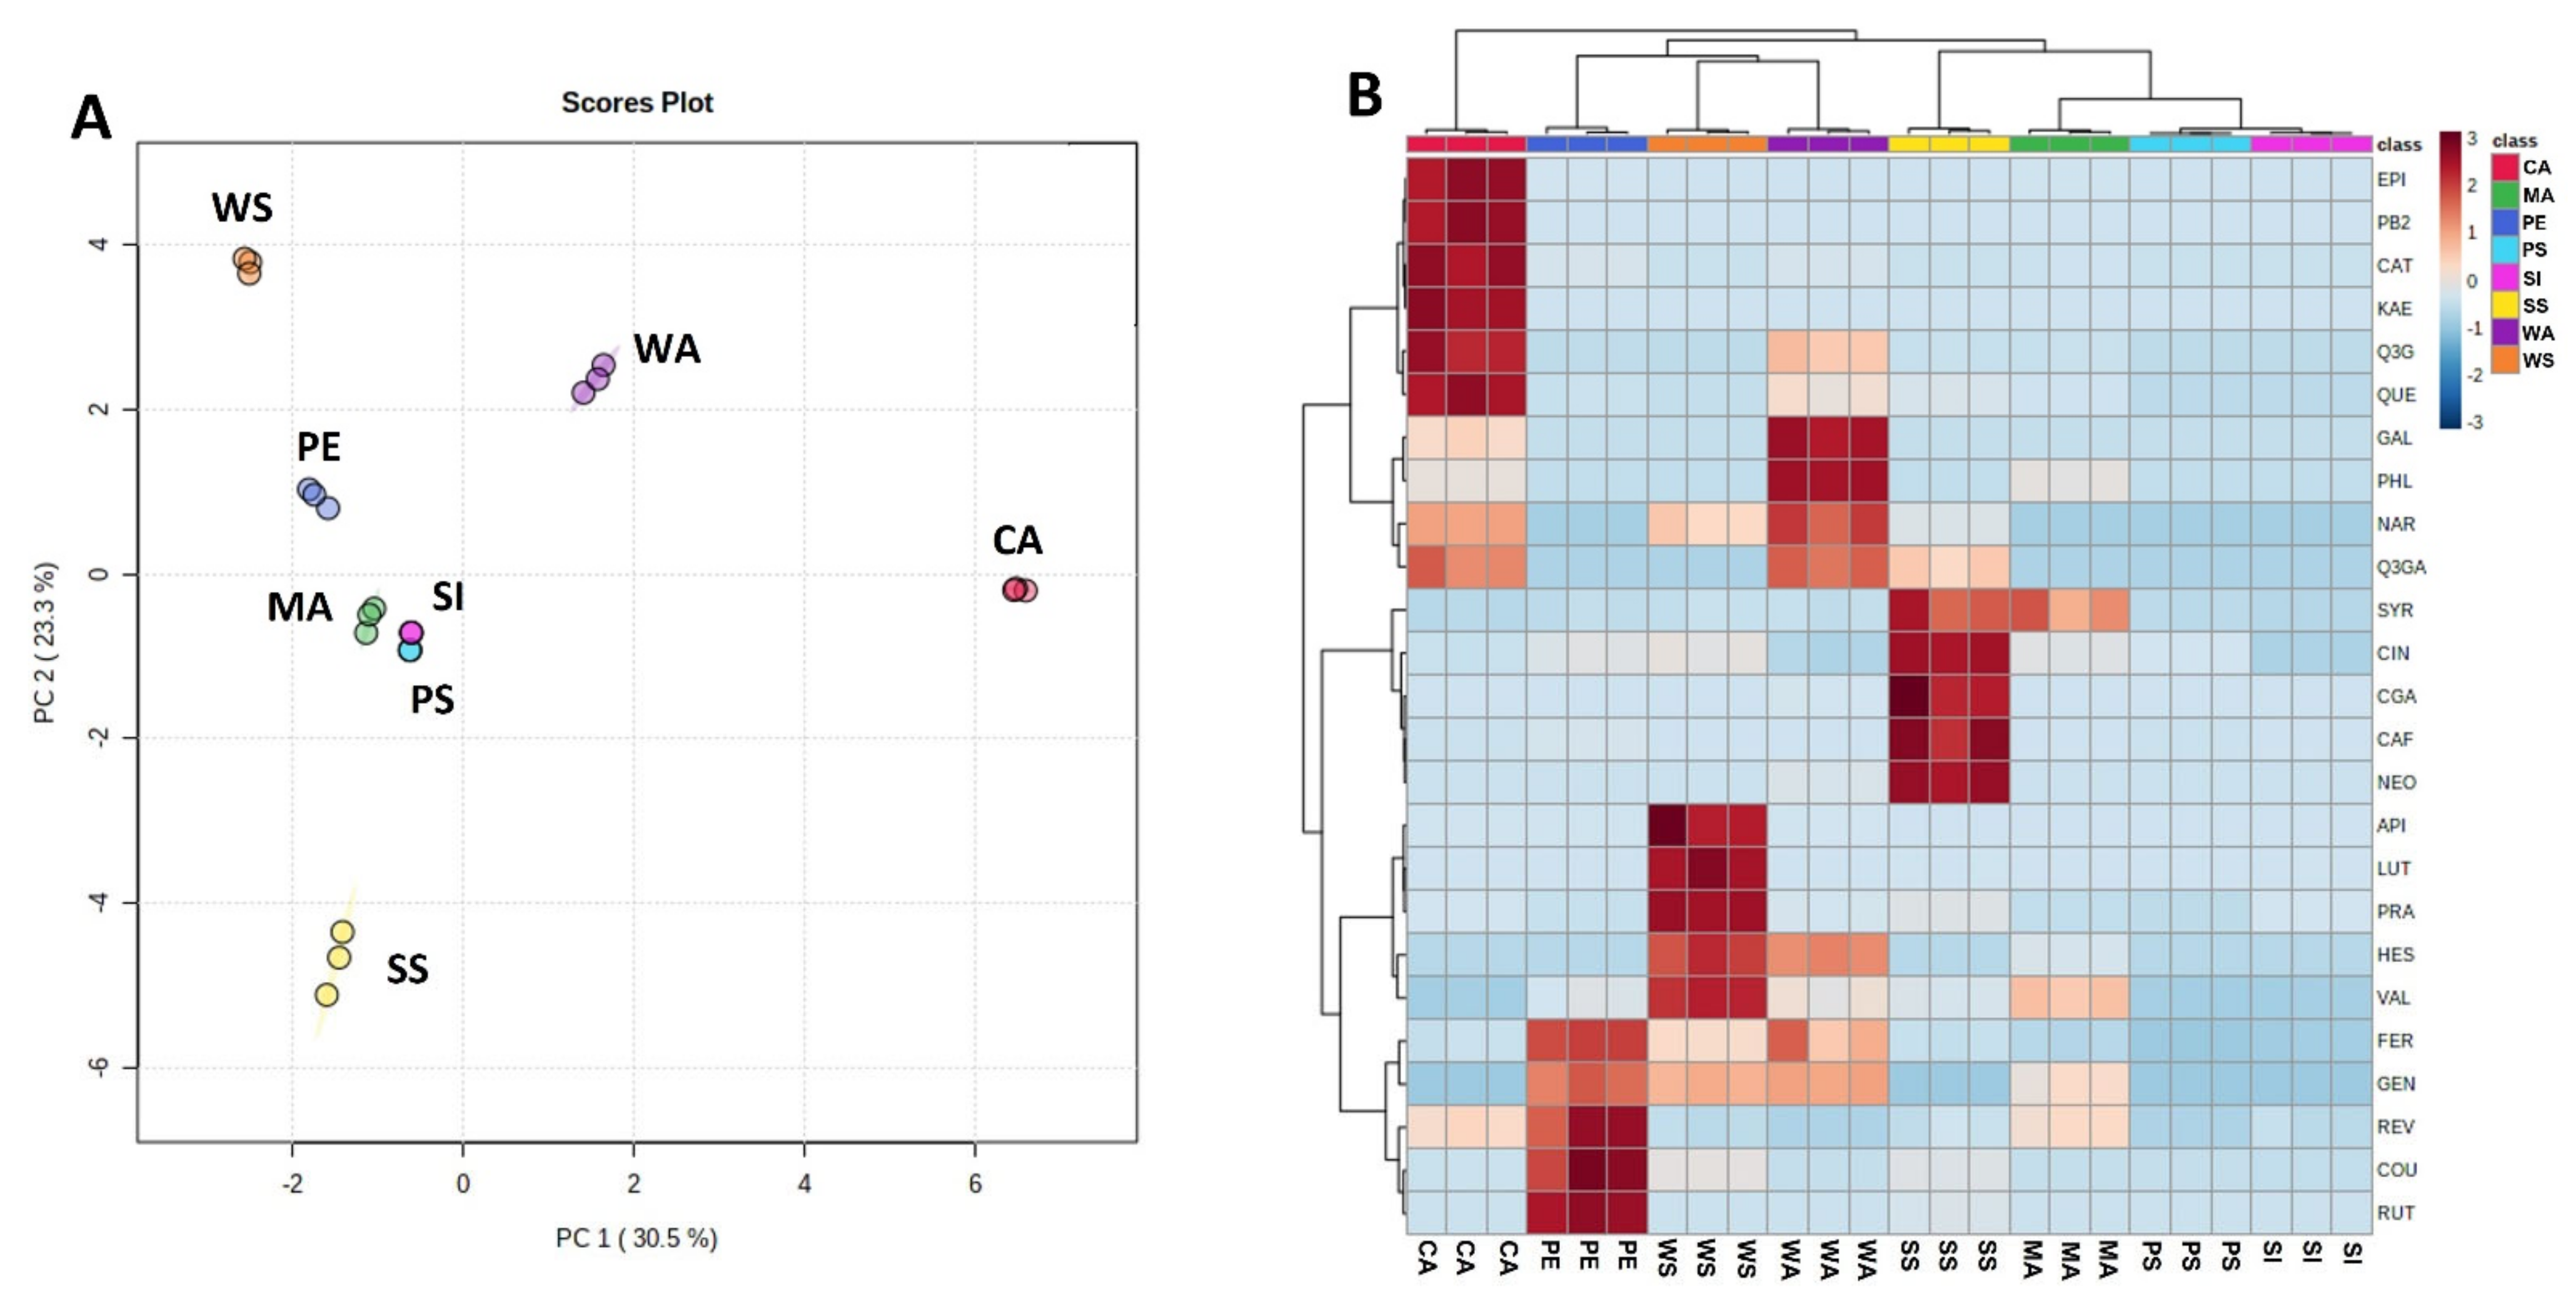
3.4. Principal Component Analysis and Heat Map

The application of PCA was to highlight similarities and dissimilarities and bring out strong patterns in a dataset of phenolics in the studied nuts and seeds. As displayed in Figure 2A, principal component 1 (PC 1) explains up to 30.5% of the total variability. The most important contributors to PC 1 were catechin, epicatechin, procyanidin B2, kaempferol, Q3G, Q3GA, and quercetin. Cashew, earlier identified as containing significantly higher levels of these constituents, was therefore positioned distantly from the other nuts and seeds in the PCA scores plot. Principal component 2 (PC 2) which explains 23.3%, is mainly defined by caffeic acid, chlorogenic acid, neochlorogenic acid, and hesperetin. It is noted that macadamia, sacha inchi, and pumpkin seed cluster separately from the others in Figure 2A. This can be explained by the remarkably low phenolic contents they had as presented in the previous section. Besides, the overlapping of sacha inchi and pumpkin seed as seen in the graph indicates insignificant differences in their phenolic contents. The PCA scores plot shows 53.8% of the total variability in the dataset of phenolics. The application of PCA as a mathematical tool appears to be helpful for the differentiation of the nuts and seed species based on their phenolic contents. In addition to PCA, a heatmap consisting of blue-red colored squares was implemented to graphically show the concentrations of the phenolics reported in the study (Figure 2B). As such, the red in the figure illustrates a higher concentration value whereas the blue represents the opposite.

3.5. Antioxidant Activity

Table 5 shows the results of antioxidant activity measured by different assays (DPPH, ABTS, FRAP, and reducing power) conducted for methanolic extracts of the samples, with ascorbic acid and Trolox used as reference standards. Based on the results obtained, walnut was found to possess the highest antioxidant activity (DPPH 704.74 μg AAE/g; ABTS 783.52 μg AAE/g; FRAP 133.12 mM TE/g; reducing power 11.29 mg AAE/g). Pumpkin seed, by contrast, appeared to have lower antioxidant potential compared to the other nuts and seeds. The radical scavenging activity, expressed as a percent of inhibition, of the methanolic extracts of the samples in this study was also calculated (Figure S1, Supplementary material). All the extracts inhibited more than 50% of the formation of ABTS free radicals while only those of walnut, sunflower seed, and sacha inchi were observed for DPPH. Prior research showed that walnut exerted much higher DPPH antioxidant efficacy in comparison with cashew, macadamia, peanut, sunflower seed, and pumpkin seed [33,42]. It could be due to a highly complex mixture of ellagitannins, gallotannins, flavonoids, and phenolic acids that this type of nut contains [38].
It is noted that antioxidant activities monitored by different assays can vary due to differences in mechanisms [43]. This could in part help explain why some of the samples, such as sunflower seeds and cashew, exhibited the high DPPH and ABTS radical scavenging activities while having low antioxidant potential through reduction of ferric iron (Fe3+) to ferrous iron (Fe2+). It is also noted that variations in the antioxidant activity measured by each assay were not analogous. As seen in Table 5, the differences between the highest and lowest values widely range from 1.2 (ABTS) to 330 (FRAP).

3.6. Correlation Analysis

Pearson’s correlations between radical scavenging activities, FRAP, and power reducing predicted by the above assays and phenolics were determined to evaluate the contributions of these chemical constituents (i.e., phenolic acids and flavonoids) to the antioxidant capacity of the nuts and seeds. The results showed that the TPC of the samples had strong positive correlations with DPPH and FRAP values (r = 0.755 and 0.987, respectively, p < 0.05, Table S1, Supplemental data). Besides, a weak correlation between TPC and power reducing capacity (r = 0.575, p < 0.05, Table S1) was observed. High correlations (r > 0.900) between TPC and antioxidant activity by DPPH and FRAP assays of some nuts were previously reported [42,44]. However, there is no correlation between TPC and ABTS that was found in all these studies.
With respect to the potential contributions of individual phenolics to antioxidant activity, the correlation analysis revealed that four phenolic acids and seven flavonoids were positively correlated with free radical scavenging and/or power reducing activities (Table S1). Of these, gallic acid and phloretin had high correlations with FRAP values (r ≈ 0.860, p < 0.05). Previously, gallic acid detected in different black walnut varieties grown in Missouri, USA was shown to be moderately correlated with FRAP [45].

4. Conclusions

This study is the first work to investigate phenolics and micronutrients in commonly consumed nuts and seeds grown in Vietnam. It underscores that these nuts and seeds were abundant in phenolics, carotenoids, and vitamin Bs at levels comparable with those marketed or cultivated in other countries. The consumption of these nuts and seeds can contribute to the recommended micronutrient intakes. Walnut exhibited the strongest antioxidant activity evaluated by DPPH, ABTS, FRAP, and reducing power assays. The study also provides more information about phenolic composition, micronutrients, and health-promoting aspects scarcely reported for sacha inchi and watermelon seed. Finally, the findings of the study are worthy of inclusion in nutrient databases for phenolics, carotenoids, and vitamin Bs in nuts and seeds and would help encourage consumption of these products among Vietnamese people.

Supplementary Materials

The following supporting information can be downloaded at: https://www.mdpi.com/article/10.3390/horticulturae8060521/s1, Figure S1: Radical scavenging activity expressed as % of inhibition measured by DPPH and ABTS assays; Table S1: Pearson’s correlation between the antioxidant activity and the phenolics.

Author Contributions

Conceptualization, T.H.D.N., D.C.V. and X.T.V.; Methodology, T.H.D.N., D.C.V., S.A., K.D.N. and N.N.T.; Validation, D.C.V. and X.T.V.; Formal Analysis, T.H.D.N., D.C.V., S.A., N.N.T. and T.L.H.; Investigation, T.H.D.N. and X.T.V.; Resources, N.T.M.-N., L.N.T. and T.L.T.N.; Data Curation, T.H.D.N. and X.T.V.; Writing—Original Draft Preparation, T.H.D.N. and D.C.V.; Writing—Review and Editing, T.H.D.N., D.C.V. and X.T.V.; Visualization, T.H.D.N. and X.T.V.; Supervision, T.H.D.N. and X.T.V. All authors have read and agreed to the published version of the manuscript.

Funding

This research received no external funding.

Institutional Review Board Statement

Not applicable.

Informed Consent Statement

Not applicable.

Data Availability Statement

The data generated or analyzed during the study are included in the article and its Supplementary Material file.

Acknowledgments

The authors would like to thank Van Lang University, Vietnam for financially supporting the research. The authors acknowledge RedStar-CMS company (Vietnam) and the Proteomics & Metabolomics Facility Nebraska Center for Biotechnology (RRID:SCR_021314) at the University of Nebraska-Lincoln (USA), funded by the Nebraska Research Initiative, for the chromatographical analyses of carotenoids and phenolics.

Conflicts of Interest

The authors report no conflict of interest relevant to this article.

Sample Availability

Not applicable.

References

  1. Eaton, S.B.; Konner, M. Paleolithic nutrition: A consideration of its nature and current implications. N. Engl. J. Med. 1985, 312, 283–289. [Google Scholar] [CrossRef] [PubMed]
  2. Alasavar, C.; Shahidi, F. Tree nuts: Composition, phytochemicals, and health effects: An overview. In Tree Nuts Composition, Phytochemicals, and Health Effects; Alasavar, C., Shahidi, F., Eds.; CRC Press: Boca Raton, FL, USA, 2009; pp. 1–10. [Google Scholar]
  3. Jiang, R.; Jacobs, D.R., Jr.; Mayer-Davis, E.; Szklo, M.; Herrington, D.; Jenny, N.S.; Kronmal, R.; Barr, R.G. Nut and seed consumption and inflammatory markers in the multi-ethnic study of atherosclerosis. Am. J. Epidemiol. 2006, 163, 222–231. [Google Scholar] [CrossRef] [PubMed] [Green Version]
  4. Gorji, N.; Moeini, R.; Memariani, Z. Almond, hazelnut and walnut, three nuts for neuroprotection in Alzheimer’s disease: A neuropharmacological review of their bioactive constituents. Pharmacol. Res. 2018, 129, 115–127. [Google Scholar] [CrossRef] [PubMed]
  5. Li, M.; Shi, Z. A prospective Association of nut Consumption with cognitive function in Chinese adults aged 55+ _ China health and nutrition survey. J. Nutr. Health Aging 2019, 23, 211–216. [Google Scholar] [CrossRef]
  6. Long, J.; Ji, Z.; Yuan, P.; Long, T.; Liu, K.; Li, J.; Cheng, L. Nut consumption and risk of cancer: A meta-analysis of prospective studies. Cancer Epidemiol. Biomark. Prev. 2020, 29, 565–573. [Google Scholar] [CrossRef]
  7. Bolling, B.W.; Chen, C.Y.O.; McKay, D.L.; Blumberg, J.B. Tree nut phytochemicals: Composition, antioxidant capacity, bioactivity, impact factors. A systematic review of almonds, Brazils, cashews, hazelnuts, macadamias, pecans, pine nuts, pistachios and walnuts. Nutr. Res. Rev. 2011, 24, 244–275. [Google Scholar] [CrossRef] [Green Version]
  8. Agati, G.; Azzarello, E.; Pollastri, S.; Tattini, M. Flavonoids as antioxidants in plants: Location and functional significance. Plant Sci. 2012, 196, 67–76. [Google Scholar] [CrossRef]
  9. Poprac, P.; Jomova, K.; Simunkova, M.; Kollar, V.; Rhodes, C.J.; Valko, M. Targeting free radicals in oxidative stress-related human diseases. Trends Pharmacol. Sci. 2017, 38, 592–607. [Google Scholar] [CrossRef]
  10. Lin, D.; Xiao, M.; Zhao, J.; Li, Z.; Xing, B.; Li, X.; Kong, M.; Li, L.; Zhang, Q.; Liu, Y.; et al. An overview of plant phenolic compounds and their importance in human nutrition and management of type 2 diabetes. Molecules 2016, 21, 1374. [Google Scholar] [CrossRef]
  11. Hussain, T.; Tan, B.; Murtaza, G.; Liu, G.; Rahu, N.; Kalhoro, M.S.; Kalhoro, D.H.; Adebowale, T.O.; Mazhar, M.U.; Ur Rehman, Z.; et al. Flavonoids and type 2 diabetes: Evidence of efficacy in clinical and animal studies and delivery strategies to enhance their therapeutic efficacy. Pharmacol. Res. 2020, 152, 104629. [Google Scholar] [CrossRef]
  12. Kim, B.W.; Jeong, K.H.; Kim, J.H.; Jin, M.; Kim, J.H.; Lee, M.G.; Choi, D.K.; Won, S.Y.; McLean, C.; Jeon, M.T.; et al. Pathogenic upregulation of glial lipocalin-2 in the parkinsonian dopaminergic system. J. Neurosci. 2016, 36, 5608–5622. [Google Scholar] [CrossRef] [Green Version]
  13. Gelders, G.; Baekelandt, V.; Van der Perren, A. Linking neuroinflammation and neurodegeneration in Parkinson’s disease. J. Immunol. Res. 2018, 2018, 4784268. [Google Scholar] [CrossRef] [Green Version]
  14. Stalker, T.; Wilson, R.F. (Eds.) Peanuts: Genetics, Processing, and Utilization; Academic Press: Cambridge, MA, USA; AOCS Press: Champaign, IL, USA, 2016. [Google Scholar]
  15. Peng, R.; Lan, L.P.; Christian, K. Weaver ant role in cashew orchards in Vietnam. J. Econ. Entomol. 2014, 107, 1330–1338. [Google Scholar] [CrossRef] [Green Version]
  16. United Nations Conference On Trade And Development (UNCTAD). Commodities at a Glance. Special Issue on Cashew Nuts. No 14. 2021. Available online: https://unctad.org/system/files/official-document/ditccom2020d1_en.pdf (accessed on 1 February 2022).
  17. Vietnam Cashew Association (VINACAS). Vietnam’s Cashew Kernel Export Market. 2021. Available online: http://www.vinacas.com.vn/uploads/download/so-lieu-thong-ke-xuat-khau-dieu-nhan-ca-nam-2020-tu-t-1-t-12-1610696183-mdpal.pdf (accessed on 1 February 2022).
  18. World Agroforestry (ICRAF). NW Vietnam: New fruit Species Brings Ripe Opportunity for Poverty Reduction. 2013. Available online: https://worldagroforestry.org/news/nw-vietnam-new-fruit-species-brings-ripe-opportunity-poverty-reduction (accessed on 10 February 2022).
  19. Son, N.H.; Thang, N.T.; Thuyet, D.V.; Hung, N.Q.; Thinh, N.H.; Lam, V.T.; Khuong, N.V.; Tuan, N.V.; Trung, P.D.; Quy, T.H.; et al. Fruit And Nut Characteristics Of Promising Persian Walnut Trees In Vietnam. Plant Cell Biotechnol. Mol. Biol. 2019, 20, 561–567. [Google Scholar]
  20. Ndaw, S.; Bergaentzle, M.; Aoude-Werner, D.; Hasselmann, C. Extraction procedures for the liquid chromatographic determination of thiamin, riboflavin and vitamin B6 in foodstuffs. Food Chem. 2000, 71, 129–138. [Google Scholar] [CrossRef]
  21. Lichtenthaler, H.K.; Wellburn, A.R. Determinations of Total Carotenoids and Chlorophylls a and b of Leaf Extracts in Different Solvents; Portland Press Ltd.: London, UK, 1983. [Google Scholar]
  22. D’Souza, M.C.; Singha, S.; Ingle, M. Lycopene concentration of tomato fruit can be estimated from chromaticity values. HortScience 1992, 27, 465–466. [Google Scholar] [CrossRef] [Green Version]
  23. Vu, D.C.; Alvarez, S. Phenolic, Carotenoid and Saccharide Compositions of Vietnamese Camellia sinensis Teas and Herbal Teas. Molecules 2021, 26, 6496. [Google Scholar] [CrossRef]
  24. Xiao, Y.; Xing, G.; Rui, X.; Li, W.; Chen, X.; Jiang, M.; Dong, M. Enhancement of the antioxidant capacity of chickpeas by solid state fermentation with Cordyceps militaris SN-18. J. Funct. Foods 2014, 10, 210–222. [Google Scholar] [CrossRef]
  25. Leung, P.H.; Zhao, S.; Ho, K.P.; Wu, J.Y. Chemical properties and antioxidant activity of exopolysaccharides from mycelial culture of Cordyceps sinensis fungus Cs-HK1. Food Chem. 2009, 114, 1251–1256. [Google Scholar] [CrossRef]
  26. Chong, J.; Soufan, O.; Li, C.; Caraus, I.; Li, S.; Bourque, G.; Wishart, D.S.; Xia, J. MetaboAnalyst 4.0: Towards more transparent and integrative metabolomics analysis. Nucleic Acids Res. 2018, 46, W486–W494. [Google Scholar] [CrossRef] [Green Version]
  27. Stuetz, W.; Schlörmann, W.; Glei, M. B-vitamins, carotenoids and α-/γ-tocopherol in raw and roasted nuts. Food Chem. 2017, 221, 222–227. [Google Scholar] [CrossRef]
  28. Pająk, P.; Socha, R.; Gałkowska, D.; Rożnowski, J.; Fortuna, T. Phenolic profile and antioxidant activity in selected seeds and sprouts. Food Chem. 2014, 143, 300–306. [Google Scholar] [CrossRef]
  29. Win, M.M.; Abdul-Hamid, A.; Baharin, B.S.; Anwar, F.; Sabu, M.C.; Pak-Dek, M.S. Phenolic compounds and antioxidant activity of peanut’s skin, hull, raw kernel and roasted kernel flour. Pak. J. Bot. 2011, 43, 1635–1642. [Google Scholar]
  30. Wu, S.; Shen, D.; Wang, R.; Li, Q.; Mo, R.; Zheng, Y.; Zhou, Y.; Liu, Y. Phenolic profiles and antioxidant activities of free, esterified and bound phenolic compounds in walnut kernel. Food Chem. 2021, 350, 129217. [Google Scholar] [CrossRef]
  31. Uslu, N.; Özcan, M.M. Effect of microwave heating on phenolic compounds and fatty acid composition of cashew (Anacardium occidentale) nut and oil. J. Saudi Soc. Agric. Sci. 2019, 18, 344–347. [Google Scholar] [CrossRef]
  32. Bittner, K.; Rzeppa, S.; Humpf, H.-U. Distribution and quantification of flavan-3-ols and procyanidins with low degree of polymerization in nuts, cereals, and legumes. J. Agric. Food Chem. 2013, 61, 9148–9154. [Google Scholar] [CrossRef]
  33. Kalogeropoulos, N.; Chiou, A.; Ioannou, M.S.; Karathanos, V.T. Nutritional evaluation and health promoting activities of nuts and seeds cultivated in Greece. Int. J. Food Sci. Nutr. 2013, 64, 757–767. [Google Scholar] [CrossRef]
  34. Vu, D.C.; Vo, P.H.; Coggeshall, M.V.; Lin, C.H. Identification and characterization of phenolic compounds in black walnut kernels. J. Agric. Food Chem. 2018, 66, 4503–4511. [Google Scholar] [CrossRef]
  35. Chang, S.K.; Alasalvar, C.; Bolling, B.W.; Shahidi, F. Nuts and their co-products: The impact of processing (roasting) on phenolics, bioavailability, and health benefits–A comprehensive review. J. Funct. Foods 2016, 26, 88–122. [Google Scholar] [CrossRef]
  36. Chukwumah, Y.; Walker, L.; Vogler, B.; Verghese, M. Profiling of bioactive compounds in cultivars of Runner and Valencia peanut market-types using liquid chromatography/APCI mass spectrometry. Food Chem. 2012, 132, 525–531. [Google Scholar] [CrossRef]
  37. Žilić, S.; Dragišić, J.M.; Maksimović, V.; Maksimović, M.; Basić, Z.; Crevar, M.; Stanković, G. The content of antioxidants in sunflower seed and kernel. Helia 2010, 33, 75–84. [Google Scholar] [CrossRef]
  38. Nguyen, T.H.D.; Vu, D.C. A Review on Phytochemical Composition and Potential Health-promoting Properties of Walnuts. Food Rev. Int. 2021, 1–27. [Google Scholar] [CrossRef]
  39. Vinson, J.A.; Cai, Y. Nuts, especially walnuts, have both antioxidant quantity and efficacy and exhibit significant potential health benefits. Food Funct. 2012, 3, 134–140. [Google Scholar] [CrossRef] [PubMed] [Green Version]
  40. Luu, H.N.; Blot, W.J.; Xiang, Y.B.; Cai, H.; Hargreaves, M.K.; Li, H.; Yang, G.; Signorello, L.; Gao, Y.T.; Zheng, W.; et al. Prospective evaluation of the association of nut/peanut consumption with total and cause-specific mortality. JAMA Intern. Med. 2015, 175, 755–766. [Google Scholar] [CrossRef] [PubMed]
  41. Mohan, V.; Gayathri, R.; Jaacks, L.M.; Lakshmipriya, N.; Anjana, R.M.; Spiegelman, D.; Jeevan, R.G.; Balasubramaniam, K.K.; Shobana, S.; Jayanthan, M.; et al. Cashew nut consumption increases HDL cholesterol and reduces systolic blood pressure in Asian Indians with type 2 diabetes: A 12-week randomized controlled trial. J. Nutr. 2018, 148, 63–69. [Google Scholar] [CrossRef] [Green Version]
  42. Abe, L.T.; Lajolo, F.M.; Genovese, M.I. Comparison of phenol content and antioxidant capacity of nuts. Food Sci. Technol. 2010, 30, 254–259. [Google Scholar] [CrossRef] [Green Version]
  43. Shahidi, F.; Zhong, Y. Measurement of antioxidant activity. J. Funct. Foods 2015, 18, 757–781. [Google Scholar] [CrossRef]
  44. Ozer, H.K. Phenolic compositions and antioxidant activities of Maya nut (Brosimum alicastrum): Comparison with commercial nuts. Int. J. Food Prop. 2017, 20, 2772–2781. [Google Scholar] [CrossRef] [Green Version]
  45. Vu, D.C.; Park, J.; Ho, K.V.; Sumner, L.W.; Lei, Z.; Greenlief, C.M.; Mooney, B.; Coggeshall, M.V.; Lin, C.H. Identification of health-promoting bioactive phenolics in black walnut using cloud-based metabolomics platform. J. Food Meas. Charact. 2020, 14, 770–777. [Google Scholar] [CrossRef]
Figure 1. The commonly consumed nuts and seeds examined in the study.
Horticulturae 08 00521 g001
Figure 2. Principal component analysis (A) and heatmap (B) of phenolic data of the studied nuts and seeds. Abbreviations: CA (cashew), MA (macadamia), PE (peanut), SI (sacha inchi), WA (walnut), PS (pumpkin seed), SS (sunflower seed), WS (watermelon seed).
Horticulturae 08 00521 g002
Table 1. Summary of the nuts and seeds examined in the study.
Common NameScientific NameVietnamese NameProduct DescriptionPurchase Location
CashewAnacardium occidentalehạt điềuraw nutSoutheast
MacadamiaMacadamia integrifoliamắc cadried nutCentral Highlands
PeanutArachis hypogaeađậu phộngroasted nutMekong delta
Sachi inchiPlukenetia volubilissachidried nutCentral Highlands
WalnutJuglans sp.hạt óc chódried nutNorthwest
Pumpkin seedCucurbita sp.hạt bíroasted seedSoutheast
Sunflower seedHelianthus annuushạt hướng dươngdried seedSoutheast
Watermelon seedCitrullus lanatushạt dưaroasted seedSoutheast
Table 2. Carotenoids and B-vitamins (μg/100 g FW) of the studied nuts and seeds.
CashewMacadamiaPeanutSachi InchiWalnutPumpkin SeedSunflower SeedWatermelon SeedRDA *
Lutein79.7ndndnd60.7nd61.9157.3800
Zeaxanthinndndndnd84.9nd89.9nd
β-Carotene19.47.328.549.648.089.317.224.7
% RDA for β-Carotene **<0.5<0.1<0.5<10.5<1<0.5<0.5
Vitamin B1406.4947.1551.63449.1290.02564.53381.1nd1150
% RDA35824830026223294-
Vitamin B6799.1nd648.81672.5730.5779.32537.2202.61300
% RDA61-50130566019516
Vitamin B9ndnd90.7724.3ndnd674.358.8400
% RDA--23181--16815
* RDA: recommended dietary allowance (National Institute of Health, U.S. Department of Health and Human Services): average daily level of intake recommended for healthy individual (19–65 years old). ** estimated by retinol equivalents, RE (1 µg retinol = 1 µg RE = 12 µg β-carotene). nd: not detected.
Table 3. Flavonoids (μg/100 g FW) of the studied nuts and seeds.
CashewMacadamiaPeanutSacha InchiWalnutPumpkin SeedSunflower SeedWatermelon Seed
Apigenin2.02 ± 0.04 bnd2.70 ± 0.05 b1.06 ± 0.03 b4.15 ± 0.57 bndnd240.00 ± 19.09 a
Catechin *256.99 ± 7.69 a2.56 ± 0.05 bc13.41 ± 0.36 b0.12 ± 0.01 bc11.73 ± 0.42 bc0.05 ± 0.00 c0.03 ± 0.00 cnd
Epicatechin *182.67 ± 6.58 a3.02 ± 0.03 b4.09 ± 0.10 bndndndndnd
Genisteinnd4.57 ± 0.32 c9.25 ± 0.39 and7.38 ± 0.07 bndnd6.86 ± 0.10 b
Hesperetinnd1.99 ± 0.08 cndnd9.03 ± 0.18 bndnd12.37 ± 0.55 a
Kaempferol84.03 ± 1.75ndndndndndndnd
Luteolin2.67 ± 0.34 b6.32 ± 0.10 b3.88 ± 0.25 b9.88 ± 0.79 b6.01 ± 0.16 b4.06 ± 0.10 b12.14 ± 1.44 b1792.65 ± 65.68 a
Naringenin18.27 ± 0.18 bndndnd26.64 ± 1.28 and7.07 ± 0.08 d12.74 ± 0.76 c
Procyanidin B2 *13.45 ± 0.42ndndndndndndnd
Phloretin1.23 ± 0.01 b1.12 ± 0.04 cndnd6.33 ± 0.04 andndnd
Q3G1043.49 ± 47.52 a42.34 ± 1.38 c5.82 ± 0.40 c3.94 ± 0.35 c416.09 ± 21.85 b3.85 ± 0.48 c38.48 ± 2.10 c2.97 ± 0.05 c
Q3GA92.69 ± 5.96 andndnd100.01 ± 2.91 and56.25 ± 3.12 bnd
Quercetin48.50 ± 1.32 a3.67 ± 0.02 cd2.85 ± 0.16 cdnd11.43 ± 1.06 bnd5.52 ± 0.05 c1.96 ± 0.02 d
Resveratrol **4.80 ± 0.22 b4.62 ± 0.27 b14.18 ± 1.46 a0.94 ± 0.23 cndnd1.38 ± 0.21 c0.90 ± 0.11 c
Rutinndnd97.75 ± 2.23 andndnd6.21 ± 0.62 bnd
Sum of flavonoids466.04 ± 5.346.19 ± 0.0618.72 ± 0.500.27 ± 0.0017.60 ± 0.670.13 ± 0.011.29 ± 0.0320.69 ± 0.57
* μg/g of fresh weight; ** not a flavonoid; nd: not detected; Different lowercased letters for the same flavonoid indicate statistically significant difference among the nuts and seeds (p < 0.05).
Table 4. Phenolic acids (μg/g FW) of the studied nuts and seeds.
CashewMacadamiaPeanutSacha InchiWalnutPumpkin SeedSunflower SeedWatermelon Seed
Hydroxycinnamic acids
Caffeic acid0.07 ± 0.00 b0.23 ± 0.02 b1.90 ± 0.03 b0.30 ± 0.00 b0.44 ± 0.02 b0.11 ± 0.00 b51.89 ± 3.68 a0.36 ± 0.01 b
Chlorogenic acid3.52 ± 0.33 b5.94 ± 0.51 b2.62 ± 0.11 b4.48 ± 0.19 b34.24 ± 2.75 b4.77 ± 0.30 b1478.68 ± 131.83 a3.02 ± 0.17 b
Neochlorogenic acid *0.09 ± 0.00 c0.16 ± 0.02 c0.12 ± 0.00 c0.09 ± 0.00 c16.74 ± 1.77 b0.07 ± 0.01 c308.30 ± 11.09 a0.06 ± 0.00 c
Cinnamic acid0.44 ± 0.00 c0.77 ± 0.01 b0.75 ± 0.04 b0.12 ± 0.01 d0.16 ± 0.02 d0.56 ± 0.00 c3.69 ± 0.04 a0.85 ± 0.03 b
p-Coumaric acid3.95 ± 0.19 b0.86 ± 0.05 b138.25 ± 13.35 a0.28 ± 0.00 b0.90 ± 0.03 b0.44 ± 0.00 b14.84 ± 0.67 b20.10 ± 0.19 b
Ferulic acid0.96 ± 0.04 d0.60 ± 0.03 d5.43 ± 0.07 a0.22 ± 0.01 d3.73 ± 0.63 b0.83 ± 0.00 d0.92 ± 0.03 d2.28 ± 0.04 c
Hydroxybenzoic acids
Gallic acid19.31 ± 1.35 b0.36 ± 0.04 c0.30 ± 0.00 c0.10 ± 0.00 c70.46 ± 1.37 and0.38 ± 0.01 c0.37 ± 0.00 c
Protocatechuic acid2.88 ± 0.00 c0.67 ± 0.04 e1.40 ± 0.03 d2.89 ± 0.01 c3.04 ± 0.12 c0.17 ± 0.01 e4.88 ± 0.02 b37.33 ± 0.29 a
Syringic acid0.11 ± 0.01 b2.13 ± 0.28 a0.20 ± 0.03 b0.08 ± 0.00 b0.24 ± 0.02 b0.15 ± 0.01 b2.78 ± 0.28 a0.27 ± 0.02 b
Vanillic acid1.09 ± 0.03 e8.41 ± 0.34 b4.17 ± 0.27 d1.15 ± 0.06 e5.50 ± 0.37 c1.11 ± 0.06 e4.04 ± 0.17 d16.53 ± 0.28 a
Sum of phenolic acids32.44 ± 1.8120.14 ± 1.99155.17 ± 13.929.71 ± 0.28135.45 ± 6.997.46 ± 0.641870.41 ± 241.2881.18 ± 0.27
TPC **6.03 ± 0.19 c5.69 ± 0.12 d2.84 ± 0.08 d8.83 ± 0.24 b49.87 ± 0.18 a2.71 ± 0.02 d18.82 ± 0.65 a2.47 ± 0.06 c
* quantified using the calibration equation for chlorogenic acid; ** total phenolic content (mg GAE/g FW); nd: not detected; Different lowercased letters for the same phenolic acid indicate statistically significant difference among the nuts and seeds (p < 0.05).
Table 5. Antioxidant activity (μg AAE/g or mM TE/g FW) of the studied nuts and seeds.
DPPHABTSFRAPReducing Power
μg AAE/gμg AAE/gmM TE/gmg AAE/g
Cashew277.54 ± 20.60 c793.71 ± 33.81 a2.04 ± 0.25 c4.68 ± 0.20 e
Macadamia108.68 ± 17.00 d776.43 ± 32.64 a3.80 ± 0.15 c9.92 ± 0.52 b
Peanut78.97 ± 13.76 d786.18 ± 36.62 a0.43 ± 0.05 c3.89 ± 0.19 f
Sacha inchi487.33 ± 85.08 b689.54 ± 29.26 bc2.31 ± 0.02 c4.08 ± 0.11 f
Walnut704.74 ± 10.68 a783.52 ± 28.53 a133.12 ± 3.91 a11.29 ± 0.01 a
Pumpkin seed66.15 ± 27.35 d652.75 ± 26.91 c0.95 ± 0.13 c2.42 ± 0.12 g
Sunflower seed741.07 ± 13.45 a758.69 ± 33.96 ab57.36 ± 0.49 b5.33 ± 0.11 d
Watermelon seed280.09 ± 40.95 c743.62 ± 24.39 ab0.40 ± 0.09 c8.74 ± 0.43 c
Different lowercased letters in the same column indicate statistically significant differences among the nuts and seeds (p < 0.05).
Publisher’s Note: MDPI stays neutral with regard to jurisdictional claims in published maps and institutional affiliations.

