Article

Effect of Salt Treatment on the Growth, Water Status, and Gas Exchange of Pyrus pyraster L. (Burgsd.) and Tilia cordata Mill. Seedlings

1
Faculty of Horticulture and Landscape Engineering, Slovak University of Agriculture, 949 76 Nitra, Slovakia
2
AgroBioTech Research Centre, Slovak University of Agriculture, 949 76 Nitra, Slovakia
*
Author to whom correspondence should be addressed.
Horticulturae 2022, 8(6), 519; https://doi.org/10.3390/horticulturae8060519
Submission received: 29 April 2022 / Revised: 2 June 2022 / Accepted: 10 June 2022 / Published: 14 June 2022
(This article belongs to the Special Issue Plant Physiology under Abiotic Stresses)

Abstract

:
Two-year-old seedlings of T. cordata and P. pyraster were exposed to salinity for 50 days, whereby each plant was subject to regular applications of a substrate solution containing 100 mM NaCl, amounting to a cumulative volume of 365 mL per plant. The adaptive reactions of the tree species in coping with salt stress were studied. The measured parameters were the growth and distribution of mass to organs, root to shoot mass ratio (R:S), content of assimilation pigments in the leaves, gas exchange parameters (gs, E, An), and water use efficiency (WUE). The relative increase in biomass was reduced under salt treatment for both species. A significant decrease in the total FW and DW was observed only for T. cordata, which deposited 4.5 times more Na+ ions in the plant tissues compared with P. pyraster. In P. pyraster seedlings, Na+ ions mainly accumulated in the root (75%), and their distribution was limited to aboveground organs. Thus, a balanced content of the assimilation pigments in the leaves was maintained under salt treatment. In the initial (osmotic) phase of salt stress, P. pyraster reduced water consumption and maintained a steady rate of photosynthesis (An) per unit area. T. cordata responded to salinity by regulating stomatal conductance and increasing water use efficiency (WUE). T. cordata was not effective in blocking salt intake and transported Na+ ions to the leaves. Due to the high cumulative salt content in the substrate, the water potential of the leaf tissues and the rate of photosynthesis significantly decreased in salt-treated T. cordata seedlings. The results document the important role of the root system in the resistance of woody plants and in ensuring their survival in conditions of excessive salinity. The investment in root growth improved the water supply of P. pyraster seedlings and enhanced the retention of salt ions in the root system, thus limiting their transfer to leaves.

1. Introduction

Salinity affects trees due to direct ionic toxicity, osmotic effects, and interfering with nutrient uptake [1]. High amounts of salt in the soil limit root water uptake, and excessive concentrations of toxic salts in plants adversely impact plant functions. Salt stress induces a decrease in the aerial part of the plant associated with leaf abscission [2] and decreases the rate of leaf area expansion [3]. Salinity significantly lowers the dry and fresh weight of leaves, stems, and roots [4,5] and results in decreased leaf chlorophyll and carotenoid contents [6,7]. The degradation of photosynthetic pigments lowers the photo-reception efficiency of photosystems (PSI and PSII), which reduces the overall level of photosynthesis [8,9].
Street trees are exposed to salinity due to the application of de-icing salts, which lead to increased salt ion content in the surrounding soil structure, alkalinization, reduced permeability, and soil aeration. Salinity has a negative impact on the growth and vitality of street trees, which have relatively short lifespans and low species diversity. Only a few genera and species of trees dominate European cities [10]. The growth of tolerant tree species, which successfully cope with salt stress, can help to increase biodiversity in the urban environment.
In our study, we evaluated the growth and responses of two species of European flora, Tilia cordata Mill. and Pyrus pyraster L. Burgsd., to substrate salinity. T. cordata is a shade-tolerant tree [11,12,13], with broad ecological amplitude [14]. It is considered a drought-resistant tree species, showing optimal growth on deep loamy soils [15,16,17]. T. cordata is often used as an urban tree, since it is relatively resistant to adverse urban conditions and responds well to pruning [18]. P. pyraster is found in Europe over a large temperate climate zone [19,20], has relatively wide ecological amplitude [21], and grows on all soil types [22]. P. pyraster has quite a high demand for light and thus grows in rather extreme or marginal site conditions (very dry or wet) without canopy growth competition [19,22,23]. It is not a typical urban tree but has strong seasonal dynamics, favorable aesthetic properties, and responds well to pruning, so it can be a promising tree for planting in urban conditions. However, the tolerance of P. pyraster to urban conditions has not yet been investigated in detail. There are little data in the literature on the responses of P. pyraster, more generally, to environmental stressors in addition to a lack of comparison with urban trees. Both of the studied species are tolerant to fluctuations in the soil water content [22,24]. The salinity tolerance in plants varies among different species and is strongly influenced by the environmental conditions and plant growth stage [3]. Woody plants are sensitive to salinity in the early seedling stage, while they become more tolerant with increasing age [25]. Therefore, in the present study, the responses to salinity were investigated in seedlings. The possible interspecific differences of the studied taxa in response to salinity would be of wide interest because T. cordata is often used as an alley tree in urban settlements and considered to be tolerant to the urban environment [18]. Similar to P. pyraster, most fruit species [26] can be sensitive to salinity, which can fundamentally affect the possibilities for their utilization in urban areas.
The aim of this study was to investigate the impact of salinity on woody plants in the seedling stage, particularly how severe salinity affects the growth, water regime, and physiological performance of tree species during early growth. The specific goals were to find out how seedlings of T. cordata and P. pyraster cope with salinity in terms of (I) how salinity affects their growth (mass accumulation in plant organs); (II) how salinity affects their physiological performance represented by the parameters of the stomatal conductance (gs), net photosynthetic rate (An), transpiration rate (E), relative water content (RWC), and the water potential of leaf tissues (Ψwl); and (III) what mechanisms these tree species apply when coping with salt stress.

2. Materials and Methods

2.1. Plant Material

The experimental plants were grown from seeds collected on original stands with P. pyraster and T. cordata in Slovakia. The climatic conditions of these stands are fairly similar (Table 1). The conditions in these stands are optimal for the studied taxa (submontane altitudinal zone, an average January temperature of −3.5 °C, and an average July temperature of 16–18 °C) within their natural area of distribution in Central Europe.
Upon the initiation of bud swelling, the two-year-old seedlings were placed in plastic pots (volume of 0.5 L) containing a fertilized peat-based growth substrate (20% black peat and 80% white peat moss, 0–5 mm fraction, pH of 5.5–6.5, enriched with nutrients at 1.0 kg/m3 NPK 14:16:18). The potted plants were placed in the plastic bag to avoid uncontrolled water and salt leakage.

2.2. Experimental Design

The salt-treated plants were regularly saturated with 7.5 mL of the salt solution (100 mM NaCl with electric conductivity 10.1 dS·m−1) per plant per day. Control plants were saturated with water. The total amount of saline solution applied in the experiment was 365 mL per plant. There were 20 replications for salt-treated plants, as well as the corresponding replication for control plants, and the proposed sample size allowed sufficient homogeneity of variance to be maintained (verified by Bartlett’s test at a significance level of α = 0.05).
The water content in the growth substrate was calculated based on wet weight [28] and maintained at 80% water as per the weight of the fully saturated substrate.
M n = ( W w W d ) W w × 100
  • Mn = moisture content (%) of the material n;
  • Ww = wet weight of the sample;
  • Wd = weight of the sample after drying.
The water regime was imposed and maintained using a gravimetric approach, and the pots were regularly weighed on a precision industrial scale (Kern & Sohn GmbH, Balingen, Germany) with laboratory accuracy (max = 8000 g, standard deviation = 0.05 g) at 2-day intervals.
Experimental plants were placed in a PolEko KK1450 (POL-EKO-APARATURA sp.j., Wodzisław Śląski, Poland) growth chamber in which a regulated environment was maintained with a 14/10 h photoperiod, the 250 μmol m−2·s−1 irradiation density, and 65% air humidity. A temperature of 24 °C was maintained during the light period and 14 °C during the dark period. After 17 days of acclimatization, the plants were daily treated with a NaCl solution for 50 days from June to August (Figure 1).
The distribution of fresh and dry mass in the plant organs and the measurements of the morphometric traits were performed at the beginning and end of the experiment.
The leaf gas exchange parameters (gs, An, E, WUE) were measured at the 20th, 30th, 40th, and 50th days of the experiment after a total applied dose of 155, 225, 295, and 365 mL NaCl solution, respectively. The earlier measurements were not performed due to the insufficient development of leaf area in the initial phenological stages.
The measurements of the water potential of the leaf tissue and relative water content were performed at the 1st, 20th, 30th, 40th, and 50th days of the experiment after a total applied dose of 0, 155, 225, 295 and 365 mL NaCl solution, respectively.

2.3. Measurement and Analysis of Plant Parameters

The total fresh mass of the experimental plants (20 samples for each species and variant) was determined at 10 a.m., before seedlings were planted in the pots, and again at the end of the experiment. The plant roots were extracted from the growth substrate by hand and gently washed to minimize the fine root loss.
The root parameters, including the root length (RL), root surface area (RSA), root volume (RV), average root diameter (ARD), and the number of root tips (NRT), were measured using the WinRhizo REG 2009 system (Regent Instruments, Québec, QC, Canada, SK0410192). The total leaf area (LA) was determined by scanning fresh leaves using ImageJ software at the end of the experiment. The dry weight of the plant organs was determined after the plant material was dried at 105 °C until a constant weight was reached. Then, we calculated the leaf water content (LWC), specific root length (SRL), and root to shoot ratio (R:S). The specific leaf area (SLA) [29] was calculated as the ratio of the leaf area to the leaf dry mass [30].

2.4. Leaf Gas Exchange

The measurements were performed beginning 20 days after the first application of 100 mM NaCl. The net photosynthetic rate (An), stomatal conductance (gs), transpiration rate (E), and water use efficiency (WUE) were measured using gasometer CIRAS-3 (PP-Systems, Amesbury, MA, USA) and a PLC3 universal leaf cuvette, fitted with a 1.75 cm2 measurement window, on the fully expanded leaf for each plant on the upper part of the seedling [31,32]. The measurements were performed between 8 a.m. and 11 a.m. The molar flow rate of air entering the leaf chamber was kept constant at 300 cm3·min−1. The conditions were maintained as an average leaf temperature of approximately 26 °C (±0.26 °C SD), vapor partial pressure deficit of 1.38 ± 0.25 kPa, photosynthetically active radiation (PAR) at 250 μmol·m−2·s−1, and CO2 concentration of 400 µmol·mol−1. Measurements were taken following the full stabilization of An and gs after clumping of the leaf in the cuvette, which took up to 5 min.

2.5. Leaf Water Potential and Relative Water Content

The water potential of the leaf tissues (Ψwl) was determined by psychrometric measurement on a Wescor (model PSYPRO, EliTech Inc., Logan, UT, USA) using a C-52 sample chamber at an ambient temperature of 21 °C from 7 a.m. to 3 p.m. The leaf samples were taken from four plants of each taxon in the salt treatment and the control groups.
The relative water content (RWC; %) was determined using a gravimetric method [33] with a 4 h saturation of leaf samples in water at 4 °C in the dark. The leaf samples were taken from four plants of each taxon in the salt treatment and the control groups.
The RWC was calculated as:
RWC = [(FW − DW)/(SW − DW)] × 100
where FW, DW, and SW denote the fresh, dry, and fully saturated weights of the leaf samples, respectively.

2.6. Determination of Chlorophyll and Carotenoid Pigments

The assimilation pigments chlorophyll a (Chla), chlorophyll b (Chlb), and carotenoids were extracted with 80% acetone and MgCO3 powder using a mortar. Six circular leaf pieces were taken from twenty plants of each taxon in the salt treatment and the control groups. Samples were taken from the middle part of the seedlings. After complete extraction, the mixture was filtered, and the volume adjusted to 10 mL with cold acetone. The resulting extracts were immediately assayed spectrophotometrically. The absorbance of the extract was measured at 440, 645, and 663 nm using a spectrophotometer (Lange DR 3900, Hach, Loveland, CO, USA). The levels of each pigment were determined using the coefficients and equations determined by Lichtenthaler and Buschmann [34].

2.7. Ion Contents

The analysis of selected elements (K, Na) was determined using an inductively coupled plasma optical emission spectrometer (ICP-OES 720, Agilent Technologies, Mulgrave, VIC, Australia) in axial plasma configuration together with the SPS 3 autosampler (Agilent Technologies, Basel, Switzerland).
The samples were mineralized in the high-performance microwave digestion system Ethos UP (Milestone S.r.l., Sorisole, Italy) in a solution of 5 mL HNO3 ≥ 69.0% (TraceSELECT®, Honeywell Fluka, Morris Plains, NJ, USA), 1 mL H2O2 ≥ 30% for trace analysis (Sigma-Aldrich, Saint Louis, MO, USA), and 2 mL of ultrapure water (18.2 MΩ cm−1; 25 °C, Synergy UV, Merck Millipore, Molsheim, France). In the experiment, multielement standard solution V for ICP (Sigma-Aldrich Production GmbH, Basel, Switzerland) was used. The legitimacy of the whole method was verified using a certified reference material (CRM–ERM CE278 K, Sigma-Aldrich Production GmbH, Basel, Switzerland) [35].

2.8. Statistical Analysis

The normality and homogeneity of variance for all the variables were determined based on Shapiro–Wilk’s test (at a significance level of α = 0.001) and Levene’s test (at a significance level of α = 0.05). Grubbs’ test was used to detect and remove single outliers in the experimental dataset. Two-way ANOVA analysis comparing the effects of taxon, salt treatment, and the interactions between them was used to assess differences between P. pyraster and T. cordata seedlings grown under salt treatment. The multiple comparison of means was performed using the Tukey honest significant difference (HSD) test (at significance levels of α = 0.05). Regression analysis was applied for assessment of the relationships between RWC, Ψwl, and the cumulative salt uptake.
Statgraphics Centurion XVII software (StatPoint Technologies, Warrenton, VA, USA, XVIII, license number: B480-E10A-00EA-P00S-60PO) was used for statistical data analysis.

3. Results

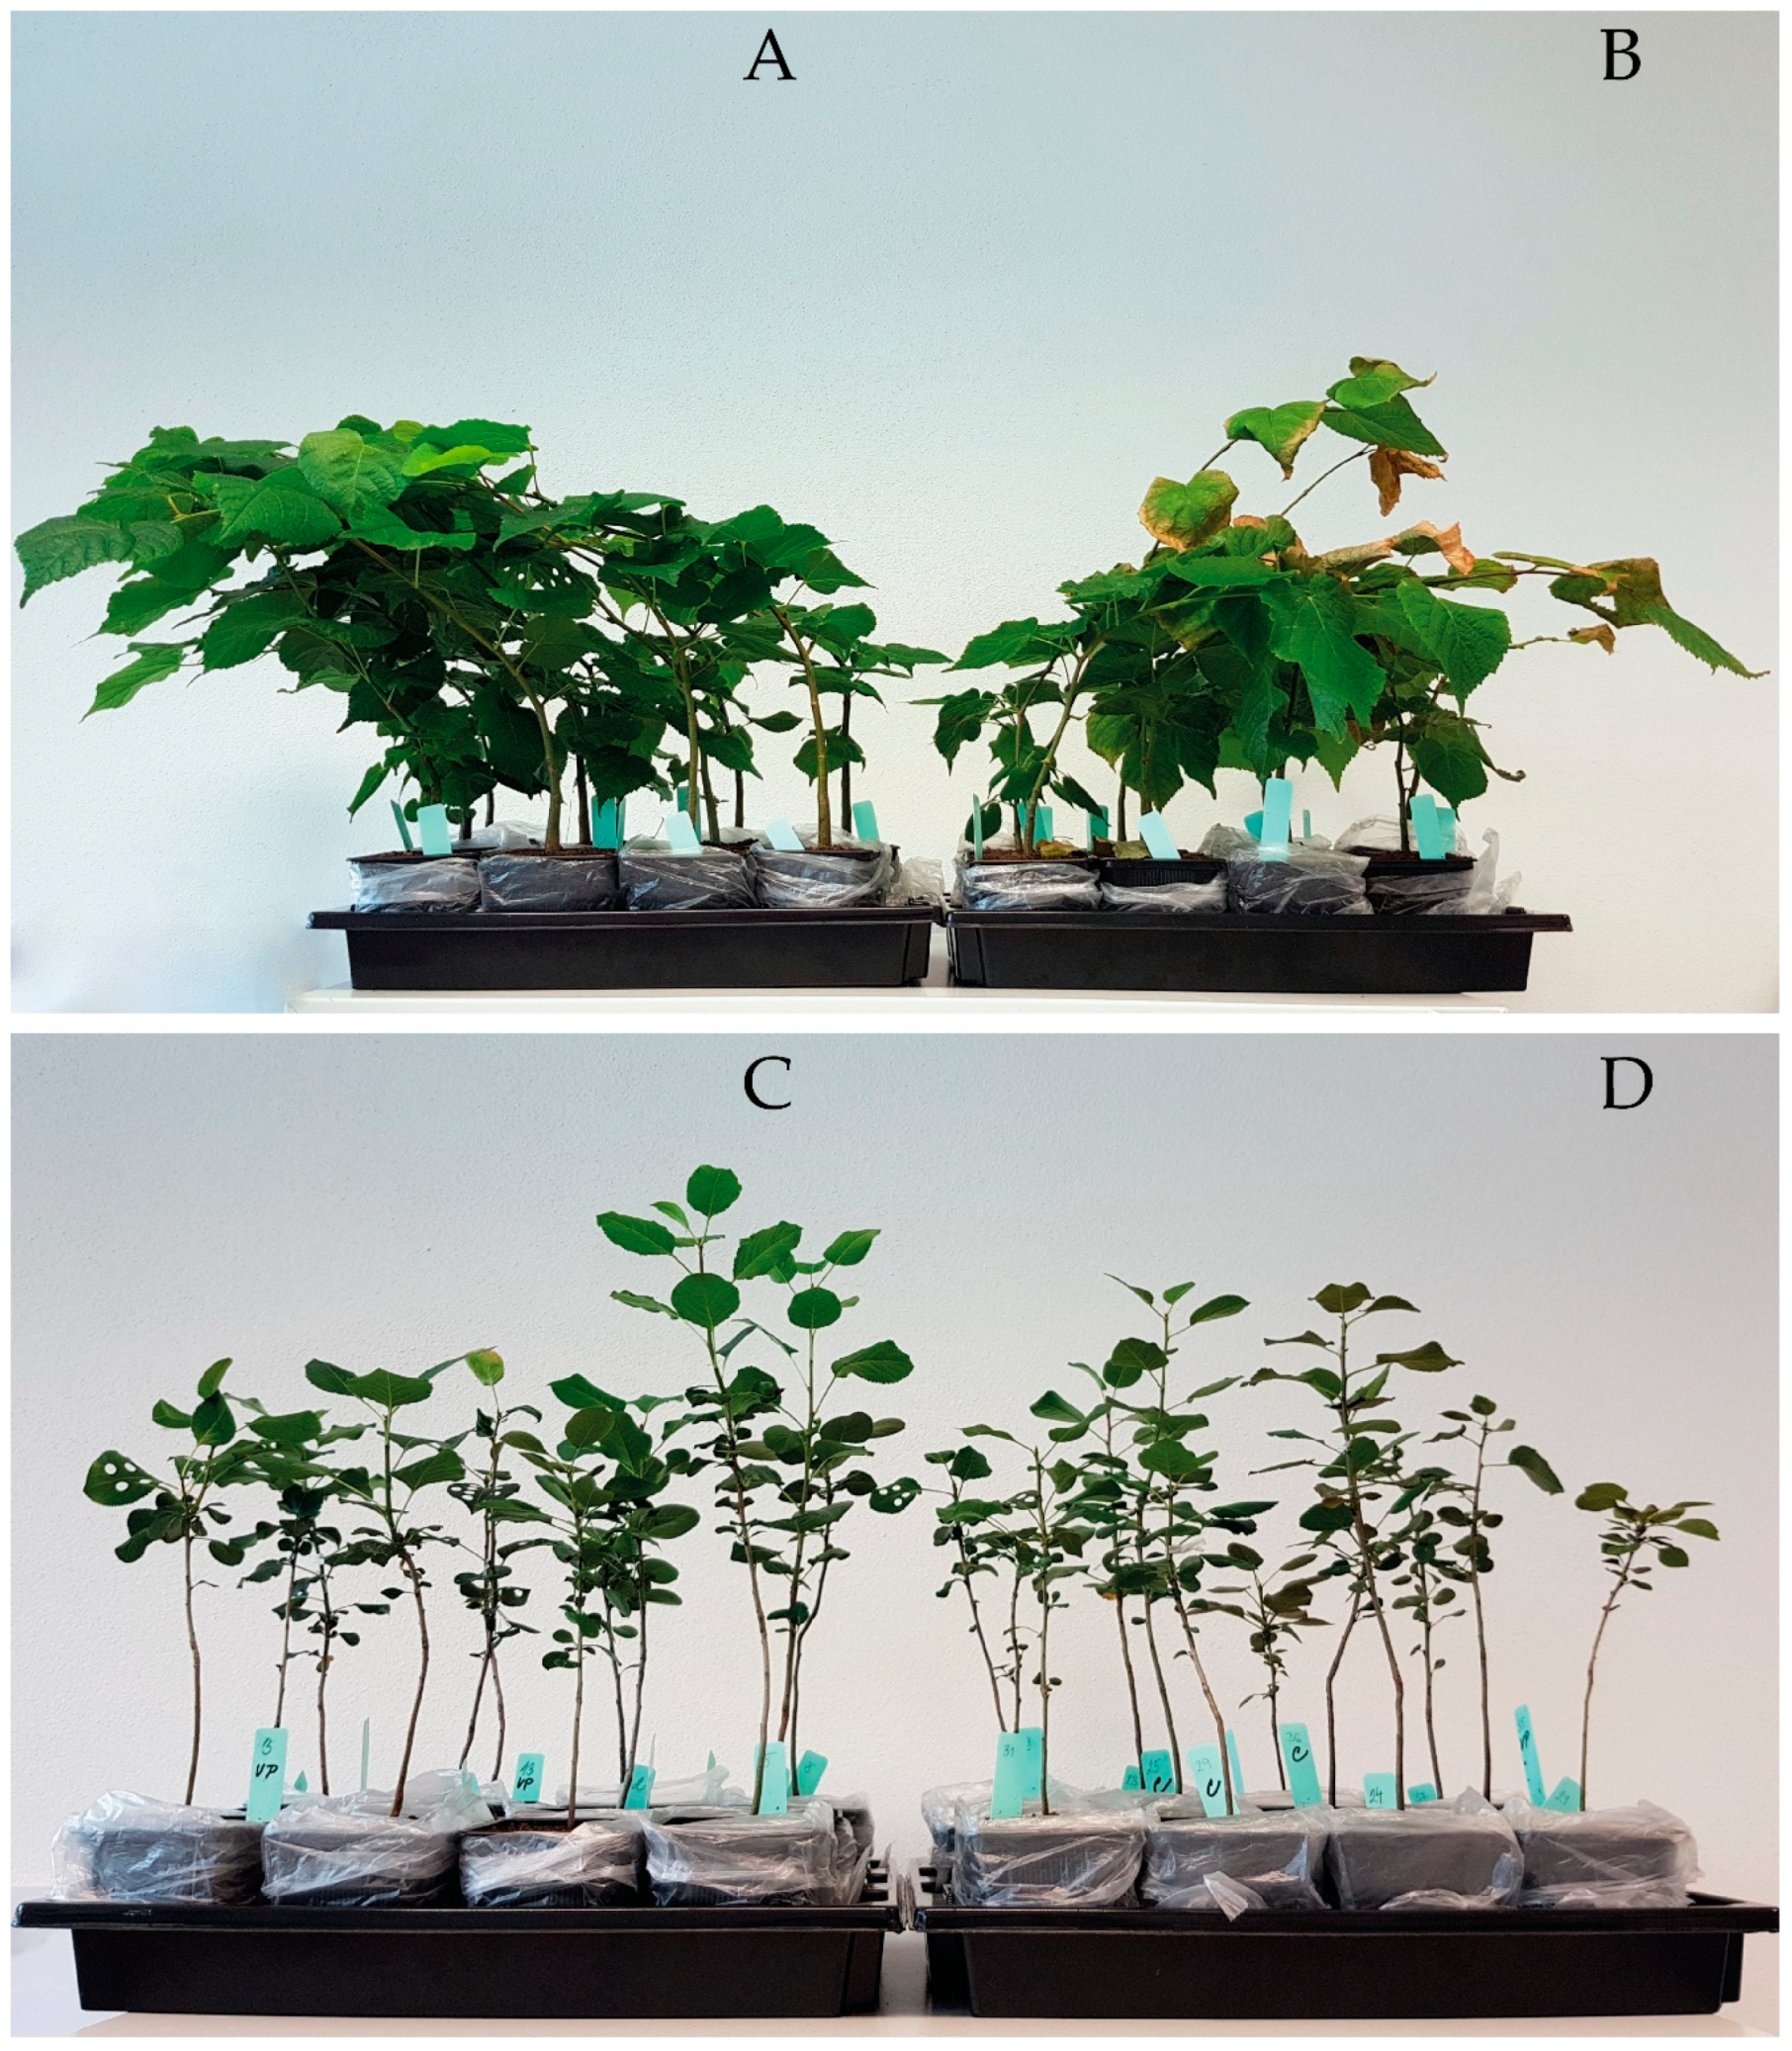
3.1. Effect of Salinity on Growth and Mass Accumulation of Plant Organs

T. cordata is more efficient in biomass production compared to P. pyraster, as per the documented data on the fresh weight (FW) and relative biomass increment (RBI) for the control plants (Table 2). Salinity (salt stress) had a strong but variable effect on the growth and mass accumulation of plant organs. RBI was significantly reduced for both species, but only for T. cordata was the decrease in both total FW and DW considered significant. Under salt treatment, the dry mass values of the aboveground organs (DWS) (−26%) as well as of the root (DWR) (−46%) were significantly reduced for T. cordata seedlings. The stem increment and leaf dry mass (DWL) were not affected, but salinity reduced the radial growth of the stem manifested by the decrease in the stem dry mass (SDW) (−35%) compared to the control (Table 2). The root growth in length (−47%) and volume (−54%) were also reduced. Under salt treatment, DWS and DWR were not significantly reduced for P. pyraster seedlings. P. pyraster adapted to salinity by investing in root growth, as it increased the number of root tips (NRT) and maintained a balanced root length. The average root diameter (ARD) and root volume (RV) (−32%) of the salt-treated seedlings were reduced. Salinity did not significantly change the R:S for P. pyraster seedlings, but this was reduced for T. cordata. Under salt treatment, T. cordata has limited root growth and preferentially accumulated dry mass in the aboveground organs (leaves). The substrate salinity negatively affected the growth and development of the leaves of both studied species, which is documented by the reduction in leaf area (LA) (T. cordata −26%, P. pyraster −35%) compared to control plants. In both species, the specific leaf area (SLA) was also reduced in response to salinity (Table 2). However, leaf injury symptoms only appeared in Tilia seedlings. The first signs of damage appeared after 35 days of the experiment (when 265 mL of 100 mM NaCl had already been applied to the substrate) in the form of leaf yellowing (Figure 2A) and, later, leaf edge burning (Figure 2B) and early leaf dropping (Figure 2B,C). P. pyraster seedlings showed no symptoms of leaf damage during the experiment.

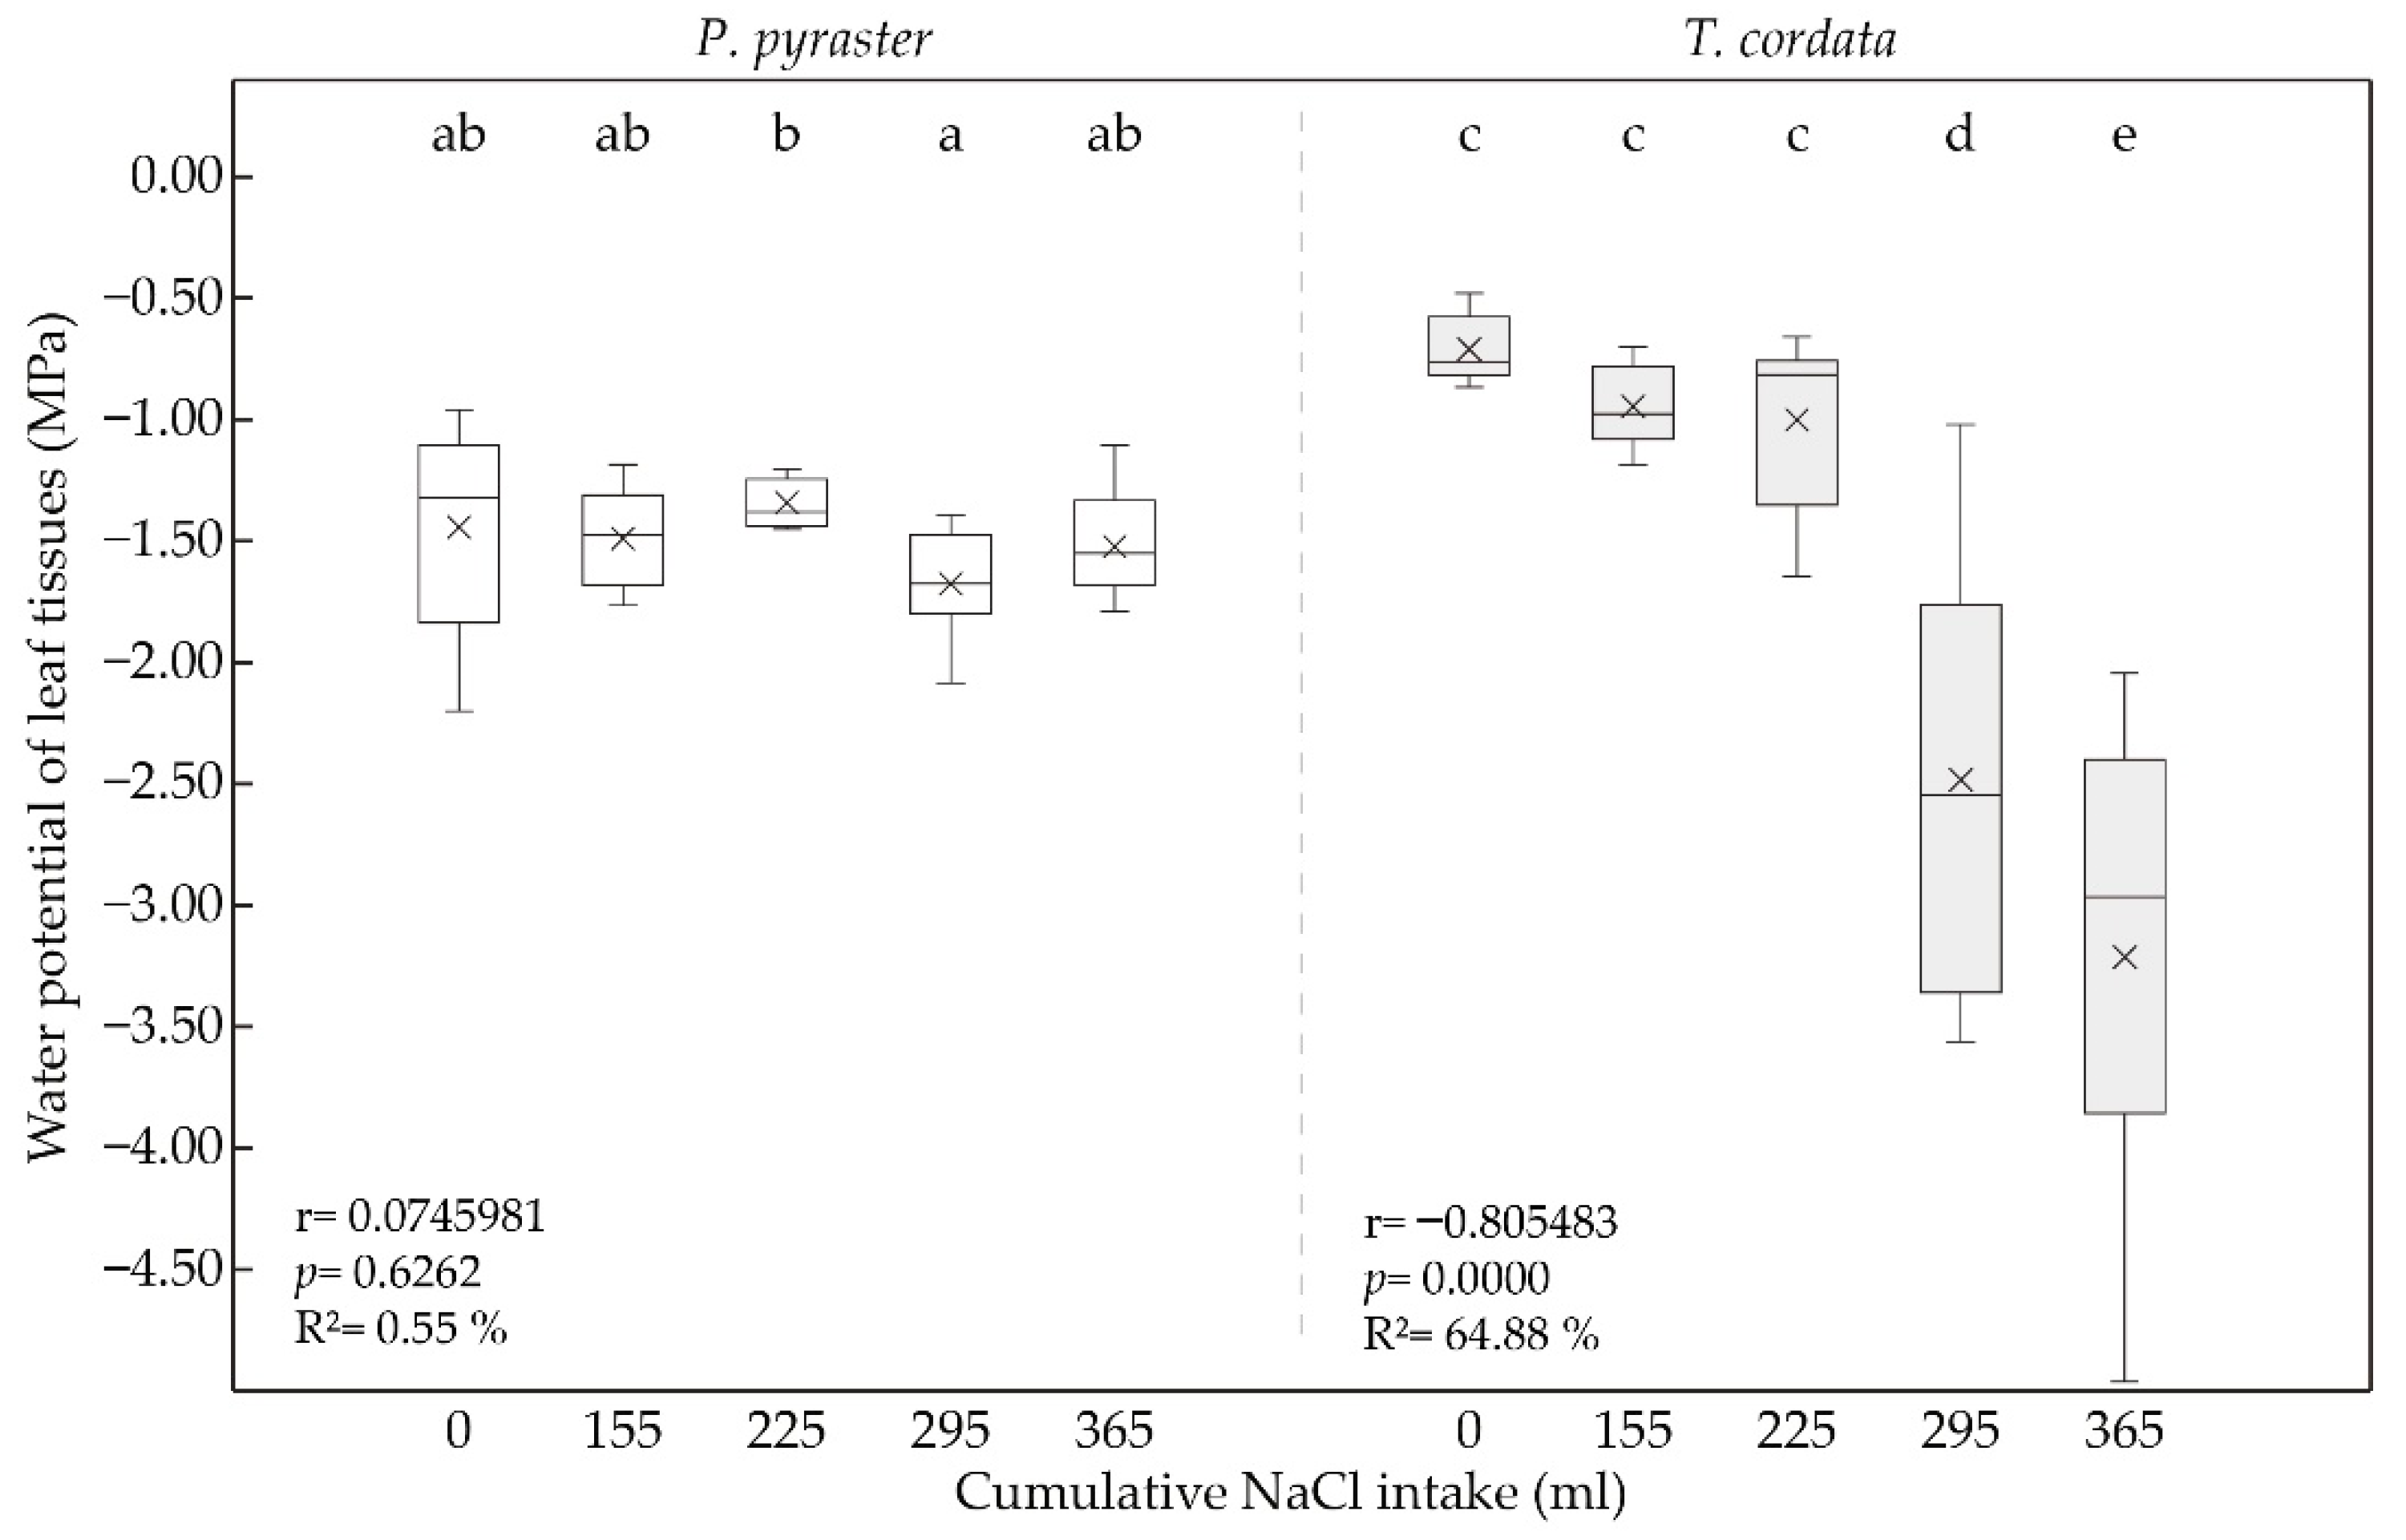
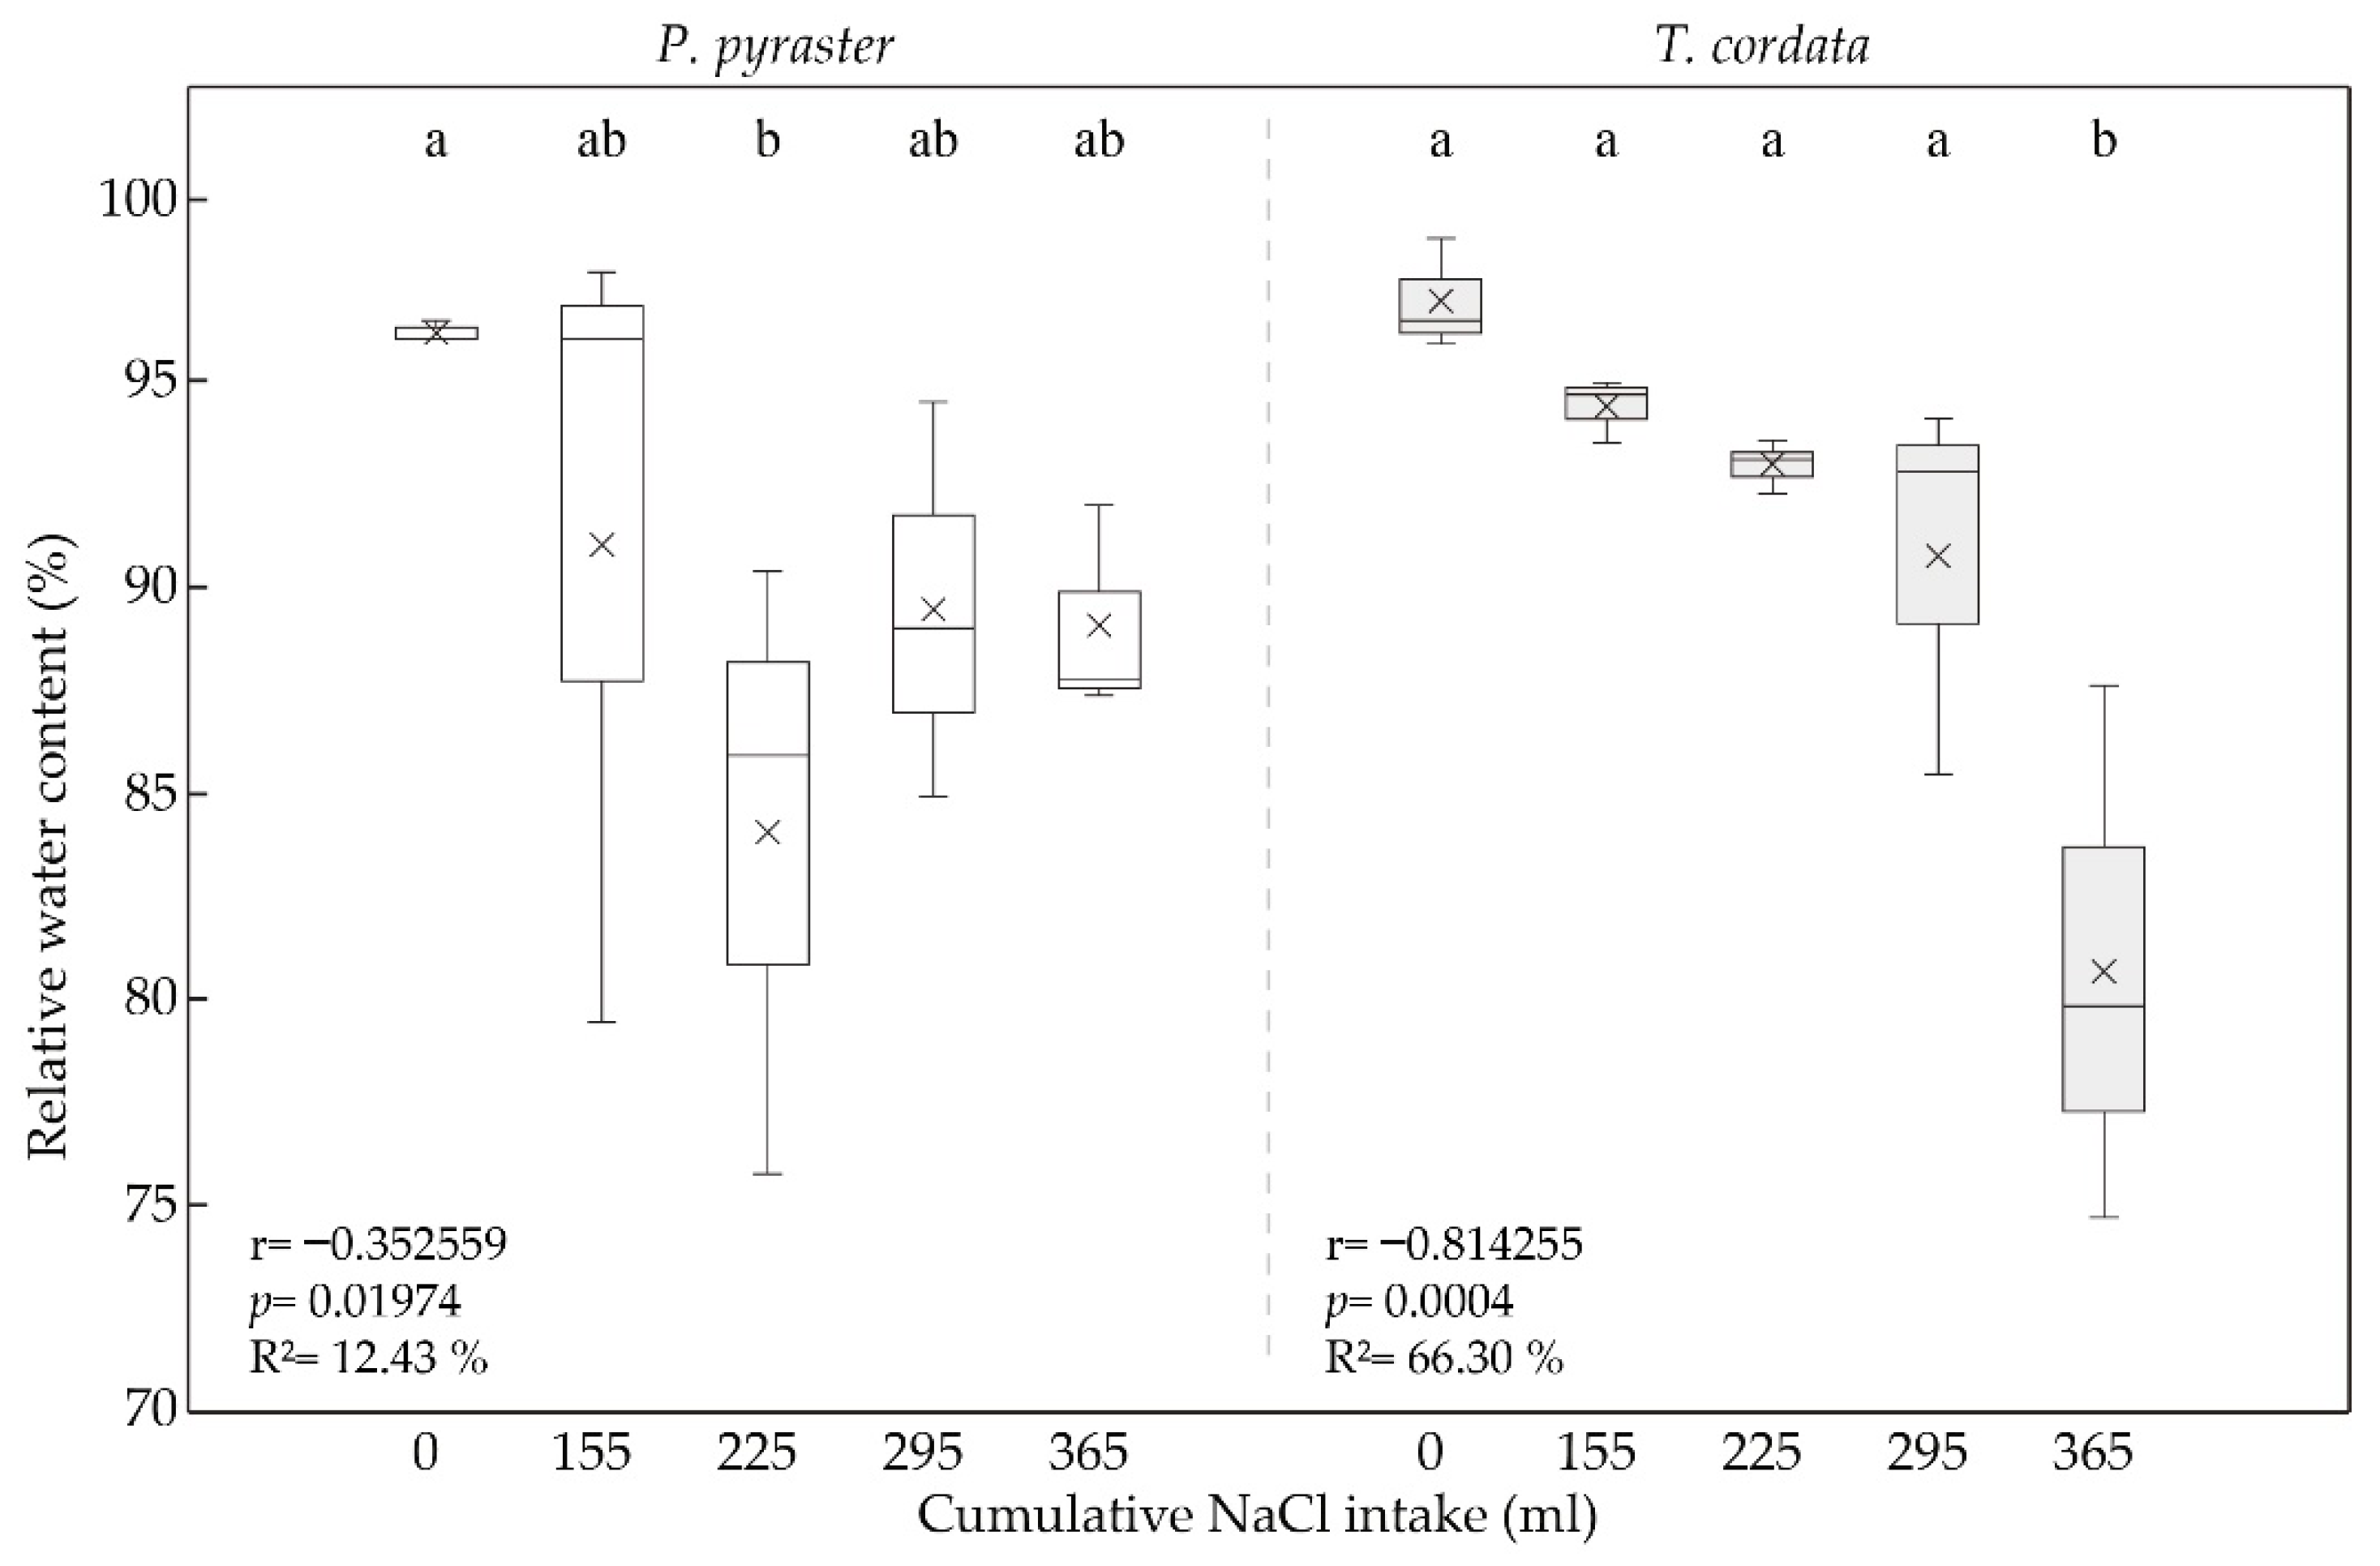
3.2. Leaf Water Status under Salt Treatment

The water potential of the leaf tissues was influenced by the taxon as well as by the cumulative amount of applied saline solution at a concentration of 100 mM NaCl, which was regularly applied to the substrate. At the beginning of the experiment, the water potential of the leaf tissues was significantly higher for T. cordata (−0.71 MPa) compared to P. pyraster (−1.46 MPa). From the beginning of the salt treatment, Tilia maintained balanced Ψwl values (−1.00 ± 0.36) for 30 days, when 225 mL of 100 mM NaCl per plant had been added to the substrate (Figure 3). However, Ψwl was significantly reduced at the 40th day (−2.45 MPa) and 50th day (−3.22 MPa) of the salt treatment. P. pyraster maintained a balanced Ψwl (−1.50 ± 0.22 MPa) throughout the whole experiment (Figure 3). A significant increase in the water potential was observed only at day 30 of the experiment.
RWC values for P. pyraster and T. cordata seedlings demonstrated differences in the species responses to salinity (Figure 4). At the beginning of the experiment, the RWC values were in the range of 96.95 ± 1.34% for T. cordata and in the range of 96.19 ± 0.26% for P. pyraster. On day 30 of the salt treatment, a significant decrease in the RWC (84.04 ± 7.5%) was observed for P. pyraster, but the values of this parameter later increased and remained stable until the end of the experiment (89.48 ± 4.80%). The RWC values for T. cordata steadily declined from the beginning of the saline treatment (Figure 4), but a significant decrease (80.71 ± 6.49) was demonstrated on day 50 of the experiment after the cumulative NaCl intake per plant exceeded 300 mL.
The obtained data document different reactions of the studied species to salinity and, therefore, varying mechanisms for regulating water uptake. The leaf tissues of T. cordata have a demonstrably higher water potential than P. pyraster; however, at a higher cumulative salinity level (above 300 mL per plant), the values of Ψwl decreased sharply, similar to the RWC. P. pyraster maintained a balanced water potential and relative water content in the leaves under salt treatment, even at a higher cumulative NaCl intake per plant.

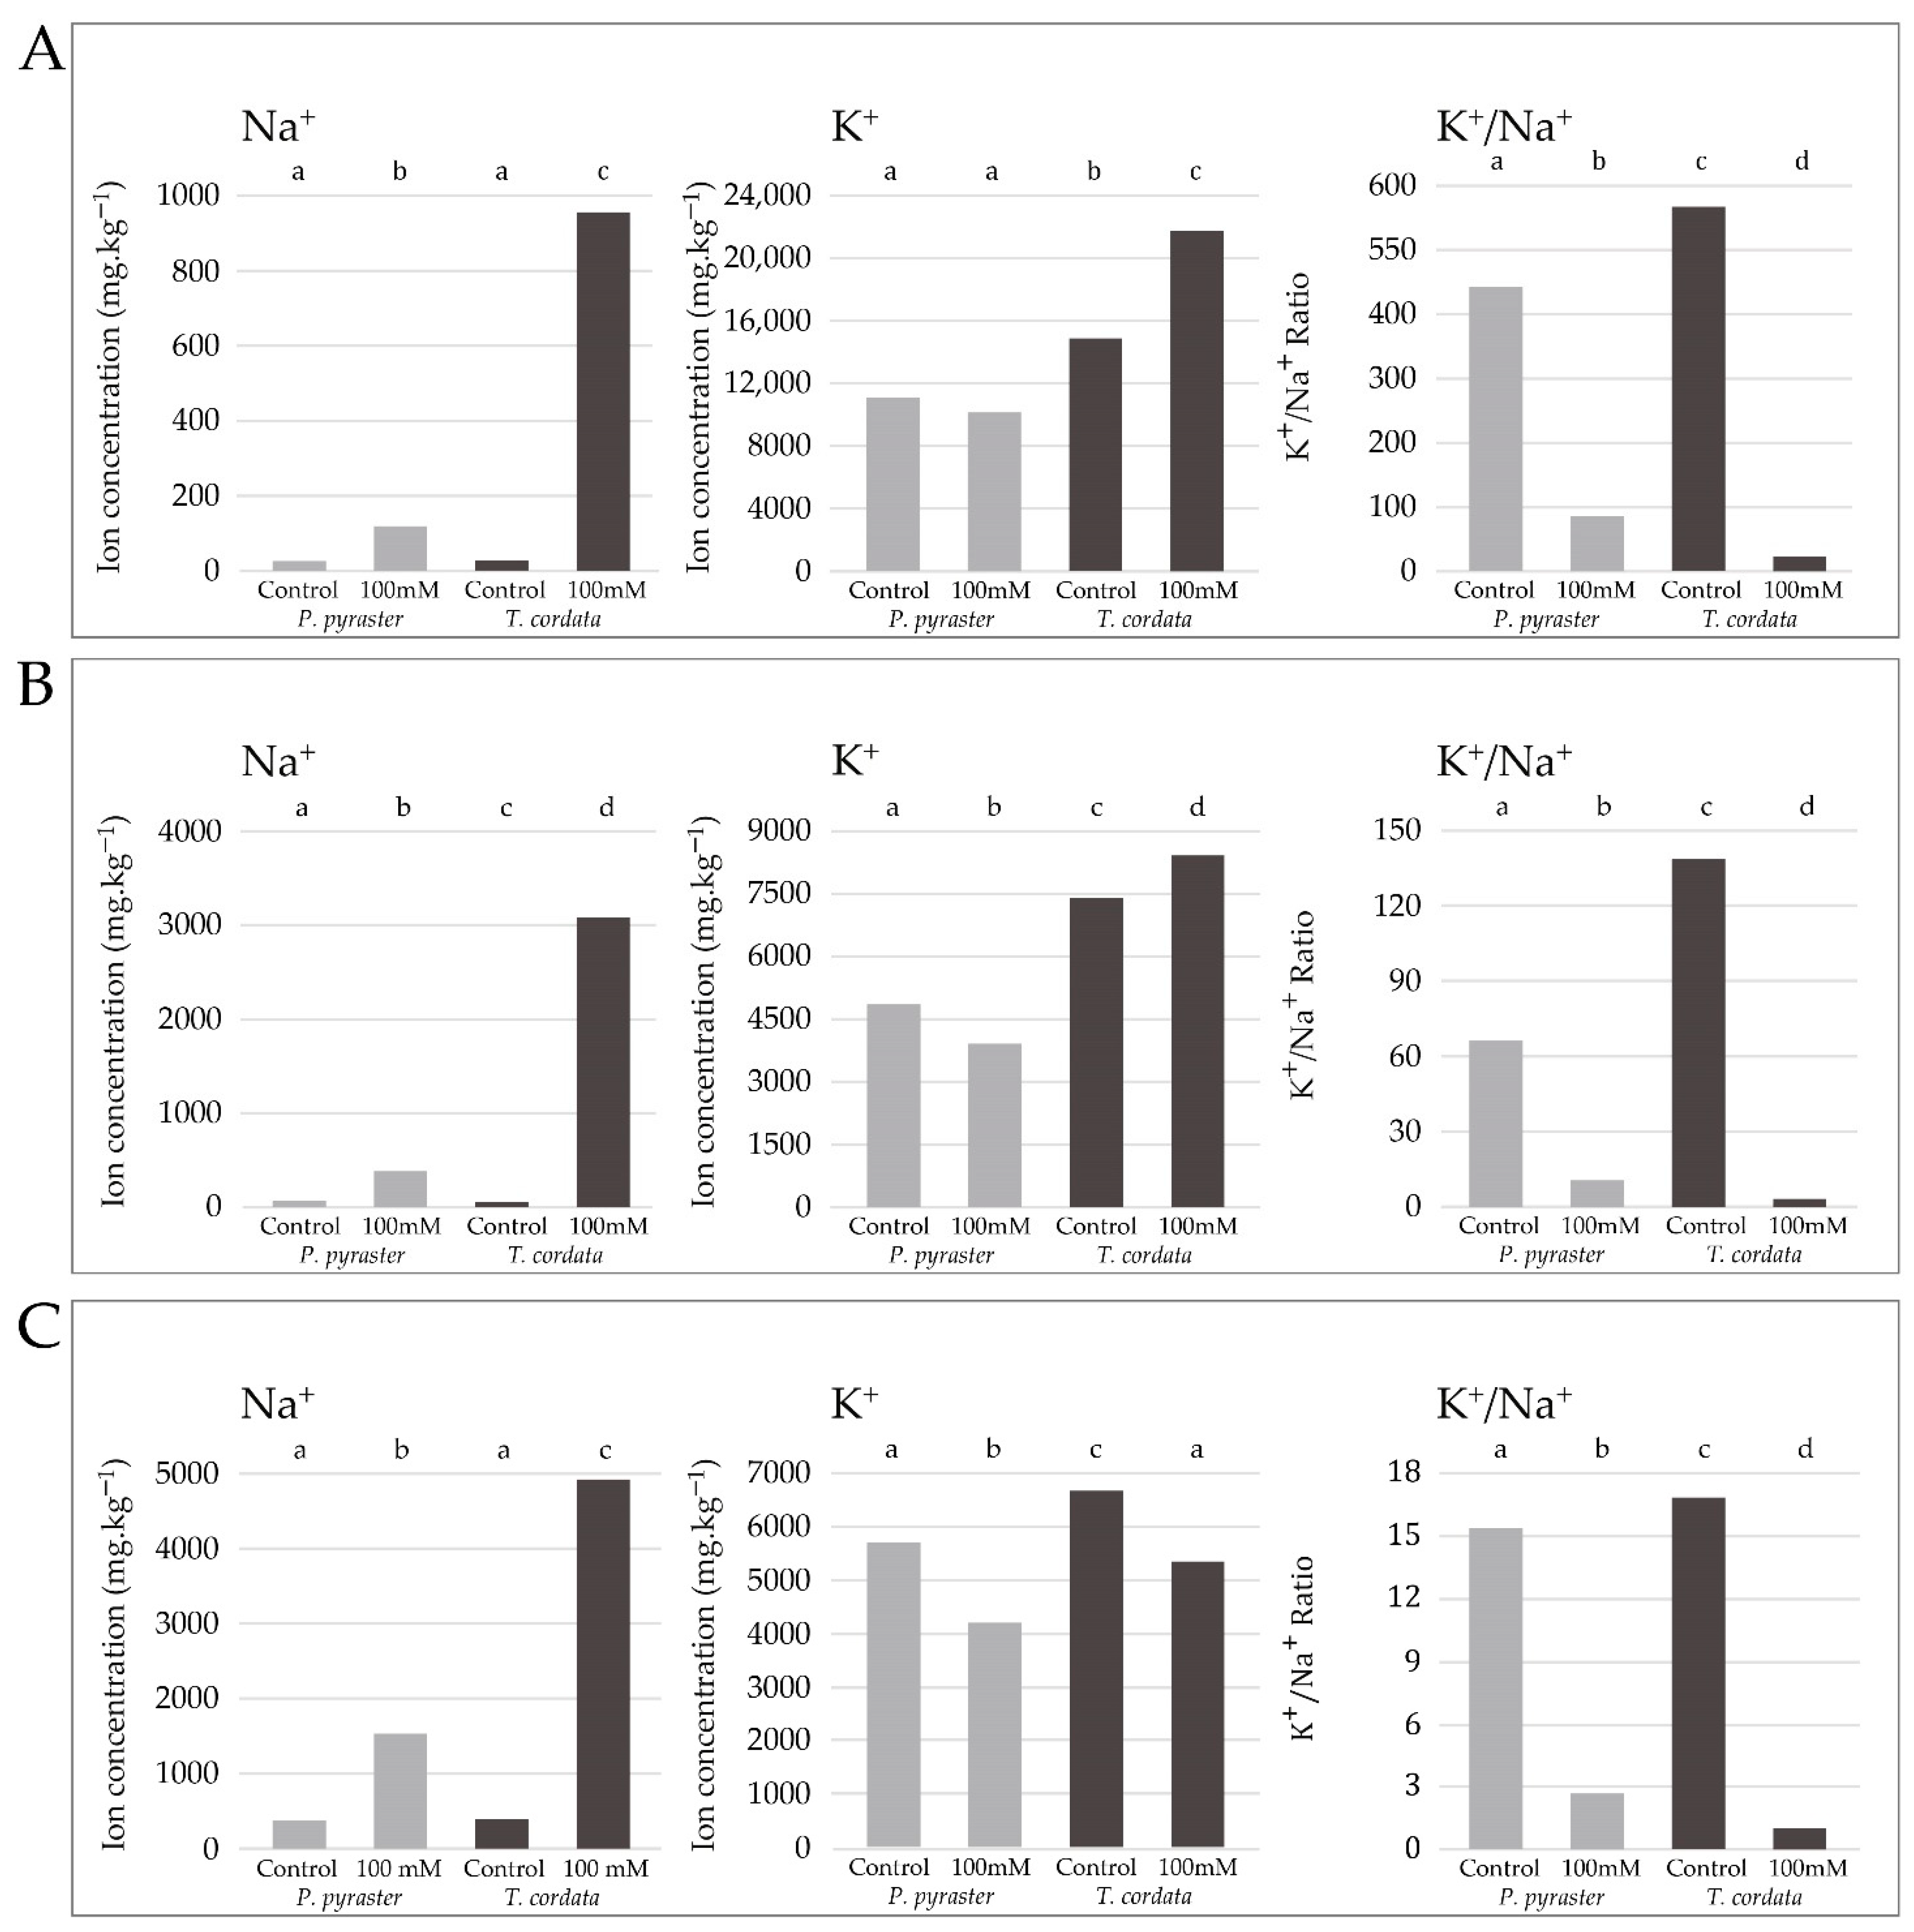
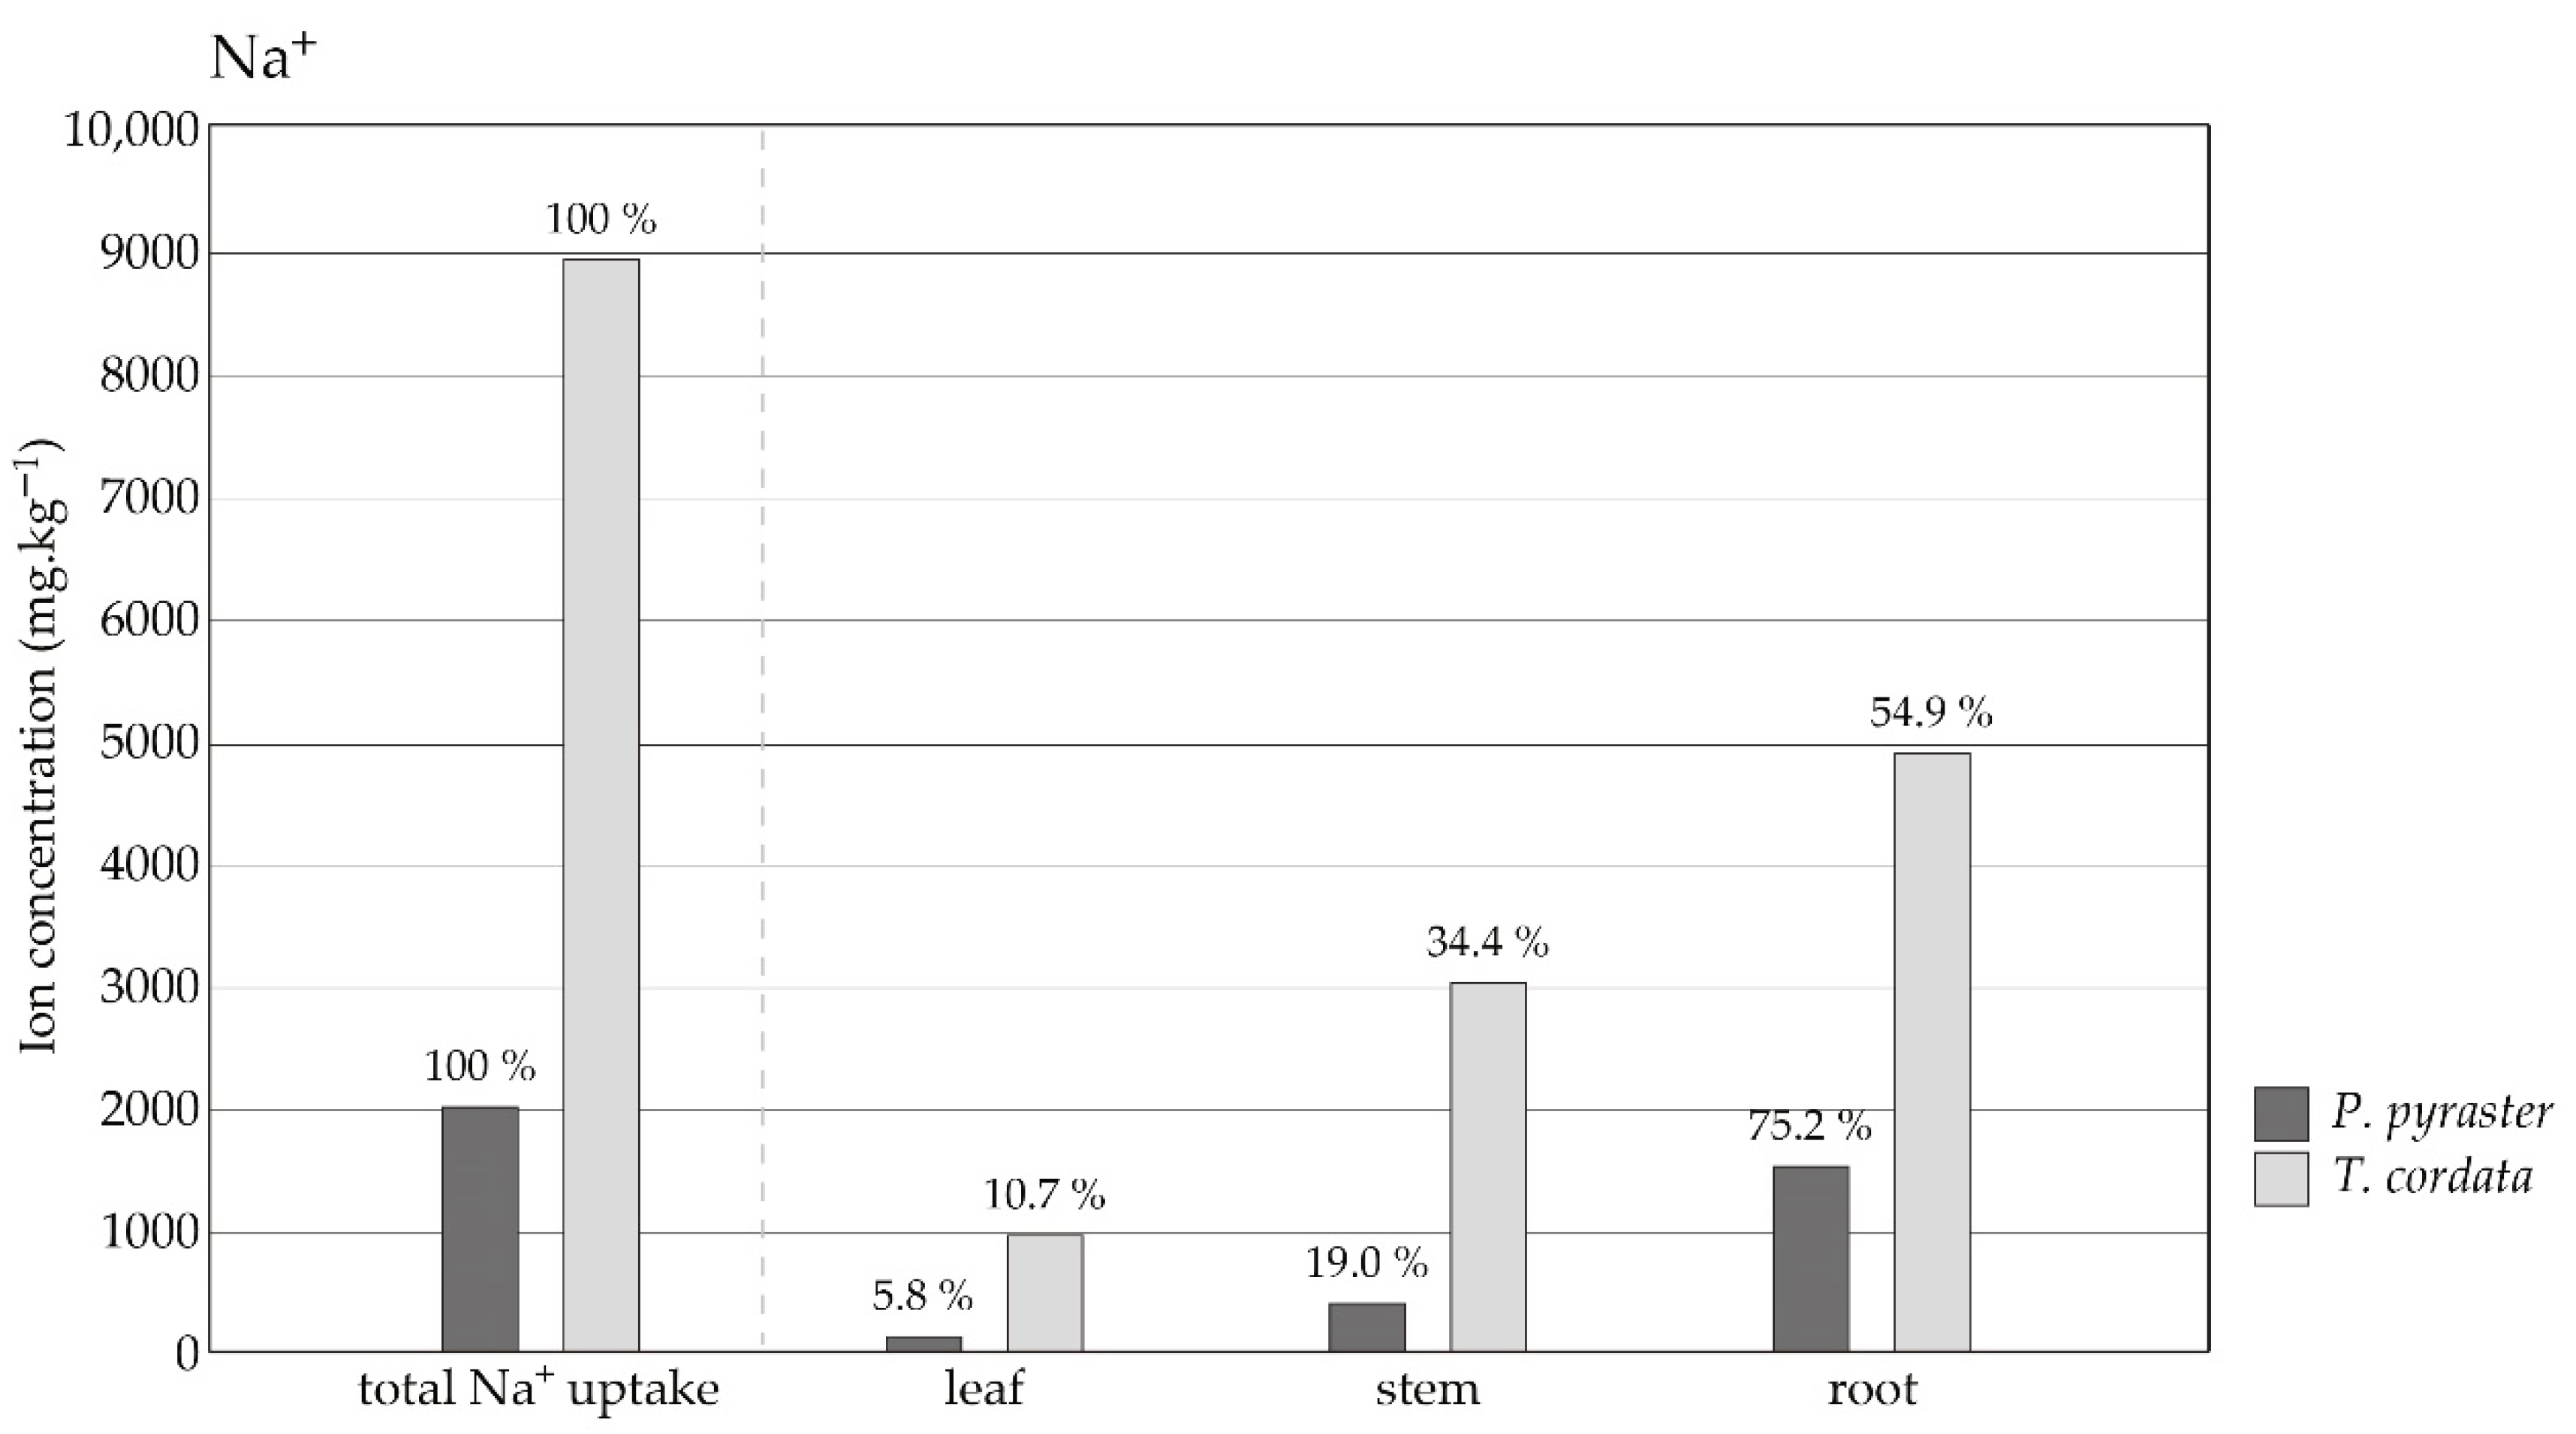
3.3. Salt Ion Uptake and Distribution

Significant differences were observed in the studied species in terms of the uptake and distribution of salt ions to the plant organs. During the experiment, the same amount of salt solution was applied to the substrate per plant, but T. cordata seedlings absorbed significantly more Na+ ions compared to P. pyraster (Figure 5). P. pyraster accumulated Na+ ions mainly in the root (75%), and a low amount of Na+ was distributed to the aboveground organs—stems (19%) and leaves (6%) (Figure 6). Similarly, T. cordata retained the majority of Na+ ions in the root system (55%); however, a relatively high proportion was also distributed to the stems (34%) and leaves (11%). Compared to the untreated control, T. cordata significantly increased the uptake of K+ ions, and preferentially distributed them to the stem and leaves under salt treatment. The K+ content did not change in the leaves of P. pyraster compared with the control, but it was significantly reduced in the stem and root system (Figure 4). Increased NaCl uptake competed with K+ intake and led to a significant change in the K+/Na+ ratio in the plant organs. The significant differences in the K+/Na+ ratio are influenced by the increased salt content in the substrate and are species-specific (Figure 5). In the roots of P. pyraster, the K+/Na+ ratio decreased (−81%) from 15.1 (control) to 2.8 (salt-treated seedlings). In T. cordata roots, the change in the K+/Na+ ratio was even more pronounced (−94%) and decreased from 17 (control) to 1 for salt-treated seedlings (Figure 5). A significant decrease (−96%) in the K+/Na+ ratio was detected in the leaves of T. cordata in comparison to both the control as well as salt-treated P. pyraster seedlings (−77%). Compared to P. pyraster, T. cordata distributed a six times higher amount of Na+ to the leaves, which negatively affected the condition of the leaf apparatus and induced the development of necrosis (Figure 2). P. pyraster blocked salt uptake at the level of the root system, and thus protected its leaves from intoxication and damage.

3.4. Effect of Salinity on Photosynthetic Pigments

The content of photosynthetic pigments for the seedlings of the studied tree species is species-specific. Compared to T. cordata, P. pyraster has a significantly higher content of photosynthetic pigments according to the relevant parameters for the control and salt-treated plants (Table 3). A significant reduction in the chlorophyll content was observed in the leaves of T. cordata seedlings after the application of 100 mM NaCl in a cumulative volume of 365 mL NaCl per plant. The contents of total chlorophyll (Chlab), Chla, and Chlb were decreased by NaCl stress. The carotenoid content and the Chl a/b ratio did not change for the salt-treated seedlings compared to the control. P. pyraster seedlings maintained a balanced content of photosynthetic pigments in the leaves during 50 days of the continual salt treatment.

3.5. Effect of Salinity on Leaf Gas Exchange

Species–specific differences were observed in all examined gas exchange parameters (gs, E, An, WUE) (Table 4). The P. pyraster seedlings had significantly reduced gs and E in response to salinity on day 20 of regular NaCl application to the substrate. The reductions in gs and E were observed in response to the osmotic phase of the salinity stress. During the experiment, P. pyraster seedlings maintained balanced values of both parameters (gs, E) compared to the control under increasing cumulative NaCl intake to the substrate. P. pyraster seedlings had balanced values of An and WUE without significant changes compared to the control throughout the whole experiment. In response to the salt treatment, the seedlings of T. cordata had reduced gs and increased WUE on days 20 and 40 of the experiment, when the cumulative salt uptake was 155 and 295 mL per plant, respectively. The transpiration rate decreased significantly on day 40 of the experiment (0.27 ± 0.12 mmol H2O m−2·s−1) compared to the control (0.58 ± 0.19 mmol H2O m−2·s−1). A significant decrease in An was observed on day 50 of the experiment, which indicates that salt stress has a negative impacts on photosynthesis. The decreases in the stomatal conductance and transpiration rate were transient for P. pyraster seedlings, which maintained balanced photosynthesis even under conditions of higher cumulative salt content in the substrate.

4. Discussion

Salinity causes severe physiological dysfunctions in plants in addition to indirect damage, even at low concentrations [25]. The growth reduction due to salinity has been documented for many plant species, but not halophytes [26]. Several authors particularly refer to the reduction in shoot growth [2,36,37,38,39]. In our study, salinity significantly reduced the fresh and dry matter of T. cordata seedlings (FW: 56%; DW: 34%). A significant reduction in shoot and root matter was not confirmed for P. pyraster seedlings under salt treatment, where the mass accumulation did not change compared to the control plants. P. pyraster invested in root growth, increased the number of root tips and maintained the balanced parameters RL and SRL under salt treatment. Our previous research shows that P. pyraster maintains a balanced ratio of the mass distribution between underground and aboveground organs (R:S) even under conditions of water scarcity [40,41]. The findings suggest the effective water uptake and retention of salt ions in the root system of P. pyraster. T. cordata demonstrably reduced the length of the root (−47%) and the number of root tips (−47%) under salt treatment, which reduced the exploratory capacity of the root system. The obtained data indicate both effective water uptake as well as retention of salt ions in the root system for P. pyraster. The continuous growth of roots allows for the continuous exploration of new soil for water and the partial alleviation of water stress through improvements in the water supply [42]. Increasing the proportion of root system mass in plants exposed to salinity has a positive effect through the increased retention of toxic salt ions in the root, thus limiting their transfer to aboveground organs (especially leaves) [2], which can be a typical mechanism of resistance or survival in condition of excessive salinity [43,44].
Under salt treatment, the seedlings of the studied tree species had reduced leaf area (Pyrus: 35%; Tilia: 26%), which is considered a typical response to salt stress. P. pyraster formed smaller leaves and showed significantly reduced shoot growth (−43%). According to Munns and Tester [1], a significant reduction in the size of individual leaves or the number of shoots is the main effect of salinity that manifests in dicotyledonous species. T. cordata seedlings maintained balanced stem growth and dry matter accumulation in the leaves even after salt treatment. The reduction in the leaf area was due to damage and early leaf fall. The first symptoms of leaf damage appeared on T. cordata seedlings on day 35 from the beginning of the salt treatment. The salt ions were accumulated in the leaves to the level of toxic concentration, which caused leaf damage and the decay of photosynthetic pigments. According to Munns and Tester [1], the “ion-specific” phase of plant response to salinity begins when a toxic level of salt concentration in leaf tissues is reached. According to these authors, the leaf development during long-term salinity is mainly influenced by the ability of plants to prevent the accumulation of salt ions in assimilation organs in addition to producing new leaves faster than salt-intoxicated leaves are dying.
The control of salt uptake by the roots and the regulation of salt distribution to the aboveground organs are important mechanisms in preventing the concentration of salt ions in plant leaves. It is considered to be a significant characteristic of the plant tolerance to salinity [45,46,47,48,49]. Both studied tree species accumulated salt ions mainly in the root (Pyrus 75% and Tilia 55%). However, when the same cumulative volume of the salt solution was applied to the substrate (365 mL) in each plant, T. cordata seedlings deposited 4.5 times more Na+ ions in the plant tissues (Figure 5) and specifically distributed six times more Na+ ions to the leaves compared to P. pyraster. A high salt uptake negatively affected the condition and functionality of the assimilation apparatus of T. cordata. P. pyraster blocked the salt uptake in the root system (75%) and deposited a portion of the Na+ ions the stem (19%), thus protecting the leaf apparatus from intoxication and damage. The effective limitation of the salt uptake and the deposition of ingested salt ions in the root can be considered a manifestation of the tolerance of P. pyraster seedlings to salinity. The mechanisms for blocking salt ions in the stem and root system have been identified for P. amygdaliformis and P. elaeagrifolia [50]. These species showed no symptoms of leaf damage even after 30 days of 150 mM NaCl treatment nor any changes in the photosynthetic rates. A similar restriction and blocking of Na+ ions in trunk wood is reported for P. communis by Boland et al. [51].
Salinity affects nutrient uptake and significantly reduces K+ content in the plant tissues of many species [52,53,54]. The exclusion of Na+ from plant tissues is considered a mechanism for the optimization of the K+/Na+ ratio [55,56]. The ability of plants to optimize the K+/Na+ ratio (through K+ retention or the prevention of Na+ accumulation in leaves) is considered to be a key feature of salt tolerance [57,58]. Under salt treatment, T. cordata significantly increased the uptake and distribution of K+ to the leaves and stems, while P. pyraster maintained a balanced K+ content in only the leaves, probably due to the effective restriction of Na+ transfer and deposition in leaves (Figure 5A,B). The seedlings of the studied tree species each applied different strategies for the optimization of the K+/Na+ ratio in the plant tissues, i.e., an increased K+ uptake (T. cordata) or restricted uptake and transfer of Na+ (P. pyraster).
Salinity also affects the water–plant relationship, as the salts present in the substrate prevent the absorption of water by the root system due to the osmotic effect [59]. The accumulation of salts in the root zone causes a decrease in the osmotic potential, with a consequent decrease in the water potential [60,61,62]. Under salinity conditions, plants show symptoms of dehydration, indicating a lower water potential due to poor water uptake or less water availability in the substrate [63,64]. P. pyraster quickly reduced water uptake due to the higher concentration of the salt ions in the root zone. The decrease in the RWC (Figure 4) was the result of a high concentration of the external salt solution, which according to Greenway and Munns [65], causes osmotic stress and dehydration at the cellular level. P. pyraster was effective in the restriction of salt uptake and transport to the leaves. Salt ions were maintained in the root system and in the stem, which allowed the restoration of the water uptake through a slight increase in the water potential of the leaf tissues (Figure 3). The balanced values of the water potential were maintained for P. pyraster even under increasing cumulative salt content in the substrate. The decrease in the RWC and Ψwl under increasing salinity was observed for T. cordata seedlings. The significant decrease in Ψwl (−2.48 MPa) was accompanied by the severe symptoms of the leaf damage. T. cordata was not effective in blocking salt uptake by the root system and transported Na+ ions to the leaves that were damaged due to salt accumulation. The T. cordata seedlings were particularly affected by ionic stress, which dominates only at high levels of salinity or in sensitive species that lack the ability to control Na+ transport [1].
The data obtained in our study indicate the species-specific content of photosynthetic pigments in the leaves of T. cordata and P. pyraster. The contents of Chla, Chlb, and Chlab were significantly reduced only for T. cordata seedlings after the regular application of 100 mM NaCl solution in the total cumulative volume of 365 mL per plant. The chlorophyll parameters were not reduced for P. pyraster compared to the control plants. The balanced content of photosynthetic pigments indicates the tolerance of P. pyraster to salinity. Saline-tolerant plants have increased or unchanged chlorophyll content in the leaves when treated with salt, while chlorophyll content decreases in saline-sensitive plants [66,67]. Chlorophyll content in leaves is considered to be a biochemical indicator of the plant’s tolerance to salinity [54]. Compared to T. cordata, P. pyraster seedlings have a significantly higher content of carotenoids, which, according to several studies, stabilize the photochemical processes of photosynthesis under stress conditions [68].
The seedlings of P. pyraster and T. cordata had reduced gs in the early response to salt treatment (after 20 days). The decrease in the transpiration rate (E) was observed only for P. pyraster. Stomatal plant responses are induced by the osmotic effect of salinity in the root zone [1]. A reduction in gs can prevent excessive water loss by transpiration, similarly to what has been observed for plants in desiccating soil [69]. P. pyraster limited water loss in the initial (osmotic) phase of salt stress and maintained a steady net photosynthetic rate (An) per unit area throughout the whole experiment. The rate of photosynthesis per leaf unit area often remains unchanged for salt-treated plants, even under reduced stomatal conductance [70]. It is associated with changes in the cell anatomy that give rise to smaller, thicker leaves and lead to higher chloroplast densities per unit leaf area [1]. As these authors state, when photosynthesis is expressed on the basis of a chlorophyll unit and not on the basis of leaf area, the reduction due to salinity can usually be measured. Therefore, the reduction in the leaf area due to salinity means that photosynthesis per plant is always reduced.
The ratio of stomatal opening and the level of photosynthesis (water use efficiency, WUE) are used as indicators of plant tolerance to osmotic stress [2,71]. T. cordata seedlings responded to salinity by increasing WUE. The increase in WUE was evident in two stages (on days 20 and 40) of the experiment, which is related to the increasing cumulative NaCl uptake per plant. Due to the high accumulation of Na+ ions in the leaves (ionic stress), the abovementioned adaptive reactions decreased the water potential of the leaf tissues and also significantly decreased the net photosynthetic rate (An) on day 50 of the experiment. Despite the adaptive reactions of T. cordata seedlings to osmotic stress, Ψwl significantly decreased on day 40 of the experiment due to the high accumulation of Na+ ions in the leaves (ionic stress). In the long term, a high salinity level had a negative impact on photosynthesis (decrease in An) in T. cordata seedlings. The accumulated salts in the leaves may inhibit enzymes involved in carbohydrate metabolism or exert a direct toxic effect on photosynthetic processes [1].

5. Conclusions

Differences in tolerance to salinity were identified for P. pyraster and T. cordata seedlings as well as different mechanisms when coping with salt stress. The results document the significance and role of the root system in the resistance and survival of woody plants under saline conditions. Balanced root growth improves water supply and has a positive effect via the retention of toxic salt ions, which restricts their transfer and accumulation in leaves.
Under salt treatment, P. pyraster maintained a balanced growth and biomass accumulation in the root, as observed in the balanced root parameters RL, SRL, FWR, and DWR, and the increased number of root tips. The P. pyraster seedlings reduced the size of the leaf area in response to osmotic stress, i.e., increased salinity in the root zone. The seedlings formed smaller leaves, effectively regulated stomatal conductance, and maintained balanced values of RWC and Ψwl. P. pyraster blocked salt uptake via the root system and in the stem, thus protecting the leaf apparatus from intoxication and damage. The rate of photosynthesis per leaf unit area (An) remained unchanged under increasing salinity throughout the whole experiment. The reduced water loss, effective limitation of the salt uptake, deposition of ingested salt ions in the stem and roots, balanced content of photosynthetic pigments, and protection of the leaf apparatus against intoxication observed in P. pyraster seedlings are indicative of their tolerance to salinity.
We consider the effective limitation of the salt uptake and deposition of the ingested salt ions in the root to be a manifestation of the tolerance of P. pyraster seedlings to salinity. This tree species reduced water loss in the initial (osmotic) phase of salt stress and maintained a steady rate of photosynthesis (An) per unit area throughout the whole experiment.
T. cordata seedlings regulated water loss (gs) and maintained balanced photosynthesis (An) in the early response to osmotic stress. However, they were not effective in the restriction of salt uptake by the root system. Na+ ions were transported to the leaves, which were damaged by the accumulation of salt ions. The seedlings were not able to cope with the ionic stress that dominates at high levels of salinity or in sensitive species that lack the ability to control Na+ transport. Despite adaptive reactions (gs regulation, growth restriction), a significant decrease in Ψwl and An was observed for salt-treated T. cordata seedlings. The obtained findings show weak tolerance to salinity for T. cordata in the juvenile stage of growth.
This comparison of the early stages of growth shows that P. pyraster can cope with salinity in urban conditions. However, a deeper study of the effects of different forms and levels of salinity on these tree species is necessary in order to further our understanding of the mechanisms of salinity tolerance.

Author Contributions

Conceptualization and design, V.P. and M.H.; investigation, M.H. and H.L.; methodology. V.P. and M.H.; resources, H.L.; formal analysis, V.P. and M.H.; validation, H.L.; writing the first draft, V.P. and M.H.; writing—review and editing, V.P. and M.H.; funding acquisition. V.P. All authors have read and agreed to the published version of the manuscript.

Funding

This research was funded by Kultúrna a Edukačná Grantová Agentúra MŠVVaŠ SR (Cultural and Educational Grant Agency of the Ministry of Education, Science, Research and Sport of the Slovak Republic) grant number 007SPU-4/2020. This publication was supported by the Operational Programme Integrated Infrastructure within the Sustainable Smart Farming Systems Taking into Account Future Challenges 313011W112 project. This study was co-financed by the European Regional Development Fund.

Institutional Review Board Statement

Not applicable.

Informed Consent Statement

Not applicable.

Data Availability Statement

The data presented in this study are available on request from the corresponding author.

Conflicts of Interest

The authors declare that they have no conflict of interest.

References

  1. Munns, R.; Tester, M. Mechanisms of salinity tolerance. Ann. Rev. Plant Biol. 2008, 59, 651–681. [Google Scholar] [CrossRef] [PubMed] [Green Version]
  2. Acosta-Motos, J.R.; Ortuño, M.F.; Bernal-Vicente, A.; Diaz-Vivancos, P.; Sanchez-Blanco, M.J.; Hernandez, J.A. Plant responses to salt stress: Adaptive mechanisms. Agronomy 2017, 7, 18. [Google Scholar] [CrossRef] [Green Version]
  3. Kordrostami, M.; Rabiei, B. Salinity Stress Tolerance in Plants: Physiological, Molecular, and Biotechnological Approaches. In Plant Abiotic Stress Tolerance; Hasanuzzaman, M., Hakeem, K., Nahar, K., Alharby, H., Eds.; Springer: Cham, Switzerland, 2019. [Google Scholar]
  4. Azza, M.A.M.; Fatma, A.M.; Farahat, M.M. Responses of ornamental plants and woody trees to salinity. World J. Agric. Sci. 2007, 3, 386–395. [Google Scholar]
  5. Qados, A.M.A. Effect of salt stress on plant growth and metabolism of bean plant Vicia faba (L.). J. Saudi Soc. Agric. Sci. 2011, 10, 7–15. [Google Scholar]
  6. Parida, A.K.; Das, A.B. Salt tolerance and salinity effects on plants: A review. Ecotoxicol. Environ. Saf. 2005, 60, 324–349. [Google Scholar] [CrossRef]
  7. Ashraf, M.; Harris, P.J.C. Potential biochemical indicators of salinity tolerance in plants. Plant Sci. 2004, 166, 3–16. [Google Scholar] [CrossRef]
  8. Geissler, N.; Hussin, S.; Koyro, H.W. Interactive effects of NaCl salinity and elevated atmospheric CO2 concentration on growth, photosynthesis, water relations and chemical composition of the potential cash crop halophyte Aster tripolium L. Environ. Exp. Bot. 2009, 65, 220–231. [Google Scholar] [CrossRef]
  9. Zhang, Z.-H.; Liu, Q.; Song, H.-X.; Rong, X.-M.; Ismail, A.M. Responses of different rice (Oryza sativa L.) genotypes to salt stress and relation to carbohydrate metabolism and chlorophyll content. Afr. J. Agric. Res. 2012, 7, 19–27. [Google Scholar]
  10. Pauleit, S.; Jones, N.; Garcia-Martin, G.; Garcia-Valdecantos, J.L.; Rivière, L.M.; Vidal-Beaudet, L.; Bodson, M.; Randrup, T.B. Tree establishment practice in towns and cities–Results from a European survey. Urban For. Urban Green. 2002, 1, 83–96. [Google Scholar] [CrossRef]
  11. Pigott, C.D. Tilia cordata Miller. (T. europaea L. pro parte, T. parvifolia Ehrh. ex Hoffm., T. sylvestris Desf., T. foemina folio minore Bauhin). J. Ecol. 1991, 79, 1147–1207. [Google Scholar] [CrossRef]
  12. Rameau, J.C.; Mansion, D.; Dumé, G.; Timbal, J.; Lecointe, A.; Dupont, P.; Keller, R. Flore Forestière Française. Plaines et Collines; IDF: Paris, France; ENGREF: Nancy, France, 1989. [Google Scholar]
  13. Niinemets, Ü.; Valladares, F. Tolerance to shade, drought, and waterlogging of temperate Northern Hemisphere trees and shrubs. Ecol. Monogr. 2006, 76, 521–547. [Google Scholar] [CrossRef]
  14. Pigott, D. Lime-Trees and Basswoods: A Biological Monograph of the Genus Tilia, 1st ed.; Cambridge University Press: New York, NY, USA, 2012; p. 405. [Google Scholar]
  15. De Jaegere, T.D.; Hein, S.; Claessens, H. A Review of the Characteristics of Small-Leaved Lime (Tilia cordata Mill.) and Their Implications for Silviculture in a Changing Climate. Forests 2016, 7, 56. [Google Scholar] [CrossRef] [Green Version]
  16. Moser, A.; Rötzer, T.; Pauleit, S.; Pretzsch, H. Structure and ecosystem services of small-leaved lime (Tilia cordata Mill.) and black locust (Robinia pseudoacacia L.) in urban environments. Urban For. Urban Green. 2015, 14, 1110–1121. [Google Scholar] [CrossRef]
  17. Jensen, J.S. Lime (Tilia cordata and Tilia platyphyllos). In EUFORGEN Technical Guidelines for Genetic Conservation and Use for Lime (Tilia spp.); International Plant Genetic Resources Institute: Rome, Italy, 2003. [Google Scholar]
  18. Martynova, M.; Sultanova, R.; Odintsov, G.; Sazgutdinova, R.; Khanova, E. Growth of Tilia cordata Mill. in urban forests. South East Eur. For. SEEFOR 2020, 11, 51–59. [Google Scholar] [CrossRef]
  19. Stephan, B.R.; Wagner, I.; Kleinschmit, J. EUFORGEN Technical Guidelines for Genetic Conservation and Use for Wild Apple and Pear (Malus sylvestris and Pyrus pyraster); International Plant Genetic Resources Institute: Rome, Italy, 2003. [Google Scholar]
  20. Wagner, I.; Büttner, R. Hybridization in wild pear (Pyrus pyraster) from various regions in Germany and from Luxembourg with respect to Pyrus × communis. In Proceedings of the III International Symposium on Horticulture in Europe-SHE2016, Chania, Greece, 17–21 October 2016; pp. 427–434. [Google Scholar]
  21. Ellenberg, H. Vegetation Mitteleuropas mit den Alpen in Ökologischer Sicht, 3rd ed.; Ulmer Verlag: Stuttgart, Germany, 1983. [Google Scholar]
  22. Paganová, V. Wild pear Pyrus pyraster (L.) Burgsd. requirements on environmental conditions. Ekológia 2003, 22, 225–241. [Google Scholar]
  23. Milner, E. Trees of Britain and Ireland; Natural History Museum: London, UK, 2011. [Google Scholar]
  24. Lawesson, J.E.; Oksanen, J. Niche characteristics of Danish woody species as derived from coenoclines. J. Veg. Sci. 2002, 13, 279–290. [Google Scholar] [CrossRef]
  25. Shannon, M.C.; Grieve, C.M.; Francois, L.E. Whole-plant response to salinity. In Plant—Environment Interactions; Wilkinson, R.E., Ed.; Marcel Dekker: New York, NY, USA, 1994; pp. 199–244. [Google Scholar]
  26. Kozlowski, T.T. Responses of woody plants to flooding and salinity. Tree Physiol. 1997, 17, 490. [Google Scholar] [CrossRef]
  27. Lapin, M.; Faško, P.; Melo, M.; Štastný, P.; Tomlain, J. Klimatické oblasti. In Atlas Krajiny Slovenskej Republiky; Ministerstvo životného prostredia: Banská Bystrica, Slovakia, 2002; p. 344. [Google Scholar]
  28. Trautmann, N.; Richard, T. Moisture Content. Cornell Waste Management Institute. 1996. Available online: http://compost.css.cornell.edu/calc/moisture_content.html (accessed on 15 August 2021).
  29. Ostonen, I.; Püttstep, U.; Biel, C.; Alberton, O.; Bakker, M.R.; Löhmus, H.; Majdi, D.; Metcalfe, D.; Olsthoorn, A.F.M.; Pronk, A.; et al. Specific root length as an indicator of environmental changes. Plant Biosyst. 2007, 141, 3426–3442. [Google Scholar] [CrossRef]
  30. Poorter, H.; Niklas, K.J.; Reich, P.B.; Oleksyn, J.; Poot, P.; Mommer, L. Biomass allocation to leaves, stems and roots: Meta-analyses of interspecific variation and environmental control. New Phytol. 2012, 193, 30–50. [Google Scholar] [CrossRef]
  31. Parsons, R.; Weyers, J.D.B.; Lawson, T.; Godber, I.M. Rapid and straightforward estimates of photosynthetic characteristics using a portable gas exchange system. Photosynthetica 1998, 34, 265–279. [Google Scholar] [CrossRef]
  32. Hunt, S. Measurements of photosynthesis and respiration in plants. Physiol. Plant. 2003, 117, 314–325. [Google Scholar] [CrossRef] [PubMed]
  33. Barrs, H.D.; Weatherley, P.E. A re-examination of the relative turgidity technique for estimating water deficit in leaves. Aust. J. Biol. Sci. 1962, 15, 413–428. [Google Scholar] [CrossRef] [Green Version]
  34. Lichtenthaler, H.K.; Buschmann, C. Extraction of photosynthetic tissues: Chlorophylls and carotenoids. Curr. Protoc. Food Anal. Chem. 2001, 1, F4.2.1–F4.2.6. [Google Scholar] [CrossRef]
  35. Kovacik, A.; Tvrda, E.; Miskeje, M.; Arvay, J.; Tomka, M.; Zbynovska, K. Trace metals in the freshwaterfish Cyprinus carpio: Effect to serum biochemistry and oxidative status markers. Biol. Trace Elem. Res. 2018, 188, 494–507. [Google Scholar] [CrossRef]
  36. Ziska, L.H.; Seeman, L.H.; DeJong, T.M. Salinity induced limitations on photosynthesis in Prunus salicina, a deciduous tree species. Plant Physiol. 1990, 93, 864–870. [Google Scholar] [CrossRef] [Green Version]
  37. Zekri, M.; Parsons, L.R. Response of split-root sour orange seedlings to NaCl and polyethylene glycol stresses. J. Exp. Bot. 1990, 41, 35–40. [Google Scholar] [CrossRef]
  38. Abassi, M.; Mguis, K.; Béjaoui, Z.; Albouchi, A. Morphogenetic responses of Populus alba L. under salt stress. J. For. Res. 2014, 25, 155–161. [Google Scholar] [CrossRef]
  39. Chen, P.F.; Zuo, L.H.; Yu, X.Y.; Dong, Y.; Zhang, S.; Yang, M. Response mechanism in Populus× euramericana cv. ‘74/76′ revealed by RNA-seq under salt stress. Acta Physiol. Plant 2018, 40, 96. [Google Scholar] [CrossRef]
  40. Paganová, V.; Jureková, Z.; Lichtnerová, H. The nature and way of root adaptation of juvenile woody plants Sorbus and Pyrus to drought. Environ. Monit. Assess. 2019, 191, 714. [Google Scholar] [CrossRef]
  41. Paganová, V.; Hus, M.; Jureková, Z. Physiological performance of Pyrus pyraster L. (Burgsd.) and Sorbus torminalis (L.) crantz seedlings under drought treatment. Plants 2020, 9, 1496. [Google Scholar] [CrossRef]
  42. Hsiao, T.C.; Xu, L.K. Sensitivity of growth of roots versus leaves to water stress: Biophysical analysis and relation to water transport. J. Exp. Bot. 2000, 51, 1595–1616. [Google Scholar] [CrossRef]
  43. Cassaniti, C.; Leonardi, C.; Flowers, T.J. The effects of sodium chloride ornamental shrubs. Sci. Hortic. 2009, 122, 586–593. [Google Scholar] [CrossRef]
  44. Cassaniti, C.; Romano, D.; Flowers, T.J. The response of ornamental plants to saline irrigation water. In Irrigation Water Management. Pollution and Alternative Strategies; Garcia-Garizabal, I., Ed.; InTech Europe: Rijeka, Croatia, 2012; pp. 132–158. [Google Scholar]
  45. Boursier, P.; Läuchli, A. Growth responses and mineral nutrient relations of salt stressed sorghum. Crop Sci. 1990, 30, 1226–1233. [Google Scholar] [CrossRef]
  46. Maathuis, F.J.M.; Amtmann, A. K+ nutrition and Na+ toxicity: The basis of cellular K+/Na+ ratios. Ann. Bot. 1999, 84, 123–133. [Google Scholar] [CrossRef] [Green Version]
  47. Pérez-Alfocea, F.; Balibrea, M.E.; Alarçon, J.J.; Bolarín, M.C. Composition of xylemand phloem exudates in relation to the salt tolerance of domestic and wild tomato species. J. Plant Physiol. 2000, 156, 367–374. [Google Scholar] [CrossRef]
  48. Colmer, T.D.; Munns, R.; Flowers, T.J. Improving salt tolerance of wheat and barley: Future prospects. Aust. J. Exp. Agric. 2005, 45, 1425–1443. [Google Scholar] [CrossRef]
  49. Murillo-Amador, B.; Troyo-Diéguez, E.; García-Hernández, J.L.; López-Aguilar, R.; Ávila-Serrano, N.Y.; Zamora-Salgado, S.; Rueda-Puente, E.O.; Kaya, C. Effect of NaCl salinity in the genotypic variation of cowpea (Vigna unguiculata) during early vegetative growth. Sci. Hortic. 2006, 108, 423–441. [Google Scholar] [CrossRef]
  50. Matsumoto, K.; Tamura, F.; Chun, J.; Tanabe, K. Native Mediterranean Pyrus rootstock, P. amygdaliformis and P. elaeagrifolia present higher tolerance to salinity stress compared with Asian natives. J. Jpn. Soc. Hort. Sci. 2006, 75, 450–457. [Google Scholar] [CrossRef] [Green Version]
  51. Boland, A.M.; Jerie, P.; Maas, E. Long-term effects of salinity on fruit trees. Acta Hortic. 1997, 449, 599–606. [Google Scholar] [CrossRef]
  52. Munns, R.; Termaat, A. Whole-plant responses to salinity. Funct. Plant Biol. 1986, 13, 143–160. [Google Scholar] [CrossRef]
  53. Laffray, X.; Alaoui-Sehmer, L.; Bourioug, M.; Bourgeade, P.; Alaoui-Sossé, B.; Aleya, L. Effects of sodium chloride salinity on ecophysiological and biochemical parameters of oak seedlings (Quercus robur L.) from use of de-icing salts for winter road maintenance. Environ. Monit Assess. 2018, 190, 266. [Google Scholar] [CrossRef] [PubMed]
  54. Rahneshan, Z.; Nasibi, F.; Moghadam, A.A. Effects of salinity stress on some growth, physiological, biochemical parameters and nutrients in two pistachio (Pistacia vera L.) rootstocks. J. Plant Interact. 2018, 13, 73–82. [Google Scholar] [CrossRef] [Green Version]
  55. Munns, R. Comparative physiology of salt and water stress. Plant Cell Environ. 2002, 25, 239–250. [Google Scholar] [CrossRef] [PubMed]
  56. Tester, M.; Davenport, R. Na+ Tolerance and Na+ Transport in Higher Plants. Ann. Bot. 2003, 91, 503–527. [Google Scholar] [CrossRef]
  57. Shabala, S.; Cuin, T.A. Potassium transport and plant salt tolerance. Physiol. Plant. 2008, 133, 651–669. [Google Scholar] [CrossRef]
  58. Zhang, X.; Liu, L.; Chen, B.; Qin, Z.; Xiao, Y.; Zhang, Y.; Yao, R.; Liu, H.; Yang, H. Progress in Understanding the Physiological and Molecular Responses of Populus to Salt Stress. Int. J. Mol. Sci. 2019, 20, 1312. [Google Scholar] [CrossRef] [Green Version]
  59. Navarro, A.; Bañón, S.; Conejero, W.; Sánchez-Blanco, M.J. Ornamental characters. ion accumulation and water status in Arbutus unedo seedlings irrigated with saline water and subsequent relief and transplanting. Environ. Exp. Bot. 2008, 62, 364–370. [Google Scholar] [CrossRef]
  60. Franco, J.A.; Bañón, S.; Vicente, M.J.; Miralles, J.; Martínez-Sánchez, J.J. Root development in horticultural plants grown under abiotic stress conditions—A review. J. Hortic. Sci. Biotechnol. 2011, 86, 543–556. [Google Scholar] [CrossRef]
  61. Sánchez-Blanco, M.J.; Rodríguez, P.; Olmos, E.; Morales, M.A.; Torrecillas, A. Differences in the effects of Simulated Sea Aerosol on Water Relations, Salt Content, and Leaf Ultrastructure of Rock-Rose Plants. J. Environ. Qual. 2004, 33, 1369–1375. [Google Scholar] [CrossRef] [Green Version]
  62. Slama, I.; Ghnaya, T.; Savouré, A.; Abdelly, C. Combined effects of long-term salinity and soil drying on growth, water relations, nutrient status and proline accumulation of Sesuvium portulacastrum. C. R. Biologies 2008, 331, 442–451. [Google Scholar] [CrossRef]
  63. Álvarez, S.; Gómez-Bellot, M.J.; Castillo, M.; Bañón, S.; Sánchez-Blanco, M.J. Osmotic and saline effect on growth water relations and ion uptake and translocation in Phlomis purpurea plants. Environ. Exp. Bot. 2012, 78, 138–145. [Google Scholar] [CrossRef] [Green Version]
  64. Sánchez-Blanco, M.J.; Rodríguez, P.; Morales, M.A.; Ortuño, M.F.; Torrecillas, A. Comparative growth and water relations of Cistus albidus and Cistus monspeliensis plants during water deficit conditions and recovery. Plant Sci. 2002, 162, 107–113. [Google Scholar] [CrossRef]
  65. Greenway, H.; Munns, R. Mechanisms of Salt Tolerance in Non-Halophytes. Annu. Rev. Plant Physiol. Plant Mol. Biol. 1980, 31, 149–190. [Google Scholar] [CrossRef]
  66. Stepien, P.; Johnson, G.N. Contrasting responses of photosynthesis to salt stress in the glycophyte Arabidopsis and the halophyte thellungiella: Role of the plastid terminal oxidase as an alternative electron sink. Plant Physiol. 2009, 149, 1154–1165. [Google Scholar] [CrossRef] [Green Version]
  67. Ashraf, M.; Harris, P.J.C. Photosynthesis under stressful environments: An overview. Photosynthetica 2013, 51, 163–190. [Google Scholar] [CrossRef]
  68. Demmig-Adams, B.; Adams, W.W. The role of xanthophylls cycle carotenoids in the protection of photosynthesis. Trends. Plant Sci. 1996, 1, 21–26. [Google Scholar] [CrossRef]
  69. Davies, W.J.; Kudoyarova, G.; Hartung, W. Long-distance ABA signaling and its relation to other signaling pathways in the detection of soil drying and the mediation of the plant’s response to drought. J. Plant Growth Regul. 2005, 24, 285–295. [Google Scholar] [CrossRef] [Green Version]
  70. James, R.A.; Rivelli, A.R.; Munns, R.; Caemmerer, S.V. Factors affecting CO2 assimilation.leaf injury and growth in salt-stressed durum wheat. Funct. Plant Biol. 2002, 29, 1393–1403. [Google Scholar] [CrossRef]
  71. Chaves, M.M.; Osorio, J.; Pereira, J.S. Water use efficiency and photosynthesis. In Water Use Efficiency in Plant Biology; Bacon, M., Ed.; Blackwell Publishing: Oxford, UK, 2004; pp. 42–74. [Google Scholar]
Figure 1. Two-year-old tree seedlings of (A,B) T. cordata and (C,D) P. pyraster; Control plants grown in the growth chamber for 50 days (A,C); and plants grown under the salt treatment (100 mM NaCl) (B,D).
Horticulturae 08 00519 g001
Figure 2. The leaf damage on T. cordata seedlings due to a high concentration of Na+ ions. The first symptoms appeared after 35 days of salt treatment in the form of (A) leaf yellowing; (B) leaf edge burning; and (C) early leaf fall after 50 days of salt treatment.
Horticulturae 08 00519 g002
Figure 3. Box plot for the water potential of leaf tissues (Ψwl) of the seedlings of P. pyraster and T. cordata measured at the beginning of the experiment (0 mL) and during the experiment when treated with 100 mM NaCl solution. Significant differences between measurements (p ˂ 0.05) are indicated by different letters.
Horticulturae 08 00519 g003
Figure 4. Box plot for the relative water content (RWC) for seedlings of P. pyraster and T. cordata measured at the beginning of the experiment (0 mL) and during the experiment when treated with 100 mM NaCl solution. Significant differences between measurements (p ˂ 0.05) are indicated by different letters.
Horticulturae 08 00519 g004
Figure 5. The salt ion content (Na+, K+, and K+/Na+) in the (A) leaves, (B) stems, and (C) roots of two-year-old seedlings of P. pyraster and T. cordata after 50 days of continuous 100 mM NaCl saline application and in the control. The bars indicate the mean values of the ion content in the plant organs from a sample of 10 plants. Significant differences (p ˂ 0.05) are indicated by different letters.
Horticulturae 08 00519 g005
Figure 6. The content and distribution of Na+ ions in the plant tissues (leaves, stem, roots) of P. pyraster and T. cordata seedlings grown for 50 days under salt treatment with 100 mM NaCl solution. The values above the bars indicate distribution to the plant organs as a percentage of the total Na+ ion uptake.
Horticulturae 08 00519 g006
Table 1. The source stand conditions are given according to the climatic characteristics [27] of the regions in Slovakia in which they are found.
TaxonLocationExposureAltitude
(m)
TI.(°C)TVII.
(°C)
Precipitation
(mm)
Type
P. pyrasterKremnica hills (Tŕnie)S540−318750MW
T. cordataDubeň (Žilina)S410−3.516800MW
TI.: the average temperature in January; TVII.: the average temperature in July; S: south exposure; MW: moderately warm region.
Table 2. The growth parameters and biomass allocation of P. pyraster and T. cordata seedlings in the pot experiment after 50 days of salt treatment. The multiple comparison of means (n = 20) was performed using the 95% Tukey honest significant difference (HSD) test. Data are the mean values and standard deviations (±SD). Mean values followed by different letters are significantly different.
p-ValueControl100 mmol NaCl
ParameterTST × SP. pyrasterT. cordataP. pyrasterT. cordata
Stem length (mm)0.000.020.84281.94 (±64.82) b399.90 (±91.42) a242.79 (±49.69) b353.50 (±74.51) a
Stem increment (mm)0.000.020.42117.44 (±62.65) b235.70 (±82.90) a65.86 (±37.06) c210.40 (±71.10) a
LA (mm2)0.000.000.0212,843.20 (±4810.70) b51,364.80 (±10,898.80) a8340.84 (±2732.16) c37,860.00 (±9278.79) d
SLA (mm2·mg−1)0.000.000.1817.76 (±2.23) b33.01 (±5.06) a15.53 (±2.22) c28.19 (±5.04) d
DWL (mg)0.000.010.74723.78 (±256.67) b1594.65 (±423.24) a544.57 (±183.86) c1364.20 (±332.04) a
SDW (mg)0.000.000.011134.83 (±469.02) b2357.10 (±779.90) a979.21 (±369.60) b1542.45 (±397.21) c
DWS (mg)0.000.000.081858.61 (±710.76) b3951.75 (±1185.07) a1523.79 (±505.60) b2906.65 (±709.21) c
RBI (%)0.010.000.36123.80 (±67.41) b175.13 (±70.47) a54.87 (±37.68) c80.49 (±45.98) c
FWS (mg)0.000.000.004218.50 (±1628.89) a11,942.20 (±3353.35) b3201.21 (±1059.03) a7386.70 (±1866.87) c
FWR (mg)0.000.000.003588.11 (±1241.37) a8170.40 (±2945.84) c3083.79 (±1127.77) a4164.90 (±885.26) a
RL (mm)0.000.000.007826.26 (±1925.41) a19,607.50 (±4212.76) b8439.39 (±3935.52) ac10,326.20 (±1812.39) c
SRL (mm·mg−1)0.000.910.305.81 (±1.58) b8.10 (±2.54) a6.45 (±3.10) ab7.59 (±2.05) a
DWR (mg)0.000.000.001405.33 (±420.96) b2650.30 (±928.65) a1377.79 (±511.18) b1429.55 (±331.48) b
RSA (mm2)0.000.000.0011,224.10 (±2955.99) b25,545.90 (±6564.05) a8812.52 (±3580.33) c13,677.80 (±2451.54) d
ARD (mm)0.130.000.000.54 (±0.06) a0.49 (±0.06) b0.40 (±0.06) c0.49 (±0.04) b
NRT0.000.000.002044.78 (±710.42) b7375.80 (±2502.22) a2742.93 (±1178.07) c3923.70 (±976.10) d
RV (mm3)0.000.000.004981.76 (±1804.35) b12,760.70 (±4552.20) a3386.21 (±1260.69) c5919.14 (±1548.73) b
R:S0.000.930.000.83 (±0.22) a0.68 (±0.16) b1.00 (±0.42) a0.50 (±0.09) c
T—taxon; S—salt treatment; T × S—interaction between the taxon and salt treatment; LA—leaf area; SLA—specific leaf area; DWL—dry mass of leaves; SDW—dry mass of the stem; DWS—dry mass of shoots; RBI—relative biomass increment; FWS—fresh mass of shoots; FWR—fresh mass of roots; RL—root length; SRL—specific root length; DWR—dry mass of roots; RSA—root surface area; ARD—average root diameter; NRT—number of root tips; RV—root volume; R:S—root to shoot mass ratio.
Table 3. The contents of photosynthetic pigments in the leaves of P. pyraster and T. cordata seedlings after 50 days of salt treatment. Mean values followed by different letters are significantly different.
p-ValueControl100 mM NaCl
ParameterTST × SP. pyrasterT. cordataP. pyrasterT. cordata
Chl a (mg·mm−2)0.000.040.02378.15 (±78.82) a289.94 (±41.93) b380.93 (±87.60) a221.22 (±45.92) c
Chl b (mg·mm−2)0.000.020.05145.29 (±34.35) a122.54 (±16.31) b143.13 (±32.20) a95.52 (±19.79) c
Chl ab (mg·mm−2)0.000.030.03523.31 (±112.26) a412.37 (±57.72) b523.92 (±117.65) a316.67 (±65.38) c
Chl a/b (mg·mm−2)0.000.960.252.62 (±0.14) a2.37 (±0.10) b2.66 (±0.29) a2.32 (±0.11) b
Carotenoids (mg·mm−2)0.000.620.22109.79 (±19.55) a83.78 (±11.82) b112.87 (±23.30) a76.63 (±14.00) b
T—taxon; S—salt treatment; T × S—interaction between the taxon and salt treatment.
Table 4. The parameters of leaf gas exchange in the leaves of P. pyraster and T. cordata seedlings after 50 days of salt treatment (n = 5). Mean values followed by different letters are significantly different.
CSI
(mL Plant−1)
DOT
Parameterp-ValueP. pyrasterT. cordata
TST × SControl100 mM NaClControl100 mM NaCl
155gs (mmol H2O m−2 s−1)0.060.000.5383.00 (±19.65) a46.80 (±14.60) bc69.50 (±4.95) ac21.50 (±0.71) b
20thAn (μmol CO2 m−2 s−1)0.850.340.134.66 (±1.17) a4.36 (±0.57) a4.00 (±0.44) a5.20 (±0.42) a
E (mmol H2O m−2 s−1)0.220.010.480.73 (±0.23) a0.44 (±0.13) b0.67 (±0.24) ab0.23 (±0.01) b
WUE (mmol CO2 mol−1 H2O)0.000.000.007.11 (±3.15) a8.61 (±1.23) a6.61 (±2.55) a22.60 (±0.46) b
225gs (mmol H2O m−2 s−1)0.000.000.38144.60 (±24.11) a96.40 (±22.50) b59.25 (±15.35) c28.00 (±11.63) d
30thAn (μmol CO2 m−2 s−1)0.000.130.617.44 (±0.80) a6.98 (±0.39) a5.46 (±1.02) b4.56 (±1.31) b
E (mmol H2O m−2 s−1)0.000.020.511.16 (±0.15) a1.02 (±0.15) a0.65 (±0.18) b0.40 (±0.17) b
WUE (mmol CO2 mol−1 H2O)0.000.210.476.48 (±1.00) a6.96 (±0.87) a10.35 (±2.60) b12.07 (±2.36) b
295gs (mmol H2O m−2 s−1)0.000.000.90103.2 (±29.12) a69.25 (±27.11) ab61.89 (±23.18) b25.40 (±14.72) c
40thAn (μmol CO2 m−2 s−1)0.000.640.367.62 (±0.70) a7.06 (±1.18) a5.71 (±1.03) b4.13 (±2.05) b
E (mmol H2O m−2 s−1)0.010.000.370.74 (±0.16) a0.56 (±0.20) a0.58 (±0.19) a0.27 (±0.12) b
WUE (mmol CO2 mol−1 H2O)0.740.030.6310.79 (±2.59) ab13.35 (±4.48) ab10.55 (±3.02) a14.51 (±3.83) b
365gs (mmol H2O m−2 s−1)0.000.210.80115.00 (±30.22) a101.80 (±39.06) a56.57 (±25.05) b37.00 (±8.79) b
50thAn (μmol CO2 m−2 s−1)0.000.060.427.36 (±0.82) a6.86 (±1.21) a5.11 (±0.74) b3.95 (±0.85) c
E (mmol H2O m−2 s−1)0.000.270.930.87 (±0.17) a0.79 (±0.22) ac0.53 (±0.19) bc0.43 (±0.13) b
WUE (mmol CO2 mol−1 H2O)0.350.750.968.47 (±1.62) a8.91 (±0.91) a9.66 (±3.05) a9.98 (±3.47) a
DOT—day of treatment; CSI—cumulative NaCl intake per plant; T—taxon; S—salt treatment; T × S—interaction between the taxon and salt treatment; An—net assimilation rate; E—transpiration rate; gs—stomatal conductance to water vapor; WUE—water use efficiency.
Publisher’s Note: MDPI stays neutral with regard to jurisdictional claims in published maps and institutional affiliations.

