Abstract
Insufficient light supply for canopies is a constant issue during greenhouse production in most areas of Northern China. Applying supplemental lighting to plant canopies is an efficient method of solving this problem. Several studies were conducted to identify the optimal, economically efficient abaxial leafy supplemental lighting mode to produce high-quality greenhouse tomatoes. In this experiment, no supplemental treatment was used as a blank control (CK), while three supplemental lighting modes were used as treatments: T1, continuous supplemental lighting from 8:00–9:00 (at GMT+8, which is 6:00–7:00 local time, before the thermal insulation covers, abbreviated as TIC below, opening), and 20:00–22:00 (after TIC closing) with photosynthetic photon fluxion density (PPFD) of 200 μmol·m−2·s−1; T2, dynamic altered supplemental lighting with PPFD rising from 100 μmol·m−2·s−1 to 200 μmol·m−2·s−1 before TIC opening and falling from 200 μmol·m−2·s−1 to 100 μmol·m−2·s−1 after TIC closing; and T3, intermittent supplemental lighting which was automatically conducted with PPFD of 100 μmol·m−2·s−1 when indoor PPFD below 150 μmol·m−2·s−1 from 8:00–22:00. The results demonstrated that abaxial leafy supplemental lighting treatment could improve both fruit yield and quality. The total yield in the T1 and T2 treatments was higher than in other treatments, though there was no significant difference. Differences in leaf carbon exportation showed the possibility of determining fruit yield from the 3rd leaf under the fruit. The overall appearance, flavor quality, nutrient indicators, and aroma of cherry tomato fruits under T1 and T2 treatments were generally higher than in other treatments. Correlation analysis of fruit yield and quality parameters suggested that they produce relatively high yield and fruit quality. Combined with a cost-performance analysis, dynamic altered supplemental lighting (T2) is more suitable for high-valued greenhouse cherry tomato production.
1. Introduction
Light makes it possible for plants to conduct photosynthesis and generate energy and also triggers numerous physiological processes, such as seed germination [1,2], leaf development [3,4], flowering [5,6], stomatal regulation [7,8], and membrane transport of cells [9]. All of this extensively regulates the growth and development of plants and determines greenhouse crop productivity. However, insufficient canopy lighting during greenhouse production often occurs to recurring snowy or rainy weather during winter and early spring in most Northern China areas. In Southern Xinjiang, this problem is even more serious in the early spring due to the prevalence of sand and dust, which leads to low-light stress. Low-light stress usually causes low temperatures and high humidity indoors, which decreases tomato yield and quality and frequently causes diseases.
Supplemental lighting is an artificial light resource that is applied to plant canopies and is considered an efficient method of solving the problem of indoor light insufficiency. Numerous studies have been conducted on the canopy layer [10,11], light source [12], light intensity [13,14], and light period [15] to assess the effects of supplemental lighting. At the same time, studies on light and other environmental factors [16,17,18,19] have recently become a popular research topic. Research on effective positioning of supplemental lighting is increasing, and selecting an efficient irradiated surface of the functional blade is a good starting point [14,20,21,22,23,24]. These results demonstrate that abaxial leafy supplemental lighting can significantly improve the photosynthetic efficiency of leaves, improve the yield and quality of tomato fruit, and produce higher economic returns.
However, previous research on abaxial leafy supplemental lighting has primarily focused on tomato yield, while the fruit quality only involves limited indicators, such as soluble solids and ascorbic acid. Only a few experimental results have assessed fruit volatile matter contents. In [24], the researcher found that a relatively high PPFD abaxial leafy supplemental lighting mode (before TIC opening and after TIC closing) could improve the total content of aromatic components in common tomatoes [24]. As the high-end consumer market has rapidly developed, cherry tomatoes, with their attractive appearance, unique flavor, and tempting aroma, have become popular and produced higher profits for greenhouse growers [25]. Therefore, it is important to explore methods of increasing the quality of cherry tomatoes and implementing economically efficient abaxial leafy supplemental lighting, which produces high-quality fruit. Therefore, this study systematically investigates and outlines how different intensities and times of abaxial leafy supplemental lighting affect tomato quality, including appearance indicators, nutritional parameters, flavor indexes, and aromatic contents.
2. Materials and Methods
2.1. Plant Material and Growth Conditions
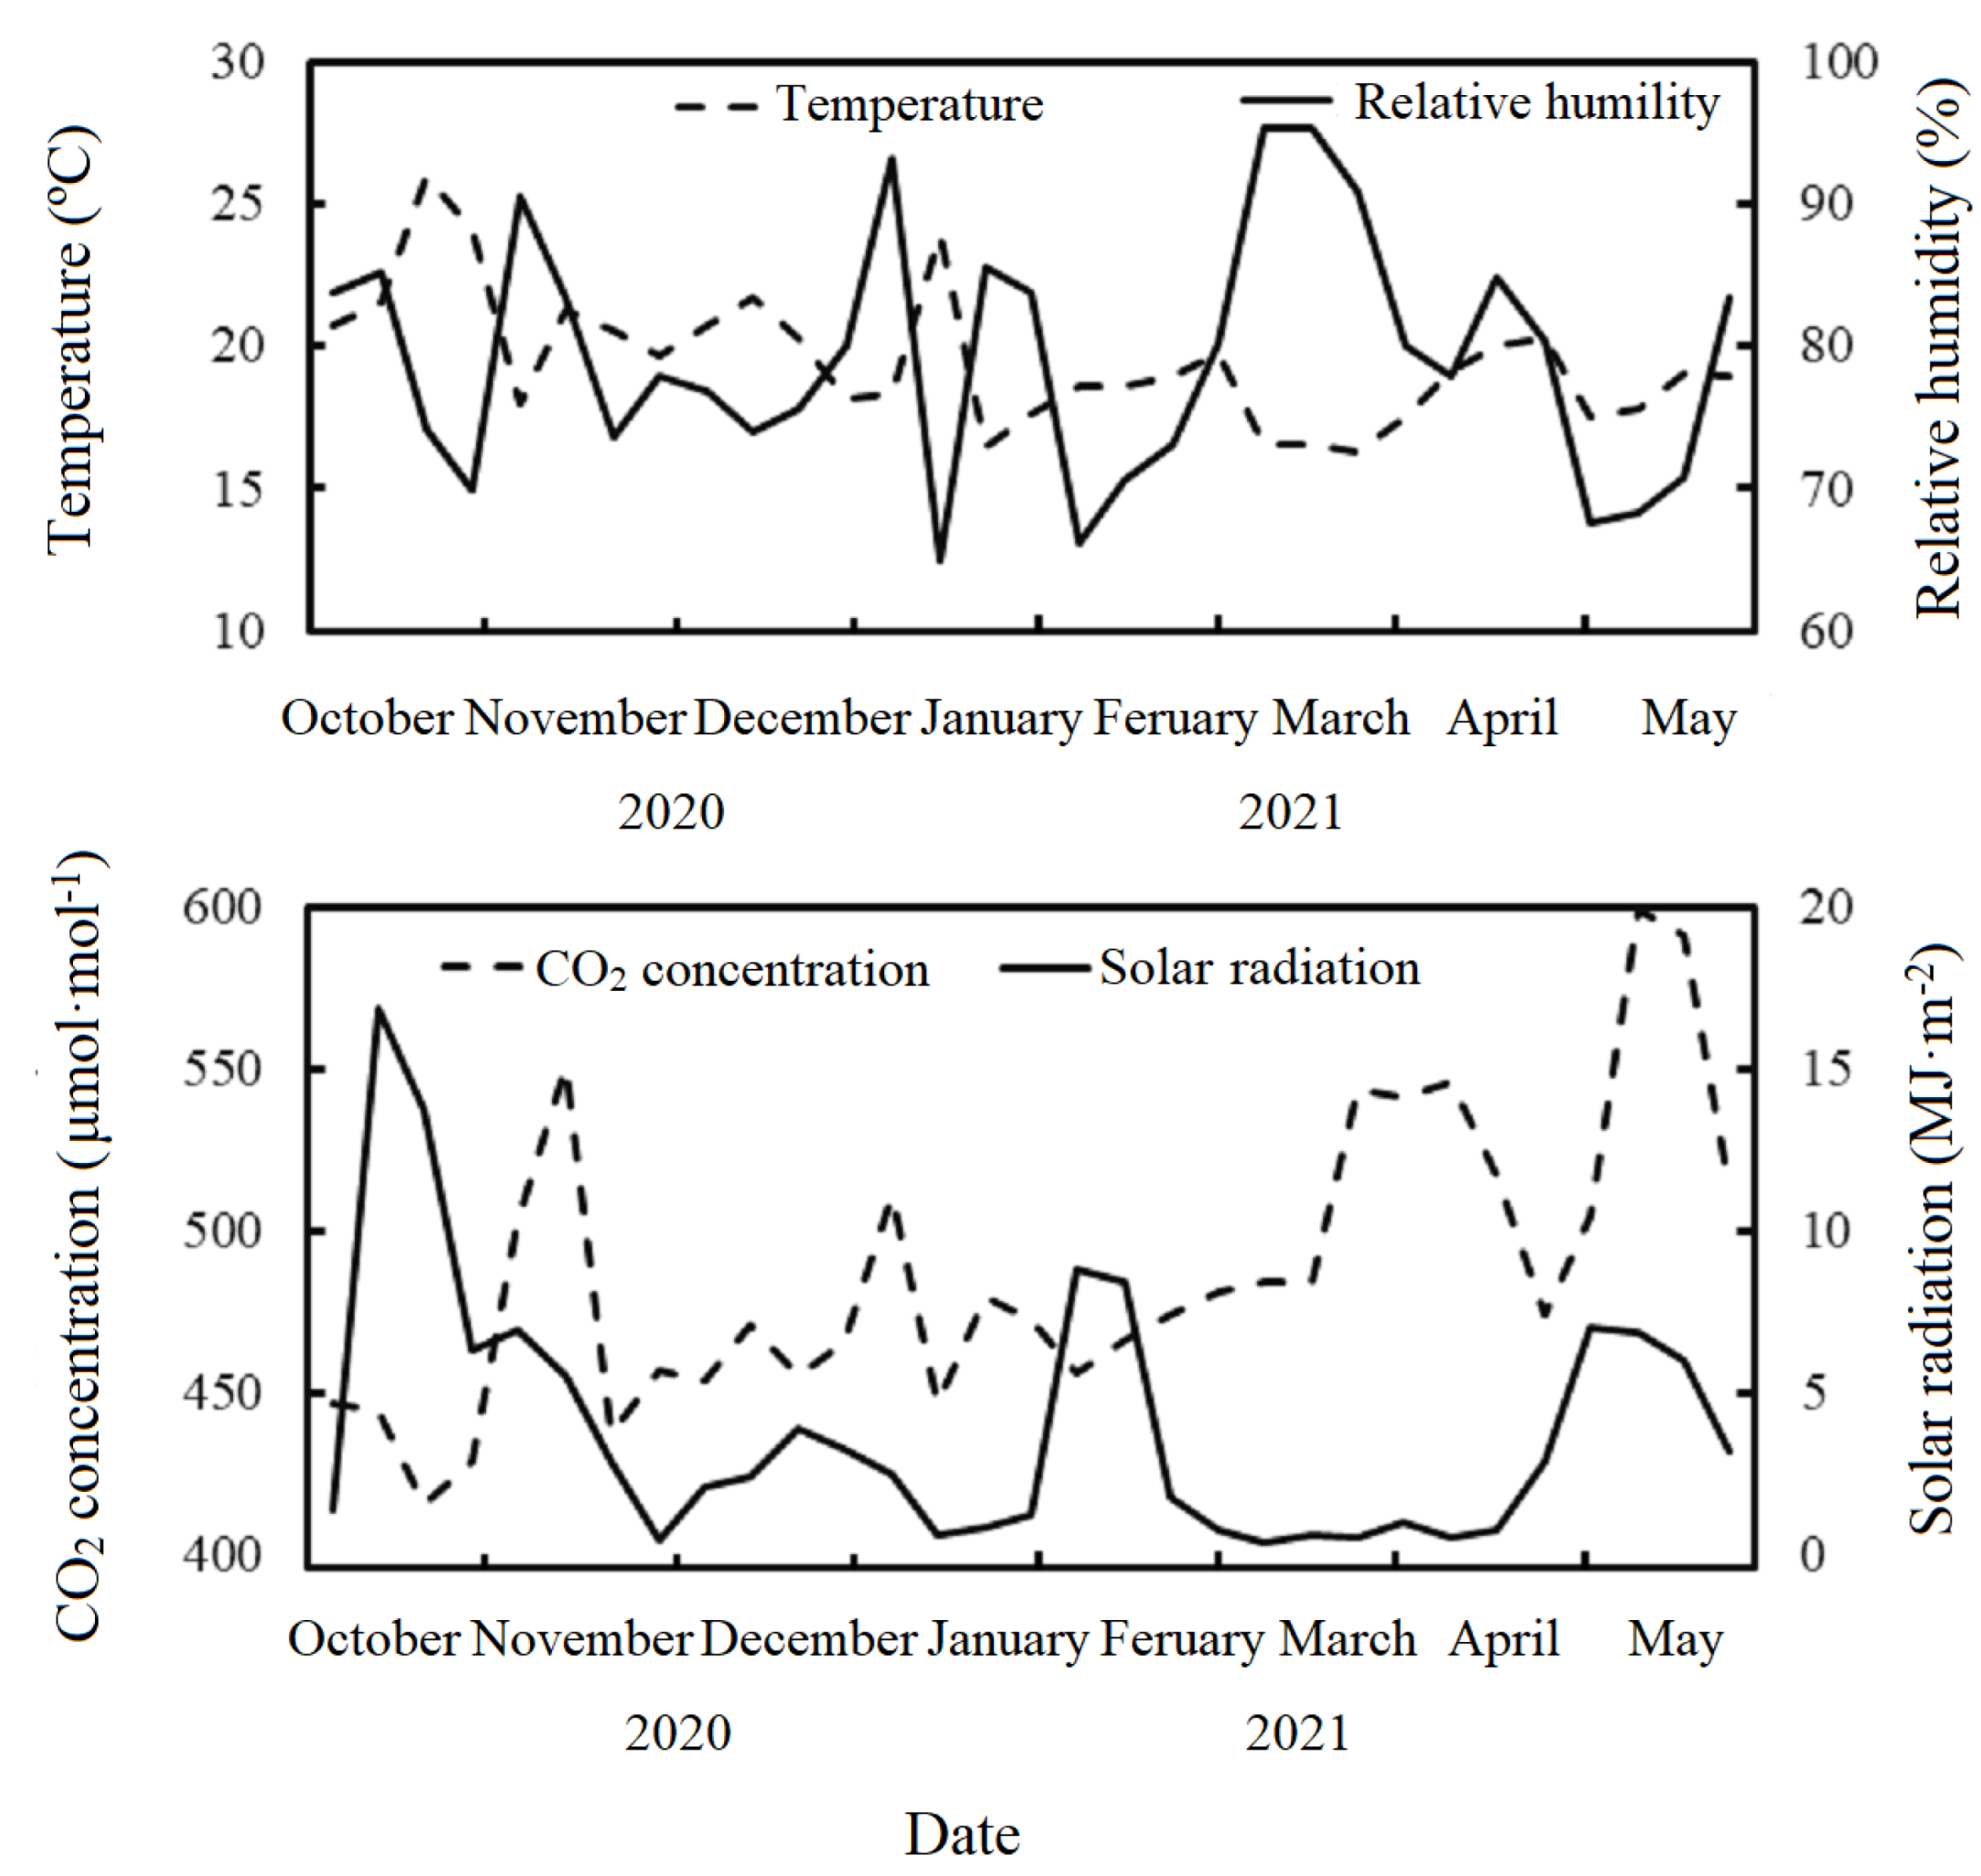
Tomato plants (‘Meiying’, Institute of Vegetables and Flowers, China Academy of Agricultural Science, Beijing, China) were substrate cultivated (Peilei No. 2, Peile Organic Fertilizer Co., Zhenjiang, China) in a Venlo-type intelligently controlled greenhouse in Atushi City, Xinjiang, China (39°43′48″ N, 76°7′12″ E) from October 2020 to May 2021. Seeds were sown in plug trays filled with the same substrate and germinated in a germination-nursery greenhouse for 24 days (3 days in warm darkness and 21 days in a nursery chamber with environment parameters described in Jiang et al., 2017) [21]. Plants were transplanted at a density of 12 plants ·m−2, and the variation of the thermal environment index is shown in Figure 1. During the experiment, the daily indoor amount of solar radiation was typically below 10 MJ·m−2, except for October. Air conditioners were used to maintain the thermal environment, making the average daily air temperature around 18–25 °C, while the daily mean relative humidity was kept above 65%, and the CO2 concentration was 400–600 μmol·mol−1.
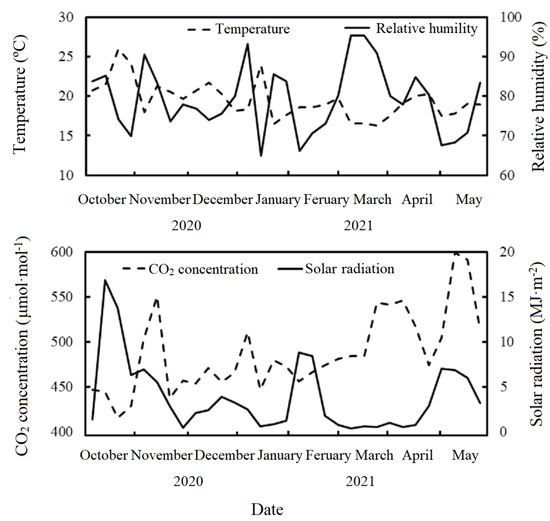
Figure 1.
Variation in daily mean air temperature, relative humidity, CO2 concentration, and integral amount of solar radiation inside the greenhouse from October 2020 to May 2021.
Each treatment included 2 rows and 40 plants, while 1 row and 20 plants mutually settled to avoid inter-group interference in each experimental area. In contrast, 66 plants were set at the boundary to prevent boundary effects. A total of 3 replicate test areas were used.
2.2. Supplemental Lighting Treatment
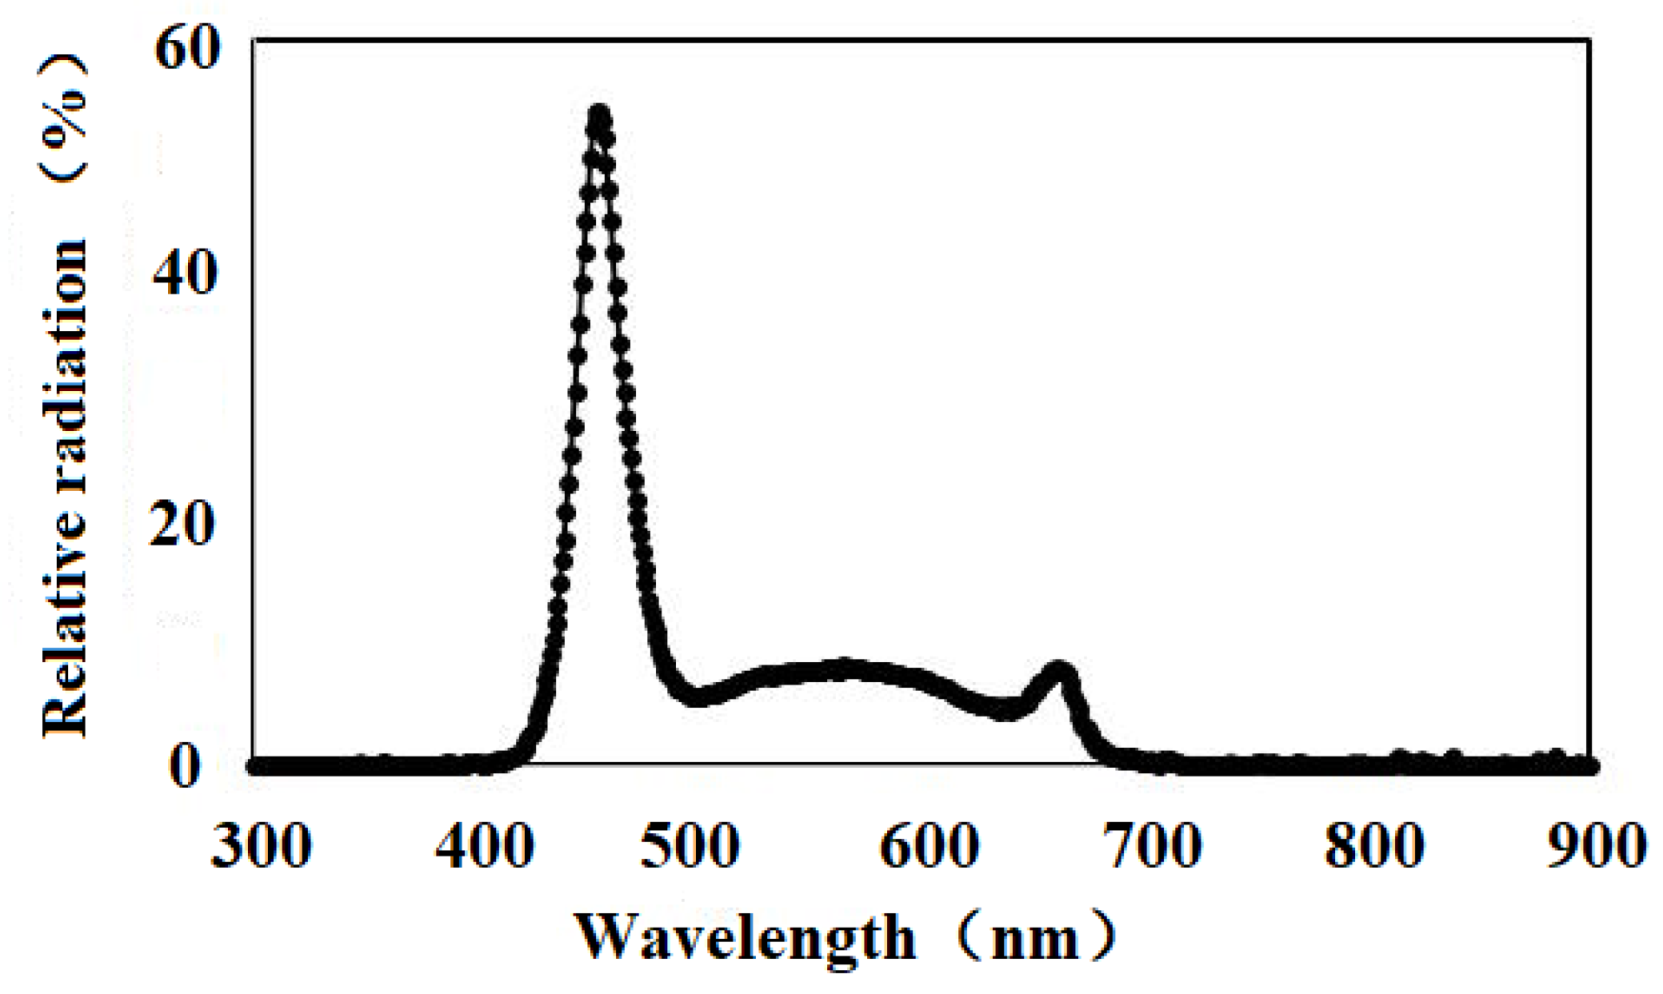
Light-emitting diodes (LEDs; Chenhua lighting Co. Ltd., Guangzhou, China), with a light wavelength of white (W, all wavelength), red (R, peak 635 nm), blue (B, peak 480 nm) were applied at a ratio of 3:2:1 (Figure 2). Lighting began from the fruit setting to the mature green stage [24] and was orientated from underneath the canopy and maintained 10 cm away from the abaxial epidermis of the lowest functional leaf [21]. A no-supplement treatment was used as a blank control (CK), while three supplemental lighting mode treatments were used (Table 1). The lighting system, linked with a time and a TIC time module, was operated automatically from late November 2020 to early April 2021.
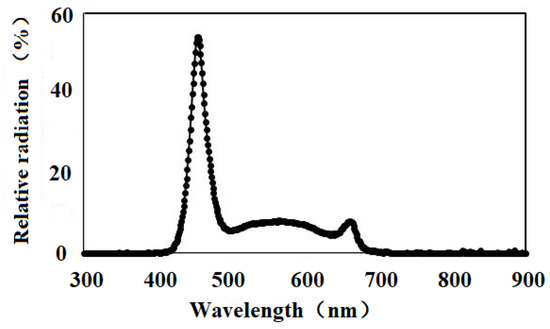
Figure 2.
Relative spectral photon flux of polychromatic LEDs was used for the supplemental lighting treatment in this experiment. The wavelengths of the light sources were recorded at 240–800 nm with a spectrometer (SR9910-v7, Irradiant Ltd., Tranent, UK). A digital timer, dimmer, and transformer were used to maintain the light period and light intensity.

Table 1.
The arrangement of different abaxial leafy supplemental lighting treatments.
2.3. Fruit Yield and Carbon Sequestration Analyses
The fresh weight of each fruit truss was measured to calculate the total yield, while 15 fruit trusses treatment-1 were used for dry weight determination. Plant 13C feeding treatment was conducted on the 15th day when the third fruit truss began lighting treatments for 3 h [14]. Three plants were randomly selected from each treatment for sampling, which was repeated 3 times. The 13C content in the fruit and the 1st to 3rd leaves under the fruit [14] were analyzed by a stable isotope ratio mass spectrometer (Integra CN, SerCon Ltd., Cheshire, UK).
2.4. Fruit Appearance and Flavor Quality Analyses
Fruit quality analyses were conducted on the third and fourth trusses [26], and 15 fruits with the same maturity were randomly selected from each treatment for overall appearance index analyses. The transverse and longitudinal diameters were measured with vernier calipers (605A-05, Harbin Measuring & Cutting Tools Group Co., Ltd., Harbin, China), and the fruit shape index was calculated by Formula (1). Tomato peel color, including peel lightness L*, peel red saturation a*, and peel yellow saturation b*, were determined with a color measuring instrument (YQ-Z-48A, Hangzhou Qingtong Boke Co., Hangzhou, China). The color saturation C and the chromaticity angle H were calculated using Formulas (2) and (3), respectively.
Fifteen fruits with the same maturity were randomly selected from each treatment, and the soluble solids content, acidity, and sugar–acid ratio of the tomato fruits were determined with a sugar–acid integrated machine (PAL-BXIACID3, ATAGO Co. Ltd., Tokyo, Japan); another 15 fruits with the same maturity were randomly selected for soluble sugar content determination using the anthrone colorimetric method [27].
2.5. Fruit Nutrient and Function Indicator Analyses
Fifteen fruits with the same maturity were randomly selected from each treatment, and the content of soluble protein in the tomato fruit was determined using the Coomassie brilliant blue method. In contrast, the ascorbic acid content was determined by the molybdenum blue colorimetric method [27]. The lycopene content was determined by the spectrophotometric method [28], and the nitrate–nitrogen content was determined by the salicylic acid colorimetric method [27].
2.6. Fruit Aromatic Substances Analyses
Fifteen fruits with the same maturity were randomly selected from each treatment, and a gas chromatography-mass spectrometry (ISQ 7000 GC-MS, Thermo Fisher Scientific. In. Co. Ltd., Waltham, MA, USA) was used to determine the volatile substances. The volatile substances in each fruit were calculated using a standard internal method with Formula (4).
2.7. Economic Performance Analyses
Each lighting treatment was applied with an ammeter to determine the electricity consumption. Electricity efficiency (kg·kWh−1) and cost performance (return/cost) were calculated with Formulas (5) and (6). The average wholesale price of common cherry tomatoes was 10 CNY·kg−1, (January to May 2021, Urumqi Wholesale Market), and the electricity unit price was 0.186 CNY·kWh−1 (electricity for agricultural usage, State Grid Xinjiang Electric Power Co. Ltd., Xinjiang, China). Each LED unit covered 1 m2, and the purchase prices were 75 CNY·unit−1 (100 μmol·m−2·s−1) and 95 CNY·unit−1(200 μmol·m−2·s−1), with a theoretical service life of 50,000 h.
The simplified calculation of LED input cost = (LED purchase price × usage time) / (lighting range × product life)
2.8. Statistical Analyses
Statistical software (SPSS 11.0, SPSS Inc., Chicago, IL, USA) was used for all analyses. Mean separations were conducted using a Tukey’s HSD test protected by ANOVA (analysis of variance) at p < 0.05.
3. Results
3.1. Fruit Yield and Carbon Sequestration of Function Leaves
Table 2 shows that the abaxial leafy supplemental lighting treatments could significantly enhance the fruit yield. There was a similar trend in the fresh weight of single fruit and the fresh weight of single fruit trusses; the highest appeared in T2. However, the total yield in the T1 and T2 treatments was higher than in other treatments, although there was no significant difference between these two.
Table 2.
Effects of different abaxial leafy supplemental lighting treatments on fruit yield of cherry tomato.
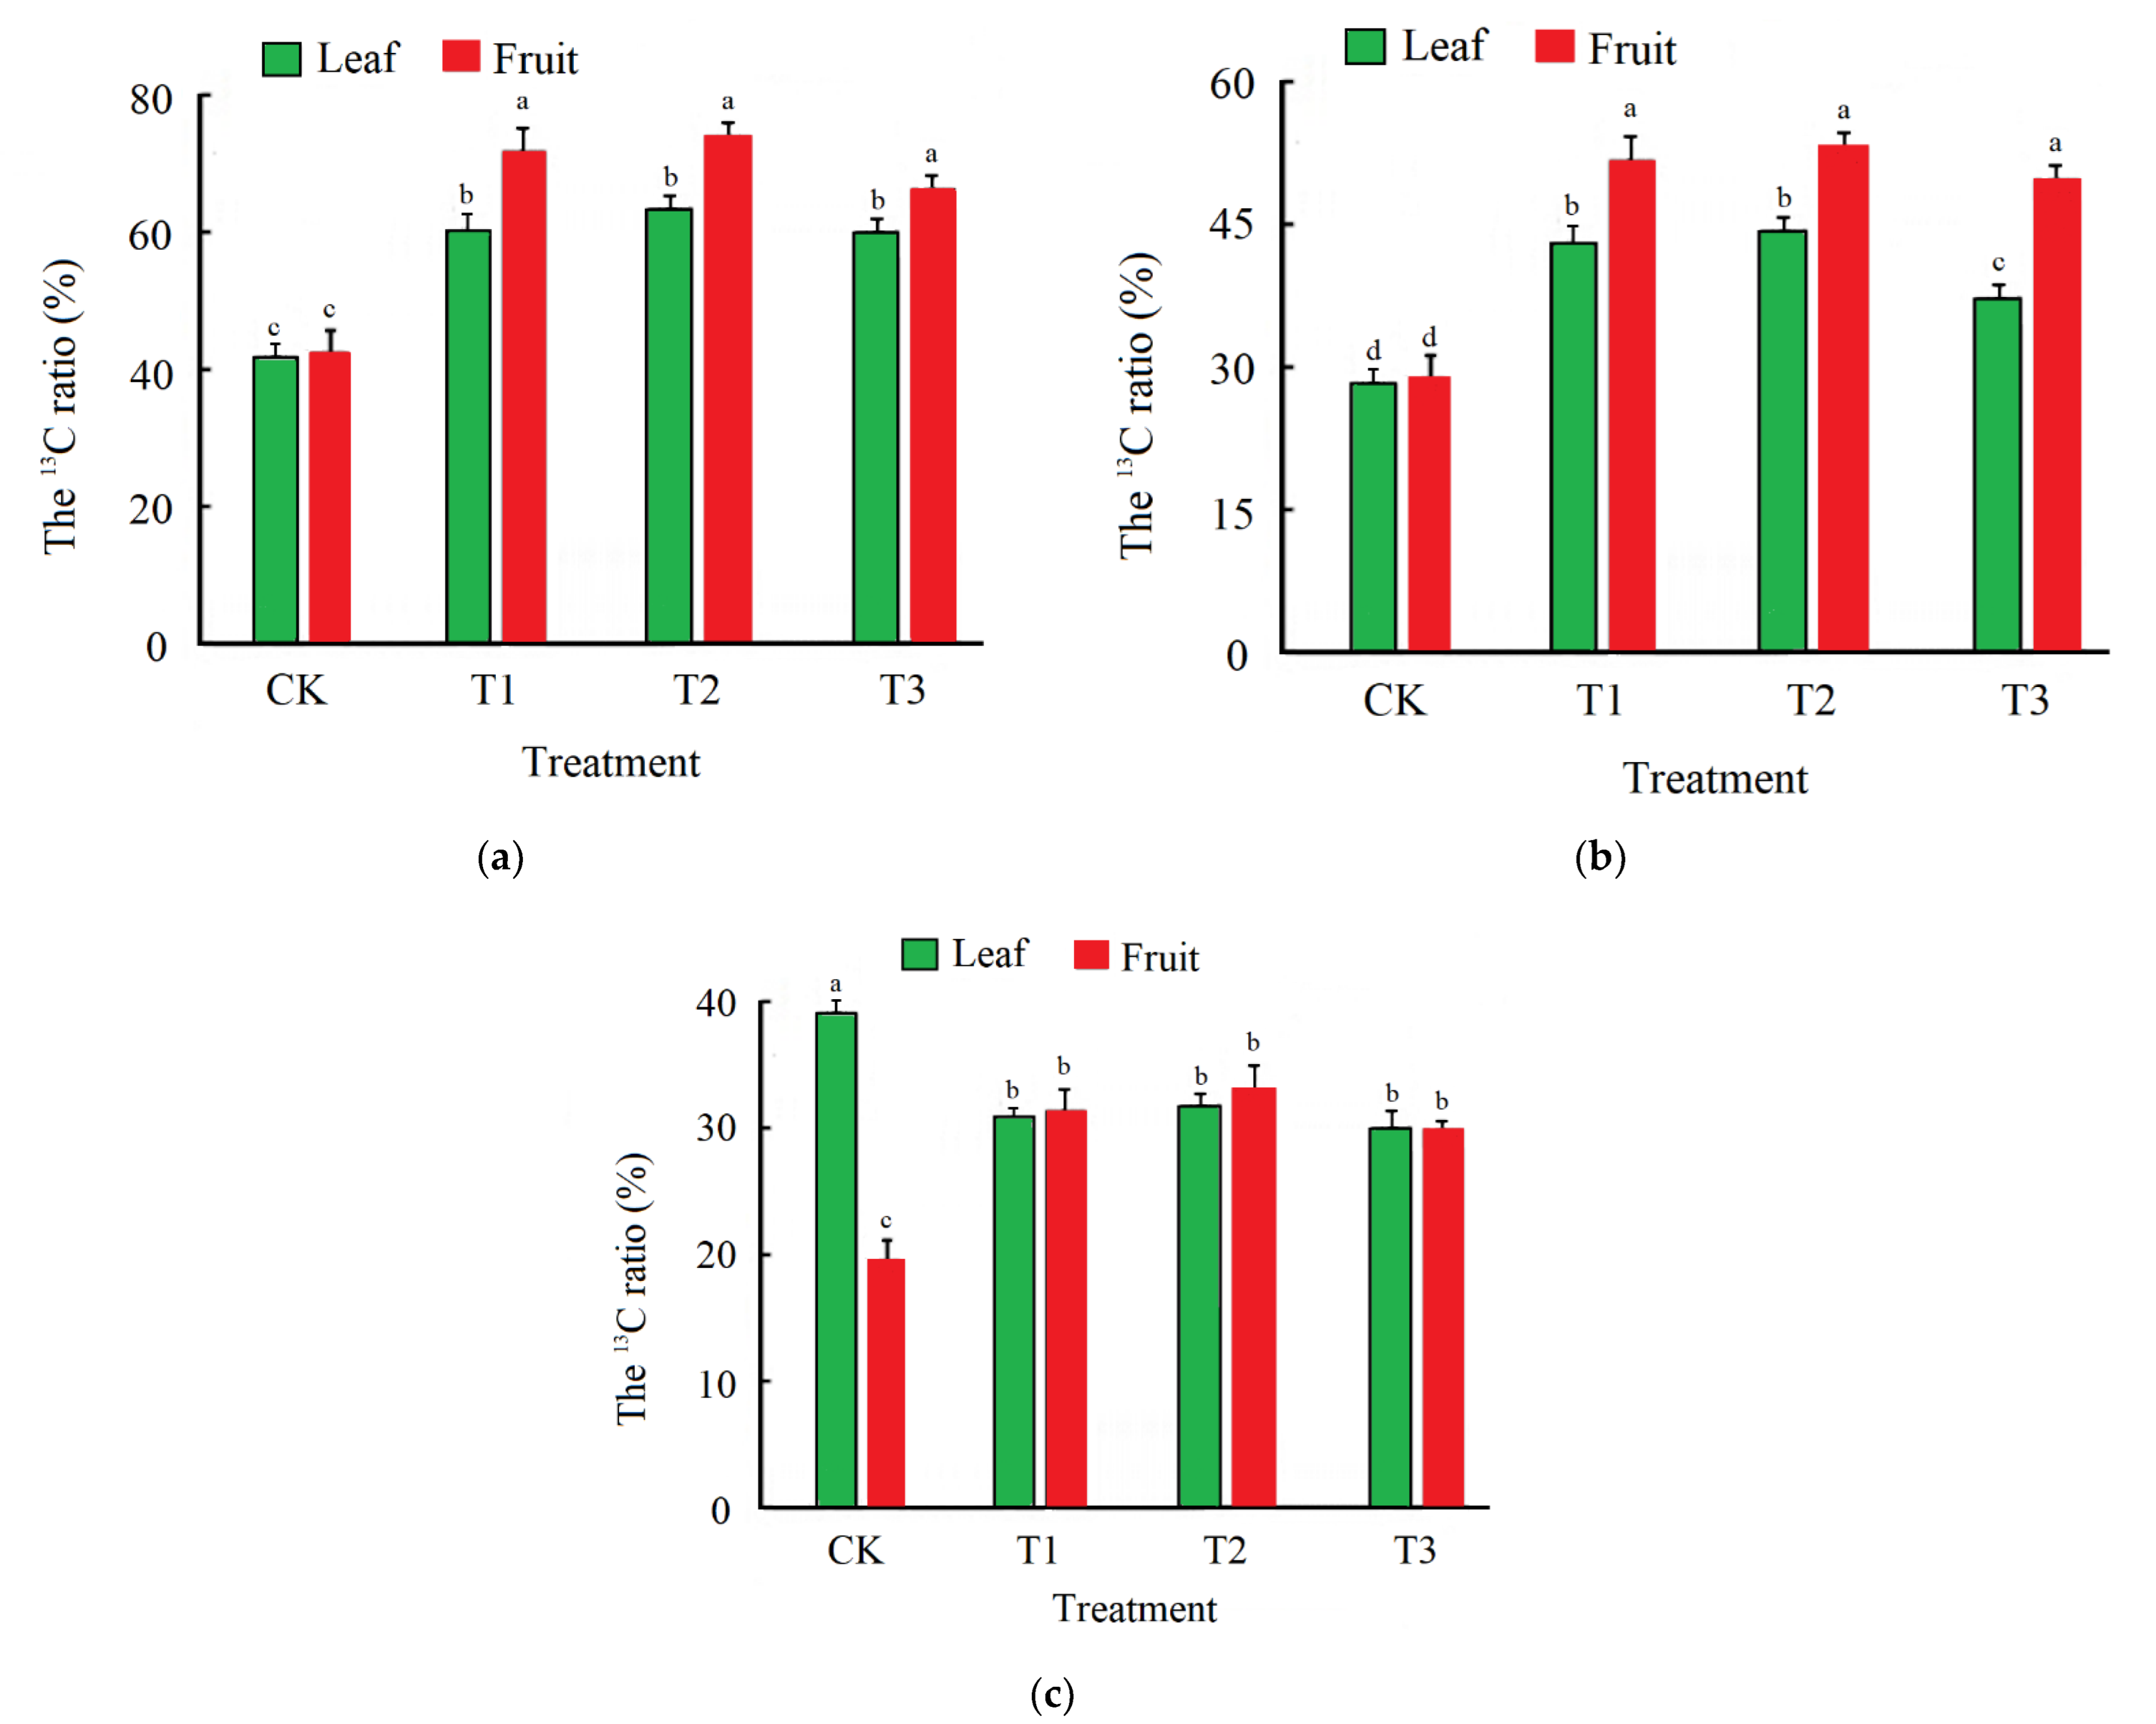
The 3 leaves under the fruit were used as the 13C carbon source to evaluate the contribution to fruit material accumulation of the leaves. The distribution patterns of exported 13C in fruit fixed by different source leaves showed that, except for the 3rd leaf under the fruit, the fixed 13C exported 15.3% more to the fruit than remained in the leaf (Figure 3). When the 3rd leaf under the fruit was treated as a 13C source leaf, the values of the 13C ratio in leaf or fruit were lower than the 1st and 2nd source leaves. Data on fixed 13C remaining in plant leaves under CK treatment were significantly higher than the others (Figure 3C).
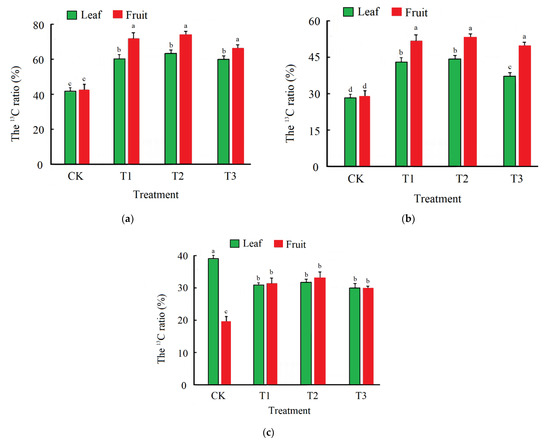
Figure 3.
Distribution patterns of exported 13C in fruit fixed by different source leaves. (a) The 1st leaf as 13C source leaf, (b) the 2nd leaf as 13C source leaf, and (c) the 3rd leaf as 13C source leaf. 13CO2 was applied to leaves for 3 h and left to sit for 48 h; the effect of photosynthetic products on fruit development was determined by a stable isotope ratio mass spectrometer. Tukey’s HSD test was used, and vertical bars represent standard errors of the means (n = 15). Different letters indicate significant differences at p < 0.05, according to Tukey’s HSD test.
3.2. Fruit Appearance Characters
Table 3 shows the effects of different abaxial leafy supplemental light treatments on the shape of the tomato fruit. Compared with CK, the transverse diameter of the fruit significantly extended as the supplemental light treatment was applied. However, there was no significant difference in the longitudinal diameter of the fruit among the treatments. The results of the fruit shape index calculation demonstrated that the value under the T1 treatment was the smallest, indicating that the tomato fruit under this treatment was oval-shaped, compared with other treatments.
Table 3.
Effect of different abaxial leafy supplemental lighting treatments on fruit shape of cherry tomato.
Abaxial leafy supplement lighting treatment could significantly improve the brightness of tomato fruit, the saturation of the red and yellow peel, and the C values of the peel, indicating that deep-colored fruits were produced under these treatments (Table 4). Though the H values were significantly higher in the T1 and T3 treatments, there was no significant difference between the T2 and the CK group.
Table 4.
Effect of different abaxial leafy supplemental lighting treatments on fruit color of cherry tomato.
3.3. Fruit Flavor Quality Analyses
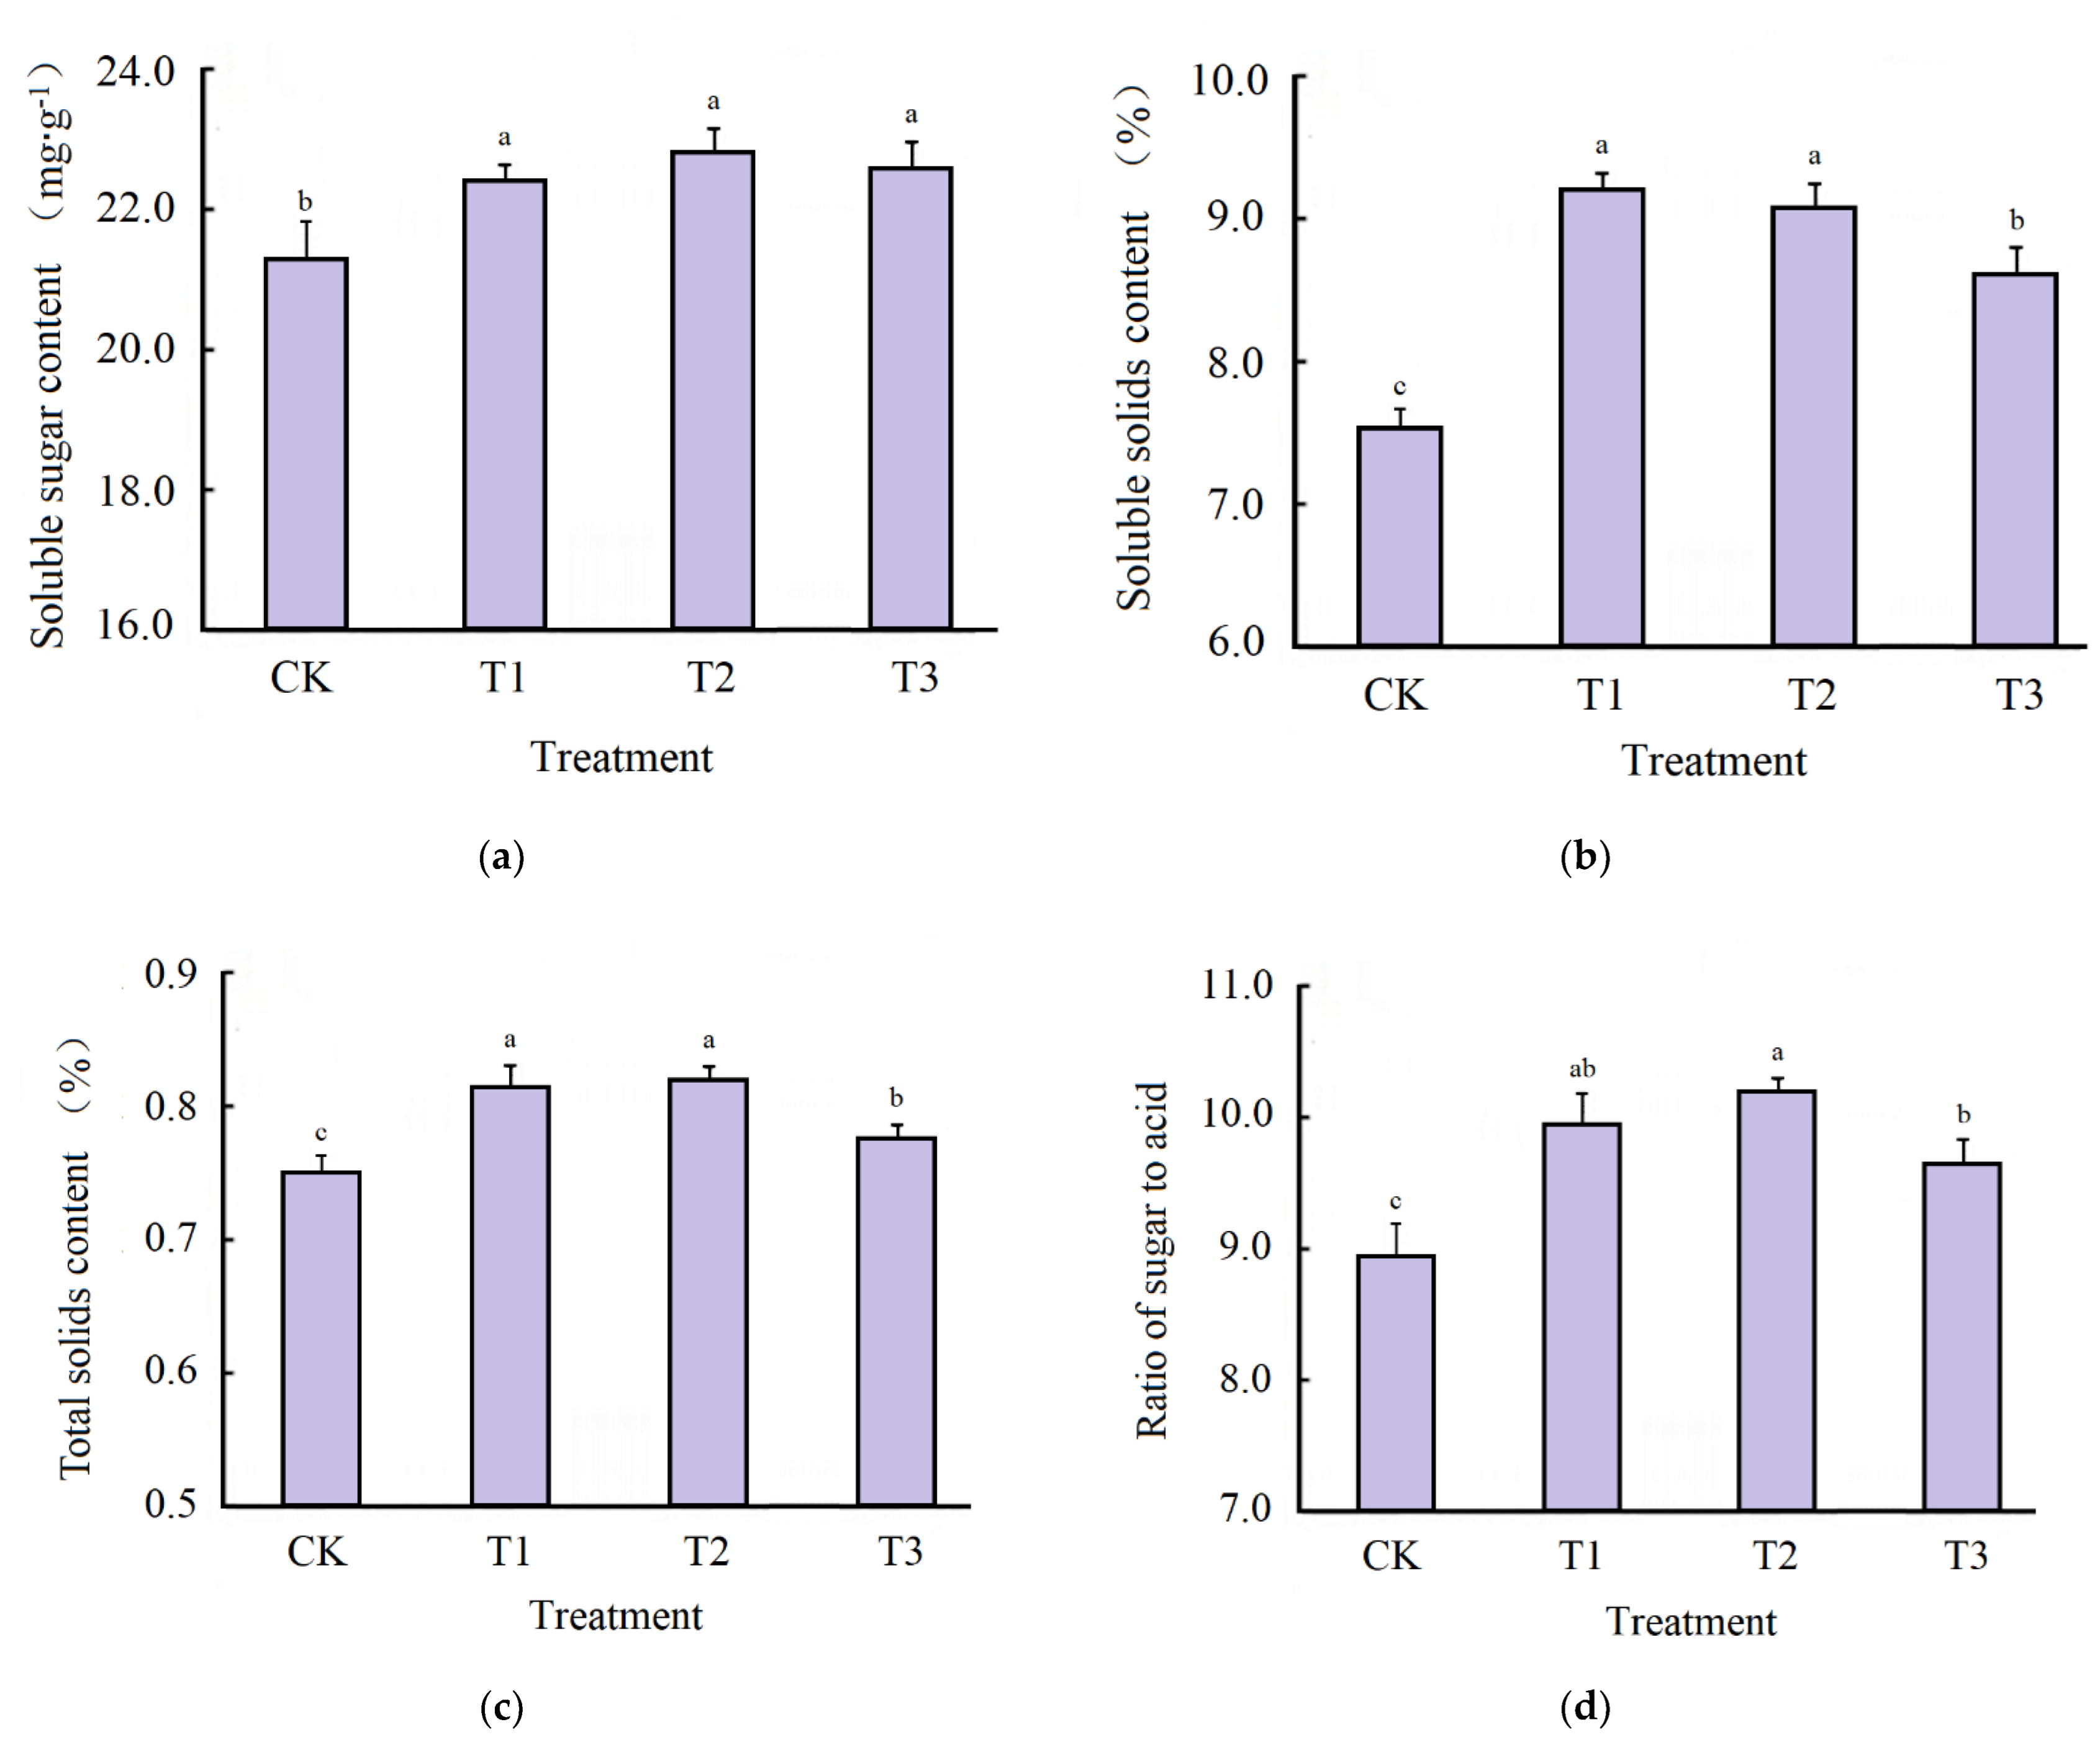
Figure 4 shows that the soluble sugar content in tomato plants under CK was significantly lower than under supplemental lighting treatments. The solid soluble content of tomato plants was highest under the T1 treatment, followed by the T2 and T3 treatments. Compared to CK treatment, the values of the T1, T2, and T3 treatments increased by 22.0%, 21.2% and 15.4%, respectively. A similar trend was observed in the contents of total acids and the ratio of sugar to acid in the fruit: the highest values were observed under the T1 and T2 treatments, while the CK treatment had the lowest values.
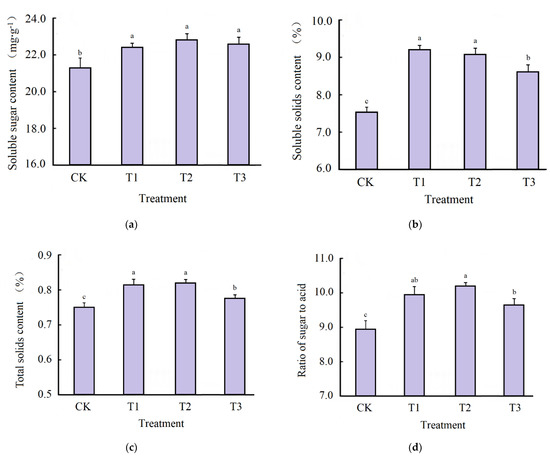
Figure 4.
Effect of different abaxial leafy supplemental lighting treatments on flavor quality of cherry tomato. (a) Soluble sugar; (b) soluble solids; (c) total acid; (d) ratio of sugar to acid. Tukey’s HSD test was used, and vertical bars represent standard errors of the means (n = 15). Different letters indicate significant differences at p < 0.05 according to Tukey’s HSD test.
3.4. Fruit Nutrient and Function Indicator Analyses
Abaxial leafy supplemental lighting treatments positively affected the fruit nutrient and function indicators. The highest value of soluble protein, ascorbic acid, and lycopene content was found in the T1 and T2 treatments, followed by the T3 treatment. Compared to the CK group, the nitrate–nitrogen content in fruits under T1, T2, and T3 treatments decreased by 42.8%, 44.1.3%, and 45.4%, respectively (Figure 5).
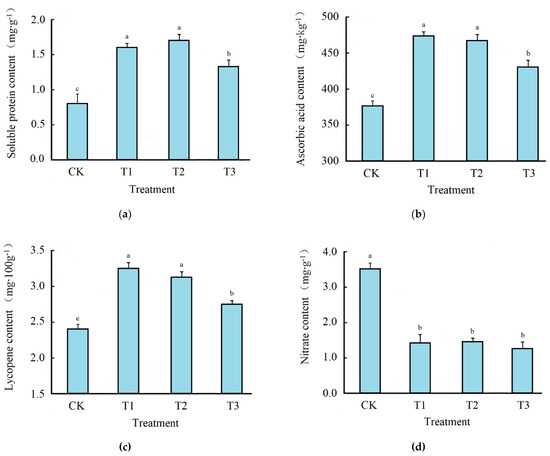
Figure 5.
Effect of different abaxial leafy supplemental lighting treatments on nutrient and function quality of cherry tomato. (a) Soluble protein; (b) ascorbic acid; (c) lycopene; (d) nitrate. Tukey’s HSD test was used, and vertical bars represent the standard error of the means (n = 15). Different letters indicate significant differences at p < 0.05 according to Tukey’s HSD test.
3.5. Fruit Aromatic Substances Analyses
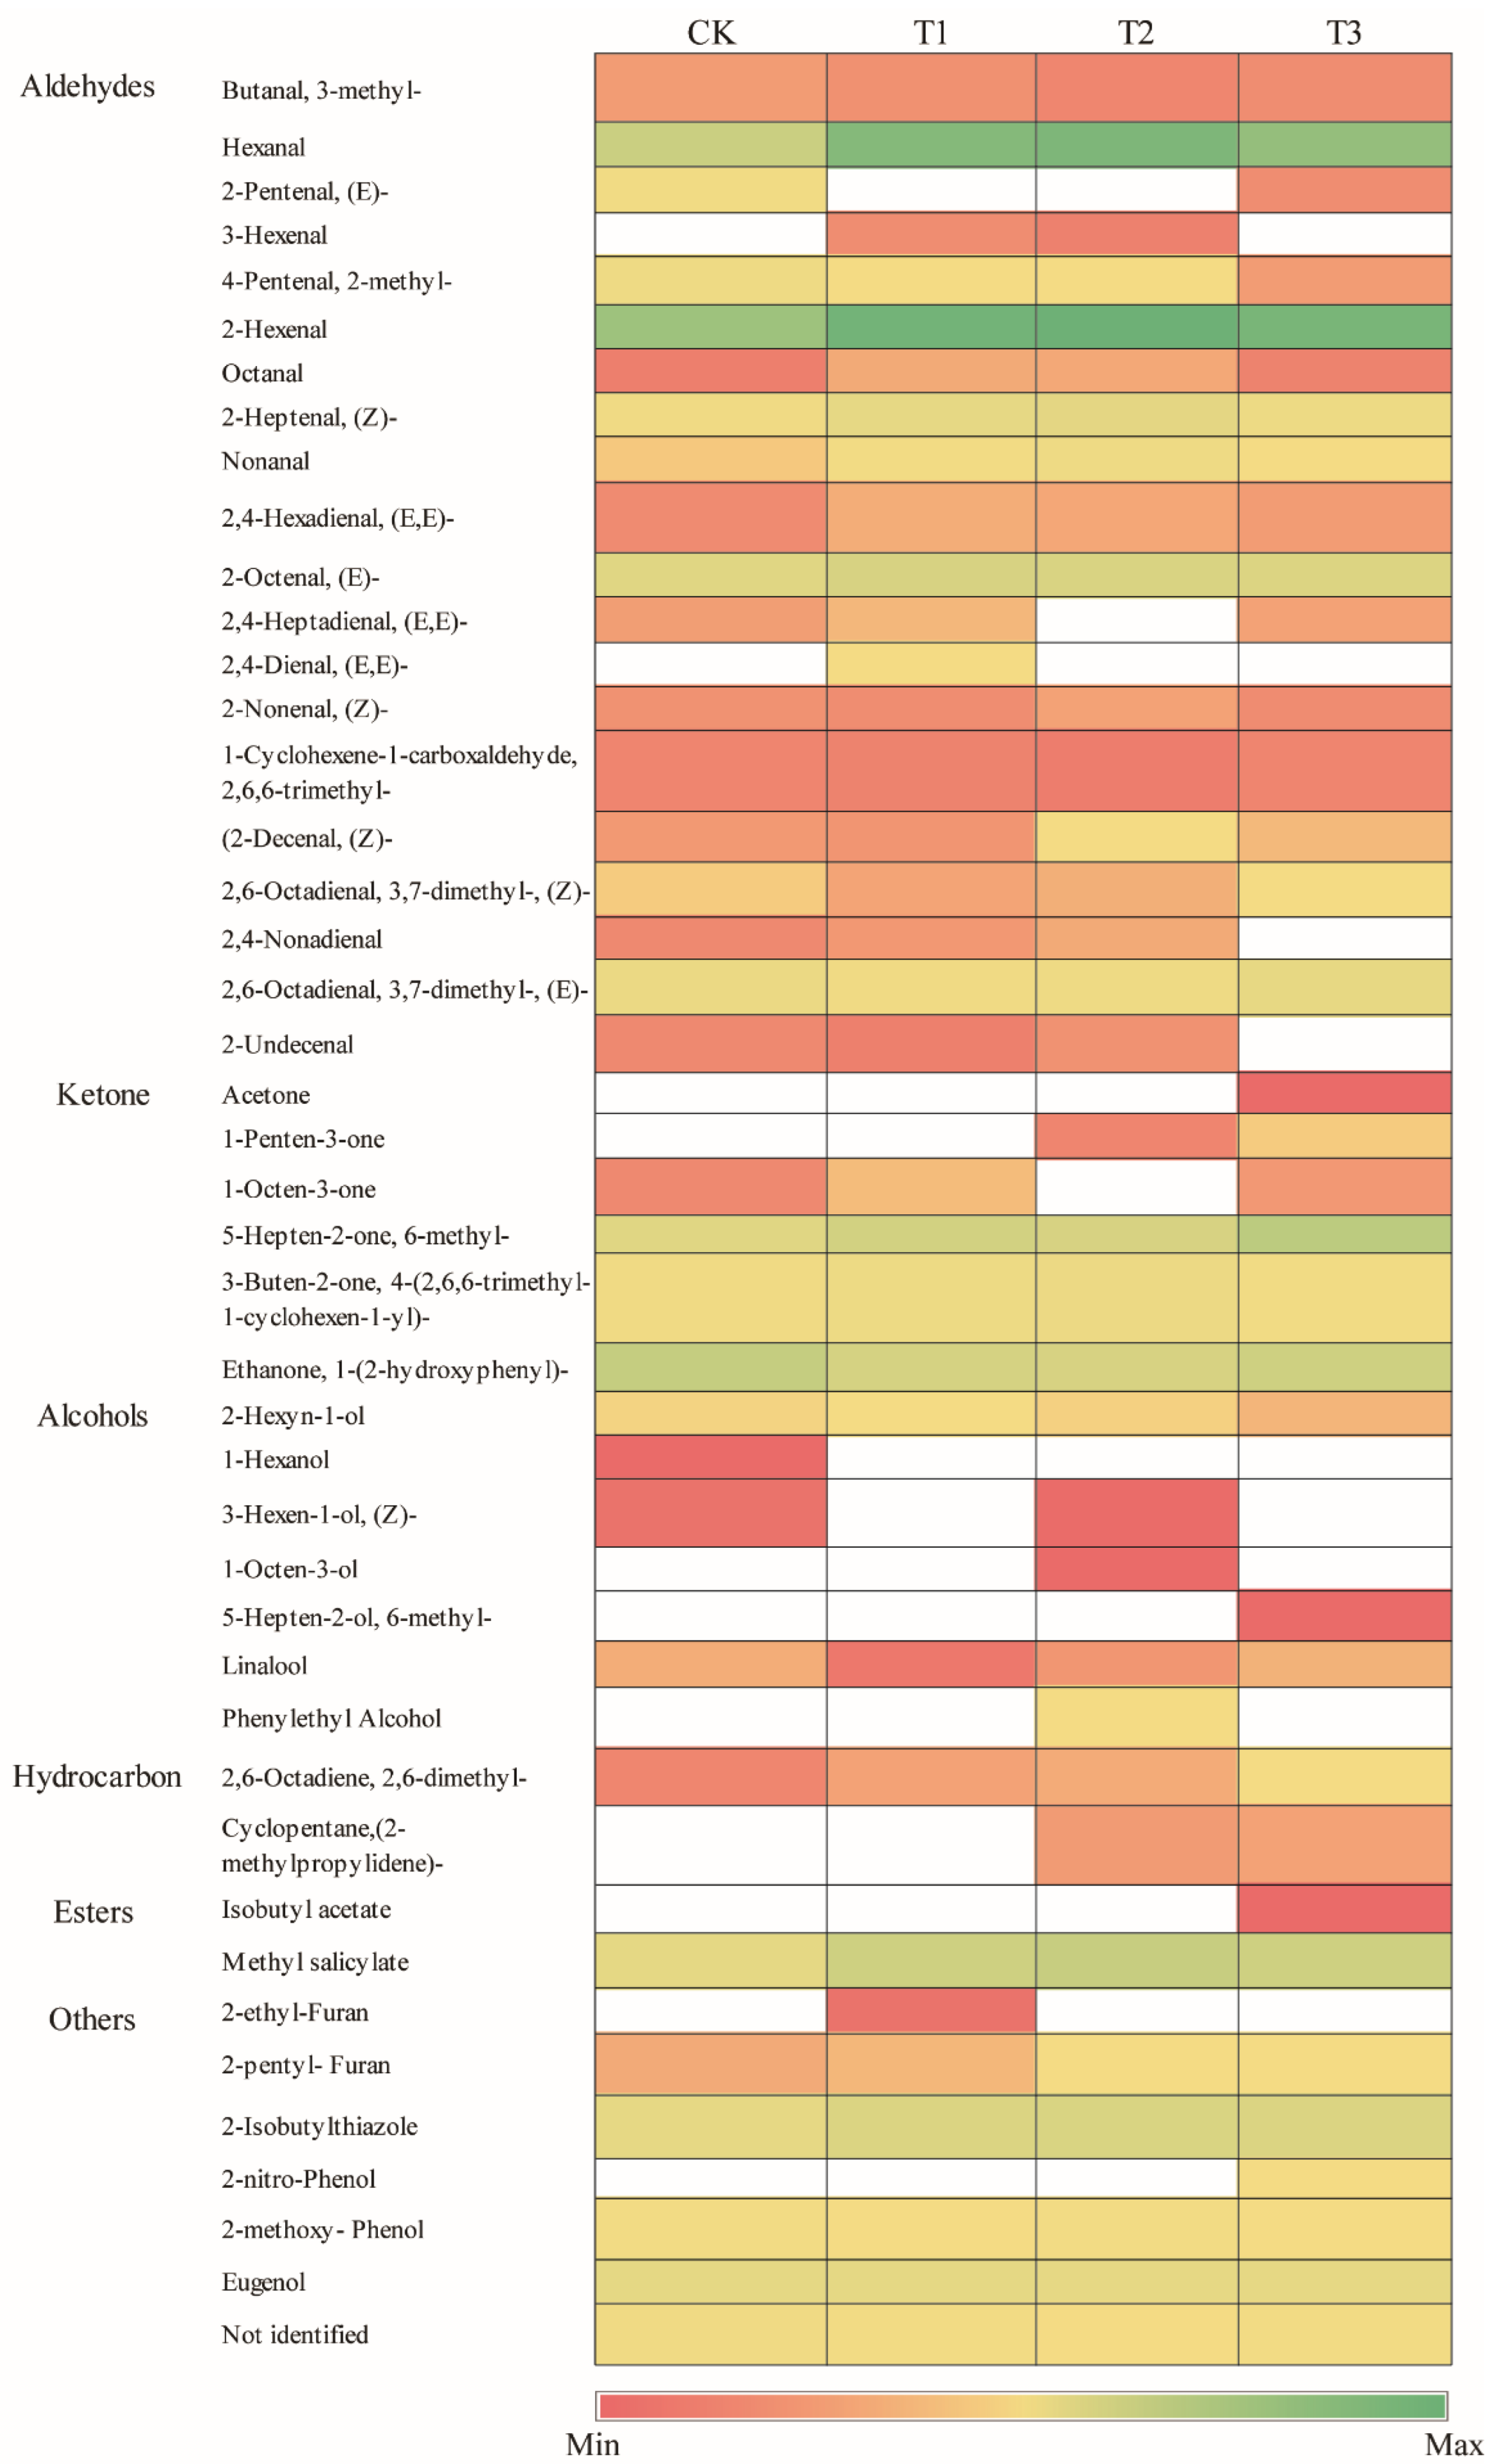
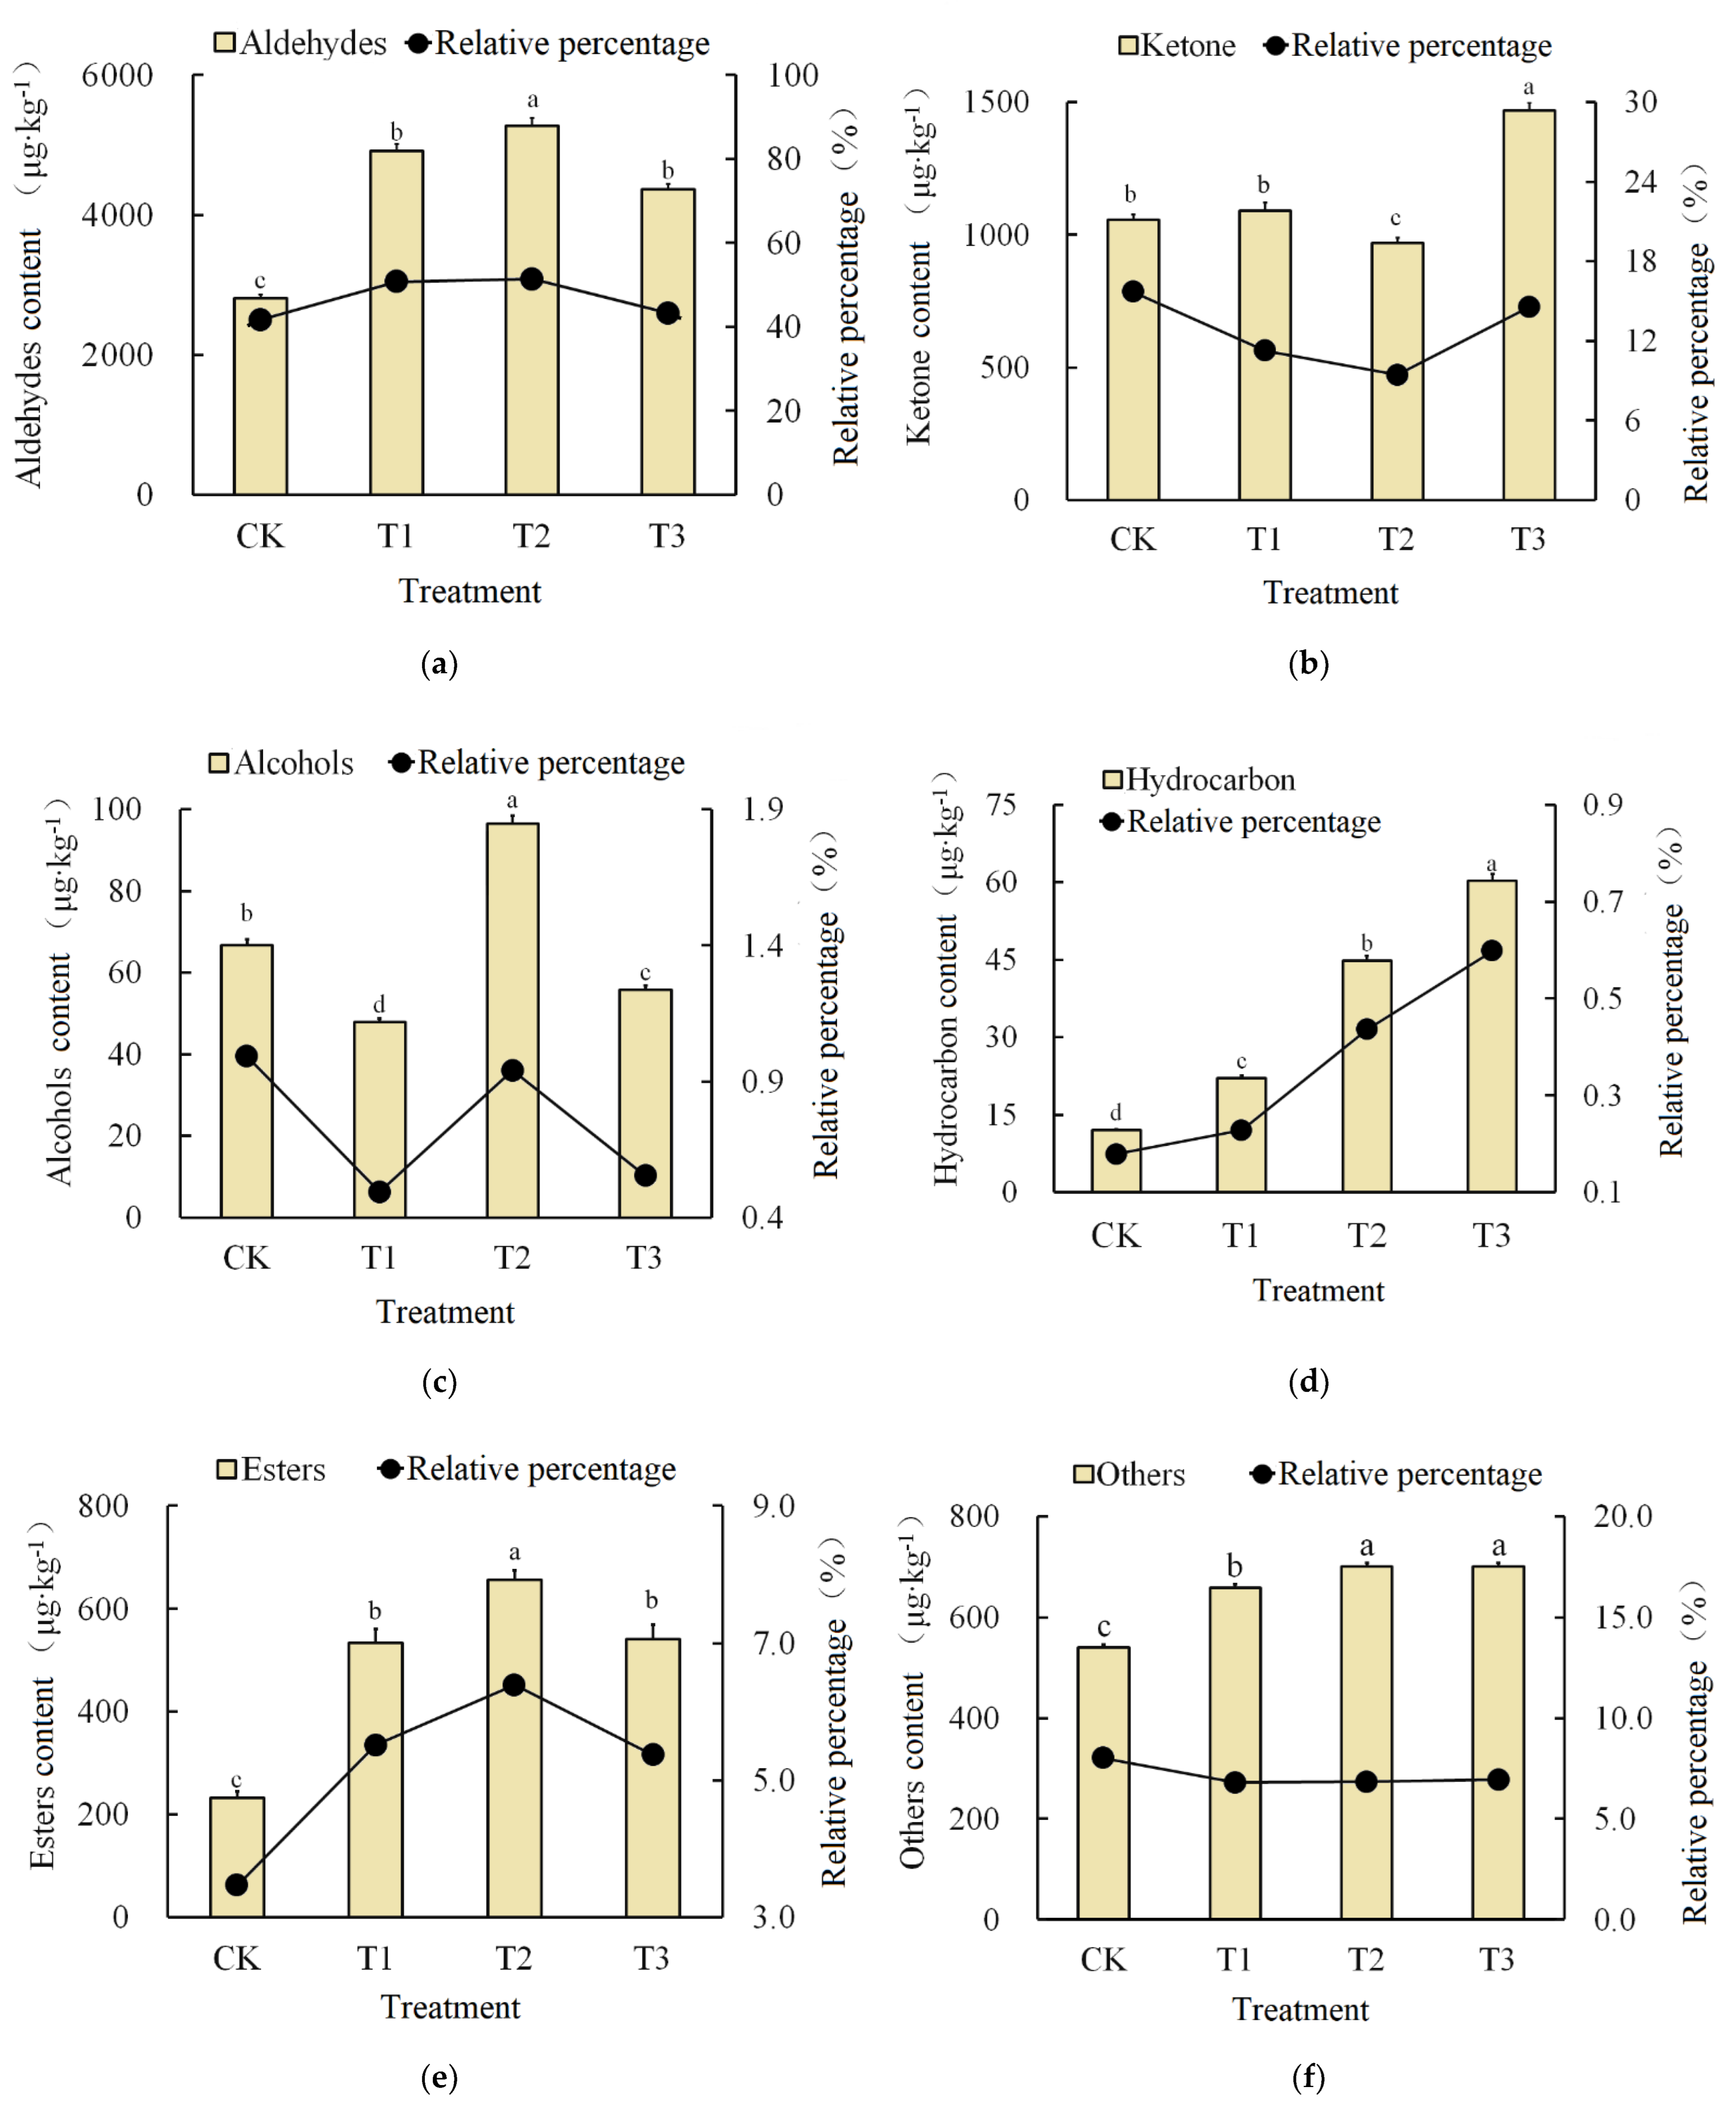
Forty-five kinds of volatile substances were detected, and the types and contents of volatile substances in each treatment were different (Figure 6 and Figure 7). Of them, the types of aromatic substances in the tomato fruit under the T3 treatment were the richest, with 35 species. The total content of the volatile substances in cherry tomato fruit under the T2 treatment was the largest, 10,266.26 μg·kg−1, which was 52.6% more than in the CK treatment. Nine main aromatic components were detected, including the hexanal, trans-2-heptenal, trans-2-hexenal, trans-2-heptenal, 1-pentene-3-ketone, 6-methyl Base-5-heptene-2-one, β-ionone, 2-phenylethanol, methylsalicylic acid. Of them, eigt were detected in the T2 treatment, and only seven were detected in the CK, T1, and T3 treatments. Hexenal is related to cherry tomato sweetness, and it had the highest value under the T2 treatment. It increased by 215.5%, 8.7%, and 32.9% compared with the CK, T1, and T3 treatments, respectively. The content of 6-methyl-5-heptene-2-ketone is related to the fruit flavor and was highest under the CK treatment. It decreased by 36.1%, 63.5%, and 64.8% compared to the T1, T2, and T3 treatments, respectively. The content of β-ionone, which is related to the sour taste of fruit, was highest in the T3 treatment. Aldehydes and ketones accounted for more than 80% of the total volatile substances, and the relative percentage of alcohols, esters, and hydrocarbons was less than 15%.

Figure 6.
Heat map of fruit aroma components of cherry tomato under different abaxial leafy supplemental lighting treatments. White indicates no data, and the red minimum and green maximum values for the heat map are shown in the color scale bar.
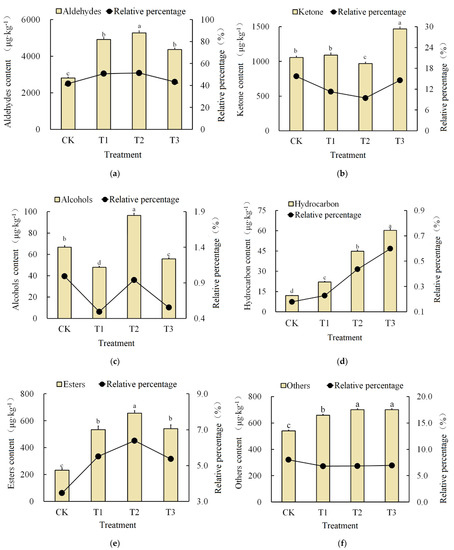
Figure 7.
Effect of different abaxial leafy supplemental lighting treatments on the content and relative percentage of various volatile substances of cherry tomato fruit. (a) Aldehydes; (b) ketone; (c) alcohols; (d) hydrocarbon; (e) esters; (f) others. Tukey’s HSD test was used, and vertical bars represent standard errors of the means (n = 15). Different letters indicate significant differences at p < 0.05 according to Tukey’s HSD test.
3.6. Correlation Analysis of Fruit Yield and Quality Parameters
The correlation analysis of the selected fruit yield and quality parameters demonstrated that the fresh weight of a single fruit truss and total yield were highly significantly correlated to the relative percentage of aldehydes and the relative ketone percentage of tomato plants (p < 0.05; Table 5). Fruit shape index and relative ketone percentage were negatively correlated with other parameters but not with each other. Lycopene content was significantly positively correlated with fruit appearance characteristics, while the ascorbic acid content showed a reverse correlation between fruit shape index and fruit nutrient indicators.
Table 5.
Correlation analysis of selected fruit yield, appearance characteristics, flavor quality, nutrients, and the aromatic substance of cherry tomatoes under different abaxial leafy supplemental lighting treatments.
3.7. Economic Performance Analyses
Statistics on the electricity consumption of each supplementary light treatment (Table 6) demonstrate that the power consumption of the T1 treatment significantly exceeds that of the T2 and T3 treatments, while the yield enhancement was highest in T2, followed by the T1 and T3 treatments. The electricity efficiency results showed a trend similar to yield enhancement. However, after substituting the wholesale price of tomato and the input cost of LED units, the T2 to T3 treatments significantly decreased the value of the final cost performance. In contrast, the T1 treatments were in the middle and did not significantly differ from either. This demonstrates that T2 could produce higher economic benefits.
Table 6.
Economic analysis of different abaxial leafy supplemental lighting treatments.
The average wholesale price of common cherry tomatoes was 10 CNY·kg−1 (January to May 2021, Urumqi Wholesale Market), and the electricity unit price was 0.186 CNY·kWh−1 (electricity for agricultural usage, State Grid Xinjiang Electric Power Co. Ltd., Xinjiang, China). Each LED unit covered 1 m2, and the purchase price was 75 CNY·unit−1 (100 μmol·m−2·s−1) and 95 CNY·unit−1(200 μmol·m−2·s−1), with a theoretical service life of 50,000 h. Means (n = 15) with different letters within each row are significantly different by Tukey’s HSD test at p < 0.05.
4. Discussion
The overall appearance of cherry tomato fruit, including its shape, size, and color, directly affects whether it will be purchased by consumers and therefore determines its economic potential. Our results demonstrate that abaxial leafy supplemental lighting can significantly increase the single fruit weight and horizontal and vertical diameters of tomato fruits, which is consistent with the results of previous research [14,23,24]. Jiang et al. [23] showed that under abaxial leafy supplemental lighting treatment, the time it takes tomato fruit to change color shortened, the brightness and color of the fruit improved, and the single fruit weight significantly increased, which was consistent with the results of our research. However, variation in fruit yield indicates a relationship between fruit development, with fixed carbon exported in fruit and left in source leaves (Table 2; Figure 3). Previous research results demonstrated that when plants are in the reproductive stage, their carbon exportation pattern changes, and more photosynthetic products are transported to the fruit, while concentrations in different leaves vary [14,23,29]. Since carbon assimilates in functional leaves, three leaves below the fruit largely determine fruit production [12,23], and different photosynthetic products from the 3rd leaf below the fruit under different supplemental lighting treatments (Figure 3) could determine fruit yield. This demonstrates that more research is needed to determine how to develop the potential of this leaf.
Cherry tomato fruit mark indicators typically refer to appearance and peel color. Fruit diameters of this variety usually range from 25 mm to 30 mm and have an oval shape, while environmental factors such as irrigation method [30], cultivation schedule [31], and thermal conditions [32] can largely determine fruit size, which affects fruit quality and shelf life [33]. In this study, fruit under supplemental lighting treatments was larger and had brighter peels than fruit under CK treatment (Table 3 and Table 4). This was consistent with previous research [23]. Flavor quality indicators typically include soluble sugar, soluble solids, total acids, and the ratio of sugar to acid. Although the changes in various indicators under supplemental lighting treatments were inconsistent, the contents of soluble solids, total solids, and the ratio of sugar to acid were largest under the T2 treatment (Figure 4). This indicates that this supplemental lighting mode contributed to the accumulation of sweet substances in fruit, which typically sell well. The nutritional quality of tomato fruit is primarily measured by the content of soluble protein, ascorbic acid, and lycopene. Studies have shown that the content of soluble protein and ascorbic acid in tomatoes can be significantly increased by increasing the lighting intensity [12] and the number of fruit truss [14]. In this experiment, the content of soluble protein and ascorbic acid in the T1 and T2 treatments were significantly higher than that for other treatments. This indicates that the total light intensity that the plant received could be higher in these two treatments (Figure 5a,b). Lycopene is a strong antioxidant, which affects scavenging inner free radicals, delaying aging, and preventing cancer and cardiovascular diseases [33]. It is typically used as an important indicator to measure whether the tomato is a functional food. Previous results [24] demonstrated that supplemental lighting could significantly increase the lycopene concentration in tomato fruit. In this experiment, the lycopene content in the T2 and T1 treatments was also higher (Figure 5c), suggesting that these two supplemental lighting modes could promote the healthy properties of tomatoes. However, compared with other parameters, there is a relative lack of research on lycopene response under abaxial supplemental lighting methods, and further study is needed. The tomato fruit aroma is composed of various volatile substances, which can directly affect its flavor. There are currently more than 400 kinds of aromatic substances in tomatoes, including aldehydes, ketones, esters, alcohols, and hydrocarbons [34]. Only nine main aromatic components were detected in this experiment, which could be due to different cultivation conditions and tomato varieties. The T2 process detected the most species (eight) (Figure 6 and Figure 7). Some volatile aromatic substances have a strong odor, and some have a mild odor, though all substances must be assessed to reflect the aromatic characteristics of the fruit [34]. Our results showed that abaxial leafy supplemental lighting could increase the types and total amounts of volatile substances in tomato fruit and that T2 had the highest increase in the total amount of aromatic substances.
The results of our correlation analysis assessing fruit yield and quality parameters in cherry tomatoes demonstrated that fruit yield parameters (FWSFT and TY) were highly significantly correlated to aromatic fruit indicators (ARP and KRP) and were not significantly correlated to the appearance, flavor, or nutrient characteristics (FSI, L*, C, SSC, LC, and AAC) (Table 6). In general, better yields are typically correlated with poorer fruit quality [30,31,32,33]. Our results did not reflect this trend (i.e., FWSFT and TY are positively correlative to ARP), indicating that plants treated with abaxial supplemental lighting could have relatively high yield and high quality. We also previously conducted an economic analysis on abaxial leafy supplemental lighting and classic adaxial leafy supplemental lighting. Our results showed that the electricity efficiency of abaxial leafy supplemental lighting was 46.6% more energy efficient than plants exposed to classic adaxial leafy supplemental lighting. This resulted in a 45.0% higher cost performance for abaxial leafy supplemental lighting, compared to classic adaxial leafy supplemental lighting [14,21]. In this study, the economic analysis still used a uniform unit price rather than step prices in our calculations, which was determined according to different fruit quality. This method should be used in future studies. While it was not a rigorous analysis, the economic performance analysis suggested that T2 had a higher cost return.
5. Conclusions
Abaxial leafy supplemental lighting treatment can optimize both fruit yield and quality, and the leaf carbon exportation showed the possibility of fruit yield determination. The overall appearance, flavor quality, nutrient indicators, and aroma of cherry tomato fruits under the T1 and T2 treatments were higher than in the other treatments. The correlation analysis of fruit yield and quality parameters suggested that this lighting could produce high-yield and high-quality tomato fruit. Combined with the cost performance analysis, the dynamic altered supplemental lighting (T2) is more suitable for high-valued greenhouse cherry tomato production.
Author Contributions
Investigation, analysis, and validation, J.R., S.R., G.D. and Y.L.; formal analysis and writing—original draft preparation; C.J. and J.L.; conceptualization, resources, writing—review and editing, and funding acquisition, C.J. and Y.S. All authors have read and agreed to the published version of the manuscript.
Funding
This research was funded by the National Natural Science Foundation of China, grant number 31960622; the China Postdoctoral Science Foundation, grant number 2021MD703889; the Natural Science Basic Research Program of Shaanxi, grant number 2020JQ-249; the Shaanxi Postdoctoral Research Project Support, grant number 2018BSHYDZZ69.
Institutional Review Board Statement
Not applicable.
Informed Consent Statement
Not applicable.
Data Availability Statement
The datasets generated for this study are available on request to the corresponding author.
Acknowledgments
We would like to thank Xiaoting Zhou for her information support and Jue Wang for her support in laboratory work. We also wish to thank the anonymous reviewers for their valuable comments and suggestions that helped improve the manuscript.
Conflicts of Interest
The authors declare no conflict of interest.
References
- De Villers, A.J.; van Rooyen, M.W.; Theron, G.K.; van de Venter, H.A. Germination of three Namaqualand pioneer species, as influenced by salinity, temperature and light. Seed Sci. Technol. 1994, 22, 427–433. [Google Scholar]
- Zohar, Y.; Waisel, Y.; Karschon, R. Effects of light, temperature and osmotic stress on seed germination of Eucalyptus occidentalis Endl. Aust. J. Bot. 1975, 23, 391–397. [Google Scholar] [CrossRef]
- Evans, J.; Poorter, H.R. Photosynthetic acclimation of plants to growth irradiance: The relative importance of specific leaf area and nitrogen in maximizing carbon gain. Plant Cell Environ. 2001, 24, 755–767. [Google Scholar] [CrossRef]
- Fu, Q.; Zhao, B.; Wang, X.; Wang, Y.; Ren, S.; Guo, Y. The responses of morphological trait, leaf ultrastructure, photosynthetic and biochemical performance of tomato to differential light availabilities. Agric. Sci. China 2011, 10, 1887–1897. [Google Scholar] [CrossRef]
- Cerdán, P.D.; Chory, J. Regulation of flowering time by light quality. Nature 2003, 423, 881–885. [Google Scholar] [CrossRef] [PubMed]
- Goto, N.; Kumagai, T.; Koornneef, M. Flowering responses to light-breaks in photomorphogenic mutants of Arabidopsis thaliana, a long-day plant. Physiol. Plantarum. 1991, 83, 209–215. [Google Scholar] [CrossRef]
- O’Carrigan, A.; Hinde, E.; Lu, N.; Xu, X.; Duanc, H.; Huang, G.; Mak, M.; Bellotti, B.; Chen, Z. Effects of light irradiance on stomatal regulation and growth of tomato. Environ. Exp. Bot. 2014, 98, 65–73. [Google Scholar] [CrossRef]
- Shimazaki, K.; Doi, M.; Assmann, S.M.; Kinoshita, T. Light regulation of stomatal movement. Annu. Rev. Plant Biol. 2007, 58, 219–247. [Google Scholar] [CrossRef] [Green Version]
- Mullineaux, P.; Karpinski, S. Signal transduction in response to excess light getting out of the chloroplast. Curr. Opin. Plant Biol. 2002, 5, 43–48. [Google Scholar] [CrossRef]
- Hovi, T.; Nakkila, J.; Tahvonen, R. Intra-canopy lighting improves production of year-round cucumber. Sci. Hortic. 2004, 102, 283–294. [Google Scholar] [CrossRef]
- Pettersen, R.I.; Torre, S.; Gislerod, H.R. Effects of intera-canopy lighting on photosynthesis characteristics in cucumber. Sci. Hortic. 2010, 125, 77–81. [Google Scholar] [CrossRef]
- Lu, N.; Maruo, T.; Johkan, M.; Hohjo, M.; Tsukagoshi, S.; Ito, Y.; Ichimura, T.; Shinohara, Y. Effect of supplemental lighting within the canopy at different developing stages on tomato yield and quality of single-truss tomato plant grown at high density. Environ. Control Biol. 2012, 50, 1–11. [Google Scholar] [CrossRef] [Green Version]
- Dorais, M. The use of supplemental lighting for vegetable crop production: Light intensity, crop response, nutrition, crop management, cultural practices. In Proceedings of the Canadian Greenhouse Conference, Toronto, QN, Canada, 1 August 2003. [Google Scholar]
- Song, Y. Study on the Relationship between LED Supplementary Light and Greenhouse Tomato Light Utilization Characteristics and Growth and Development. Ph.D. Thesis, China Agricultural University, Beijing, China, 2017. (In Chinese with English Abstract). [Google Scholar]
- Tewolde, F.T.; Lu, N.; Shiina, K.; Maruo, T.; Takagaki, M.; Kozai, T.; Wataru, Y. Nighttime supplemental LED inter-lighting improves growth and yield of single-truss tomatoes by enhancing photosynthesis in both winter and summer. Front. Plant Sci. 2016, 7, 448. [Google Scholar] [CrossRef] [PubMed]
- Dou, H.; Niu, G.; Gu, M.; Masabni, J.G. Effects of Light Quality on Growth and Phytonutrient Accumulation of Herbs under Controlled Environments. Horticulturae 2017, 3, 36. [Google Scholar] [CrossRef] [Green Version]
- Rezazadeh, A.; Harkess, R.L.; Telmadarrehei, T. The Effect of Light Intensity and Temperature on Flowering and Morphology of Potted Red Firespike. Horticulturae 2018, 4, 36. [Google Scholar] [CrossRef] [Green Version]
- Zha, L.; Liu, W. Effects of light quality, light intensity, and photoperiod on growth and yield of cherry radish grown under red plus blue LEDs. Hortic. Environ. Biotechnol. 2018, 59, 511–518. [Google Scholar] [CrossRef]
- Ahmed, H.A.; Tong, Y.; Li, L.; Sahari, S.Q.; Almogahed, A.M.; Cheng, R. Integrative Effects of CO2 Concentration, Illumination Intensity and Air Speed on the Growth, Gas Exchange and Light Use Efficiency of Lettuce Plants Grown under Artificial Lighting. Horticulturae 2022, 8, 270. [Google Scholar] [CrossRef]
- Song, Y.; Jiang, C.; Gao, L. Polychromatic supplemental lighting from underneath canopy is more effective to enhance tomato plant development by improving leaf photosynthesis and stomatal regulation. Front. Plant Sci. 2016, 7, 1832. [Google Scholar] [CrossRef] [Green Version]
- Jiang, C.; Johkan, M.; Hohjo, M.; Tsukagoshi, S.; Ebihara, M.; Nakaminami, A.; Maruo, T. Photosynthesis, plant growth, and fruit production of single-truss tomato improves with supplemental lighting provided from underneath or within the inner canopy. Sci. Hortic. 2017, 222, 221–229. [Google Scholar] [CrossRef]
- Jiang, C.; Johkan, M.; Hohjo, T.; Tsukagoshi, S.; Ebihara, M.; Nakaminami, A.; Maruo, M. Supplemental lighting applied within or underneath the canopy enhances leaf photosynthesis, stomatal regulation and plant development of tomato under limiting light conditions. Acta Hortic. 2018, 1227, 645–652. [Google Scholar] [CrossRef]
- Jiang, C.; Song, Y.; Li, Y. Effects of different supplemental lightning modes on photosynthetic performance and carbon sequestration of tomato leaves in Gobi greenhouse. China Veg. 2019, 10, 32–38, (In Chinese with English Abstract). [Google Scholar]
- Song, Y.; Jiang, C.; Li, Y. Effects of different abaxial leaf supplemental lightning modes on fruit quality of tomato produced in Gobi greenhouses. Xinjiang Agric. Sci. 2021, 58, 294–303, (In Chinese with English Abstract). [Google Scholar]
- National Bureau of Statistics. China Statistical Yearbook-2021; China Statistics Press: Beijing, China, 2021.
- Aguirre, N.C.; Cabrera, F.A.V. Evaluating the fruit production and quality of cherry tomato (Solanum lycopersicum var. cerasiforme). Rev. Fac. Natl. Agric. Medellín 2012, 65, 6593–6604. [Google Scholar]
- Sun, Q.; Zhang, N.; Wang, J.; Zhang, H.; Li, D.; Shi, J.; Li, R.; Weeda, S.; Zhao, B.; Ren, S.; et al. Melatonin promotes ripening and improves quality of tomato fruit during postharvest life. J. Exp. Bot. 2015, 66, 657–668. [Google Scholar] [CrossRef] [PubMed] [Green Version]
- Davis, A.R.; Fish, W.W.; Perkins, P. A rapid spectrophotometric method for analyzing lycopene content in tomato products. Postharvest Biol. Tec. 2003, 28, 425–430. [Google Scholar] [CrossRef]
- Reich, P.B.; Walters, M.B.; Tjoelker, M.G.; Vanderklein, D.; Buschena, C. Photosynthesis and respiration rates depend on leaf and root morphology and nitrogen concentration in nine boreal tree species differing in relative growth rate. Func. Ecol. 2010, 12, 395–405. [Google Scholar] [CrossRef]
- Petrovic, I.; Savic, S.; Jovanovic, Z.; Stikić, R.; Brunel, B.; Sérino, S.; Bertin, N. Fruit quality of cherry and large fruited tomato genotypes as influenced by water deficit. Zemdirbyste 2019, 106, 123–128. [Google Scholar] [CrossRef] [Green Version]
- Dias, N.D.S.; Diniz, A.A.; de Morais, P.L.D.; Pereira, G.D.S.; Sá, F.V.D.S.; Souza, B.G.D.A.; Cavalcante, L.F.; Neto, M.F. Yield and quality of cherry tomato fruits in hydroponic cultivation. Biosci. J. 2019, 35, 1470–1477. [Google Scholar] [CrossRef] [Green Version]
- Gautier, H.; Rocci, A.; Buret, M.; Grasselly, D.; Causse, M. Fruit load or fruit position alters response to temperature and subsequently cherry tomato quality. J. Sci. Food Agric. 2005, 85, 1009–1016. [Google Scholar] [CrossRef]
- Islam, M.Z.; Lee, Y.T.; Mele, M.A.; Choi, I.L.; Kang, H.M. Effect of fruit size on fruit quality, shelf life and microbial activity in cherry tomatoes. AIMS Agric. Food 2019, 4, 340–348. [Google Scholar] [CrossRef]
- Selli, S.; Kelebek, H.; Ayseli, M.T.; Tokbas, H. Characterization of the most aroma-active compounds in cherry tomato by application of the aroma extract dilution analysis. Food Chem. 2014, 165, 540–546. [Google Scholar] [CrossRef] [PubMed]

Publisher’s Note: MDPI stays neutral with regard to jurisdictional claims in published maps and institutional affiliations. |
© 2022 by the authors. Licensee MDPI, Basel, Switzerland. This article is an open access article distributed under the terms and conditions of the Creative Commons Attribution (CC BY) license (https://creativecommons.org/licenses/by/4.0/).