Article

Comparative Analyses of Chloroplast Genomes Provide Comprehensive Insights into the Adaptive Evolution of Paphiopedilum (Orchidaceae)

Key Laboratory of Resource Biology and Biotechnology in Western China, Ministry of Education, College of Life Sciences, Northwest University, Xi’an 710069, China
*
Author to whom correspondence should be addressed.
These authors have contributed equally to this work.
Horticulturae 2022, 8(5), 391; https://doi.org/10.3390/horticulturae8050391
Submission received: 21 March 2022 / Revised: 24 April 2022 / Accepted: 27 April 2022 / Published: 28 April 2022
(This article belongs to the Topic Plant Breeding, Genetics and Genomics)

Abstract

:
An elucidation of how the selection pressures caused by habitat environments affect plant plastid genomes and lead to the adaptive evolution of plants, is a very intense area of research in evolutionary biology. The genus Paphiopedilum is a predominant group of orchids that includes over 66 species with high horticultural and ornamental value. However, owing to the destructive exploitation and habitat deterioration of wild germplasm resources of Paphiopedilum, it needs more molecular genetic resources and studies on this genus. The chloroplast is cytoplasmically inherited and often used in evolutionary studies. Thus, for this study, we newly sequenced, assembled and annotated five chloroplast genomes of the Paphiopedilum species. The size of these genomes ranged from 155,886 bp (P. henryanum) to 160,503 bp (P. ‘GZSLKY’ Youyou) and they contained 121–122 genes, which consisted of 76 protein coding genes, eight ribosomal RNAs, and 37–38 transfer RNAs. Combined with the other 14 Paphiopedilum species, the characteristics of the repeat sequences, divergent hotspot regions, and the condo usage bias were evaluated and identified, respectively. The gene transfer analysis showed that some fragments of the ndh and ycf gene families were shared by both the chloroplast and nucleus. Although the genomic structure and gene content was conserved, there was a significant boundary shift caused by the inverted repeat (IR) expansion and small single copy (SSC) contraction. The lower GC content and loss of ndh genes could be the result of adaptive evolutionary responses to its unique habitats. The genes under positive selection, including accD, matK, psbM, rpl20, rps12, ycf1, and ycf2 might be regarded as potential candidate genes for further study, which significantly contribute to the adaptive evolution of Paphiopedilum.

1. Introduction

During the evolutionary processes of certain plants, changing environments and habitats may impose selective genetic pressures, which leave a footprint of natural selection in the genes involved with environmental adaptation [1]. As essential organelles, chloroplast (cp) genomes derived from the endosymbiosis between non-photosynthetic hosts and independent living cyanobacteria play an indispensable role in several vital biochemical processes and the photosynthesis of green plants [2]. Over the last decade, advanced modeling has increasingly been employed for resolving the deep phylogeny, phytogeography, as well as the molecular evolution and adaptive diversification of plants with the features of haploid inheritance, self-replication, relatively small size and slow mutation rates compared with the nuclear genome [1,2,3].
In general, the cp genome has a conservative circle structure, gene order, and genetic content in most flowering plants. It is typically comprised of two inverted repeat copies (IRa and IRb), a large single copy region (LSC), and a small single copy region (SSC) [3,4,5]. However, although the cp genome being much more conservative than nuclear genomes or mitochondrial genomes, the gene rearrangements, inversion, gene loss, inverted repeats expansion still occur in some green plant lineages. Moreover, there were many mutation events have been found in cp genomes, which are including insertions, deletions, substitutions, and inversions [6]. These disparities might be precisely the evidence or embodiment of adaptive evolution, which are considered as the improvement of plant species to adapt the environmental conditions changing and during their evolutionary processes.
Nevertheless, the courses, tempos, and modes of evolutionary and genomic architectural changes in recent speciation background are still not clear, due to the microevolution of cp genomes and genomes genes in flowering plants remaining largely unknown [2]. Thus, in-depth comparisons of cp genomes in closely related plant species are urgently required to significantly improve the evolutionary inferences sensitivity with genomic structural knowledge towards a thorough elucidation of the mechanisms, rates, and directionality of cp genome evolution.
The genus Paphiopedilum Pfitz. belongs to the Orchidaceae family, which includes over 66 species, of which 18 are natively distributed as ornamental plants that span Southwest to South China due to their large and exquisite flowers [7,8,9,10,11]. Paphiopedilum are often referred to as slipper orchids as they possess a bag-like lip that is akin to ladies’ slippers [9,10,11]. They have significant ornamental, horticultural, and medicinal value and grow primarily within the cracks in cliffs, or rocky well-drained sites in evergreen broadleaved forests, at altitudes of ~1000 m as a type of terrestrial, lithophytic/epiphytic herb [12,13,14]. Their unique ecosystems make them ideal for the study of environmental adaptation and evolution [9,10,11].
Unfortunately, owing to the destructive exploitation and habitat deterioration of wild Paphiopedilum germplasm resources, it has been listed in the Convention on International Trade in Endangered Species of Wild Fauna and Flora (CITES) and is prohibited from ruthless collection and international exploitation [8,15,16]. Thus far, many species of Paphiopedilum have been designated as first-class protected plants in China, as well as being listed on the IUCN Red List of Endangered (EN) even Critically Endangered (CR) Species [15,16,17].
In past years, research into Paphiopedilum has focused primarily on ecological characteristics and cultivation [18,19,20], genetic diversity and differentiation based on DNA molecular markers (e.g., ITS and plastid gene fragments) [21,22], and historical biogeography [14,23]. Recently, there were some reports also focused on comparative analysis, phylogeny, and evolution based on the whole chloroplast genomes [9,10,11,12]. With the rapid development of the Next-Generation Sequencing (NGS) technologies, many cp genomes of the Orchidaceae family along with the Paphiopedilum species were available in the public database [9,10,11,12,23,24,25,26,27]. These assembled cp genomes offered useful genetic data for Paphiopedilum phylogenetic and evolution studies [9,10,11,12,28,29]. However, the phylogenetic relationships and evolution of Paphiopedilum are quite complex [12,21,22,30]. Investigations into the evolution and adaption of this plant have rarely been reported. The lack of genome-wide investigations limits the capacity to identify genomic characteristics that are under natural selection. Consequently, additional molecular and genetic resources are urgently required to provide a genetic basis for comparative cp genomes, phylogeny, evolutionary biology, and effective protection strategies for Paphiopedilum.
Moreover, the chromosomal karyotypes of different Paphiopedilum species are heterogeneous such that variable numbers of alleles present obstacles to genetic research based on nuclear genes [31,32,33]. Hence, in this case, the efficient and convenient cp genome which, with many advantages, has become an ideal tool for the genetic and evolutionary analysis of Paphiopedilum. Additionally, according to previous studies, the cp genomes of Paphiopedilum might provide unique opportunities to reveal the boundary shift impacts on cp genome structures and gene evolution due to their exceptional peculiarities [12,34]. Owing to the large number of species of the Orchidaceae family in the world, cp genomes have been widely used in their phylogenetics, evolutionary biology, and population genetics [9,10,11,12,13,14,24,25,26,27].
Thus, in this study, we performed comparative analyses to afford comprehensive insights into the evolution and adaptation of the cp genomes of several Paphiopedilum species. Firstly, in addition to a previous study, we sequenced and assembled five cp genomes of Paphiopedilum species. Secondly, we conducted comparative cp genome analyses for these five genomes in addition to the other fourteen chloroplast genomic sequences of Paphiopedilum, which were originally distributed in China [8] and obtained from GenBank (Table S1).
Subsequently, we reconstructed a phylogeny of Paphiopedilum using the cp genomes of forty-one Paphiopedilum individuals combined with four species of a closely related genus and two Lilium species as outgroups (Table S1). Finally, we performed selective pressures to survey whether the protein coding genes were under negative (purifying) selection or positive selection. This study not only provides beneficial knowledge and resources for the conservation and utilization of one of the most world-wide cultivated plant germplasms, but also offers clues into adaptive evolution for the future investigation of epiphytic herbs.

2. Methods

2.1. Sampling and Sequencing

In this study, we collected samples in accordance with the laws of the People’s Republic of China. The field works were approved by the Chinese Government. To collect the samples, all researchers also received the permission letters from the College of Life Science, Northwest University. We identified the samples based on their phenotype. To represent the Paphiopedilum, four natural species (P. bellatulum, P. barbigerum, P. henryanum, and P. hirsutissimum) were selected based on their morphological characteristics. Further, a new hybrid Paphiopedilum cultivar (P. ‘GZSLKY’ Youyou) with high ornamental and horticultural value created by crossing female P. dianthum and male P. barbigerum parents, was also investigated. All five voucher specimens were deposited in the herbarium of the College of Life Science, Northwest University (No: 20210105030–20210105034).
The fresh young healthy leaves were placed into plastic bags filled with silica gel, and were quickly dehydrated and stored at 20 °C for later use. The total genomic DNA was extracted using CTAB methods [35]. Then we verified the DNA quality and quantity using a spectrophotometer and 1% agarose gel electrophoresis, respectively. The genome sequencing was implemented utilizing the Illumina HiSeq 2500 platform with an average insert size of 350 bp.

2.2. Genome Assembly and Annotation

The clean data were generated following low-quality data and adaptor filtering from the raw data using FASTP software [36]. Subsequently, BAW [37] was adopted to align the clean reads to complete the cp genome of P. purpuratum (NCBI accession number MN535015) [38], which were selected as the reference. Then, the aligned reads were selected for further de novo assembly via GETORGANELLE [39], where the range of k-mer was set to 21, 45, 65, 85, 105 and max-rounds to 15, which was then manually corrected. The assembled cp genomes were annotated using the CPGAVAS online tool [40] with default settings. To improve annotation accuracy, multiple cp genomes of the Paphiopedilum species including P. armeniacum, P. delenatii, P. dianthum, P. micranthum, P. niveum, P. purpuratum and P. spicerianum were adopted as references, whereas the transfer RNAs (tRNAs) were confirmed by TRNASCAN-SE [41]. Following annotation, the intron and exon boundaries, as well as the start and stop codons were manually corrected according to the rule of group II introns. Finally, the circle gene physical maps of the complete cp genome sequences were visualized using the CHLOROPLOT online tool [42].
We submitted each of the assembled and annotated cp genome sequences to NCBI GenBank, which were designated via the following GenBank accession numbers: MN315106 for P. barbigerum, MN315107 for P. bellatulum, MN315108 for P. henryanum, MN315109 for P. hirsutissimum, and MN315105 for P. ‘GZSLKY’ Youyou, respectively (Table 1). An additional fourteen Paphiopedilum chloroplast genome sequences, obtained from GenBank and primarily and originally distributed across China, were also adopted for further comparative analyses (Table S1).

2.3. Genome Sequence Characteristic Analysis

Further to the annotation results obtained by CPGAVAS [40], BLASTN was employed to confirm the LSC, IRs, and SSC ranges, respectively, through self-comparison. EMBOSS [43] was utilized to extract the sequences of each segment, whereas the lengths and GC contents were evaluated for both the whole cp genomes and each region using SEQKIT [44]. The gene compositions and categories were counted according to the annotation results, as well as the lengths of exons and introns for the splitting genes. The copy numbers of the protein coding genes (PCGs) were calculated by the THYLOSUITE software and were then checked manually.

2.4. Comparative Genomic Analysis

To compare the structures and conservation of the studied cp genomes (Table 1 and Table S1), MVISTA [45] was employed based on two alignment models: LAGAN and SHUFFLE-LAGAN. The former produces true multiple alignments though they included inversions, while the latter can detect sequence rearrangements and inversions. We analyzed the expansion and contraction of IRs (IRa and IRb) using the IRscope online program [46], and then manually modified them.
To estimate the differentiation hotspot regions in Paphiopedilum, the whole cp genomes of the selected species were aligned using MAFFT [47], followed by the calculation of the nucleotide diversity with DNASP [48], in which the length of the sliding window and step size were both set to 500 bp. To test the effectiveness and the variability of the identified hotspot regions, which were further used for the constructed the ML tree.
The codon usage frequency in Paphiopedilum was analyzed for protein-coding genes (PCGs) using MEGA [49]. The relative synonymous codon usage (RSCU) was assessed to determine whether the cp genomes were under selection. Specifically, when the RSCU value was >1.00, this meant that the use of a codon was more frequent than expected, and vice versa.
For predicting the synteny between genomes from different sources, the cp genome was aligned to the nuclear genome of the closely related orchid species Dendrobium chrysotoxum, which was selected as a reference using BLASTN. The E value was set to 10-5 and the identity was set to 99%, where the genes located in the synteny regions were scanned according to the annotation results. Finally, the synteny plot was constructed using TBTOOLS [50].

2.5. Repeat Sequence and SSR Element Analyses

The SSRs (simple sequence repeats or microsatellites) were detected using ISA [51] with the minimum repeat number set at ten, five, four, three, three, and three for mono-, di-, tri-, tetra-, penta-, and hexa- repeat units, respectively. The maximum sequence lengths between two SSRs to register as a compound SSR were set to zero. The sizes and locations of interspersed repeat sequences, including forward, reverse, complement, and palindromic repeats in Paphiopedilum, were identified using REPUTER [52]. The repeat positions were identified according to the parameters established under the following conditions: (1) sequence identity > 90%; (2) minimum repeat size ≥ 30 bp; and (3) Hamming distance of 3. Furthermore, tandem repeat sequences were detected using TANDEM REPEATS FINDER [53] based on the advanced model. The alignment parameters were set to 2, 7 and 7, which corresponded to match, mismatch and indels, respectively, and the maximum period size was set to 500.

2.6. Phylogenetic Analyses

To determine the phylogenetic relationships and status of Paphiopedilum species adopted in study, forty-seven cp genomes, including forty-one individuals of Paphiopedilum, two individuals of Phragmipedium, two individuals of Cypripedium and two individuals of Lilium species (Table S1), were employed to create a Maximum Likelihood (ML) tree. The accession number of these cp genomes, which were used for phylogenetic analyses, are shown in Table S1. Firstly, the complete cp genome sequence was extracted using THYLOSUITE software [54] and aligned via MAFFT [47] with default parameter settings, after which the aligned sequences were pruned using GBLOCKS [55]. Subsequently, ML analysis was performed using IQ-TREE [56] with 1000 non-parametric bootstrap replicates in which GTR+G+I+G4 was adopted as the best-fit model according to the Bayesian Information Criterion (BIC) score. Finally, ITOL software was employed to visualize and refine the tree [57].

2.7. Selective Pressure Estimation

The 61 shared signal-copy PCGs across 19 Paphiopedilum species were extracted using THYLOSUIT followed by alignment in MAFFT with a codon model. The alignment files were converted and formatted using script AXTCONVERTOR. The YN00 script incorporated in KAKS_CALCULATOR software [58] was employed to calculate the synonymous (Ks), nonsynonymous (Ka), and Ka/Ks using the method of Yang and Nielsen (YN) [59], and Fisher’s exact test was performed to validate the Ka and Ks values. Following screening, several protein coding genes (PCGs) were discarded if either the Ka or Ks values were unavailable prior to subsequent analysis. Finally, PCGs with Ka/Ks of >1 were regarded as candidate genes under positive selection [1].
To evaluate the variability and selectivity within a specific species, the different cp genome resource generated from different individuals within a given species were employed for the comparison analysis. The species which contained two or more available cp genome announcements in NCBI were adopted in this analysis. The complete cp genome sequences were aligned using MAFFT and the DNASP was adopted to detect the polymorphic sites (SNPs) as well as the insertions and deletions (InDels). Additionally, the KAKS_CALCULATOR program was used to estimate the selection pressure at the species level with the YN method and Fisher’s exact test.

3. Results

3.1. Length and Features of Cp Genome

For this study, the structural characteristics and gene contents of five newly assembled Paphiopedilum cp genomes were determined. The complete chloroplast genome sequences of five newly Paphiopedilum accessions were obtained after performing the de novo and reference-guided assembly with minor modifications. Akin to other angiosperm studies, they included a typical quadripartite structure that was comprised of an LSC domain, and an SSC domain separated by two inverted repeat (IRa and IRb) regions (Figure 1). The cp genome sizes in the five Paphiopedilum species ranged from 155,886 bp (P. henryanum) to 160,503 bp (P. ‘GZSLKY’ Youyou).
The LSC of the five cp genomes ranged from 56.18% to 57.06% of their entirety, and ranged in size from 87,573 bp (P. henryanum) to 91,582 bp (P. ‘GZSLKY’ Youyou). The SSC of the five cp genomes accounted for 1.82–2.34% of their entirety, and it ranged from 2831 bp (P. henryanum) to 3666 bp (P. hirsutissimum). Furthermore, P. ‘GZSLKY’ Youyou possessed the longest IRs (32,851 bp), while the P. barbigerum contained the smallest IRs (in terms of length) at 32,309 bp. Moreover, the length of the LSC region was correlated with the total genome size significantly (r = 0.983, p < 0.01). The average GC content of the cp genomes in the five Paphiopedilum species was similar and ranged from 35.71% to 36.17%. However, the GC content of both the LSC (r = 0.962, p < 0.01) and SSC (r = 0.932, p = 0.021) was positively associated with the total GC content. The distribution patterns of the GC content of the IRs were also significantly different with those in both the LSC (F = 15, p < 0.01) and SSC (F = 10, p = 0.45), respectively.
There were 76 PCGs and eight rRNAs genes annotated in the five Paphiopedilum cp genomes. The number of tRNAs genes were slightly different for these five cp genomes. Specifically, there were 38 tRNAs in P. barbigerum, P. bellatulum, and P. ‘GZSLKY’ Youyou, respectively, while the P. henryanum and P. hirsutissimum contained only 37 tRNAs (Table 1). A total of 16 genes containing introns were observed in the studied species, of which 14 contained one intron (trnV-UAC, trnA-UGC, trnK-UUU, trnL-UAA, trnI-GAU, trnG-UCC, rps12, rps16, rpl16, rpl2, rpoC1, petD, petB and atpF), whereas two genes (clpP and ycf3) contained two introns. A total of 20 duplicated genes were detected in the IR regions, including eight tRNAs (trnH-GUG, trnI-CAU, trnL-CAA, trnV-GAC, trnI-GAU, trnA-UGC, trnR-ACG and trnN-GUU), four rRNAs (rrn16S, rrn4.5S, rrn23S and rrn5S), and eight PCGs (rps15, rps7, rps19, rpl23, rpl2, psaC, ycf1, and ycf2). Furthermore, several pseudogenes were detected in the assembled cp genomes, including ndhB, ndhD, cemA, orf42, and ycf68; rps12 was a trans-splicing gene (Table 2).

3.2. Comparative Cp Genomic Analysis

To perform a comparison of Paphiopedilum cp genomes, the gene structures of the five Paphiopedilum species were drafted with the other 14 Paphiopedilum species obtained from the NCBI (Table S1). The results of structural variation analysis performed by MVISTA revealed that the 19 cp genomes exhibited collinear gene organization (Figure S1). Among the compared cp genomes, there were no significant gene rearrangements observed and most PCGs regions were conserved with an identity value of >50%, except for the detection of the same relative gaps in ycf1, ycf2 and ndhB, respectively. However, the non-coding domains were less conserved in contrast to the coding regions, and the highest variation levels were detected in intergenic spacer regions (Figure S1).
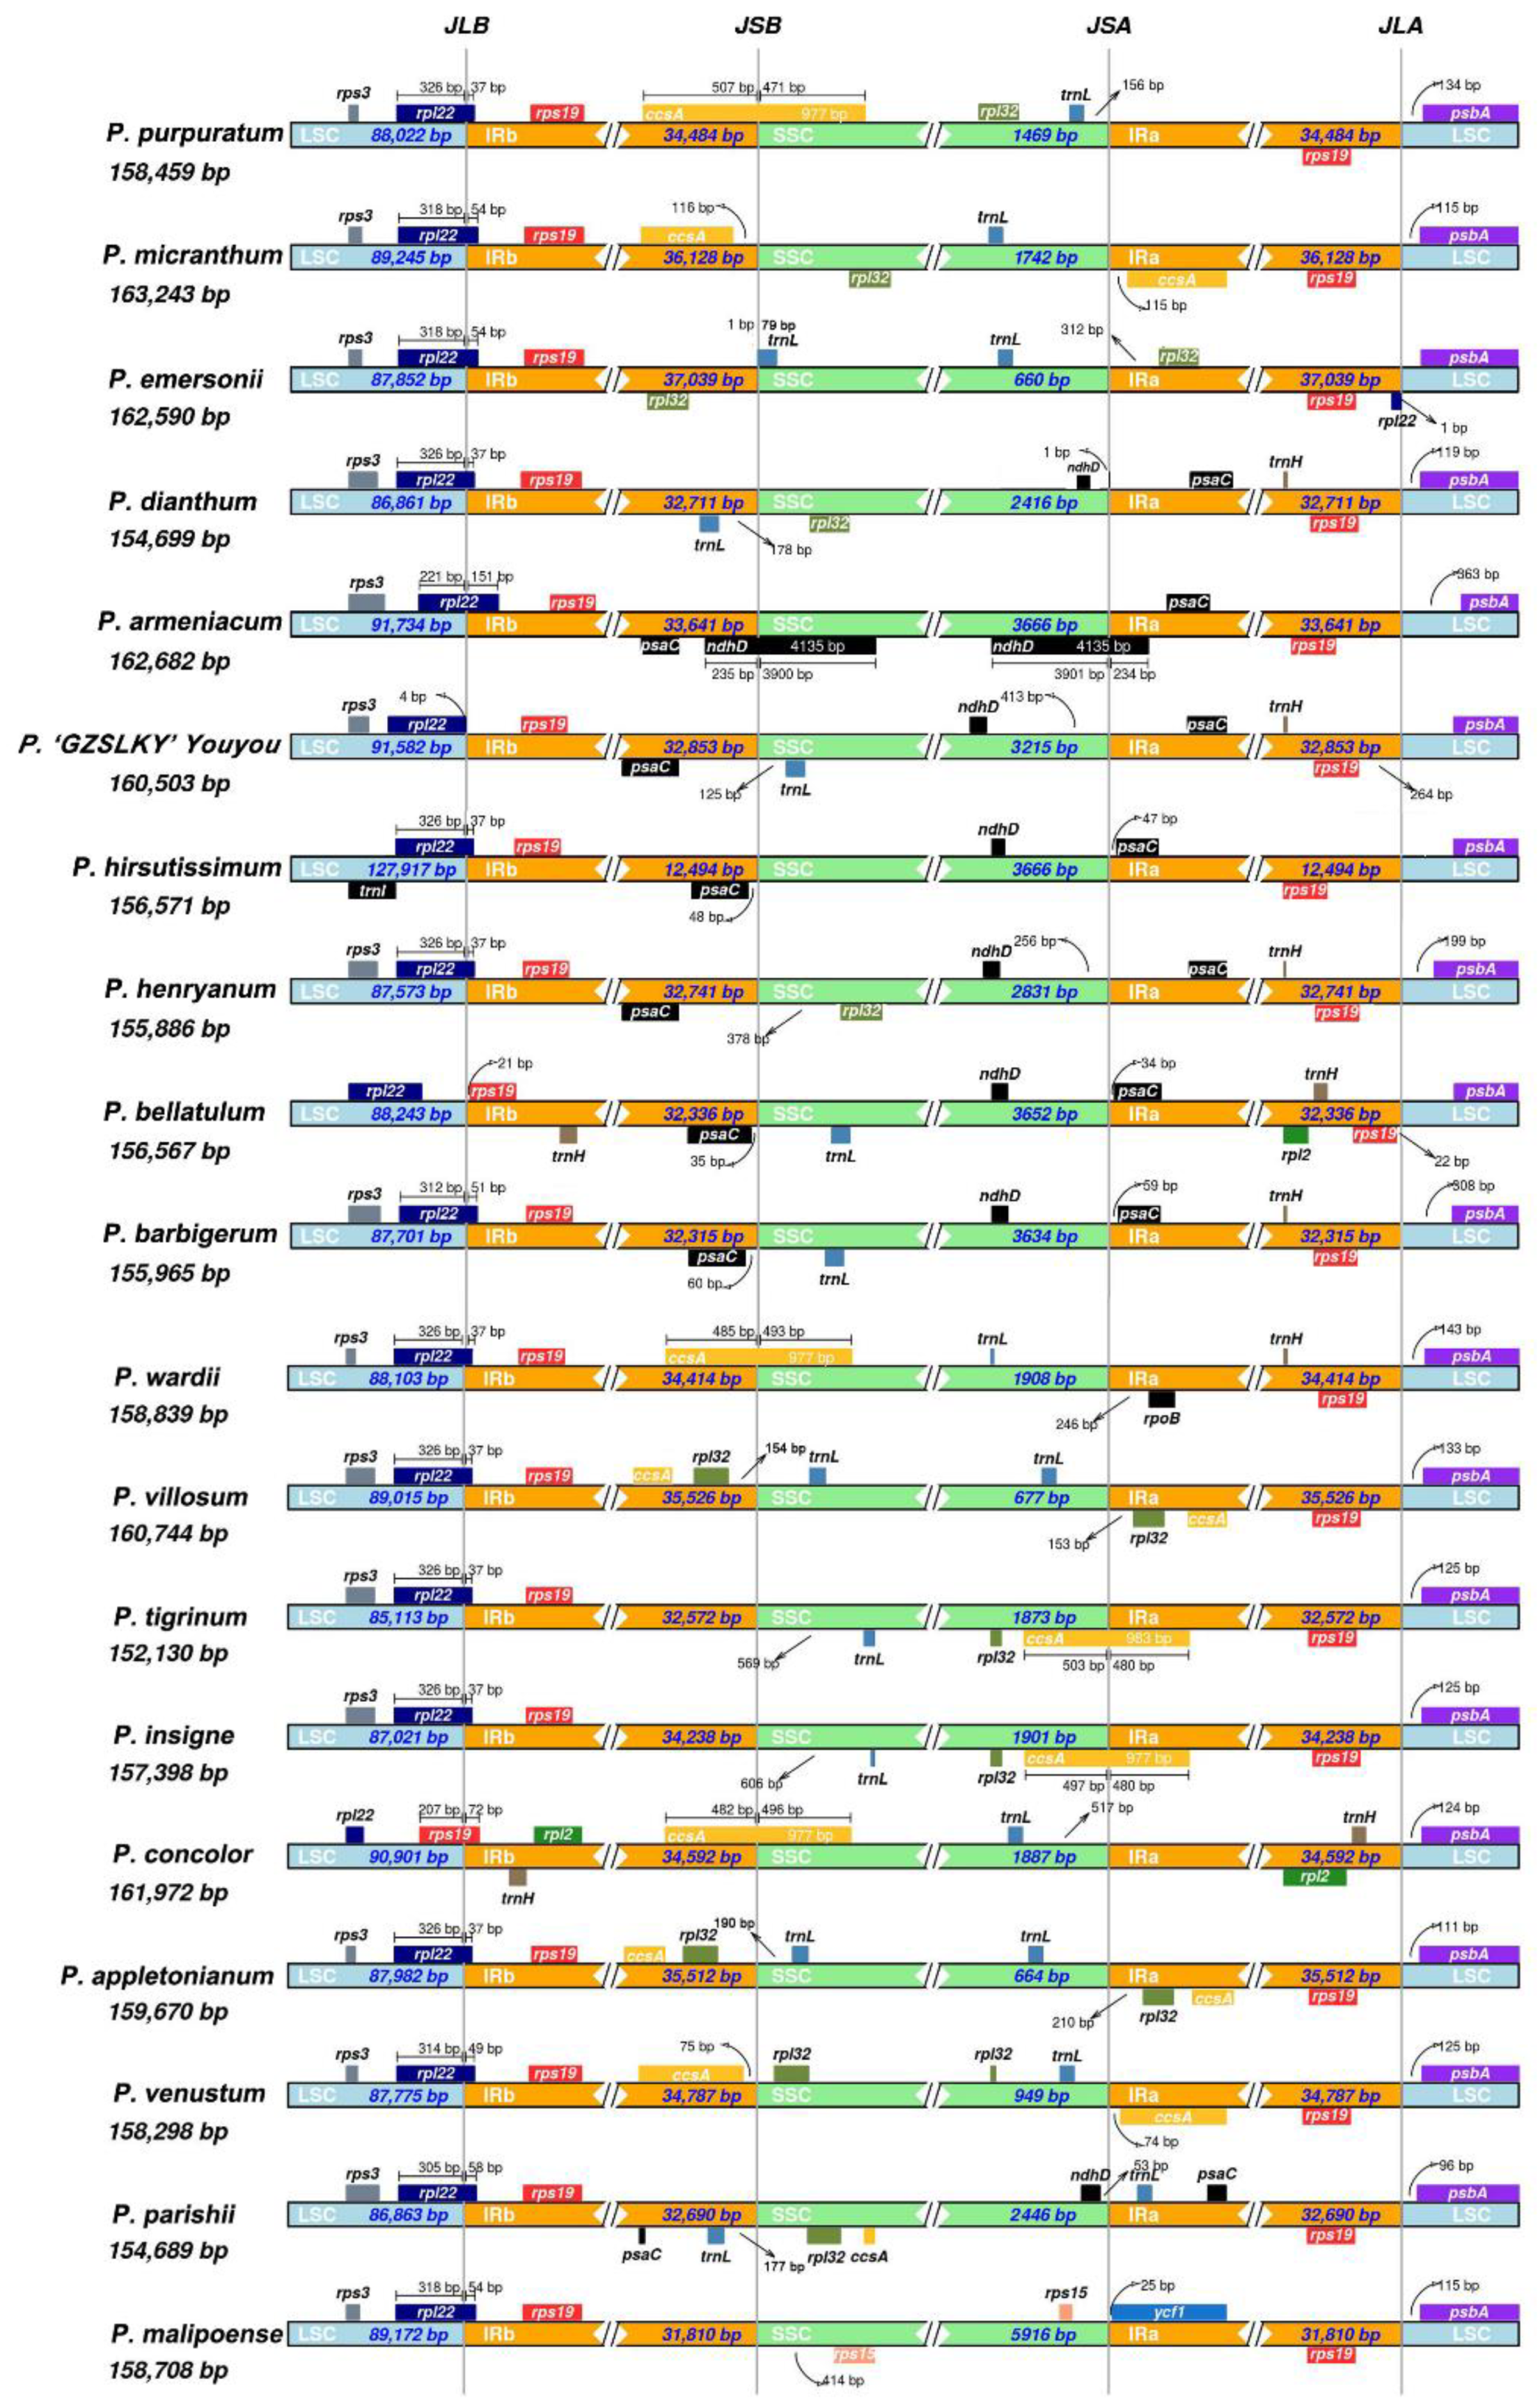
To compare the gene distribution patterns between single copy regions and repeat regions in the cp genomes of Paphiopedilum species, we initially found that the identified IRb IR/LSC junctions were largely located between rps19 and rpl22, creating a copy of rps19 at the IRa/LSC border (Figure 2). The rpl22 gene spanned the IRb/LSC border in many species, with most portions being located in the LSC, and only a small portion extending to the IRb region, which ranged from 21 bp to 151 bp. However, the rps19 gene of P. concolor crossed the IRb/LSC border entirely, which indicated a clear expansion of the IR regions of this species.
The gene distribution patterns close to the IRb/SSC region were more complex, which could be roughly divided into several conditions as follows: (1) The ccsA were entirely expanded into the SSC region with lengths of from 471 to 496 bp; (2) The ccsA and rpl32 were in the IRb region, and the trnL was in the SSC region; (3) The ccsA and rpl32 were distributed in the IRb and SSC regions, respectively; (4) The psaC were in IRb region, whereas the rpl32 or trnL were in the SSC region. Interestingly, two copies of the ndhD gene spanned the junctions of both Irb/SSC and Ira/SSC, respectively, in P. armeniacum, whereas the other species such as P. barbigerum and P. bellatulum contained the pseudogene fragment of ndhD only in the SSC region. As expected, the psbA gene located in the LSC region close to the border of Ira/LSC was the general starting point of the cp genome (Figure 2).
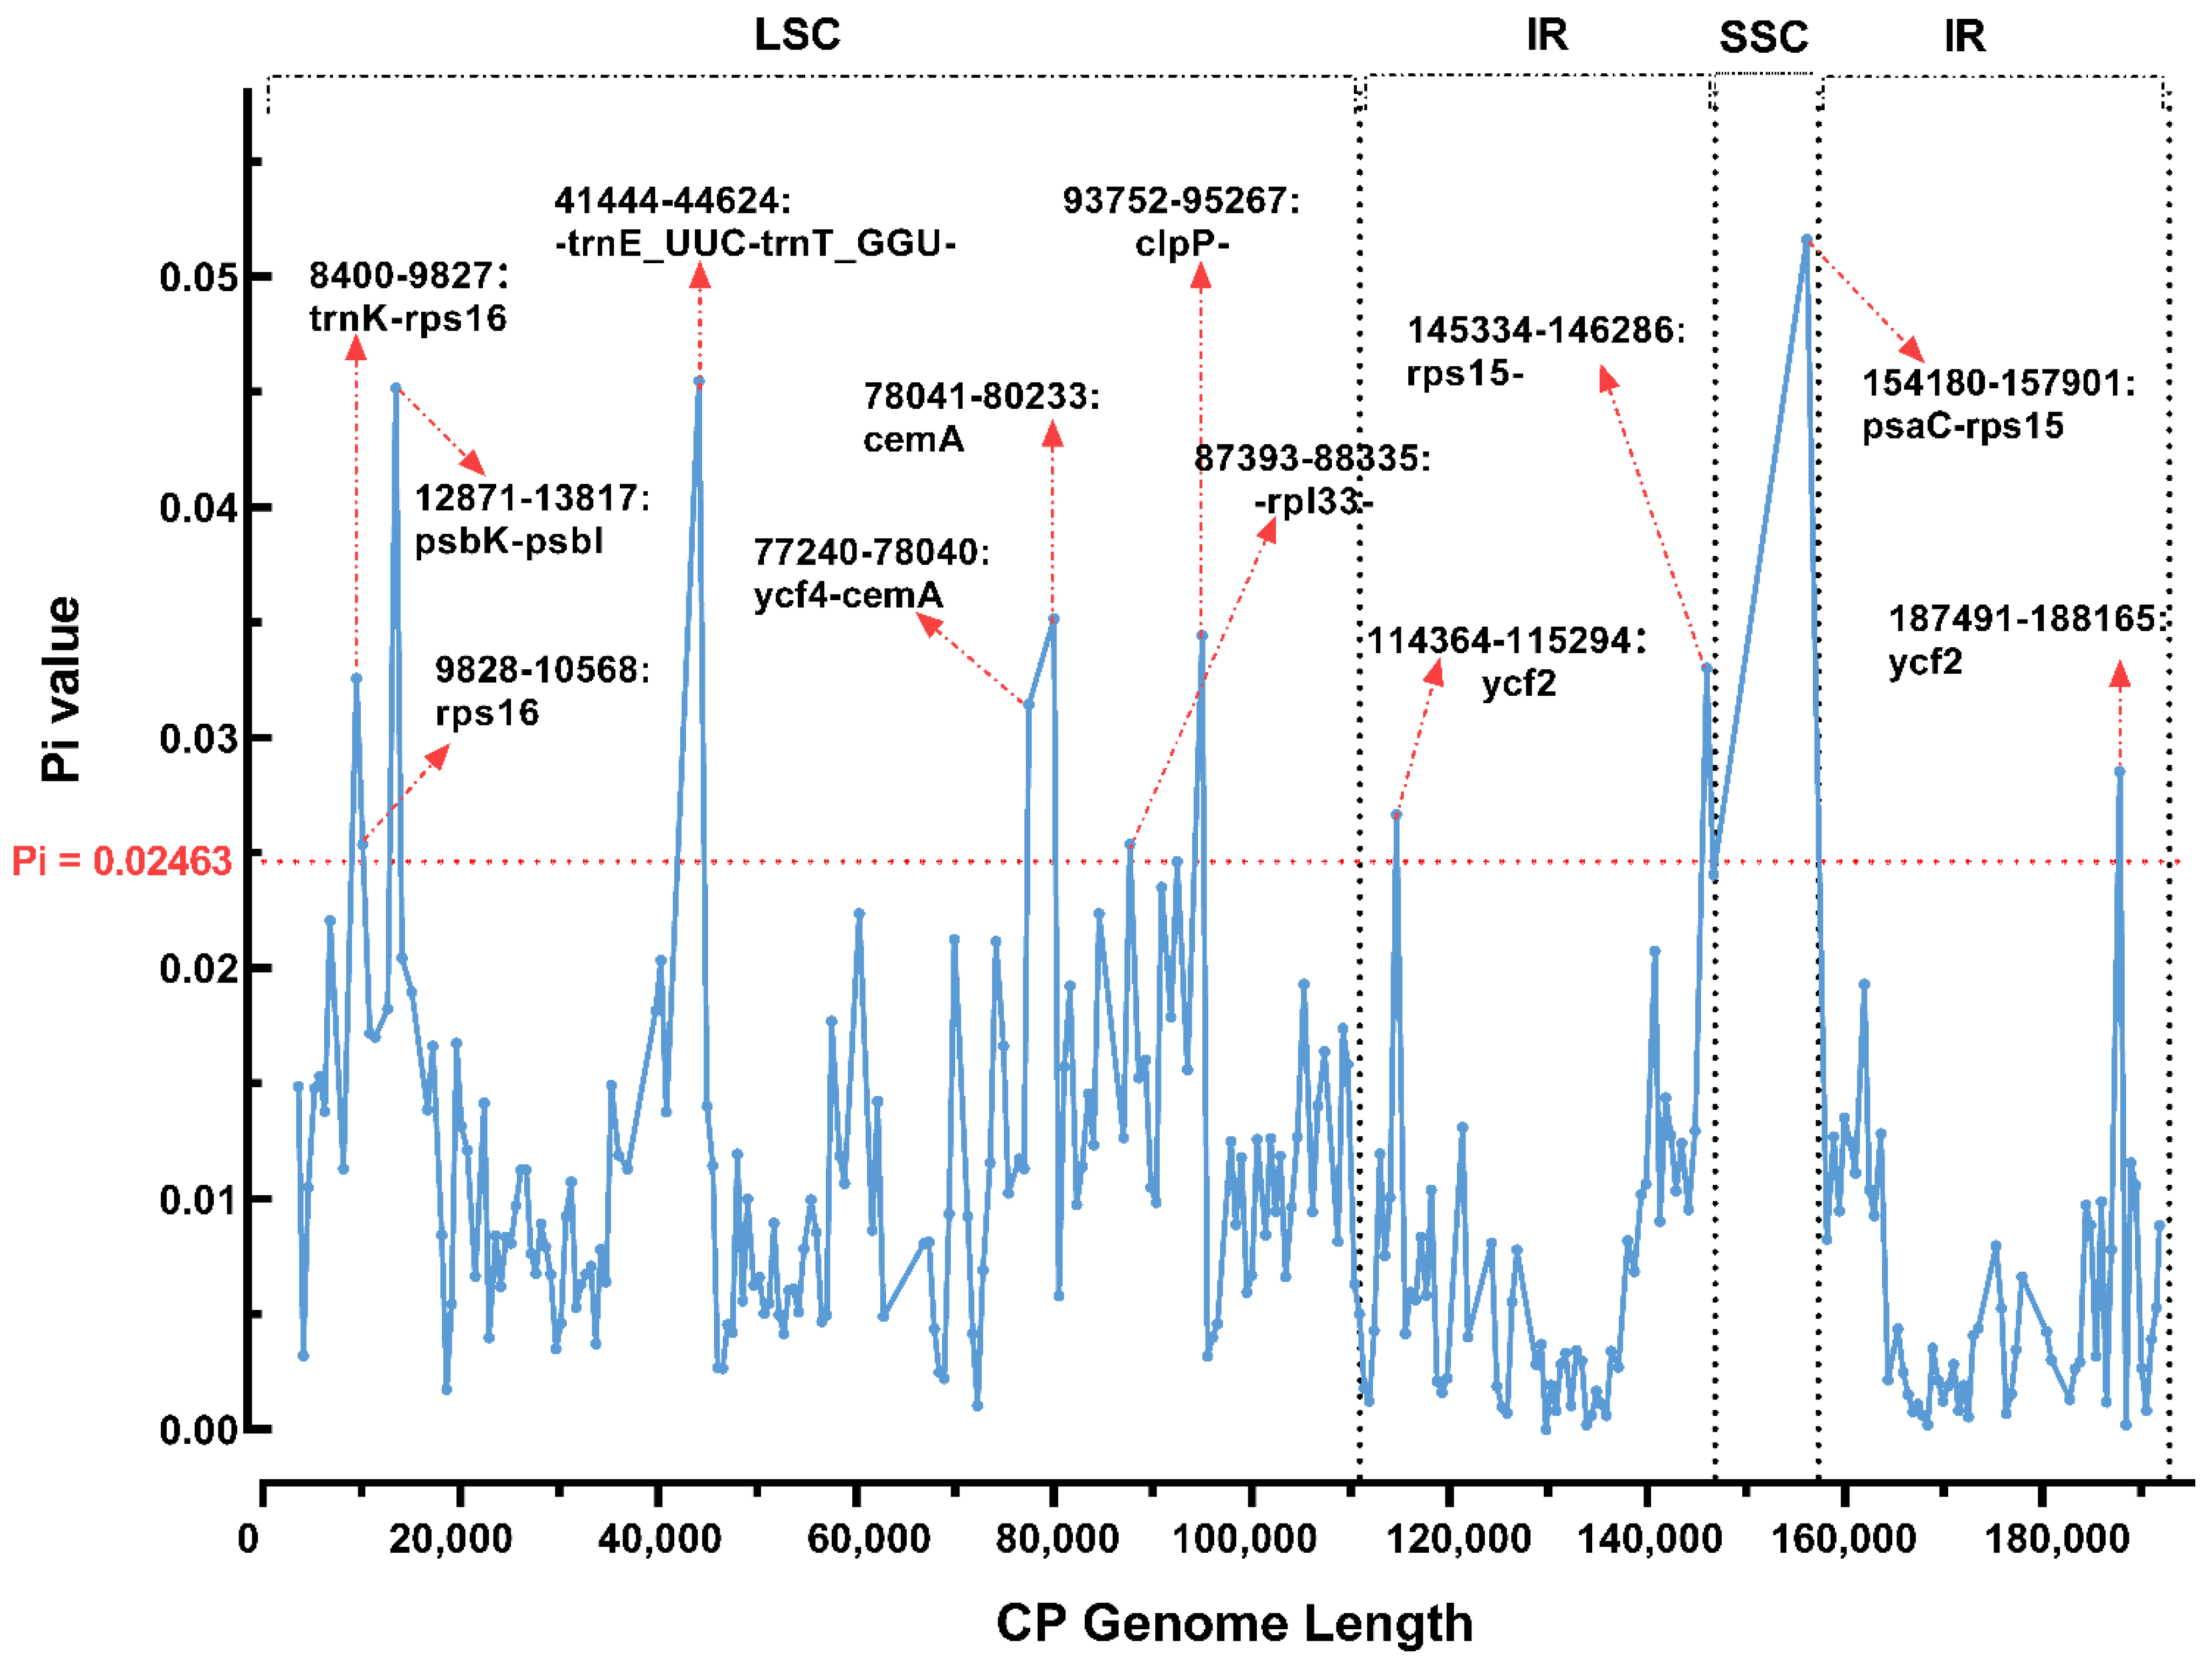
To determine divergent hotspot regions in the 19 Paphiopedilum species, we compared the Pi values of the cp genomes using DNASP software. The 19 Paphiopedilum species Pi values ranged from 0 to 0.0516 (Figure 3). The mean nucleotide diversity value of the whole cp genome was 0.00962, while the corresponding values of the LSC, SSC, and IRs were 0.01194, 0.31009, and 0.00610, respectively. Overall, the single copy regions Pi values were higher than those of the repeat regions, suggesting that the single copy regions, particularly the LSC, might be regarded as potential divergent hotspots of Paphiopedilum. The mean Pi values of the intergenic and genic regions were also calculated. The sequence divergence was 0.02271 in the intergenic regions, which was higher than that in the genic regions (0.00732) of these chloroplast genomes. This was consistent with the results of MVISTA analysis (Figure S1). Furthermore, we eventually identified 12 specific mutational hotspot regions (eight in LSC, two in IRs, and two crossing the IR/SSC border) including trnE_UUC-trnT_GGU, rps16, psbK, psaC, rps15, ycf4, cemA, clpP, rpl33, and the pseudogene fragments ndhD, etc., which exhibited remarkably higher Pi values (>0.02463). Furthermore, the identified hotspot regions were employed to reconstruct the ML tree, jointly for all regions and separately for each region, respectively. The ML tree constructed by the concatenated regions maintained the similar topological structure with the tree constructed by the whole cp genomes, while the four identified hotspot regions including trnK-rps16, trnE_UUC-trnT_GGU, clpP and the psaC-rps15 also performed preferable discrimination ability for the classification of the studied Paphiopedilum species (Figure S2).
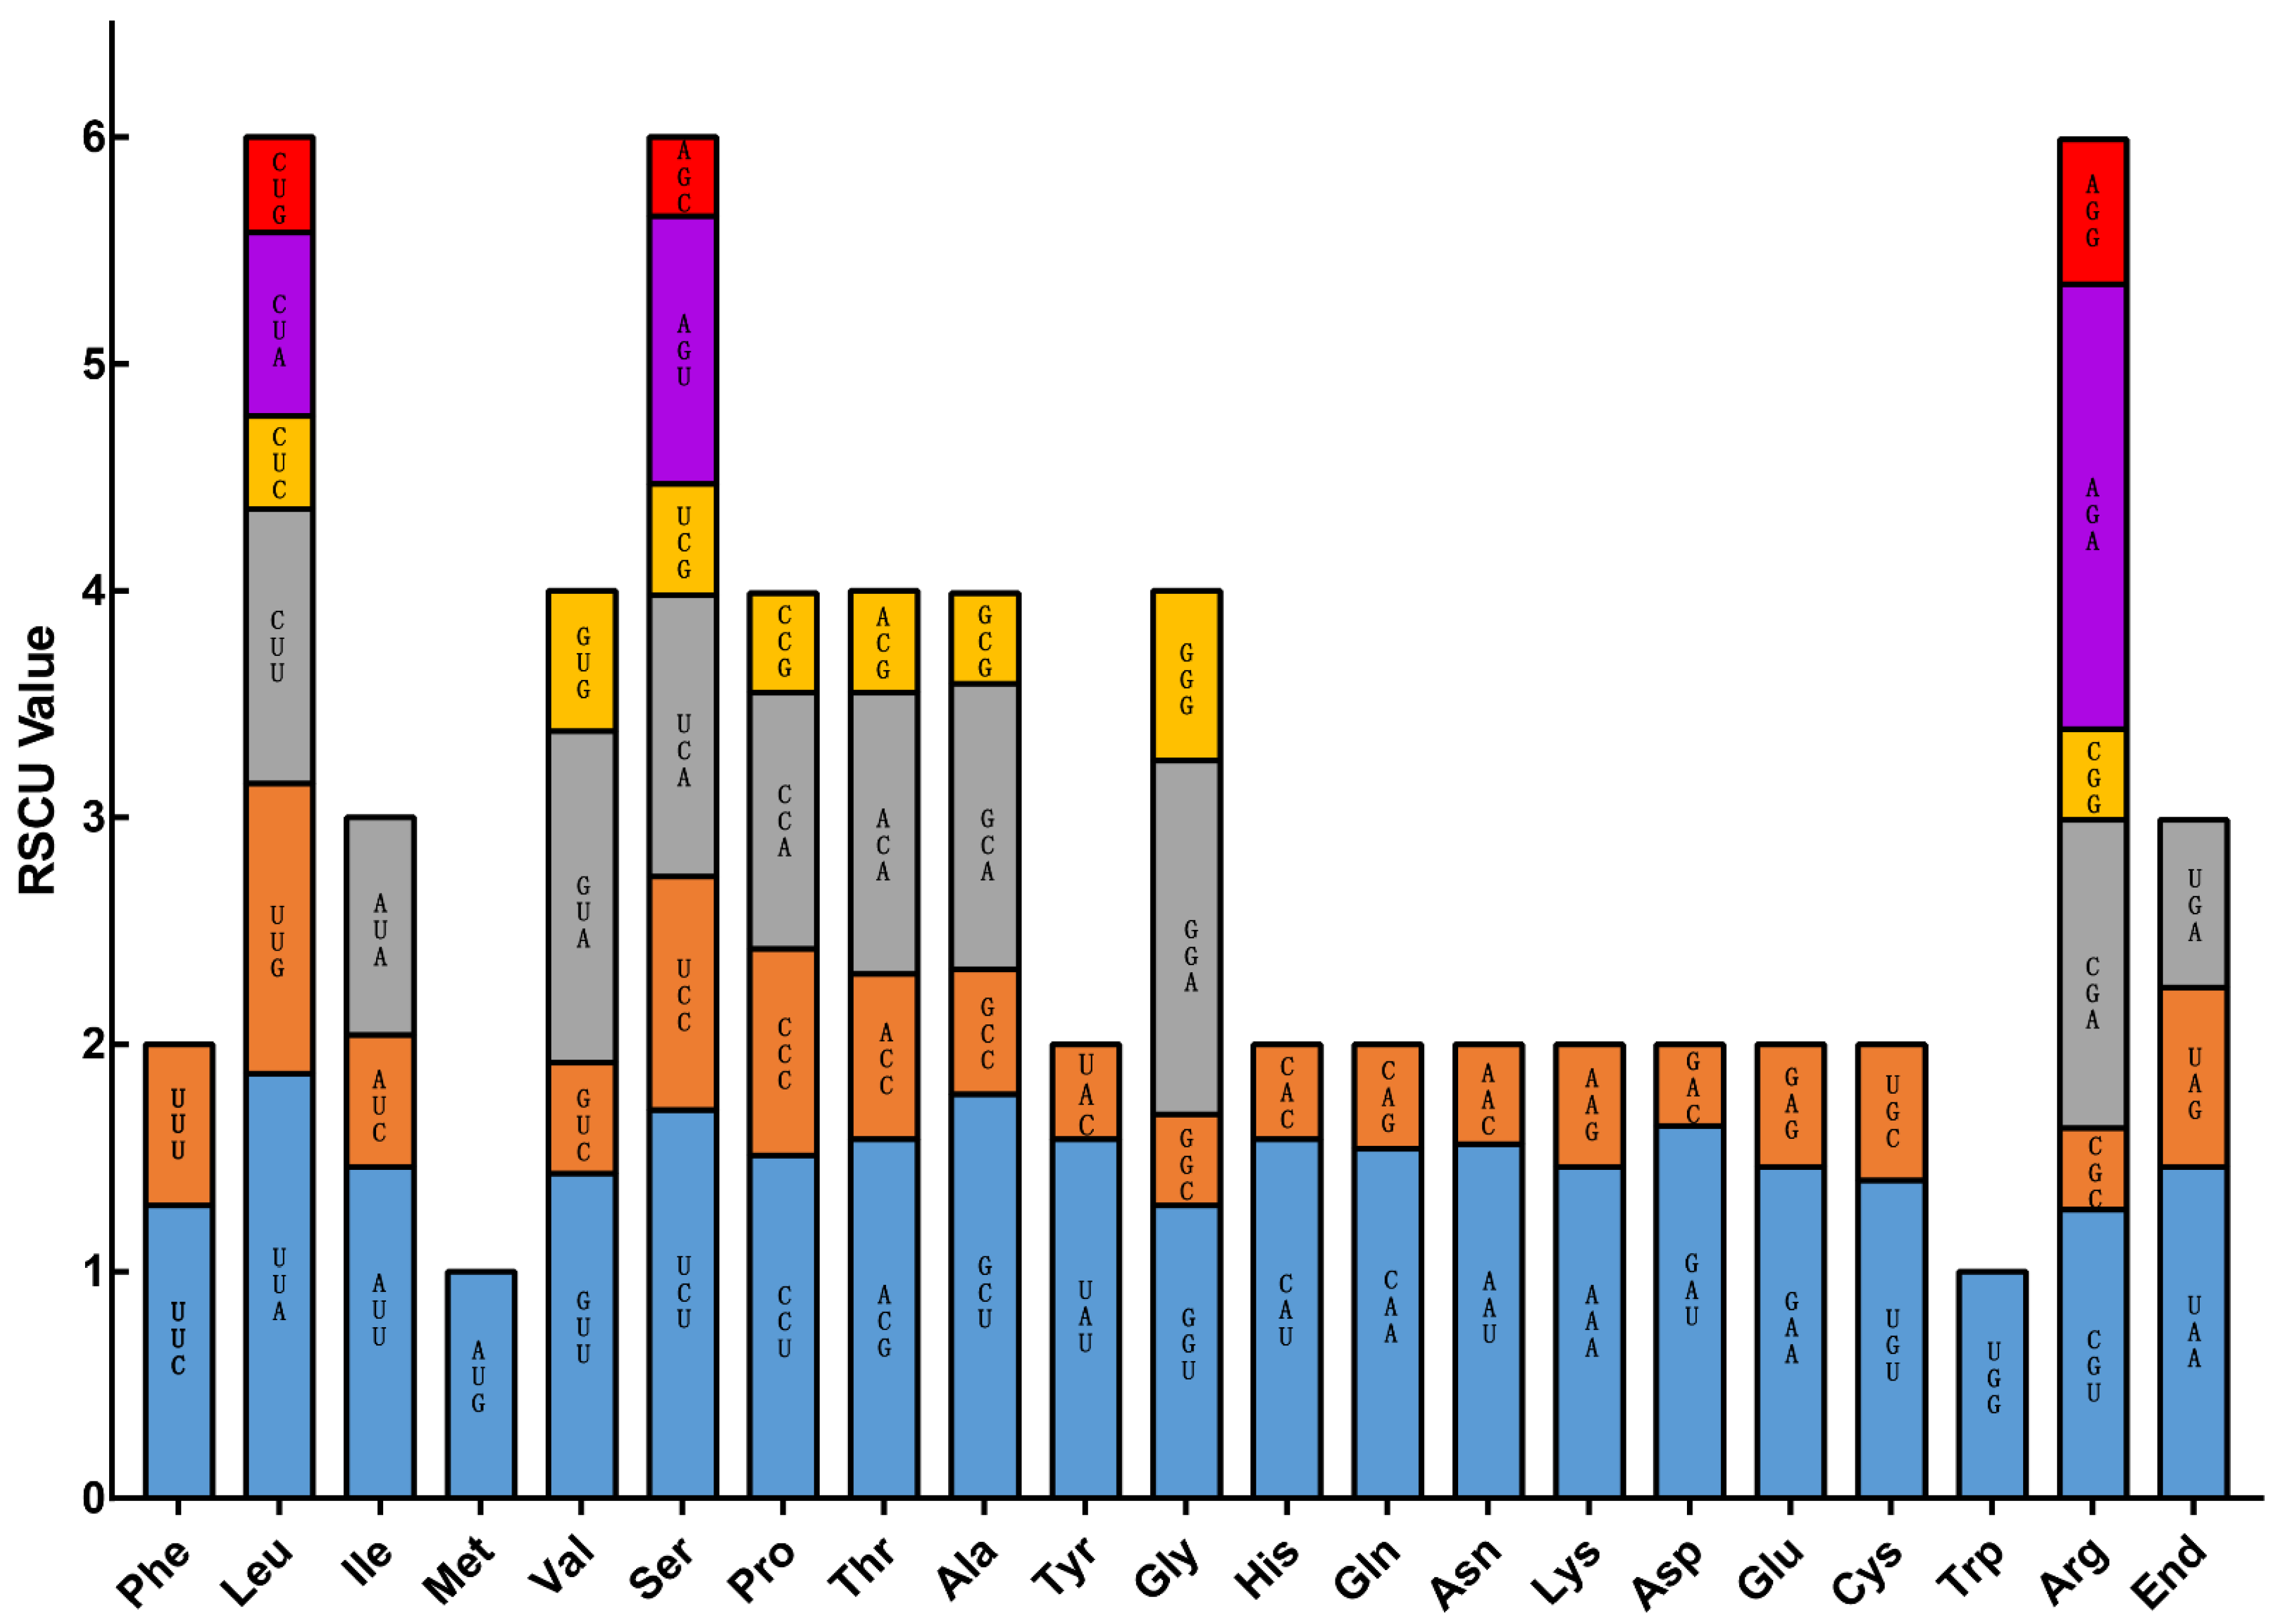
The codon usage frequency of PCGs for 19 Paphiopedilum species was estimated. The Bacterial and Plant Plastid Code was adopted in this analysis. The identified PCGs encoded by codons ranged from 22,135 to 25,525, which corresponded to P. malipoense and P. emersonii, respectively. UAA, UAG and UGA were considered termination codons (Table S2). For Paphiopedilum, we identified that the UUA codon that encoded leucine (L) presented the highest RSCU value (1.87), whereas the GAC codon, encoding for aspartic acid (D) had the lowest RSCU value (0.36). The AAA codon, encoding for lysine (K), was the most frequent amino acid with >1000 occurrences in most of the 19 Paphiopedilum species, while the UGC codon encoding for cysteine (C) had the lowest usage (71 to 89) among these species (Figure 4). In addition to the general AUG initiation codon, other types of initiation codons were found for several PCGs in some species, such as ACG, UUG, and AUA in the rpl2 gene, AUU in the petN gene, AUU in the ycf1 gene, as well as CUG and GUG in the rps19 gene (Table S3).
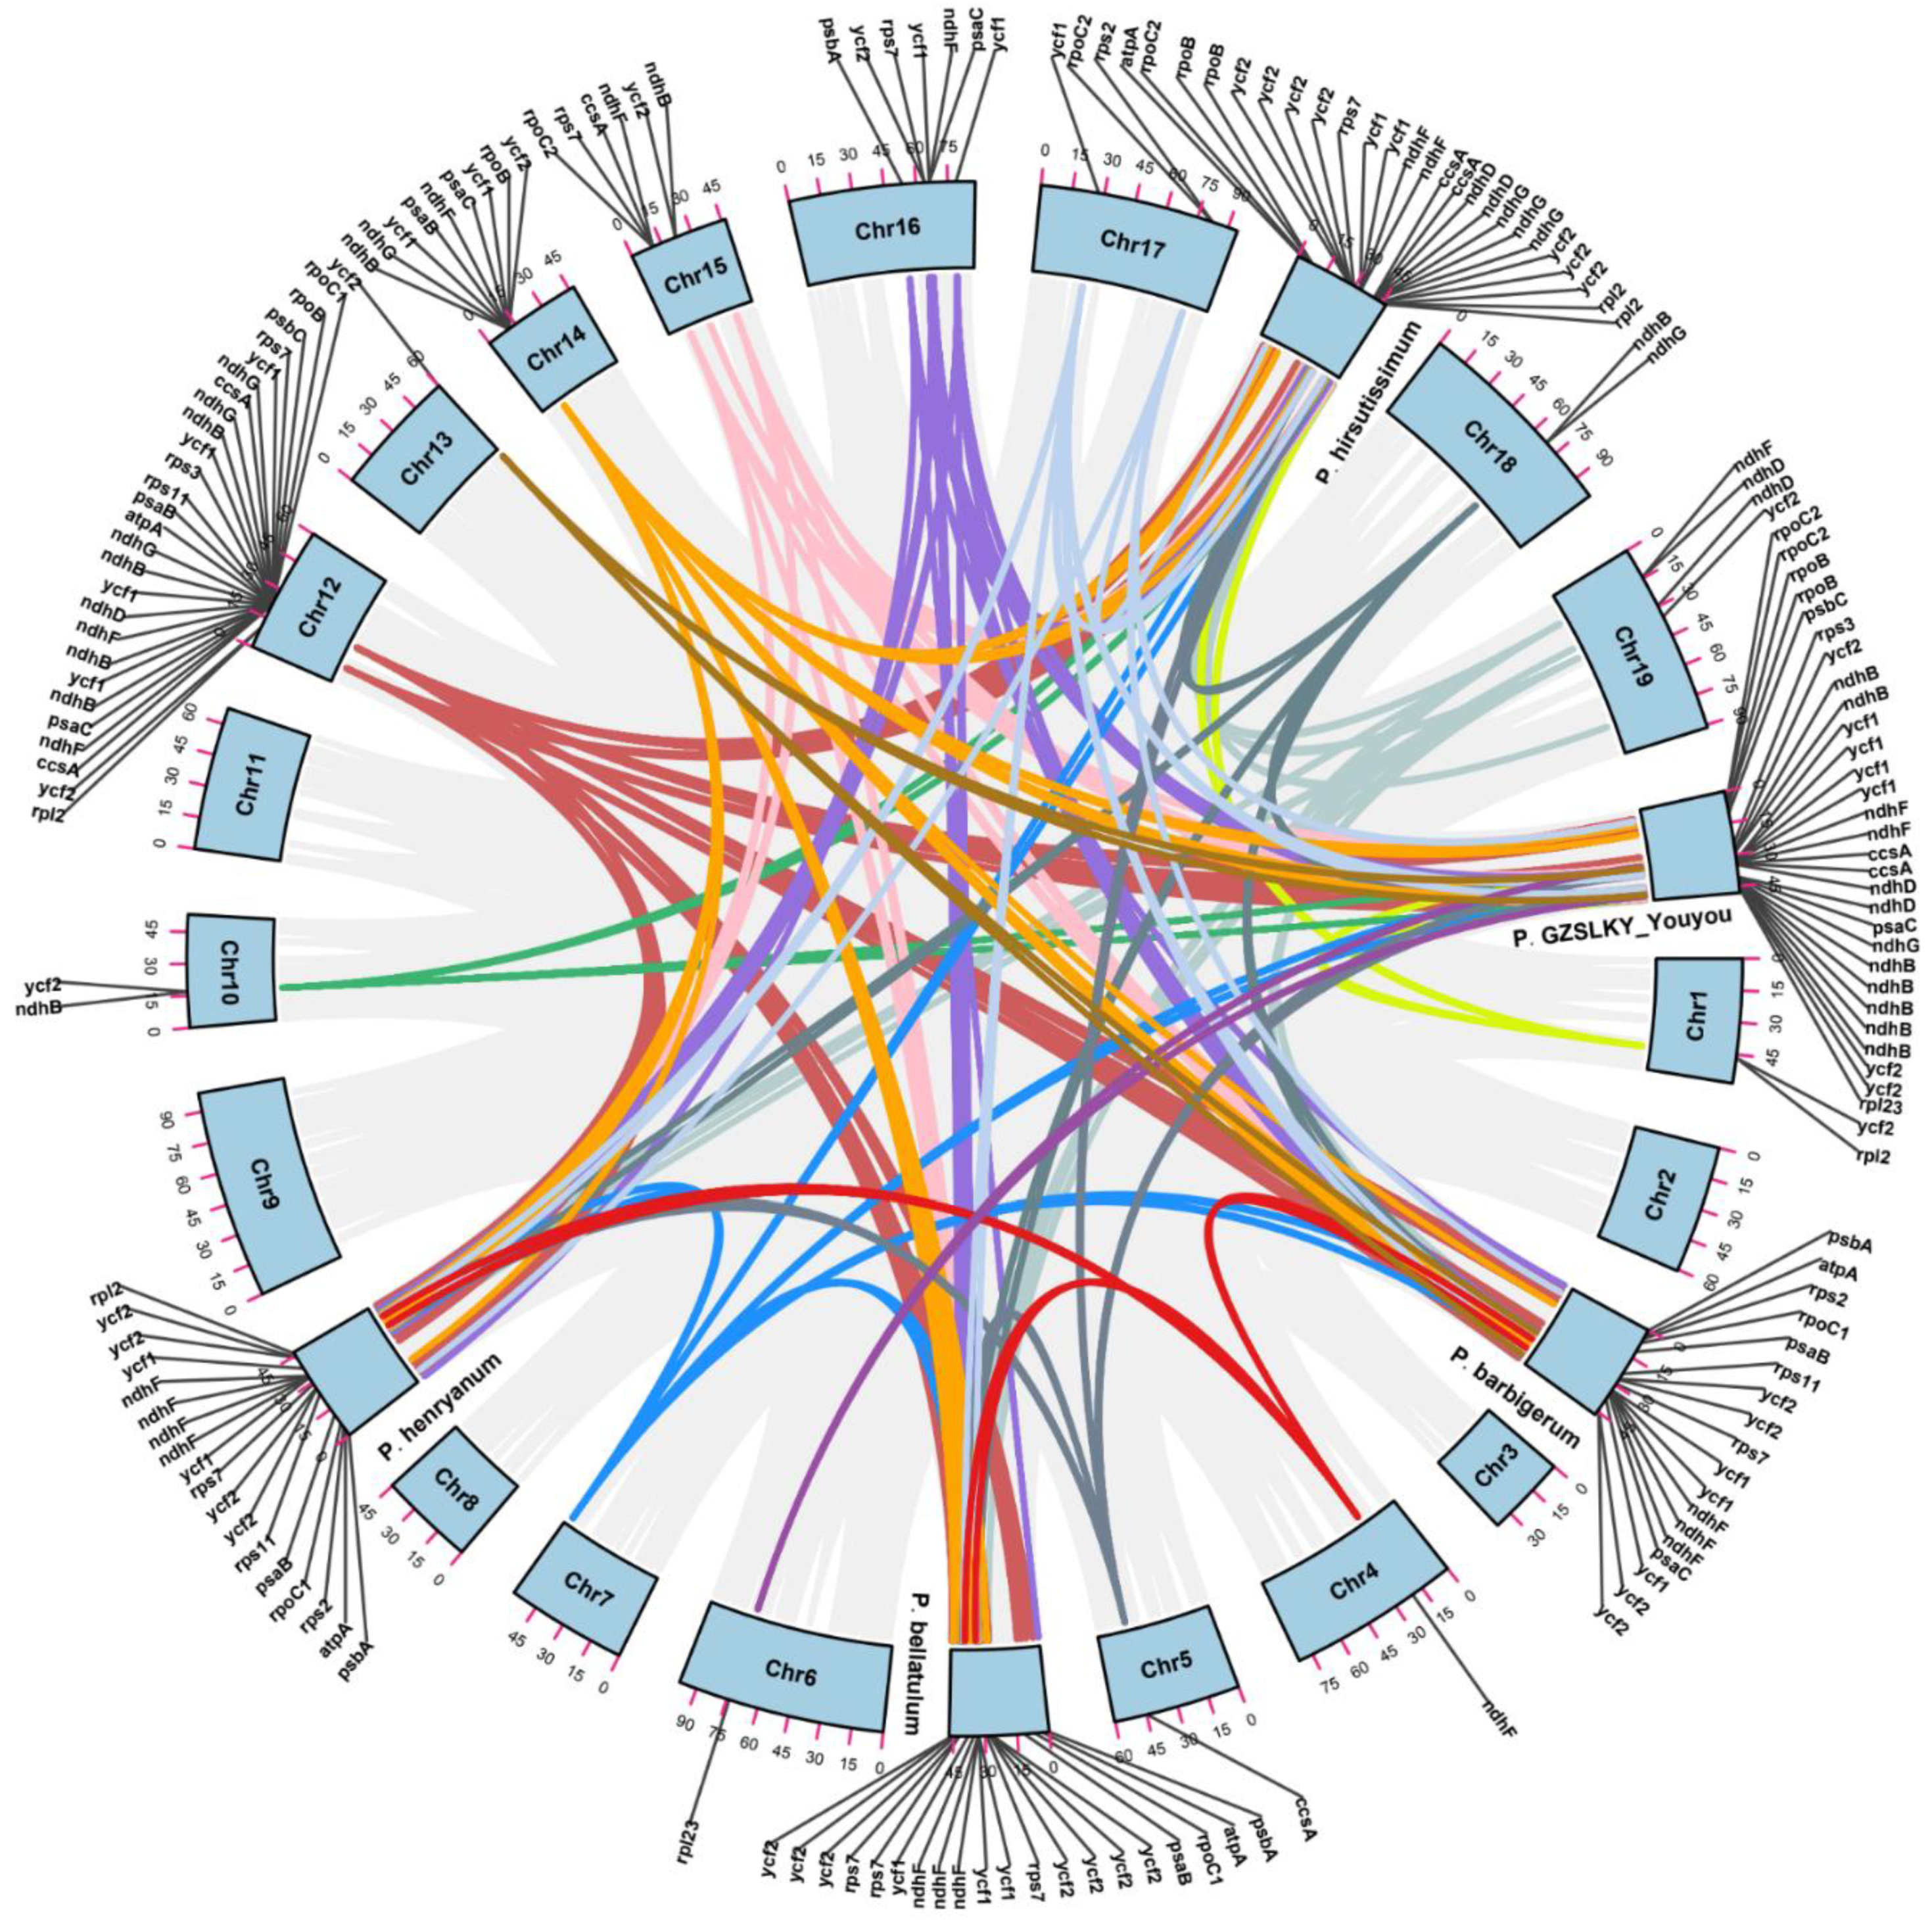
To better understand the origins and evolution of the cp genome and its relationship with the nucleus, the homologous genes shared by the cp and nuclear genomes were detected and identified. Due to the lack of genome data resources for Paphiopedilum, the nuclear genome data of closely related Dendrobium chrysotoxum species were adopted as the reference genome. The results revealed that the cp and nuclear genomes had high synteny. The colinear homologous segment counts ranged from 1429 (P. bellatulum) to 1525 (P. ‘GZSLKY’ Youyou), and these similar fragments were primarily located on chromosome 4 (2589 hits), chromosome 12 (1917 hits), chromosome 13 (2350 hits), chromosome 15 (2097 hits), and chromosome 16 (3082 hits).
In contrast, chromosomes 2, 3, 5, 7, 8, and 10 exhibited relatively low synteny, with hit numbers of <1000 (Table S4). Due to the high conservatism of the cp genome, the five newly assembled cp genomes were employed to represent Paphiopedilum for the screening of genes shared by the cp and nuclear genomes, respectively (Figure 5). A total of 21 categories of gene fragments were detected among the cp and nuclear genomes, of which ndhF, ycf1, and ycf2 were collectively observed in the five cp genomes. For the nuclear genome, the shared gene fragments were primarily distributed between chromosomes 12, 14 and 16, and were primarily members of the ndh and ycf gene families.

3.3. Repeat Structure and SSR Analysis

Using MISA analysis, a total of 2714 SSRs were identified in Paphiopedilum cp genomes. For each Paphiopedilum species, the numbers of SSRs ranged from 117 (P. dianthum) to 174 (P. villosum). The A/T mononucleotide repeats were the most abundant SSRs, which accounted for ~40.16% of the total SSRs in Paphiopedilum, while the G/C repeats were relatively rare (1.77%). The number of penta- and hexanucleotides SSRs were slightly less than the other repeats, such as di-, tri-, and tetranucleotides (Table 3). In addition, the LSC regions contained the highest percentage of SSRs (70.41%), followed by the IR (27.11%) and SSC regions (2.48%). Among a total of 2714 SSRs, 1834 loci were in the intergenic regions (60.30%), while only 880 loci were in the genic region. A total of 20 shared SSR motifs were identified among these cp genomes. Several unique SSR motifs existed only in particular species, of which most were penta- or hexanucleotides repeats. The P. venustum possessed the largest number of unique SSR motifs, including TCTAT, ATTTG, TTGTA, TCAATA, and ATATG (Figure S3).
In addition to SSRs, we also further used REPUTER and TANDEM REPEATS FINDER to identify the repeat sequences of the cp genomes (Table 3). Four categories of interspersed repeats containing forward, reverse, complement, and palindromic repeats were detected, respectively. A total of 10,347 interspersed repeats were identified in Paphiopedilum, with the forward repeats being the most abundant (3457), followed by the palindromic repeats (3030). P. armeniacum possessed the largest number (909) of interspersed repeats, while P. dianthum contained the minimum number (275) of interspersed repeats. Further, a total of 3578 tandem repeats were found in Paphiopedilum. The lengths of the tandem repeats were primarily distributed within the range of from 1 bp to 30 bp, followed by 31 bp to 60 bp; however, the number of tandem repeats over 90 bp were relevantly rare.

3.4. Phylogenomic Analysis

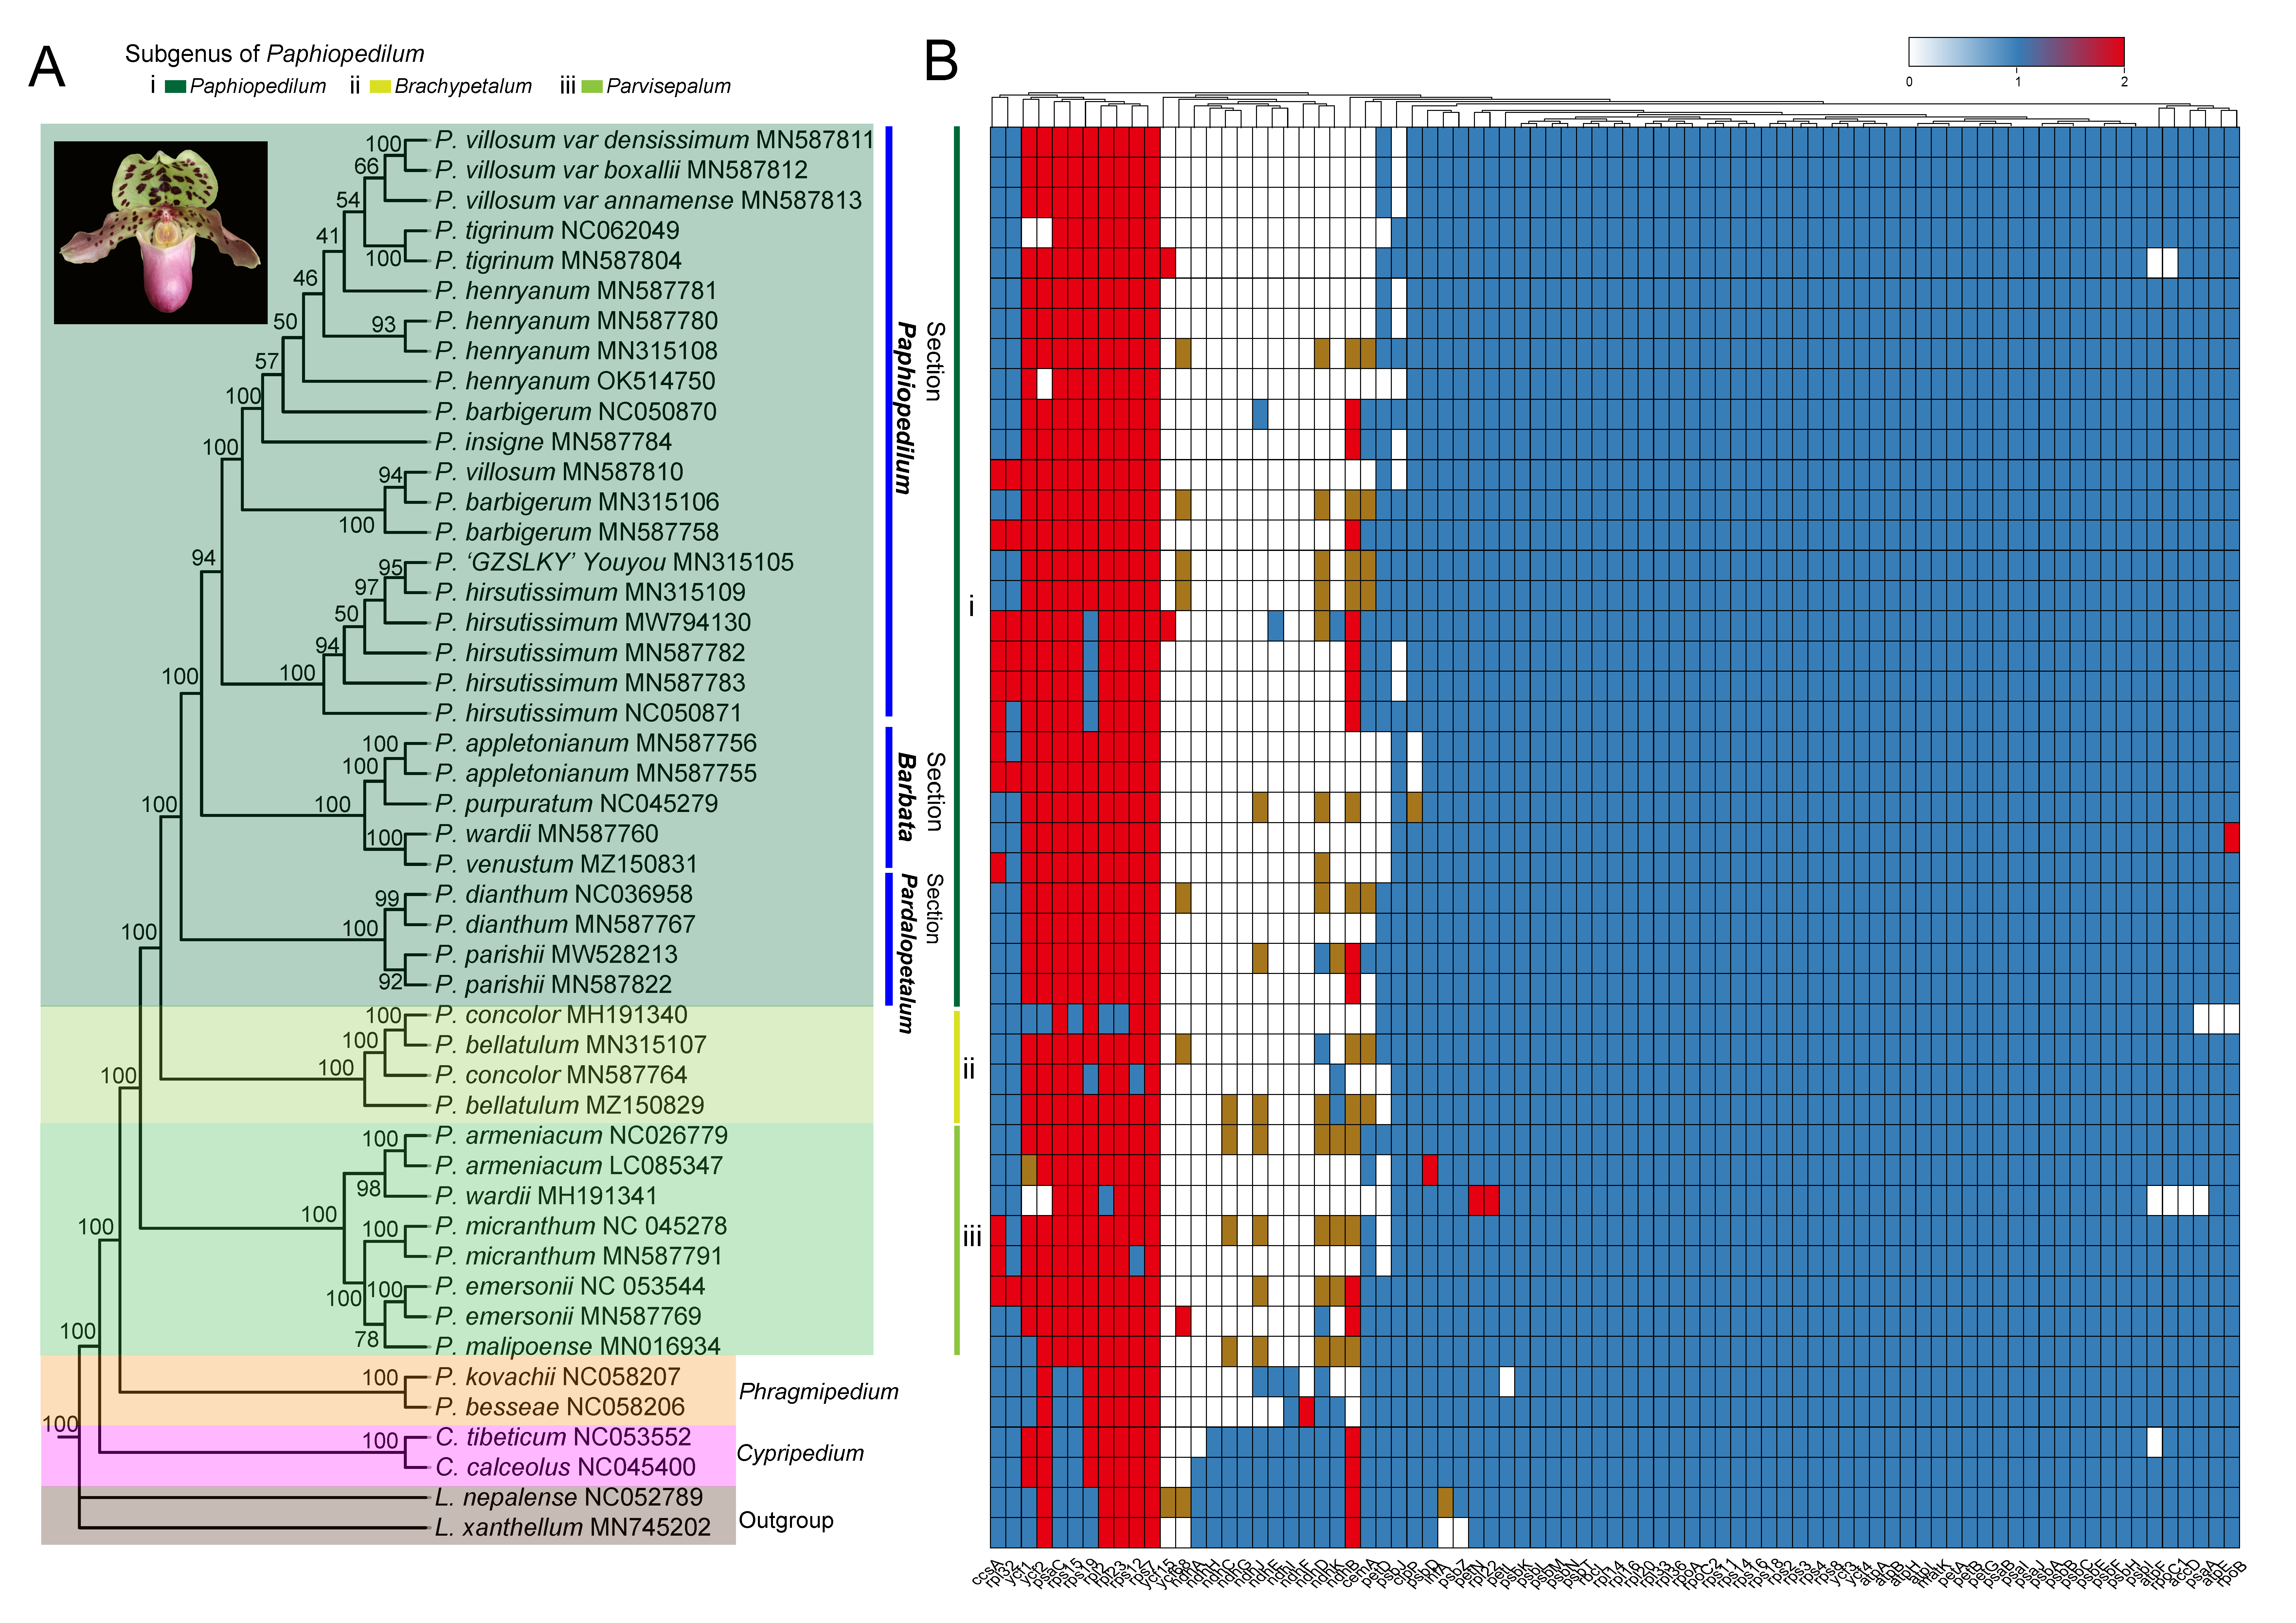
To construct the phylogenetic relationships of the forty-seven cp genomes (species names and GenBank accession numbers can be found in Table S1), we employed an ML phylogenetic tree to determine the phylogenetic positions. These cp genomes included forty-one Paphiopedilum individuals, two Phragmipedium individuals, two Cypripedium individuals and two Lilium individuals as an outgroup (Figure 6A). Simultaneously, the existence or absence of protein coding genes in each species was also identified and counted (Figure 6B). The gene loss in species of the same genus was similar. Most genes contained one copy whereas some protein coding genes possess two copies including rps19, rps12, rps7, ycf2, rpl2, rpl23, ycf1, psaC and rps15.
After pruning, the alignment results were further employed to construct the ML tree. The results indicated that the topologies of the ML tree basically yielded an anticipated structure. The two Lilium species, as the outgroup, were located in the basal position of the ML tree. The Orchidaceae species employed in the phylogenic analysis could be divided into three major clades corresponding to Cypripedium, Phragmipedium, and Paphiopedilum. With Cypripedium being the basal group, the Phragmipedium and Paphiopedilum were gathered into a same clade, which reflected that the two genera had a relatively close relationship. The Paphiopedilum species were further classified into three subgenera: Subg. Paphiopedilum, Subg. Brachypetalum and Subg. Parvisepalum. The Subg. Paphiopedilum and Subg. Brachypetalum were closer in relationship with 100% bootstrap values. Furthermore, the Subg. Paphiopedilum, which contained the greatest number of studied species, could be divided into the three Sections corresponding to nine species (twenty individuals) in Sect. Paphiopedilum, four species (five individuals) in Sect. Barbata, and two species (four individuals) in Sect. Pardalopetalum, and each Section also had a relatively high support value for 100% (Figure 6A). Similar topologies also appeared in the ML tree constructed based on the identified divergence hotspots regions (Figure S2).

3.5. Selective Pressure Analyses

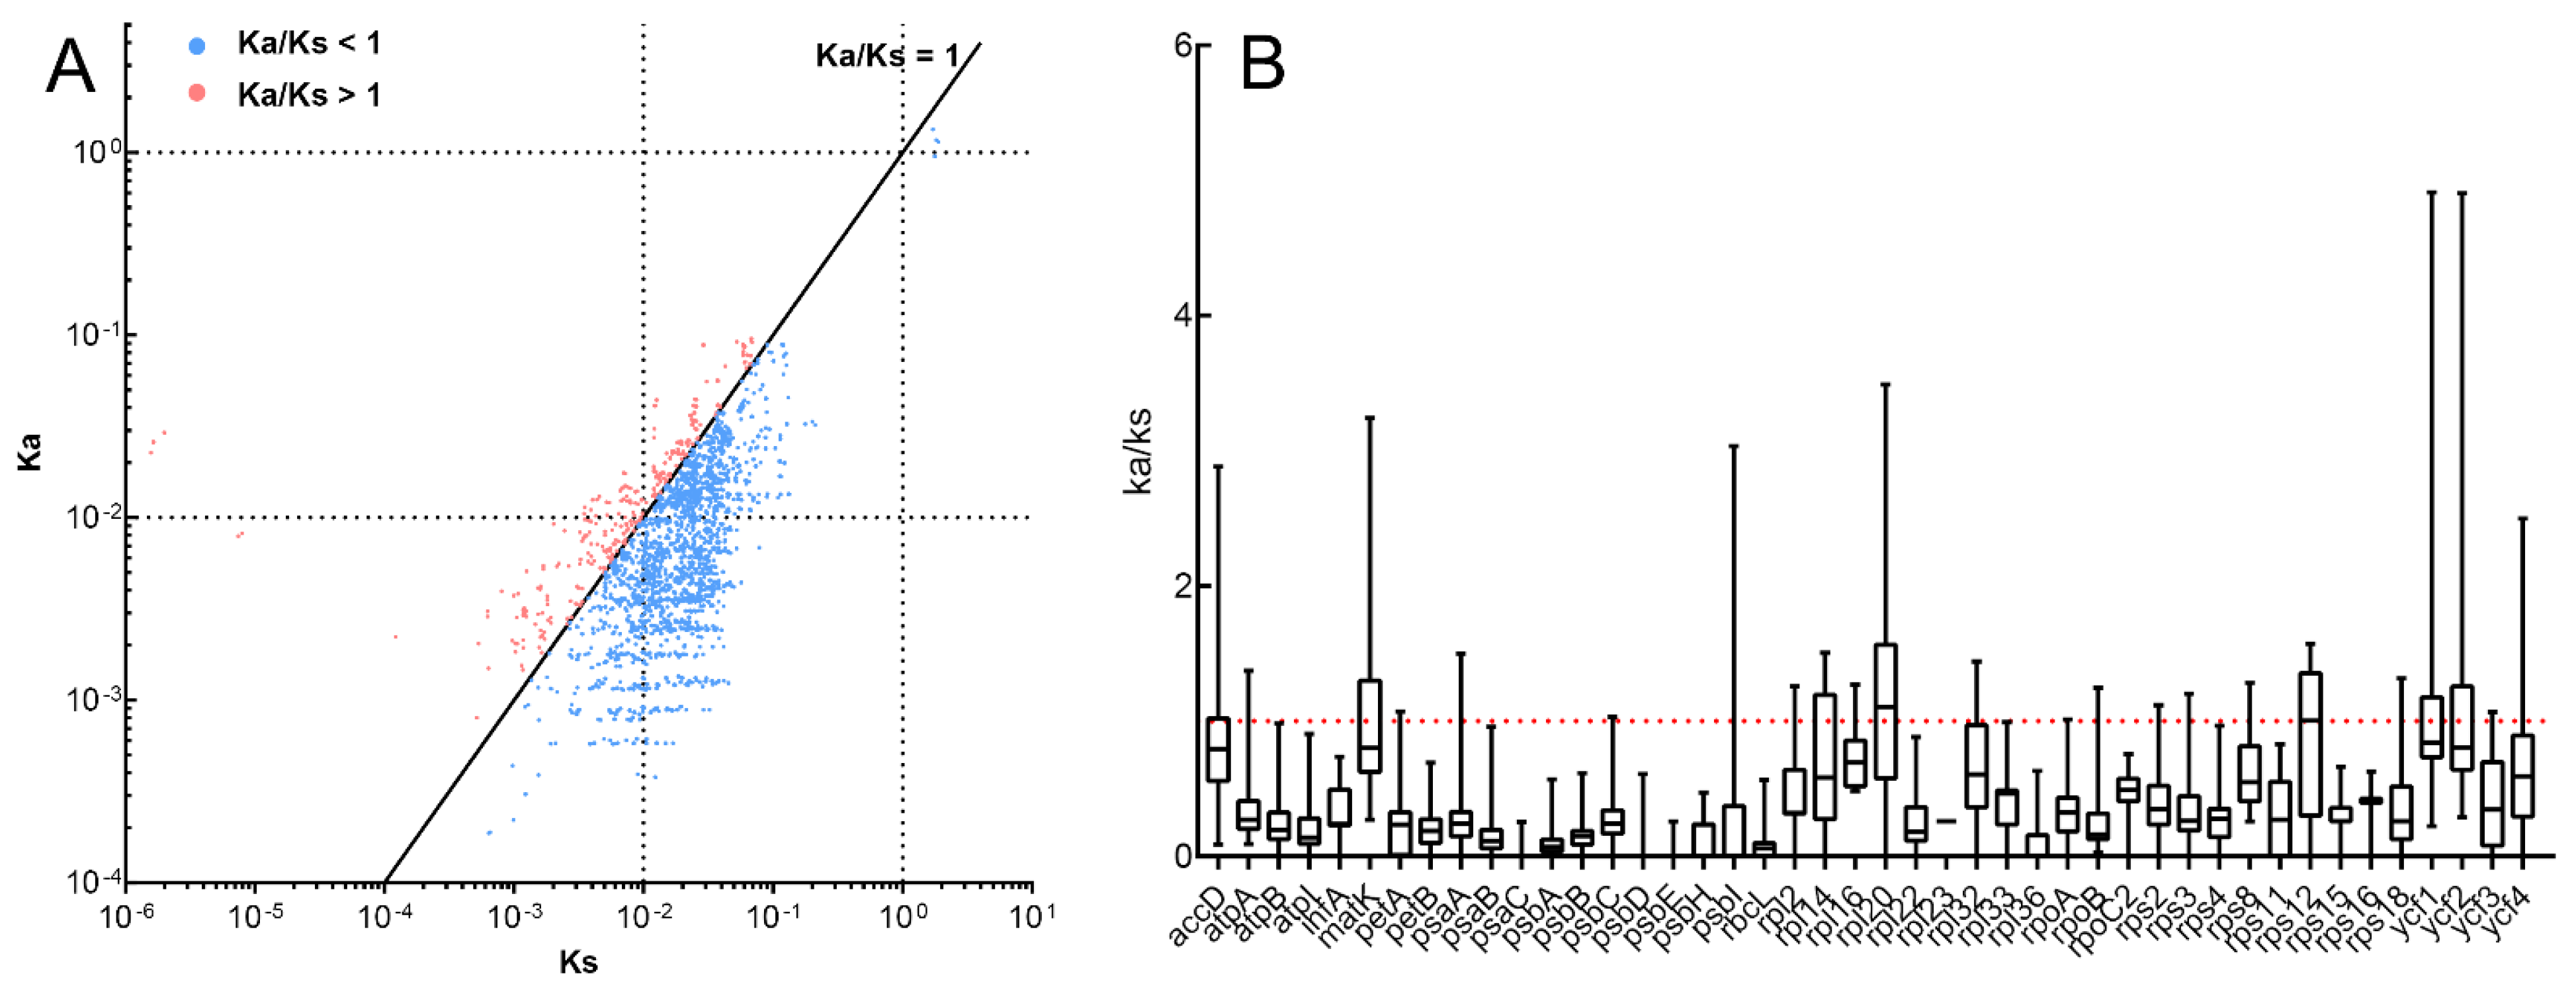
We estimated the Ka/Ks ratios at the species level by concatenating all 61 shared PCGs into a super-matrix. For Paphiopedilum species, the Ka/Ks ratios were ~0.52, which inferred that at the complete chloroplast protein level, the Paphiopedilum species have been experienced to a strongly purifying selection (Figure 7 and Table S5).
The Ka/Ks ratios were also performed separately for all 61 PCGs among the 19 cp genomes (Figure 7B). Among the 10,431 pairs of PCGs, 612 pairs presented a Ka/Ks value of >1.0 (Figure 7A and Figure S4). Therein, when compared with other species, P. bellatulum and P. tigrinum possessed the largest number of gene pairs (99) under positive selection, respectively. Several genes (accD, matK, psbM, rpl20, rps12, ycf1, and ycf2) often had Ka/Ks ratios of more than 1.0 in a few species, which implied potential positive selection. Most of the other genes had a Ka/Ks ratio range of from 0.1–0.3, which implied strong purification (Figure 7B and Figure S4).
The variation and selectivity were also explored within a given species (Table S6). The P. wardii contained the largest number of SNPs (5632) and InDels (708), while the P. parishii, P. tigrinum and P. dianthum presented a relatively lower differentiation which occurred only 1, 1, and 2 SNPs and 10, 3, 12 InDels, respectively. The results of selection pressure analysis showed that most species contained a Ka/Ks value < 1 with the significant p value (<0.05), suggesting the purification selection. While the P. dianthum P. tigrinum and P. henryanum possessed high Ka/Ks value correspond to 1.3390, 0.9553, and 0.9824, respectively, which implied potential positive selection in these given species (Table S6).
By comparative cp genomes with species based on ML tree, we found that the most individuals from one species are clustered as one group, including P. emersonii (NC_053544 and MN587769), P. micranthum (NC_045278 and MN587791), P. armeniacum (NC_026779 and LC085347), P. dianthum (NC_036958 and MN587767), P. parishii (MW528213 and MN587822), P. appletonianum (MN587755 and MN587756), P. hirsutissimum (MN315109, MN587782, MN587783, MW794130, and NC_050871), P. henryanum (MN315108, MN587780, MN587781, and OK514750) and P. tigrinum (MN587804 and NC_062049). However, P. wardii (MH191341) was not grouped together within species, which clustered into Subg. Parvisepalum (Figure 6A). P. concolor and P. bellatulum (MN315107, MN587764, MZ150829, and MH191340) were mixed together rather than exactly separate into two species clearly in phylogenetic tree (Figure 6A). In addition, three varieties (MN587811, MN587812, and MN587813) were divergent from P. villosum (MN587810), and they closely related to P. tigrinum (Figure 6A).

4. Discussion

The Orchidaceae family comprises one of the richest species in the flowering plants that includes myriad endangered, rare, or threatened species [20,60]. As a fascinating genus of Orchidaceae, Paphiopedilum is typically referred to as the “tropical slipper orchid” with high horticultural and ornamental value due to its typical flower traits of its shape [61]. However, because it growths in fragile and peculiar environmental conditions, it is extremely vulnerable to human excavation and habitat destruction [9,10,11,12,13,14,15,16,17,18,19,62].
Recently, there have been many genetic resources, cp genome sequences, and analyses of genetics to help explain comparation, phylogenetic relationships and the evolutionary process of Orchidaceae [11,13,14,63,64,65]. In this study, we assembled five cp genomes of the Paphiopedilum species (Table 1 and Figure 1) and compared the complete cp genomes of nineteen Paphiopedilum species. They exhibited classic quadripartite structures and included 119 to 127 genes consisting of 74 to 81 protein coding genes, 37 to 38 tRNAs, and four rRNAs. In these cp genomes, 152,130 bp (P. tigrinum, MN587804) to 169,786 bp (P. wardii, MH191341) were obtained in length, whereas the overall GC contents ranged from 34.00% (P. wardii, MH191341) to 36.17% (P. hirsutissimum, MH191341) with an average value of 35.59% (Table 1, Tables S1 and S6). A cp genome size of nine Paphiopedilum species was reported, ranging from 154,908 bp to 161,300 bp [9], 159,795 bp to 160,040 bp (Coelogyne) [63], and 197,815 bp to 212,668 bp (Cypripedium subtropicum, the largest cp genome in Orchidaceae) [64], which indicate that the size of cp genomes in orchid species had extremely diversity [11,63,64,65]. Although it was apparent that their structures and organization exhibited relatively high conservation, the GC contents of Paphiopedilum cp genomes were relatively lower than those of other Orchidaceae species [66,67,68], which might be interpreted by natural selection [69]. However, in genus Cypripedium, interestingly, the GC content (28.2% and 30.5%) of cp genomes are also much lower than our present cp genomes [64].
From different environments, the closely related plant species marked differences GC content in the DNA sequences, which had a direct effect on the protein amino acid sequences in their typical environments [70]. Low GC contents genes were more easily transcribed than those with the converse, as GC pairs possess three hydrogen bonds, which makes them more stable than AT pairs with two hydrogen bonds [71]. Consequently, selective pressures of the unique habitats (humidity and shading) of Paphiopedilum shade plants resulted in a lower overall GC content in their cp genomes.
In addition to the GC contents, the lengths between these cp genomes were variable (Table 1, Table S1, and Figure 1). In general, the lengths of IR regions often determined the total lengths of cp genome sequences [72]. Two inverted repeats (IRa and IRb) could be conserved in the cp genome against the main structural rearrangements [73,74]. Furthermore, the intervals of the four cp genome regions played a critical role in the evolution of some plant species via homologous recombination-induced repair mechanisms [75]. The structure of the Paphiopedilum cp genome was conservative with no obvious region rearrangements detected, which was consistent with previous studies [9]. Thus, we speculated that the variations in the cp genome length in Paphiopedilum might be induced by IR expansion and SSC contraction, because of the instability and shifting of IR/SSC boundaries (Figure 2).
In some angiosperms, dramatic changes in the IR regions occurred. For example, the length of the IR region in Pinus thunbergii was only 495 bp [76], while in Pelargonium hortorum it was ~76 kb [72]. In general, the average cp genome of angiosperms was ~151 kb and the IR region was ~25 kb [77,78]. However, the cp genomes under study for Paphiopedilum showed both the longer total length (~158 kb) as well as IR length (~33.8 kb) (Table 1 and Table S1). A relevantly large (several kb) inverted repeats (IRs) expansion had also been reported in other angiosperm lineages, including Acacia [79], Inga [79], Erodium [80], Passiflora [81], and Pelargonium [82]. The plastome expansion was also common in orchid species, such as Cypripedium [64] and Cymbidium. In contrast to the expansion of the IR domains in cp genome, the SSC regions of Paphiopedilum species were greatly reduced in sizes and the gene numbers (Table 1 and Table S1), and even peculiar genes (e.g., psaC and ndhD) in SSC region, which were transferred from SSC to the IR regions in P. parishii, P. dianthum, P. armeniacum, and all five of the newly assembled species (Figure 2). In other Orchidaceae genus such as Coelogyne, the gene of rpl22 and ycf1 had shortened, whereas the length of the ndhF gene had increased, which was also caused by contraction of the SSC and the expansion of IRs [63]. While in other Orchidaceae genus Polystachya, the rpl22 gene in the LSC region was expanded by 23–66 bp to the IRB region caused by the IR expansion [65].
With the shifts in the boundaries of the IR region and SSC region, the contract of the SSC regions might be related to the ndh genes loss and several genes transfer from the SSC region to the IR region. In particular, the most ndh genes were pseudogenized or lost in Paphiopedilum, except for P. emersonii (ndhB), P. parishii (ndhB and ndhD), and P. concolor (ndhK) (Table 2, Figure 6). Niu et al. [83] reported that the ndh genes were strongly associated to the stability of the IR/SSC junction. Interestingly, the species that contained more pseudogenized ndh genes tended to gather into the basal clade of Paphiopedilum (Figure 6), which could infer that the loss or pseudogenization of ndh genes likely occurred much earlier, as the footprints of pseudogenic ndh genes were repeatedly and persistently retained in the ancestors.
Furthermore, the degradation and pseudogenization of the ndh genes were found in other Orchidaceae species (e.g., Erycina pusilla [84], Vanilla planifolia [85], and Liparis japonica [67]. The ndh gene variations were found in IR boundaries in Paphiopedilum species, and were considered to be attributed to the recombination of IRs. [11]. Although the pseudogene DNA did not encode proteins, it might still be functional and play a regulatory role akin to other non-coding DNA family genes [86]. In addition to the border shifts of IR/SSC, the underlying mechanisms of the degradation of ndh genes in Paphiopedilum warranted further in-depth exploration.
Lin et al. [87] proposed that the complexes of ndh loss likely raised the transition of its life history from photoautotrophic to heterotrophic. We speculated that the degradation of ndh genes in Paphiopedilum was the result of adaptive evolution to a low light environment. As with the results of other Orchidaceae studies (as is typical of epiphytes or lithophytes of same the species in Paphiopedilum living beneath dense canopies with insufficient light), Paphiopedilum could utilize low light only within a relevantly narrow ecological amplitude of light adaptation, which exhibited the characteristics of shade plants.
Furthermore, the transfer of genes to the nucleus might be another reason for the gene loss and pseudogenization in the cp genome [87,88,89]. In this study, the ndh and ycf gene fragments frequently occurred in the nuclear genome (Figure 5), which indicated that the gene transfer events might have occurred during the evolutionary process of Paphiopedilum cp genomes. Gene transfer in Paphiopedilum might be explained by the decreased demands on photosynthesis and plastid translational capacities due to the adaptation to the unique habitat, which increased the success rate of gene transfer from plastid to the nucleus [80].
Codons were beneficial genetic information for the transmission, and were used in the genomes evolution as their nucleic acid sequences and proteins were linked [90]. The usage of codons was different in different species [91] due to various factors such as codon hydrophilicity, gene length, abundance of tRNA, base composition, natural selection, and gene expression rate [92]. The average number of codons (24,239) in Paphiopedilum was relevantly low compared with other species [93], which might have been due to the loss and pseudogenization of certain protein coding genes (CDS). Additionally, the results of RSCU analysis indicated that G or C was more inclined a lower nucleotide frequency (RSCU < 1.0) than A or U (RSCU > 1.0) at the third codon position. The exception was UUG (RSCU = 1.87) (Figure 4, Table S2), which was similar to that in other angiosperm cp genome research [4,93].
Moreover, the initiation codons in Paphiopedilum were almost always AUG, whereas some genes contained different codon types such as ACG for rpl2 or GUG for rps19 (Table S3), which was consistent with other monocots studies [94]. Earlier investigations showed that initiation codons interfered with translation efficacy [95,96], and C to U RNA editing events commonly existed in higher plant chloroplasts [97]. This might have resulted in the biased codon usage of Paphiopedilum, in conjunction with the environmental adaptation caused by natural selection.
The repeat sequences of chloroplast could be provided useful resources to study genome recombination in plants. The identified SSRs (microsatellites) in the Paphiopedilum cp genome exhibited a high copy number diversity, and were significant molecular markers with transferable capacities across species and genera for population genetics and evolutionary studies [93,98]. Among SSRs in Paphiopedilum cp genomes, the mononucleotide A/T repeat units was identified as having the highest numbers, and the proportion was ~40.16% (Table 3), which was consistent with the relevantly low GC content in the cp genome. Most of the SSRs were in the intergenic regions (60.3%), which might have been owing to the fact that there was a higher mutation rate in the intergenic rather than the coding regions. Certain unique SSRs were also useful for the identification of Paphiopedilum species (Figure S3).
The variation, differentiation, and diversity of the cp genome were explored by comparing the sequences through polymorphism analysis (Figure 3 and Figure S1). As predicted, being largely consistent with recent studies [4,93], the IR regions had a much lower variation (0.00610) than the SSC (0.31009) and LSC (0.01194) regions, which was likely due to copy correction between IR sequences via gene conversion and replication [99]. The higher genetic diversity of SSC might be the result of the variable lengths (663 bp to 5916 bp) of the SSC regions. Furthermore, it was found that divergence in the intergenic regions was higher than that of the genic regions, as is seen in most angiosperms (Figure S1). By comparison, some divergent hotspot regions identified in our study were coincident with the results of Sun et al., 2021 [9], such as the trnK_UUU-rps16, psbK-psbI, trnE_UUC-trnT_GGU, clpP and psaC-rps15. Vu et al. 2020 compared the chloroplast genome of Papiopedilum delenatii with that of other orchids and also found the similar divergent hotspots region including rps16, trnE_UUC-trnT_GGU, psaI, clpP, and psaC [11]. These identified divergent hotspot regions, especially the four highly credible regions (trnK-rps16, trnE_UUC-trnT_GGU, clpP, and psaC-rps15) which contained the similar ML topology with the whole cp genome and the concatenated regions (Figure S2), could be useful as genetic markers for the further studies on the phylogenetic relationships, DNA barcodes, genetic population, and evolution of the genus Paphiopedilum and orchid species.
The lower Ka/Ks ratios at the cp genome level within the Paphiopedilum species indicated that most genes were subjected to a purifying selection to retain conserved functions (Figure 7 and Figure S4). Environmental factors, such as solar radiation and temperature, can impact mutation rates, metabolism, and growth rates [100,101]. Previous studies revealed that the distribution patterns and evolution of Paphiopedilum were significantly correlated with elevation, solar radiation, temperature (mean diurnal range, annual temperature range), and precipitation (seasonal precipitation, warmest quarter precipitation) [7]. One of the most prevalent forms of natural selection, purifying selection, constantly sweeps away deleterious mutations in populations [1].
The purifying selection of most genes within the Paphiopedilum species are likely the evolutionary result of the preservation of its adaptive characteristics. However, the positive selection was also found in several specific genes (accD, matK, psbM, rpl20, rps12, ycf1, and ycf2). In most cases, genes related to a specific environment were typically assumed to be under positive selection [102]. These genes might serve as candidates that contribute to the adaptive evolution of Paphiopedilum. Therein, matK is commonly used as a phylogenetic signal that reveals evolutionary relationships due to its high substitution rates [103].
The signal of positive matK selection was also found in some hydrophytes, which exhibited low light adaptations [1]. The ycf2 gene was the largest chloroplast gene reported in angiosperms for assessing sequence variations and evolution in plants [104]. The positive selection of ycf2 was also found to be involved in the adaptation of other species [105], and the variation in psbM genes was related to the senescence of Pisum sativum [106]. Overall, the identification of these positive selective genes provided valuable resources for further research into the adaptive evolution of Paphiopedilum.
Chloroplast genomes have been widely used in studies of phylogenetics, evolutionary biology, and population genetics of Orchidaceae species, owing to this, the family had the largest number of species in the world [11,13,14,24,25,26,27,63,64]. The genus Paphiopedilum includes over 66 species in the world; however, the other genus had a greater number of species such as Polystachya (~240 species) [65], Coelogyne (over 200 species) [63]. Paphiopedilum, called “lady of Venus”, is one of the most cultivated horticulture plants worldwide because of its typical beautiful flowers, belonging to the subfamily Cypripedioideae of Orchidaceae, firstly described by Pfitzer in 1886 [9,13,14,64,65]. In the subfamily Cypripedioideae, Paphiopedilum, Cypripedium and Phragmipedium had a relatively closer relationship and had been divided into three distinct groups until the nineteenth century.
The phylogenetic relationships and classification of Paphiopedilum are quite complex and have been studied for a long time [12,21,22,34]. The newly assembled cp genomes offered additional data and resources for Paphiopedilum phylogenetic research (Table 1). In the current study, the phylogeny was basically consistent with the recent phylogenies obtained from partial organelle DNA markers (Figure 6) [21,23] or specific cp genome genes such as matK and rbcL [14]. At the genus level, Paphiopedilum and Phragmipedium presented a closer relationship (Figure 6), which was also consistent with the other phylogenetic studies of Paphiopedilum based on the cp genome [9,12,21]. While within the studied genus Paphiopedilum, 41 Paphiopedilum individuals were classified into three subgenera: Subg. Paphiopedilum, Subg. Brachypetalum and Subg. Parvisepalum with 100% bootstrap values (Figure 6A). The Subg. Paphiopedilum was further divided into the three sections corresponding to Sect. Barbata, Sect. Paphiopedilum and Sect. Pardalopetalum, respectively. These results were also supported by the results of ML analysis by using the identified divergence hotspot regions (Figure S2). However, Paphiopedilum taxa is complex, and was divided into different subgenera based on morphological, molecular data, and diversity genetic markers [9,10,11,13,14,63,64,65]. There are still some unresolved phylogenetic questions that still need to be resolved in Paphiopedilum due to the genome size, gene content, expansion, gene repeats, GC content, and hybridization [7,8,9,10,11,12,13,14,21,100].
The variation and selectivity explored within the given species showed that Paphiopedilum species majorly underwent the purifying selection except for P. dianthum, P. tigrinum and P. henryanum (Table S6). Within species, some cp genomes were not clustered together within species in the ML phylogenetic tree, which reflected the high genetic variations that exist among these individuals (such as, 5,632 SNPs between two cp genomes of P. wardii, 1958 SNPs between two cp genomes of P. bellatulum, and 2919 SNPs between two cp genomes of P. concolor). We found that the total length of cp genomes had a large difference within species, including 10,947 bp in P. wardii (MN587760 and MH191341), 5498 bp in P. bellatulum (MZ150829 and MN315107), and 4794 bp in P. concolor (MN587764 and MH191340), respectively. There were many mutation events (insertions, deletions, substitutions, and inversions), gene loss, inverted repeats expansion, and gene rearrangements have been found in cp genomes, which impacted the classification status in the phylogenetic tree analyses [6], especially for this quite complex genus Paphiopedilum [9,11,12,14]. The limited number of available cp genomes within the specific species limits the study of intraspecific variation and evolution. In the future, with the announcement of more cp genomes, it is possible that population genomic research of the given species will reveal more evolution and variation mechanisms.

5. Conclusions

For this study, five cp genomes of Paphiopedilum species were newly sequenced, assembled and annotated. Subsequently, in combination with other previously reported cp genomes, we explored their comprehensive characteristics, including length, GC contents, and gene counts. The results indicated that these cp genomes shared similar genome structures, whereas significant IR expansion and SSC contraction were observed. Akin to the results of other studies, the intergenic regions contained higher variabilities, while the IR regions exhibited lower divergence due to copy correction between IR sequences via gene conversion and replication. The twelve divergent hotspot regions, as well as the identified SSRs, could be available for the development of molecular markers and plant authentication.
The low GC content, gene transfer, and degradation of ndh genes might be the result of the adaptive evolution of cp genomes in Paphiopedilum. Furthermore, at the species level, the Ka/Ks ratios indicated the Paphiopedilum species were subjected to purifying selection. At the gene level, we observed that some specific genes were under positive selection, such as matK, ycf2, and psbM, which indicated that they were significant potential candidate genes during the Paphiopedilum evolutionary process. These results might be the adaptive responses to their unique habitats. Our study not only provided valuable genomic resources for the further utilization, development and in-depth research into the endangered Paphiopedilum germplasm, but also provided insights for the investigation of the adaptive evolution of chloroplast genomes in Orchidaceae.

Supplementary Materials

The following are available online at https://www.mdpi.com/article/10.3390/horticulturae8050391/s1, Figure S1. Comparative analysis (using the MVISTA program) of the whole-chloroplast genomes of the 19 Paphiopedilum species. The identity percentage shown in the vertical axis ranged from 50% to 100%, while the horizontal axis exhibited the position within the chloroplast genome. Each arrow displays the transcription direction of the annotated genes in the reference genome (P. appletonianum). Genome regions are colored as exons, introns, and intergenic spacer, respectively. Figure S2. The ML tree of the nineteen studied Paphiopedilum species constructed by whole cp genome and divergent hotspots regions. The circle size on each node represented the bootstrap value. A: the whole cp genome. B: The concatenated regions. C: The trnk-rps16. D: trnE_UUC-trnT_GGU. E: The clpP. F: The psaC-rps15. Figure S3. The upset plot of the identified SSRs in 19 Paphiopedilum chloroplast genomes. Here, to identify the unique SSRs in corresponding species, the main focus was on the types of SSRs units without considering the repeat times. Figure S4. Heat map of the Ka/Ks value of each gene in each pair of species. Table S1. Features of the chloroplast genomes of Paphiopedilum and the related species downloaded from NCBI. Table S2. Codon usage statistics of the RSCU values for each codon. Table S3. Special initiation codon of Paphiopedilum chloroplast genome in protein coding genes. Table S4. The hit numbers of homologous fragments between chloroplast and nuclear genomes in Paphiopedilum. Table S5. The selective pressure analysis at species level among Paphiopedilum. Table S6. The variation and selectivity statistics of the given species. References [9,12,107,108,109] are cited in the supplementary materials.

Author Contributions

Conceptualization, H.L., H.Y. and P.Z.; Methodology, H.L., H.Y. and J.M.; Software, J.M., N.Z. and J.W.; Formal analysis, N.Z., J.W. and M.L.; Data Curation, H.L., H.Y. and G.H.; Writing Original-Draft, H.L., H.Y. and J.M.; Writing-Review and Editing, H.L., H.Y., J.M. and G.H.; Supervision, P.Z.; Project administration, P.Z.; Funding Acquisition, P.Z. All authors have read and agreed to the published version of the manuscript.

Funding

This study was funded by the National Natural Science Foundation of China (32070372 to Peng Zhao). The funding agency did not play a role in the experimental design, results analysis, or writing of the manuscript, but did provide financial support for the manuscript.

Institutional Review Board Statement

Not applicable.

Informed Consent Statement

Not applicable.

Data Availability Statement

The complete chloroplast genome sequence data that supported the findings of this study was submitted to GenBank under the accession number of MN315105 (P. ‘GZSLKY’ Youyou), MN315106 (P. barbigerum), MN315107 (P. bellatulum), MN315108 (P. henryanum), MN315109 (P. hirsutissimum), respectively.

Conflicts of Interest

The authors declare no conflict of interest.

References

  1. Wu, Z.; Liao, R.; Yang, T.; Dong, X.; Lan, D.; Qin, R.; Liu, H. Analysis of six chloroplast genomes provides insight into the evolution of Chrysosplenium (Saxifragaceae). BMC Genom. 2020, 21, 621. [Google Scholar] [CrossRef] [PubMed]
  2. Gao, L.Z.; Liu, Y.L.; Zhang, D.; Li, W.; Gao, J.; Liu, Y.; Li, K.; Shi, C.; Zhao, Y.; Zhao, Y.J.; et al. Evolution of Oryza chloroplast genomes promoted adaptation to diverse ecological habitats. Commun. Biol. 2019, 2, 278. [Google Scholar] [CrossRef] [PubMed] [Green Version]
  3. Li, B.; Zheng, Y. Dynamic evolution and phylogenomic analysis of the chloroplast genome in Schisandraceae. Sci. Rep. 2018, 8, 9285. [Google Scholar] [CrossRef] [PubMed]
  4. Munyao, J.N.; Dong, X.; Yang, J.X.; Mbandi, E.M.; Wanga, V.O.; Oulo, M.A.; Saina, J.K.; Musili, P.M.; Hu, G.W. Complete chloroplast genomes of Chlorophytum comosum and Chlorophytum gallabatense: Genome structures, comparative and phylogenetic analysis. Plants 2020, 9, 296. [Google Scholar] [CrossRef] [PubMed] [Green Version]
  5. Niu, E.; Jiang, C.; Wang, W.; Zhang, Y.; Zhu, S. Chloroplast genome variation and evolutionary analysis of Olea europaea L. Genes 2020, 11, 879. [Google Scholar] [CrossRef] [PubMed]
  6. Lee, H.L.; Jansen, R.K.; Chumley, T.W.; Kim, K.J. Gene relocations within chloroplast genomes of Jasminum and Menodora (Oleaceae) are due to multiple, overlapping Inversions. Mol. Biol. Evol. 2007, 24, 1161–1180. [Google Scholar] [CrossRef] [PubMed] [Green Version]
  7. Ye, P.; Wu, J.; An, M.; Chen, H.; Zhao, X.; Jin, X.; Si, Q. Geographical distribution and relationship with environmental factors of Paphiopedilum Subgenus Brachypetalum Hallier (Orchidaceae) Taxa in southwest China. Diversity 2021, 13, 634. [Google Scholar] [CrossRef]
  8. Chen, Q.W.; Guo, Y.Q. Paphiopedilum plants in China: Scopes and review. Guangxi Agric. Sci. 2010, 41, 818–821. [Google Scholar]
  9. Sun, Y.; Zou, P.; Jiang, N.; Fang, Y.; Liu, G. Comparative analysis of the complete chloroplast genomes of nine Paphiopedilum species. Front. Genet. 2022, 12, 772415. [Google Scholar] [CrossRef]
  10. Ge, L.P.; Tang, L.; Luo, Y. The complete chloroplast genome of an endangered orchid Paphiopedilum spicerianum. Mitochondrial DNA B Res. 2020, 5, 3594–3595. [Google Scholar] [CrossRef]
  11. Vu, H.Y.; Tran, N.; Nguyen, T.D.; Vu, Q.L.; Bui, M.H.; Le, M.T.; Le, L. Complete chloroplast genome of Paphiopedilum delenatii and phylogenetic relationships among Orchidaceae. Plants 2020, 9, 61. [Google Scholar] [CrossRef] [PubMed] [Green Version]
  12. Guo, Y.Y.; Yang, J.X.; Bai, M.Z.; Zhang, G.Q.; Liu, Z.J. The chloroplast genome evolution of Venus slipper (Paphiopedilum): IR expansion, SSC contraction, and highly rearranged SSC regions. BMC Plant Biol. 2021, 21, 248. [Google Scholar] [CrossRef] [PubMed]
  13. Han, C.Y.; Ding, R.; Zong, X.Y.; Zhang, L.J.; Chen, X.H.; Qu, B. Structural characterization of Platanthera ussuriensis chloroplast genome and comparative analyses with other species of Orchidaceae. BMC Genom. 2022, 23, 84. [Google Scholar] [CrossRef] [PubMed]
  14. Tsai, C.C.; Liao, P.C.; Ko, Y.Z.; Chen, C.H.; Chiang, Y.C. Phylogeny and historical biogeography of Paphiopedilum Pfifitzer (Orchidaceae) based on nuclear and plastid DNA. Front. Plant Sci. 2022, 11, 126. [Google Scholar] [CrossRef] [PubMed] [Green Version]
  15. Luo, Y.B.; Jia, J.S.; Wang, C.L. Conservation strategy and potential advantages of the Chinese Paphiopedilum. Biodivers. Sci. 2003, 11, 491–498. [Google Scholar]
  16. Long, B.; Long, C.L. Amazing Paphiopedilum and its research status. Chin. J. Nat. 2006, 28, 341–344. [Google Scholar]
  17. Xu, Y.; Jia, R.; Zhou, Y.; Cheng, H.; Zhao, X.; Ge, H. Development and characterization of polymorphic EST-SSR markers for Paphiopedilum henryanum (Orchidaceae). Appl. Plant Sci. 2018, 6, e1152. [Google Scholar] [CrossRef]
  18. Zeng, S.J.; Chen, Z.L.; Wu, K.L.; Duan, J. Study on introduction and cultivation of Paphiopedilum distributed in China. Chin. Wild Plant Resour. 2010, 29, 53–58. [Google Scholar]
  19. Xiu, M.; Zhang, X.S.; Wei, X.L.; Hong, S.B.; Zheng, Y.H.; Zhang, K.B.; Chen, J.S.; Chen, C.; Lin, Y. Study on cultivation adaptability of introduced Paphiopedilum in Chaoshan area. Guangdong Agric. Sci. 2021, 48, 47–56. [Google Scholar]
  20. Tsiftsis, S.; Tsiripidis, I.; Karagiannakidou, V.; Alifragis, D. Niche analysis and conservation of the orchids of east Macedonia (NE Greece). Acta Oecol. 2008, 33, 27–35. [Google Scholar] [CrossRef]
  21. Chochai, A.; Leitch, I.J.; Ingrouille, M.J.; Fay, M.F. Molecular phylogenetics of Paphiopedilum (Cypripedioideae; Orchidaceae) based on nuclear ribosomal ITS and plastid sequences. Bot. J. Linn. Soc. 2012, 170, 176–196. [Google Scholar] [CrossRef] [Green Version]
  22. Cox, A.V.; Pridgeon, A.M.; Albert, V.A.; Chase, M.W. Phylogenetics of the slipper orchids (Cypripedioideae, Orchidaceae): Nuclear rDNA ITS sequences. Plant Syst. Evol. 1997, 208, 197–223. [Google Scholar] [CrossRef]
  23. Guo, Y.Y.; Luo, Y.B.; Liu, Z.J.; Wang, X.Q. Reticulate evolution and sea-level fluctuations together drove species diversification of slipper orchids (Paphiopedilum) in South-East Asia. Mol. Ecol. 2015, 24, 2838–2855. [Google Scholar] [CrossRef] [PubMed]
  24. Smidt, E.D.C.; Páez, M.Z.; Vieira, L.D.N.; Viruel, J.; De Baura, V.A.; Balsanelli, E.; De Souza, E.M.; Chase, M.W. Characterization of sequence variability hotspots in Cranichideae plastomes (Orchidaceae, Orchidoideae). PLoS ONE 2020, 15, e0227991. [Google Scholar] [CrossRef]
  25. Yang, J.B.; Tang, M.; Li, H.T.; Zhang, Z.R.; Li, D.Z. Complete chloroplast genome of the genus Cymbidium: Lights into the species identification, phylogenetic implications and population genetic analyses. BMC Evol. Biol. 2013, 13, 84. [Google Scholar] [CrossRef] [Green Version]
  26. Dong, W.L.; Wang, R.N.; Zhang, N.Y.; Fan, W.B.; Fang, M.F.; Li, Z.H. Molecular evolution of chloroplast genomes of Orchid species: Insights into phylogenetic relationship and adaptive evolution. Int. J. Mol. Sci. 2018, 19, 716. [Google Scholar] [CrossRef] [Green Version]
  27. Roma, L.; Cozzolino, S.; Schlu¨ter, P.M.; Scopece, G.; Cafasso, D. The complete plastid genomes of Ophrysiricolor and O. sphegodes (Orchidaceae) and comparative analyses with other orchids. PLoS ONE 2018, 13, e0204174. [Google Scholar] [CrossRef] [Green Version]
  28. Hu, C.; Jiang, K.; Zeng, X.; Huang, W. The complete chloroplast genome sequence of a critically endangered orchid Paphiopedilum gratrixianum (Orchidaceae). Mitochondrial DNA B Res. 2022, 7, 609–610. [Google Scholar] [CrossRef]
  29. Kao, H.; Zhao, Y.; Yang, M.; Sun, Y.; Cheng, J. The complete chloroplast genome sequences of an endangered orchid species Paphiopedilum parishii (Orchidaceae). Mitochondrial DNA B Res. 2021, 6, 2521–2522. [Google Scholar] [CrossRef]
  30. Górniak, M.; Szlachetko, D.L.; Olędrzyńska, N.; Naczk, A.M.; Mieszkowska, A.; Boss, L.; Ziętara, M.S. Species phylogeny versus gene trees: A case study of an incongruent data matrix based on Paphiopedilum Pfitz. (Orchidaceae). Int. J. Mol. Sci. 2021, 22, 11393. [Google Scholar] [CrossRef]
  31. Cox, A.V.; Abdelnour, G.J.; Bennett, M.D.; Leitch, I.J. Genome size and karyotype evolution in the slipper orchids (Cypripedioideae: Orchidaceae). Am. J. Bot. 1998, 85, 681–687. [Google Scholar] [CrossRef] [PubMed]
  32. Zhu, G.F.; Yang, Z.J.; Wang, B.Q.; Lv, F.B.; Zhang, X. Karyotypes of 12 Species of Paphiopedilum subgenus Paphiopedilum. J. Trop. Subtrop. Bot. 2011, 19, 152–158. [Google Scholar]
  33. Yang, Z.J. Study on Cytology and the Relationship in Plants of Paphiopedilum (Cypripedioideae: Orchidaceae). Master’s Thesis, Northwest A&F University, Yangling, China, 2006. [Google Scholar]
  34. Kim, H.T.; Kim, J.S.; Moore, M.J.; Neubig, K.M.; Williams, N.H.; Whitten, W.M.; Kim, J.H. Seven new complete plastome sequences reveal rampant independent loss of the ndh gene family across Orchids and associated instability of the inverted repeat/small single-copy region boundaries. PLoS ONE 2015, 10, e0142215. [Google Scholar] [CrossRef]
  35. Doyle, J.J.; Doyle, J.L. A rapid DNA isolation procedure for small quantities of fresh leaf tissue. Phyto Chem. Bull. 1987, 19, 11–15. [Google Scholar]
  36. Chen, S.F.; Zhou, Y.Q.; Chen, Y.; Gu, J. fastp: An ultra-fast all-in-one FASTQ preprocessor. Bioinformatics 2018, 34, i884–i890. [Google Scholar] [CrossRef]
  37. Giannoulatou, E.; Park, S.H.; Humphreys, D.T.; Ho, J.W.K. Verification and validation of bioinformatics software without a gold standard: A case study of BWA and Bowtie. BMC Bioinform. 2014, 15, S15. [Google Scholar] [CrossRef] [Green Version]
  38. Chen, X.D.; Peng, D.H.; Lan, S.R.; Chen, J.; Fu, W.Q. The complete chloroplast genome sequence of Paphiopedilum purpuratum (Orchidaceae). Mitochondrial DNA B 2019, 4, 3910–3911. [Google Scholar] [CrossRef] [Green Version]
  39. Jin, J.J.; Yu, W.B.; Yang, J.B.; Song, Y.; dePamphilis, C.W.; Yi, T.-S.; Li, D.-Z. GetOrganelle: A fast and versatile toolkit for accurate de novo assembly of organelle genomes. Genome Biol. 2020, 21, 241. [Google Scholar] [CrossRef]
  40. Liu, C.; Shi, L.; Zhu, Y.; Chen, H.; Zhang, J.; Lin, X.; Guan, X. CpGAVAS, an integrated web server for the annotation, visualization, analysis, and GenBank submission of completely sequenced chloroplast genome sequences. BMC Genom. 2012, 13, 715. [Google Scholar] [CrossRef] [Green Version]
  41. Lowe, T.M.; Eddy, S.R. tRNAscan-SE: A program for improved detection of transfer RNA genes in genomic sequence. Nucleic Acids Res. 1997, 25, 955–964. [Google Scholar] [CrossRef]
  42. Zheng, S.; Poczai, P.; Hyvönen, J.; Tang, J.; Amiryousefi, A. Chloroplot: An online program for the versatile plotting of organelle genomes. Front. Genet. 2020, 11, 1123. [Google Scholar] [CrossRef] [PubMed]
  43. Rice, P.; Longden, I.; Bleasby, A. EMBOSS: The European molecular biology open software suite. Trends Genet. 2000, 16, 276–277. [Google Scholar] [CrossRef]
  44. Shen, W.; Le, S.; Li, Y.; Hu, F. SeqKit: A cross-platform and ultrafast Toolkit for FASTA/Q file manipulation. PLoS ONE 2016, 11, e0163962. [Google Scholar] [CrossRef] [PubMed]
  45. Frazer, K.A.; Pachter, L.; Poliakov, A.; Rubin, E.M.; Dubchak, I. VISTA: Computational tools for comparative genomics. Nucleic Acids Res. 2004, 32, W273–W279. [Google Scholar] [CrossRef] [PubMed]
  46. Amiryousefi, A.; Hyvönen, J.; Poczai, P. IRscope: An online program to visualize the junction sites of chloroplast genomes. Bioinformatics 2018, 34, 3030–3031. [Google Scholar] [CrossRef] [PubMed]
  47. Katoh, K.; Standley, D.M. MAFFT multiple sequence alignment software version 7: Improvements in performance and usability. Mol. Biol. Evol. 2013, 30, 772–780. [Google Scholar] [CrossRef] [PubMed] [Green Version]
  48. Rozas, J.; Ferrer-Mata, A.; Sánchez-DelBarrio, J.C.; Guirao-Rico, S.; Librado, P.; Ramos-Onsins, S.E.; Sánchez-Gracia, A. DnaSP 6: DNA sequence polymorphism analysis of large data Sets. Mol. Biol. Evol. 2017, 34, 3299–3302. [Google Scholar] [CrossRef]
  49. Kumar, S.; Stecher, G.; Tamura, K. MEGA7: Molecular evolutionary genetics analysis version 7.0 for bigger datasets. Mol. Biol. Evol. 2016, 33, 1870–1874. [Google Scholar] [CrossRef] [Green Version]
  50. Chen, C.; Chen, H.; Zhang, Y.; Thomas, H.R.; Frank, M.H.; He, Y.; Xia, R. TBtools: An integrative Toolkit developed for interactive analyses of big biological data. Mol. Plant 2020, 13, 1194–1202. [Google Scholar] [CrossRef]
  51. Beier, S.; Thiel, T.; Münch, T.; Scholz, U.; Mascher, M. MISA-web: A web server for microsatellite prediction. Bioinformatics 2017, 33, 2583–2585. [Google Scholar] [CrossRef] [Green Version]
  52. Kurtz, S.; Choudhuri, J.V.; Ohlebusch, E.; Schleiermacher, C.; Stoye, J.; Giegerich, R. REPuter: The manifold applications of repeat analysis on a genomic scale. Nucleic Acids Res. 2001, 29, 4633–4642. [Google Scholar] [CrossRef] [PubMed] [Green Version]
  53. Benson, G. Tandem repeats finder: A program to analyze DNA sequences. Nucleic Acids Res. 1999, 27, 573–580. [Google Scholar] [CrossRef] [PubMed] [Green Version]
  54. Zhang, D.; Gao, F.; Jakovlić, I.; Zou, H.; Zhang, J.; Li, W.X.; Wang, G.T. PhyloSuite: An integrated and scalable desktop platform for streamlined molecular sequence data management and evolutionary phylogenetics studies. Mol. Ecol. Resour. 2020, 20, 348–355. [Google Scholar] [CrossRef] [PubMed]
  55. Talavera, G.; Castresana, J. Improvement of phylogenies after removing divergent and ambiguously aligned blocks from protein sequence alignments. Syst. Biol. 2007, 56, 564–577. [Google Scholar] [CrossRef] [Green Version]
  56. Nguyen, L.T.; Schmidt, H.A.; von Haeseler, A.; Minh, B.Q. IQ-TREE: A fast and effective stochastic algorithm for estimating Maximum-Likelihood phylogenies. Mol. Biol. Evol. 2014, 32, 268–274. [Google Scholar] [CrossRef]
  57. Ivica, L.; Peer, B. Interactive Tree Of Life (iTOL) v4: Recent updates and new developments. Nucleic Acids Res. 2019, 47, W256–W259. [Google Scholar] [CrossRef] [Green Version]
  58. Wang, D.; Zhang, Y.; Zhang, Z.; Zhu, J.; Yu, J. KaKs_Calculator 2.0: A Toolkit incorporating Gamma-Series methods and sliding window strategies. Genom. Proteom. Bioinform. 2010, 8, 77–80. [Google Scholar] [CrossRef] [Green Version]
  59. Yang, Z.; Nielsen, R. Estimating synonymous and nonsynonymous substitution rates under realistic evolutionary models. Mol. Biol. Evol. 2000, 17, 32–43. [Google Scholar] [CrossRef] [Green Version]
  60. Cribb, P.J.; Kell, S.P.; Dixon, K.W.; Barrett, R.L. Orchid conservation: A global perspective. In Orchid Conservation; Natural History Publications: Kota Kinabalu, Malaysia, 2003. [Google Scholar]
  61. Li, Z.Y.; Wu, Y.L.; Peng, K. Micro-morphological characters of leaf epidermis of ten species in genus Paphiopedilum. Bull. Bot. Res. 2014, 34, 723–729. [Google Scholar]
  62. Shi, J.Z.; Chen, H.; An, M.; Zhang, Y.; Ye, C.; Wu, J. Analyses on Distribution Characteristics and Protection Effect of Wild Paphiopedilum in Guizhou Province. Guihaia 2021, 1–10. Available online: https://kns.cnki.net/kcms/detail/45.1134.Q.20210324.1433.012.html (accessed on 26 March 2021).
  63. Jiang, K.; Miao, L.Y.; Wang, Z.W.; Ni, Z.Y.; Hu, C.; Zeng, X.H.; Huang, W.C. Chloroplast genome analysis of two medicinal Coelogyne spp. (Orchidaceae) shed light on the genetic information, comparative genomics, and species identification. Plants 2020, 9, 1332. [Google Scholar] [CrossRef] [PubMed]
  64. Guo, Y.Y.; Yang, J.X.; Li, H.K.; Zhao, H.S. Chloroplast genomes of two species of Cypripedium: Expanded genome size and proliferation of AT-Biased repeat sequences. Front. Plant Sci. 2021, 12, 609729. [Google Scholar] [CrossRef] [PubMed]
  65. Jiang, H.; Tian, J.; Yang, J.; Dong, X.; Zhong, Z.; Mwachala, G.; Zhang, C.; Hu, G.; Wang, Q. Comparative and phylogenetic analyses of six Kenya Polystachya (Orchidaceae) species based on the complete chloroplast genome sequences. BMC Plant Biol. 2022, 22, 177. [Google Scholar] [CrossRef] [PubMed]
  66. Wu, H.; Li, D.; Feng, X.; Yue, L.; Zhao, X. The Complete Chloroplast Genome Sequence of Clivia gardenii. Mol. Plant Breed. 2021, 1–8. Available online: https://kns.cnki.net/kcms/detail/46.1068.S.20210722.1708.032.html (accessed on 23 July 2021).
  67. Li, J.; Yang, Q.; Liu, Z.L. The complete chloroplast genome sequence of Liparis japonica (Orchidaceae). Mitochondrial DNA B Res. 2019, 4, 2405–2406. [Google Scholar] [CrossRef] [Green Version]
  68. Feng, H.; Cao, T.; Xu, H.; Liu, Y.; Han, Y.; Sun, W.; Liu, Y. Characterization of the complete chloroplast genome of Bletilla striata (Orchidaceae: Bletilla), the herb in China. Mitochondrial DNA B Res. 2019, 4, 3542–3543. [Google Scholar] [CrossRef]
  69. Charlesworth, B. Genetic recombination: Patterns in the genome. Curr. Biol. 1994, 4, 182–184. [Google Scholar] [CrossRef]
  70. Foerstner, K.U.; von Mering, C.; Hooper, S.D.; Bork, P. Environments shape the nucleotide composition of genomes. EMBO Rep. 2005, 6, 1208–1213. [Google Scholar] [CrossRef]
  71. Jia, Q.; Wu, H.; Zhou, X.; Gao, J.; Zhao, W.; Aziz, J.; Wei, J.; Hou, L.; Wu, S.; Zhang, Y.; et al. A “GC-rich” method for mammalian gene expression: A dominant role of non-coding DNA GC content in regulation of mammalian gene expression. Sci. China Life Sci. 2010, 53, 94–100. [Google Scholar] [CrossRef]
  72. Zhu, T.T.; Zhang, L.; Chen, W.S.; Yin, J.; Li, Q. Analysis of chloroplast genomes in 1342 plants. Genom. Appl. Biol. 2017, 36, 4323–4333. [Google Scholar]
  73. Wu, C.S.; Chaw, S.M. Highly rearranged and size-variable chloroplast genomes in conifers II clade (cupressophytes): Evolution towards shorter intergenic spacers. Plant Biotechnol. J. 2014, 12, 344–353. [Google Scholar] [CrossRef]
  74. Wu, C.S.; Wang, Y.N.; Hsu, C.Y.; Lin, C.P.; Chaw, S.M. Loss of different inverted repeat copies from the chloroplast genomes of pinaceae and cupressophytes and influence of heterotachy on the evaluation of gymnosperm phylogeny. Genome Biol. Evol. 2011, 3, 1284–1295. [Google Scholar] [CrossRef] [PubMed] [Green Version]
  75. Wicke, S.; Schneeweiss, G.M.; dePamphilis, C.W.; Müller, K.F.; Quandt, D. The evolution of the plastid chromosome in land plants: Gene content, gene order, gene function. Plant Mol. Biol. 2011, 76, 273–297. [Google Scholar] [CrossRef] [Green Version]
  76. Zhang, X.M.; Li, D.Z.; Gao, L.M. Phylogeographical study on Taxus wallichiana var. mairei (Lemée & Léveillé) LK Fu & Nan Li. Acta Bot. Boreali-Occident. Sin. 2012, 32, 1983–1989. [Google Scholar]
  77. Ruhlman, T.A.; Jansen, R.K. The plastid genomes of flowering plants. In Chloroplast Biotechnology; Springer: Berlin/Heidelberg, Germany, 2014; pp. 3–38. [Google Scholar]
  78. Ruhlman, T.A.; Jansen, R.K. Chapter eight—Aberration or analogy? The atypical plastomes of geraniaceae. In Advances in Botanical Research; Chaw, S.M., Jansen, R.K., Eds.; Academic Press: Cambridge, MA, USA, 2018; Volume 85, pp. 223–262. [Google Scholar]
  79. Dugas, D.V.; Hernandez, D.; Koenen, E.J.M.; Schwarz, E.; Straub, S.; Hughes, C.E.; Jansen, R.K.; Nageswara-Rao, M.; Staats, M.; Trujillo, J.T.; et al. Mimosoid legume plastome evolution: IR expansion, tandem repeat expansions and accelerated rate of evolution in clpP. Sci. Rep. 2015, 5, 16958. [Google Scholar] [CrossRef] [PubMed] [Green Version]
  80. Blazier, J.C.; Jansen, R.K.; Mower, J.P.; Govindu, M.; Zhang, J.; Weng, M.L.; Ruhlman, T.A. Variable presence of the inverted repeat and plastome stability in Erodium. Ann. Bot. 2016, 117, 1209–1220. [Google Scholar] [CrossRef] [PubMed] [Green Version]
  81. Rabah, S.O.; Shrestha, B.; Hajrah, N.H.; Sabir, M.J.; Alharby, H.F.; Sabir, M.J.; Alhebshi, A.M.; Sabir, J.S.M.; Gilbert, L.E.; Ruhlman, T.A.; et al. Passiflora plastome sequencing reveals widespread genomic rearrangements. J. Syst. Evol. 2019, 57, 1–14. [Google Scholar] [CrossRef] [Green Version]
  82. Weng, M.L.; Ruhlman, T.A.; Jansen, R.K. Expansion of inverted repeat does not decrease substitution rates in Pelargonium plastid genomes. New Phytol. 2017, 214, 842–851. [Google Scholar] [CrossRef] [Green Version]
  83. Niu, Z.; Xue, Q.; Zhu, S.; Sun, J.; Liu, W.; Ding, X. The complete plastome sequences of four orchid species: Insights into the evolution of the Orchidaceae and the utility of plastomic mutational hotspots. Front. Plant Sci. 2017, 8, 715. [Google Scholar] [CrossRef] [Green Version]
  84. Pan, I.C.; Liao, D.C.; Wu, F.H.; Daniell, H.; Singh, N.D.; Chang, C.; Shih, M.C.; Chan, M.T.; Lin, C.S. Complete chloroplast genome sequence of an orchid model plant candidate: Erycina pusilla apply in tropical Oncidium breeding. PLoS ONE 2012, 7, e34738. [Google Scholar] [CrossRef]
  85. Lin, C.S.; Chen, J.J.W.; Huang, Y.T.; Chan, M.T.; Daniell, H.; Chang, W.J.; Hsu, C.T.; Liao, D.C.; Wu, F.H.; Lin, S.Y.; et al. The location and translocation of ndh genes of chloroplast origin in the Orchidaceae family. Sci. Rep. 2015, 5, 9040. [Google Scholar] [CrossRef] [PubMed] [Green Version]
  86. Poliseno, L.; Salmena, L.; Zhang, J.; Carver, B.; Haveman, W.J.; Pandolfi, P.P. A coding-independent function of gene and pseudogene mRNAs regulates tumour biology. Nature 2010, 465, 1033–1038. [Google Scholar] [CrossRef] [PubMed] [Green Version]
  87. Lin, C.S.; Chen, J.J.W.; Chiu, C.C.; Hsiao, H.C.W.; Yang, C.J.; Jin, X.H.; Leebens-Mack, J.; de Pamphilis, C.W.; Huang, Y.T.; Yang, L.H.; et al. Concomitant loss of NDH complex-related genes within chloroplast and nuclear genomes in some orchids. Plant J. 2017, 90, 994–1006. [Google Scholar] [CrossRef] [PubMed] [Green Version]
  88. Bock, R.; Timmis, J.N. Reconstructing evolution: Gene transfer from plastids to the nucleus. BioEssays 2008, 30, 556–566. [Google Scholar] [CrossRef] [Green Version]
  89. Martin, W.; Herrmann, R.G. Gene transfer from organelles to the nucleus: How much, what happens, and why?1. Plant Physiol. 1998, 118, 9–17. [Google Scholar] [CrossRef] [Green Version]
  90. Liu, Q.; Dou, S.; Ji, Z.; Xue, Q. Synonymous codon usage and gene function are strongly related in Oryza sativa. Biosystems 2005, 80, 123–131. [Google Scholar] [CrossRef]
  91. Srivastava, D.; Shanker, A. Identification of simple sequence repeats in chloroplast genomes of Magnoliids through bioinformatics approach. Interdiscip. Sci. 2016, 8, 327–336. [Google Scholar] [CrossRef]
  92. Bierne, N.; Eyre-Walker, A. The problem of counting sites in the estimation of the synonymous and nonsynonymous substitution rates: Implications for the correlation between the synonymous substitution rate and codon usage bias. Genetics 2003, 165, 1587–1597. [Google Scholar] [CrossRef]
  93. Liang, H.; Zhang, Y.; Deng, J.; Gao, G.; Ding, C.; Zhang, L.; Yang, R. The complete chloroplast genome sequences of 14 Curcuma species: Insights into genome evolution and phylogenetic relationships within Zingiberales. Front. Genet. 2020, 11, 802. [Google Scholar] [CrossRef]
  94. Xu, C.; Ben, A.; Cai, X. Analysis of synonymous codon usage in chloroplast genome of Phalaenopsis aphrodite subsp. formosana. Mol. Plant Breed. 2010, 8, 945–950. [Google Scholar]
  95. Kuroda, H.; Maliga, P. Sequences downstream of the translation initiation codon are important determinants of translation efficiency in chloroplasts. Plant Physiol. 2001, 125, 430–436. [Google Scholar] [CrossRef] [PubMed] [Green Version]
  96. Seo, S.W.; Yang, J.S.; Kim, I.; Yang, J.; Min, B.E.; Kim, S.; Jung, G.Y. Predictive design of mRNA translation initiation region to control prokaryotic translation efficiency. Metab. Eng. 2013, 15, 67–74. [Google Scholar] [CrossRef] [PubMed]
  97. Hoch, B.; Maier, R.M.; Appel, K.; Igloi, G.L.; Kössel, H. Editing of a chloroplast mRNA by creation of an initiation codon. Nature 1991, 353, 178–180. [Google Scholar] [CrossRef] [PubMed]
  98. Lu, R.S.; Li, P.; Qiu, Y.X. The complete chloroplast genomes of three Cardiocrinum (Liliaceae) species: Comparative genomic and phylogenetic analyses. Front. Plant Sci. 2016, 7, 2054. [Google Scholar] [CrossRef] [PubMed]
  99. Khakhlova, O.; Bock, R. Elimination of deleterious mutations in plastid genomes by gene conversion. Plant J. 2006, 46, 85–94. [Google Scholar] [CrossRef]
  100. Raven, J.A.; Beardall, J.; Larkum, A.W.D.; Sánchez-Baracaldo, P. Interactions of photosynthesis with genome size and function. Philos. Trans. R. Soc. B 2013, 368, 20120264. [Google Scholar] [CrossRef]
  101. Rohde, K. Latitudinal gradients in species diversity: The search for the primary cause. Oikos 1992, 65, 514–527. [Google Scholar] [CrossRef] [Green Version]
  102. Yang, Z.; Wong, W.S.W.; Nielsen, R. Bayes empirical bayes inference of amino acid sites under positive selection. Mol. Biol. Evol. 2005, 22, 1107–1118. [Google Scholar] [CrossRef] [Green Version]
  103. Hilu, K.W.; Borsch, T.; Müller, K.; Soltis, D.E.; Soltis, P.S.; Savolainen, V.; Chase, M.W.; Powell, M.P.; Alice, L.A.; Evans, R.; et al. Angiosperm phylogeny based on matK sequence information. Am. J. Bot. 2003, 90, 1758–1776. [Google Scholar] [CrossRef] [Green Version]
  104. Huang, J.L.; Sun, G.L.; Zhang, D.M. Molecular evolution and phylogeny of the angiosperm ycf2 gene. J. Syst. Evol. 2010, 48, 240–248. [Google Scholar] [CrossRef]
  105. Zhong, Q.; Yang, S.; Sun, X.; Wang, L.; Li, Y. The complete chloroplast genome of the Jerusalem artichoke (Helianthus tuberosus L.) and an adaptive evolutionary analysis of the ycf2 gene. Peer J. 2019, 7, e7596. [Google Scholar] [CrossRef] [PubMed] [Green Version]
  106. Kohzuma, K.; Sato, Y.; Ito, H.; Okuzaki, A.; Watanabe, M.; Kobayashi, H.; Nakano, M.; Yamatani, H.; Masuda, Y.; Nagashima, Y.; et al. The non-mendelian green cotyledon gene in soybean encodes a small subunit of photosystem II. Plant Physiol. 2017, 173, 2138–2147. [Google Scholar] [CrossRef] [PubMed] [Green Version]
  107. Li, M.; Zhao, Z.; He, J.; Cheng, J.; Xie, L. The complete chloroplast genome sequences of a highly endangered orchid species Paphiopedilum barbigerum (Orchidaceae). Mitochondrial DNA B Res. 2019, 2, 2928–2929. [Google Scholar] [CrossRef] [Green Version]
  108. Hou, N.; Wang, G.; Zhu, Y.; Wang, L.; Xu, J. The complete chloroplast genome of the rare and endangered herb Paphiopedilum dianthum (Asparagales: Orchidaceae). Conserv. Genet. Resour. 2018, 10, 709–712. [Google Scholar] [CrossRef]
  109. Zhao, Z.; Li, M.; He, J.; Cheng, J.; Xie, L. Complete chloroplast genome sequences of an important horticultural orchid: Paphiopedilum hirsutissimum (Orchidaceae). Mitochondrial DNA B Res. 2019, 2, 2950–2951. [Google Scholar] [CrossRef] [PubMed] [Green Version]
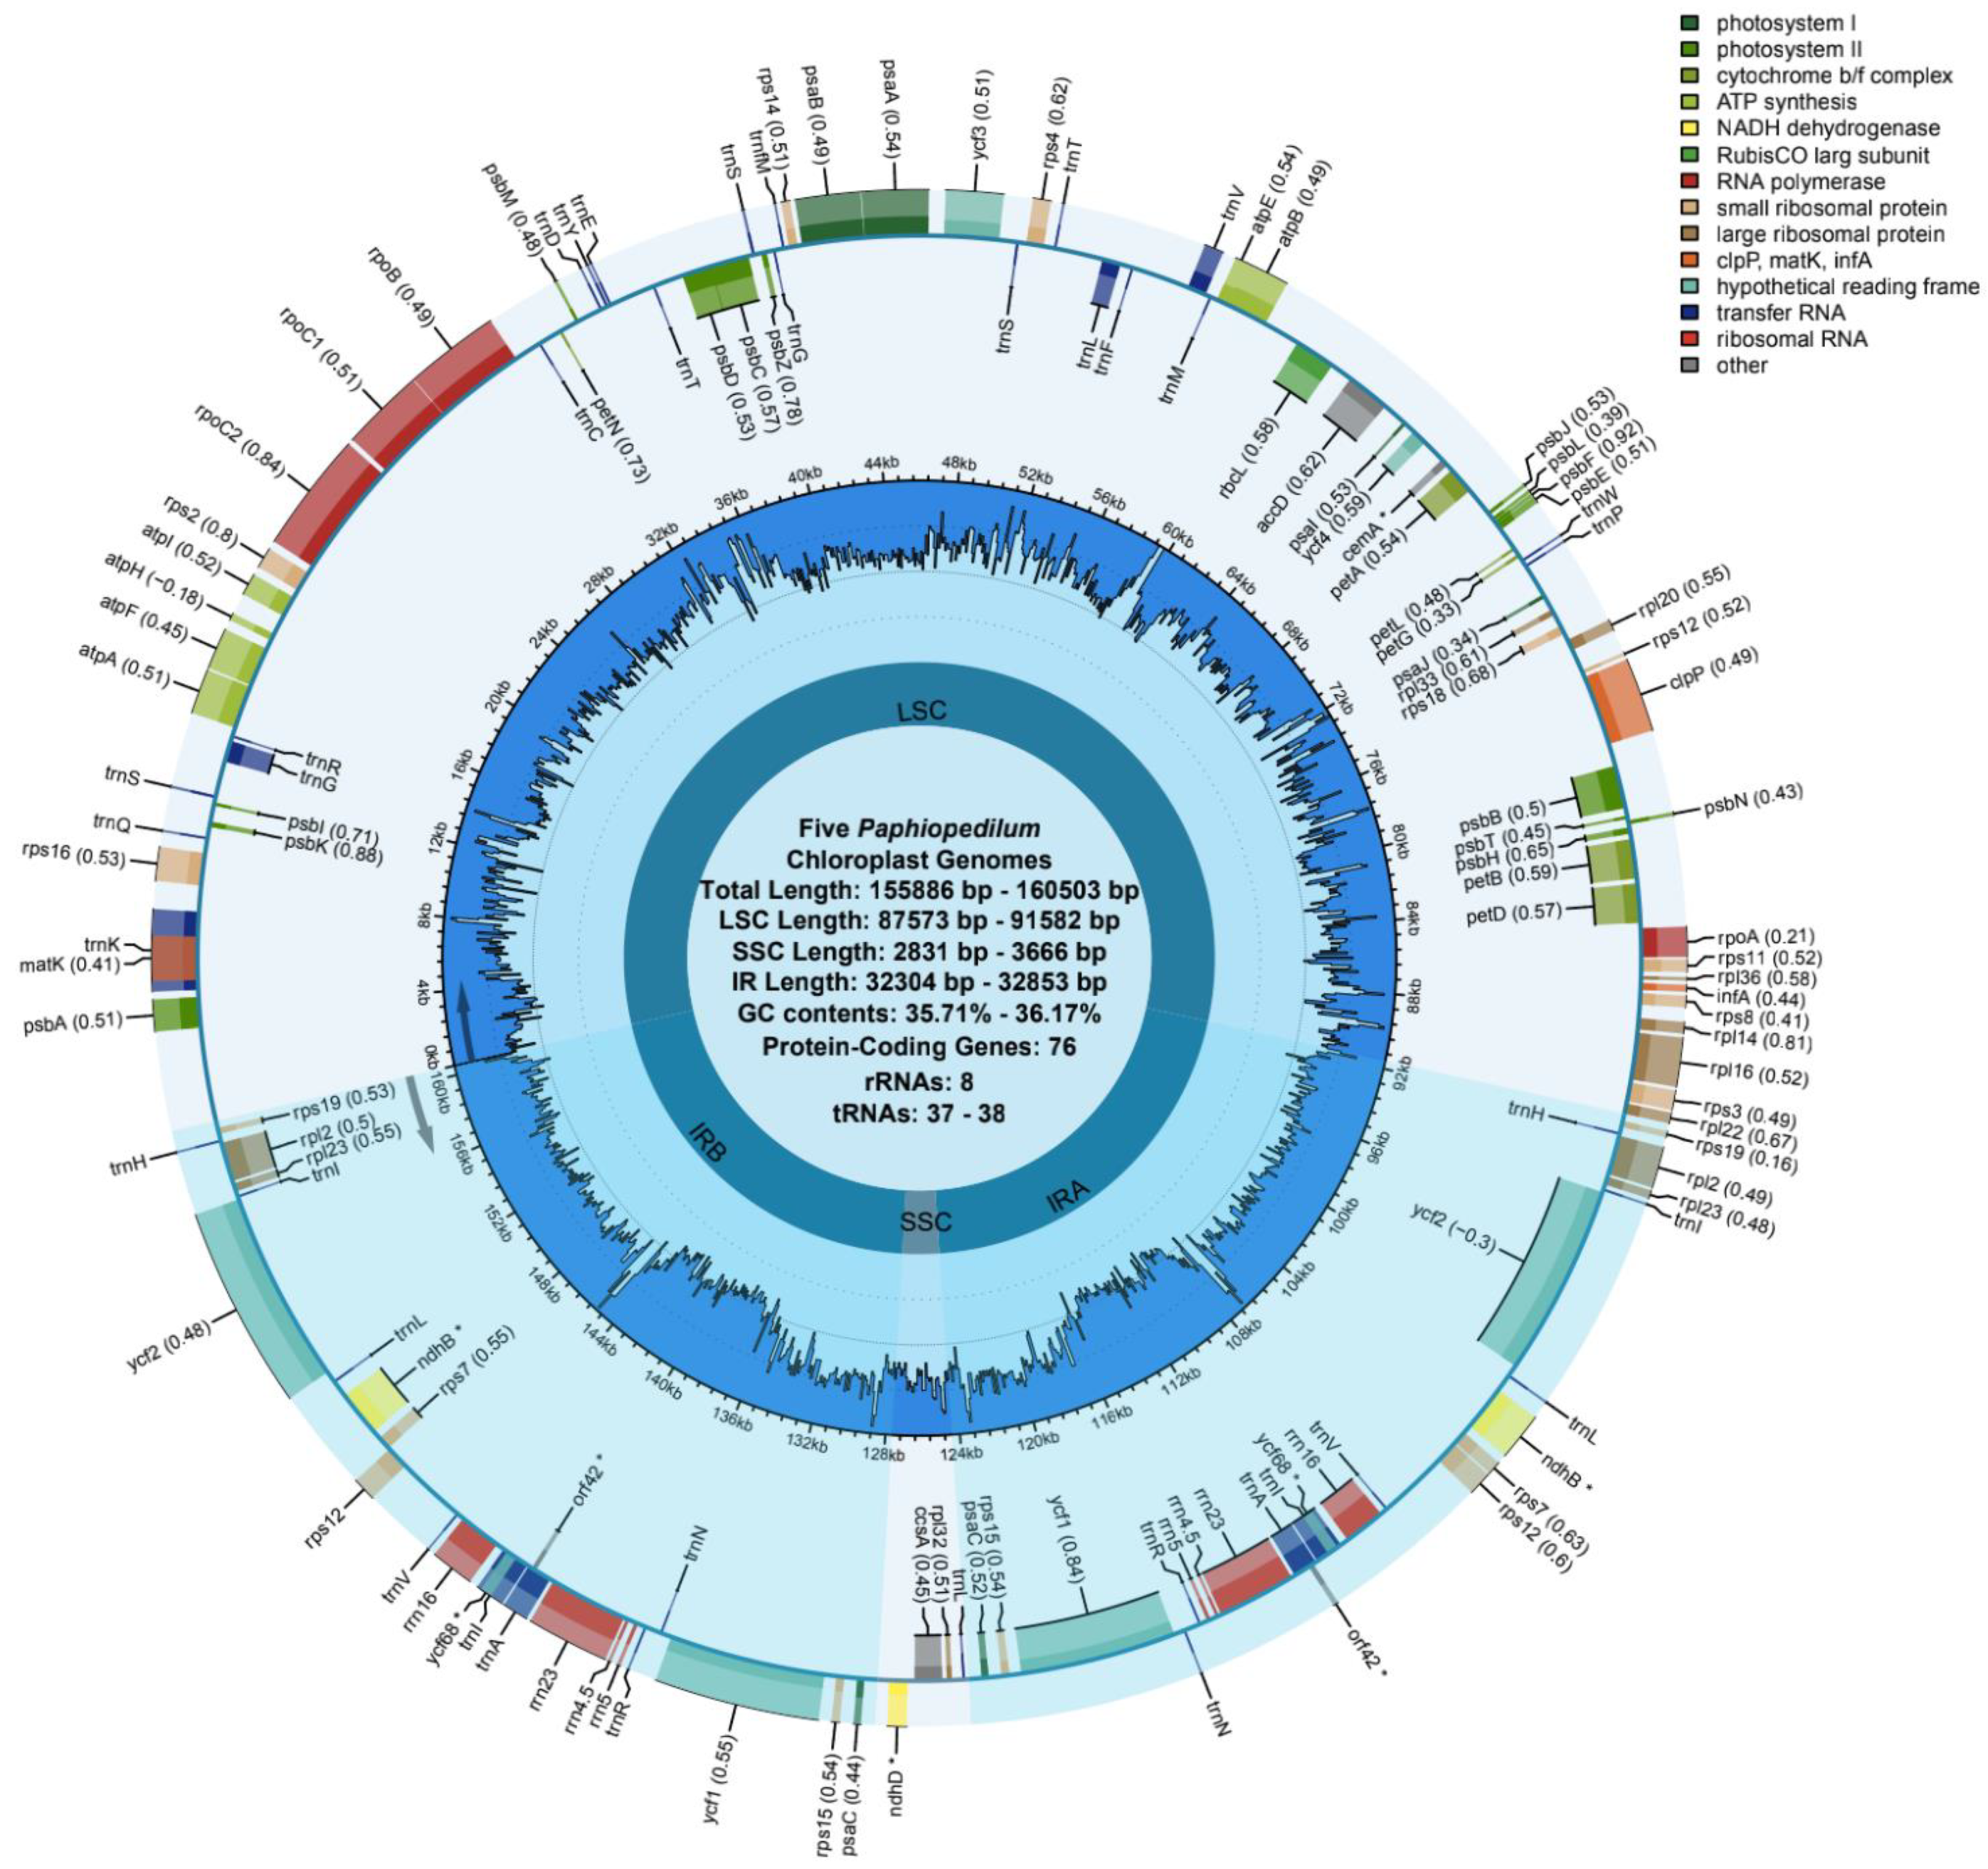
Figure 1. The whole chloroplast genome circle map of the five Paphiopedilum species. The gene names and their codon usage bias are shown on the outermost layer. Directed by arrow, the outside genes are transcribed clockwise, the inner genes are transcribed counter−clockwise, respectively. The gene GC content is plotted in the second circle, depicted in dark blue. The symbol “*” indicated that the pseudogenes in these chloroplast genomes.
Horticulturae 08 00391 g001
Figure 2. Comparison of the borders of the LSC, SSC, and IR regions between 19 chloroplast genomes. JLB, JSB, JSA, and JLA denoted the junction sites of LSC/IRb, IRb/SSC, SSC/Ira, and IRa/LSC, respectively.
Horticulturae 08 00391 g002
Figure 3. Nucleotide diversity of different regions of Paphiopedilum chloroplast genomes. Red line represents the top 5% threshold of the average nucleotide diversity. The genes located around the hot spots of differentiation are marked with arrows.
Horticulturae 08 00391 g003
Figure 4. Codon usage bias reflected by RSCU values of codons for each amino acid.
Horticulturae 08 00391 g004
Figure 5. Circle plot for genome-wide synteny analysis between chloroplast and nuclear genomes. Colored lines representing homologous gene fragments (E value: 10-5, Identity > 99%) share the two different types of genomes. Different colors correspond to each specific chromosome. The lengths of these genomes were scaled and standardized.
Horticulturae 08 00391 g005
Figure 6. The Maximum Likelihood (ML) phylogeny tree and the heat map of the copy’s numbers in protein coding genes for 47 individuals including 41 Paphiopedilum individuals, two Cypripedium individuals, two Phragmipedium individuals and two Lilium individuals. (A) The ML tree of 41 Paphiopedilum individuals plus 6 taxa constructed by using the whole cp genome sequences. Numbers on nodes of the ML tree indicated bootstrap values. The symbols i, ii, and iii were used to indicate the Subg. Paphiopedilum, Subg. Brachypetalum and Subg. Parvisepalum, respectively. The sections within the Subg. Paphiopedilum were also annotated by using the blue bars. (B) The heat map of the numbers of the protein coding genes. Colors reflect the copy numbers of these genes in each species. The pseudogene was colored by brown blocks. The order of the individuals from top to bottom in the heatmap was consist with the ML tree.
Horticulturae 08 00391 g006
Figure 7. Selective pressure of shared protein coding genes in Paphiopedilum. (A) The x-axis represents the Ks (synonymous substitutions) value, while the y-axis represents the Ka (non-synonymous substitutions) value. Red dots represent gene pairs under positive selection (Ka/Ks > 1), and blue dots represent gene pairs under purifying selection (Ka/Ks < 1). (B) Overall distribution pattern of the Ka/Ks value of each gene in Paphiopedilum.
Horticulturae 08 00391 g007
Table 1. The chloroplast genomic features of the five Paphiopedilum species newly assembled in this study.
SpeciesP. barbigerumP. bellatulumP. henryanumP. hirsutissimumP. ‘GZSLKY’ Youyou
Accession No.MN315106MN315107MN315108MN315109MN315105
Total Length155,965156,567155,886156,571160,503
GC (%)35.7235.7135.8936.1736.15
LSCLength (bp)87,70188,24387,57387,99091,582
Length (%)56.2356.3656.1856.2057.06
GC (%)33.1733.2633.3633.6833.83
SSCLength (bp)36463652283136663215
Length (%)2.342.331.822.342.00
GC (%)28.4728.8328.8629.5129.80
IRaLength (bp)32,30432,33632,74132,46732,853
Length (%)20.7120.6521.0020.7420.47
GC (%)39.5839.4239.5639.9139.70
IRbLength (bp)32,31432,33632,74132,44832,853
Length (%)20.7220.6521.0020.7220.47
GC (%)39.5839.4239.5639.9139.70
gene countstotal122122121121122
protein-coding genes7676767676
tRNA3838373738
rRNA88888
Table 2. Genes encoded in the five Paphiopedilum chloroplast genome.
CategoriesGroup of GenesGenes Contents
Genes for Self-replicationtRNA genestrnR-UCU, trnF-GAA, trnV-UAC+, trnP-UGG, trnD-GUC, trnE-UUC, trnY-GUA, trnM-CAU, trnA-UGC+, trnfM-CAU, trnV-GAC, trnW-CCA, trnK-UUU+, trnN-GUU, trnS-GGA, trnI-CAU, trnL-UAA+, trnC-GCA, trnT-UGU, trnS-GCU, trnI-GAU+, trnR-ACG, trnH-GUG, trnS-UGA, trnG-GCC, trnG-UCC+, trnQ-UUG, trnT-GGU, trnL-CAA, trnL-UAG
rRNA genesrrn16S, rrn4.5S, rrn23S, rrn5S
Small subunit of ribosomerps16+, rps2, rps14, rps4, rps18, rps12++, rps11, rps8, rps3, rps19, rps7, rps15, rps12
Large subunit of ribosomerpl33, rpl20, rpl36, rpl14, rpl16+, rpl22, rpl2+, rpl23, rpl32
DNA dependent RNA polymeraserpoC2, rpoC1+, rpoB, rpoA
photosynthesisSubunits of NADH-dehydrogenasendhB *, ndhD *
Subunits of photosystem IpsaB, psaA, psaI, psaJ, psaC
Subunits of photosystem IIpsbA, psbK, psbI, psbM, psbD, psbC, psbZ, psbJ, psbL, psbF, psbE, psbB, psbT, psbN, psbH
Subunits of cytochrome b/f complexpetN, petA, petL, petG, petD+, petD, petB+
Subunits of ATP synthaseatpA, atpF+, atpH, atpI, atpE, atpB
Large subunit of rubiscorbcL
OthersMaturasematK
ProteaseclpP++
Envelope membrane proteincemA *
Subunit of acetyl-CoA-carboxylaseaccD
C-type cytochrome synthesis geneccsA
Translational initiation factor 1infA
unknown functiontRNA genesycf3++, ycf4, ycf1, ycf2, orf42 *, ycf68 *
Notes: Genes with one or two introns were indicated by one (+) or two asterisks (++), respectively; Pseudogenes were marked by (*).
Table 3. The microsatellites and long repeat sequences in Paphiopedilum.
Microsatellite Sequence Interspersed Repeat Sequence Tandem Repeats
Mono-Di-Tri-Tetra-Penta- Hexa- TotalForwardReverseComplementPalindromicTotal1–3031–6061–90>90Total
P. barbigerum70241817613148279975626069215634108208
P. bellatulum602516171110139130686011837615318610187
P. henryanum66241516771351725731157417103221012147
P. hirsutissimum61171323541232171764417661311420412150
P. ‘GZSLKY’ Youyou5716162596129188681614842012218414158
P. appletonianum582713181661381951871501927241792262209
P. armeniacum64451521551552602251802449091852674222
P. concolor68241719127147142127931204821771640197
P. dianthum4926161835117906838792751381440156
P. emersonii68451925681712462171341827791702551201
P. insigne652225185714217356441534261302132156
P. malipoense5334142336133155142881325171321510148
P. tigrinum712625176915423081421935461492011171
P. micranthum5437232176148528951862781632022187
P. parishii5426161827123116116561023901351571158
P. purpuratum56242017135135137109771224452133150249
P. venustum66252024165156186181901225791782031202
P. villosum7433252010121742891461032587961852774223
P. wardii63301525951472001701271866832123043249
Total11775303413821511332714345723801480303010,347299441493773578
Publisher’s Note: MDPI stays neutral with regard to jurisdictional claims in published maps and institutional affiliations.