Article

Effect of Genotype and Harvest Date on Fruit Quality, Bioactive Compounds, and Antioxidant Capacity of Strawberry

1
College of Horticulture, Sichuan Agricultural University, Chengdu 611130, China
2
Institute of Pomology and Olericulture, Sichuan Agricultural University, Chengdu 611130, China
*
Authors to whom correspondence should be addressed.
These authors contributed equally to this work.
Horticulturae 2022, 8(4), 348; https://doi.org/10.3390/horticulturae8040348
Submission received: 13 February 2022 / Revised: 10 April 2022 / Accepted: 14 April 2022 / Published: 18 April 2022
(This article belongs to the Special Issue Berry Crops Production: Cultivation, Breeding and Health Benefits)

Abstract

:
Fruit quality is strongly affected by genotype and harvest date. In this study, parameters regarding fruit quality, bioactive compounds, and antioxidant capacity of different strawberry cultivars at three harvesting dates were quantified to elucidate the influence of genotype and harvest date on strawberry quality. The results showed that harvest date was the major contributor to appearance color, TSS, TA, and TSS/TA ratio of strawberries, while genotype mainly affected firmness, anthocyanin content, and antioxidant capacity. Moreover, the interaction of genotype and harvest date had a primary influence on the content of ascorbic acid. The content of total phenolics and amino acids received the similar influence caused by genotype and harvest date. However, the interaction of genotype and harvest date significantly affected total phenolic content as well. These findings give a better understanding of the influence of the genotype and harvest date on strawberry, which might contribute to breed cultivars with more attractive fruits in terms of quality acceptance and nutritional value.

1. Introduction

Strawberry (Fragaria × ananassa Duch.) is one of the most popular and commonly consumed small fruits worldwide. According to the Food and Agriculture Organization (FAO) of the United Nations, world production of strawberries exceeds eight million tons (FAO 2018). In addition to its unique flavor, attractive color, and preferred organoleptic properties, strawberry is particularly a rich source of a wide variety of nutritive and non-nutritive bioactive compounds, which exert a synergistic and cumulative effect on human health promotion and on the prevention of various diseases such as cancer, cardiovascular diseases, obesity, diabetes, inflammation, and neurological diseases [1,2,3]. Hence, the development of strawberry cultivars rich in bioactive compounds and better flavor is the objective of breeding.
Fruit flavor mostly depends on the contents of total soluble solids (TSS), total acids (TA), and their ratio [4]. TSS is a group of substances that can be dissolved in water, containing sugar, acid, vitamins, minerals, and so on, and sugar is a major constituent of total soluble solids [5,6]. It has been recognized that free amino acids also affect fruit flavor, since some of them are aroma precursors and taste key determinants during fruit maturation [7]. Strawberry fruits are good sources of various kinds of amino acids [8]. The ripe strawberry color is mainly triggered by the composition and contents of anthocyanins [9]. The bioactive compounds in strawberries such as ascorbic acid and polyphenol present high antioxidant capacity [10]. It has been documented that genotypic variation mainly determined these attributes, while harvest date was also an important factor influencing the chemical composition of strawberries [11,12,13,14,15]. For instance, Samykanno et al. [12] reported that both genotype and harvest date had a significant effect on pH, titratable acidity (TA), and TSS/TA ratio, but variations of pH and titratable acidity (TA) in strawberry fruits were mainly attributed to genotypic differences, while total soluble solid (TSS) content was largely related to harvest date. Chandler et al. [16] noted that cultivar rankings shifted for TSS, but not for TA between harvest dates. Winardiantika et al. [11] showed that the total anthocyanin and phenolic compounds received a significant synergistic influence from harvest date and strawberry genotype, which may give rise to the variation of antioxidant capacity [13].
Given the effects of genotype and harvest date on strawberry characteristics, the aim of this study was to evaluate fruit quality, bioactive compounds, and antioxidant capacity of three cultivars harvested at three different times, as well as to propose the genotypes and the harvest date to obtain better quality fruits.

2. Materials and Methods

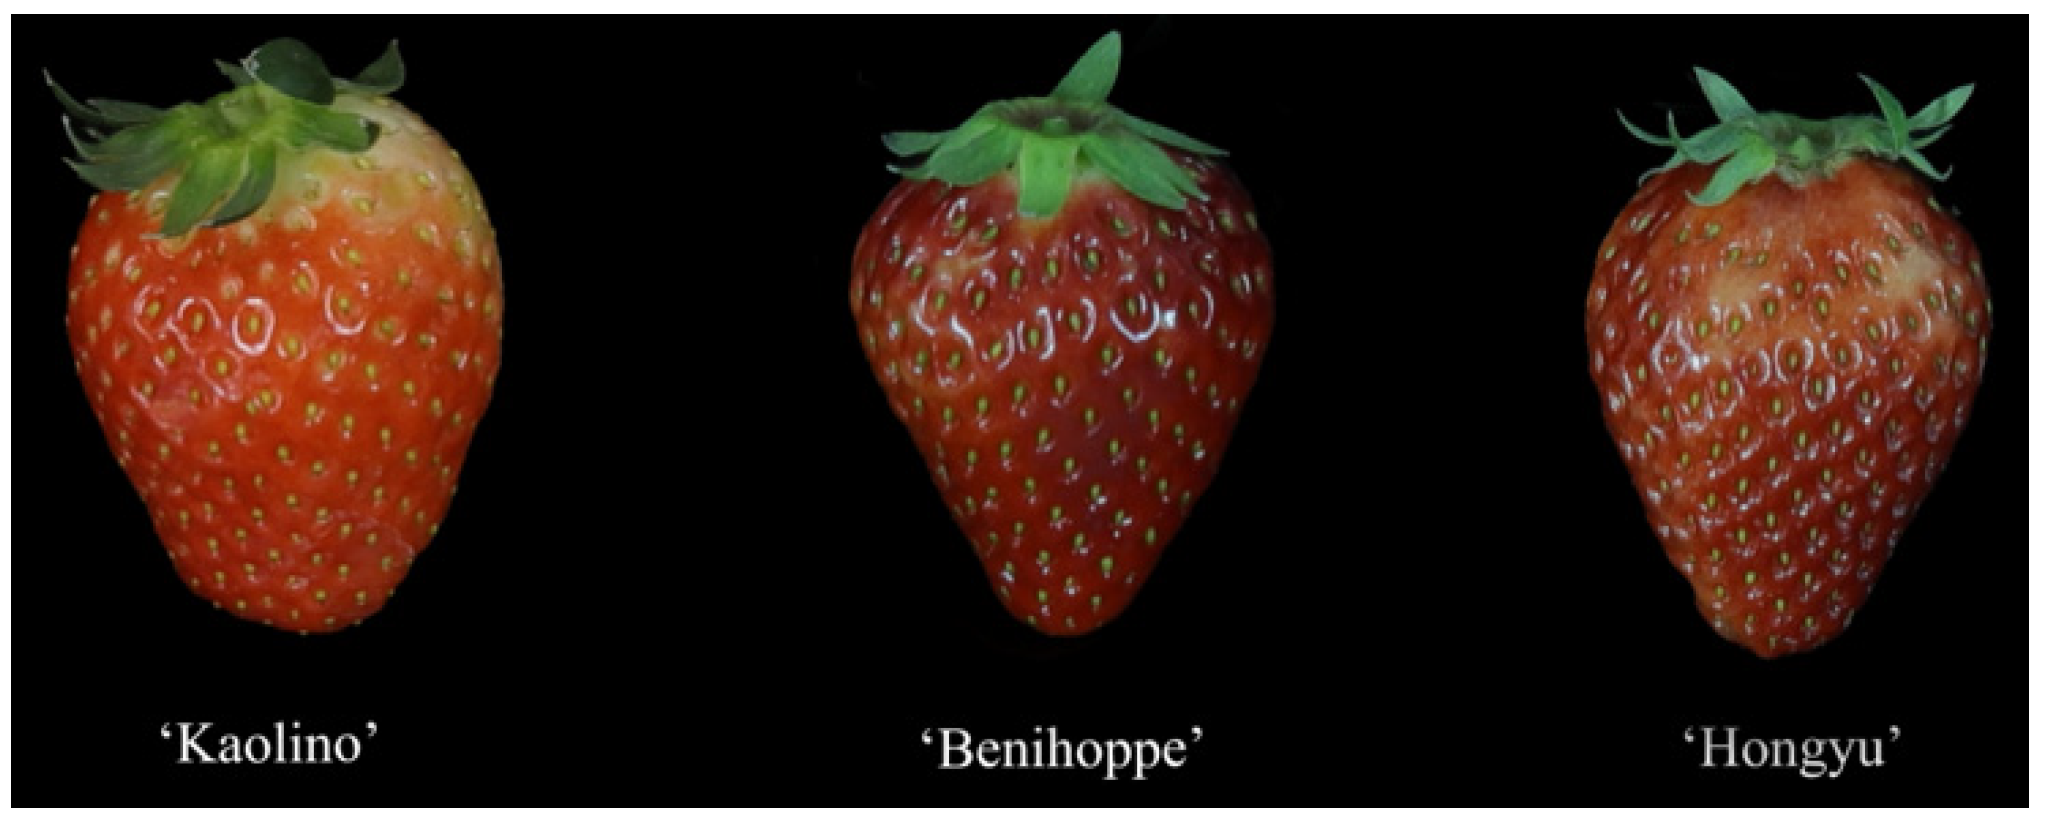
2.1. Experimental site and Plant Materials

Three strawberry cultivars including ‘Kaolino’, ‘Benihoppe’, and ‘Hongyu’ (Figure 1) were grown in a plastic greenhouse under natural conditions in a commercial farm (Dr. Luo Agricultural Development Co., Ltd., Ya’an, China). Strawberry planting was accomplished on 20 August 2018. Fruits were harvested at commercial maturity (three-fourths to full red) on 20 January, 20 February, and 20 March 2019, respectively. These materials were quickly transferred to laboratory. Some samples were used to assess fruit surface color and firmness, and others were frozen in liquid nitrogen and then stored at −80 °C for nutrient composition and antioxidant capacity analysis.

2.2. Fruit Color and Firmness Assessment

The fruit color assessment was performed using a handheld chromameter CR-400 (Konica Minolta, Japan) determining L*, a*, b* color parameters. The L* scale ranges from 0 (the darkest black) to 100 (the brightest white) to represent lightness. The a* and b* scales indicate color composition; a* is the scale of green to red from negative to positive direction, whereas b* varies from blue to yellow. The fruit firmness was measured with a fruit firmness meter (FR-5105, Lutron, Japan). Each fruit was measured twice in opposite sides of its equatorial zone [17]. Results were recorded in newtons (N).

2.3. Total Soluble Solid, Titratable Acid, and Ascorbic Acid Content Determination

The total soluble solid (TSS) content of the squeezed strawberry juice was measured using a pocket refractometer (PAL-1, Atago, Japan) and expressed as a percentage (%). The titratable acid (TA) content was determined by titration method with 0.1 mol/L NaOH and expressed as the percentage of citric acid on a fresh weight (FW) basis [18]. The ascorbic acid (AsA) was determined according to the method of Zhang and Kirkham [19] and expressed as mg of AsA per 100 g of FW.

2.4. Total Anthocyanin, Phenolic Content, and Antioxidant Capacity Assay

Total anthocyanins were determined by a pH differential method at 496 nm and 700 nm in buffers at pH 1.0 and 4.5 [20] and expressed as mg of pelargonidin-3-glucoside per 100 g FW. Total phenolic content was estimated according to the Folin–Ciocâlteu procedure as used by Molan et al. [21]. Briefly, the extract was mixed with 2% sodium carbonate solution for 5 min. Then, Folin–Ciocâlteu phenol reagent (50%) was added and allowed to stand for 30 min. All reactions were conducted at room temperature. The absorbance was read at 650 nm with a plate reader (Varioskan LUX, Thermo Fisher Scientific, Waltham, MA, USA). Gallic acid (Sangon, Shanghai, China) was used as a standard, and the results were expressed as mg of gallic acid per g FW.
The 1,1-diphenyl-2-picryl-hydrazyl (DPPH) radical-scavenging capacity and the ferric reducing antioxidant power (FRAP) assays were used to evaluate strawberry antioxidant capacity. DPPH assay was conducted according to the method outlined by Brand-Williams et al. [22] with some modifications. Briefly, 2.8 mL of a 60 μM solution of DPPH in ethanol was mixed with 200 μL of sample solution. The mixture in the test tubes was shaken well and incubated in the dark for 30 min at room temperature. Then, the absorbance was recorded at 517 nm. The scavenging activity was estimated according to the inhibition percentage of DPPH using the following equation: % inhibition of DPPH radical activity = (absorbance Control − absorbance sample)/absorbance Control × 100. The FRAP assay was performed according to the method described by Benzie and Strain [23]. Briefly, 20 µL of extract was added to 1.8 mL of the working FRAP reagent consisting of 300 mM acetate buffer (pH 3.6), 10 mM TPTZ, and 20 mM FeCl3·6H2O in a 10:1:1 (v/v/v) ratio. Then, the reaction mixture was warmed at 37 °C for 30 min before use. The absorbance was measured at 593 nm. The results were expressed as mmol FeSO4·7H2O per 100 g of FW.

2.5. Amino Acid Content Measurement

Amino acids were detected by an amino-acid automatic analyzer (Hitachi L8900, Tokyo, Japan) according to the previous method [24]. Different amino acids were eluted on a sulfonic acid cation exchange column (4.6 mm × 60 mm, 3 μm) using several buffers with different pH and ion concentrations at 0.04 mL/min sequentially. The ninhydrin flow rate was kept at 0.35 mL/min. The reaction and separation columns were set at 135 °C and 57 °C, and channels 1 and 2 were set at 570 nm and 440 nm, respectively. The injection volume was 20 μL. The amino-acid standards were purchased from Sinopharm Chemical Reagent Co., Ltd.

2.6. Statistical Analysis

Data were subjected to analysis of variance using the general linear model procedure to determine the main effects and interactions, and means were compared using Duncan’s multiple range test at a significance level of 0.05. Moreover, principal component analysis (PCA) was analyzed using R package 4.1.1; FactoMineR was used to compute PCA, and factoextra was used to produce ggplot2-based visualization of PCA results.

3. Results

3.1. Source of Variation (F Value) in Quality Traits of Strawberry

To analyze the variation source of quality traits of strawberry across harvest dates, statistical F-tests were conducted. As shown in Table 1, both genotype and harvest date could significantly cause the variation in quality attributes except FRAP, while the interaction of genotype and harvest date significantly gave rise to the variation of multiple quality parameters, except antioxidant activities and TAA level. It also appears that the variation in L*, a*, TSS, TA, and TSS/TA ratio was mainly attributed to harvest date, while the variation in F, b*, ANT, and DPPH was primarily triggered by genotype, and only the variation in AsA was mainly due to genotype and harvest date interaction. In addition, the effect of genotype, harvest date, and their interaction on TP was similar, whereas genotype and harvest date had a similar effect on TAA.

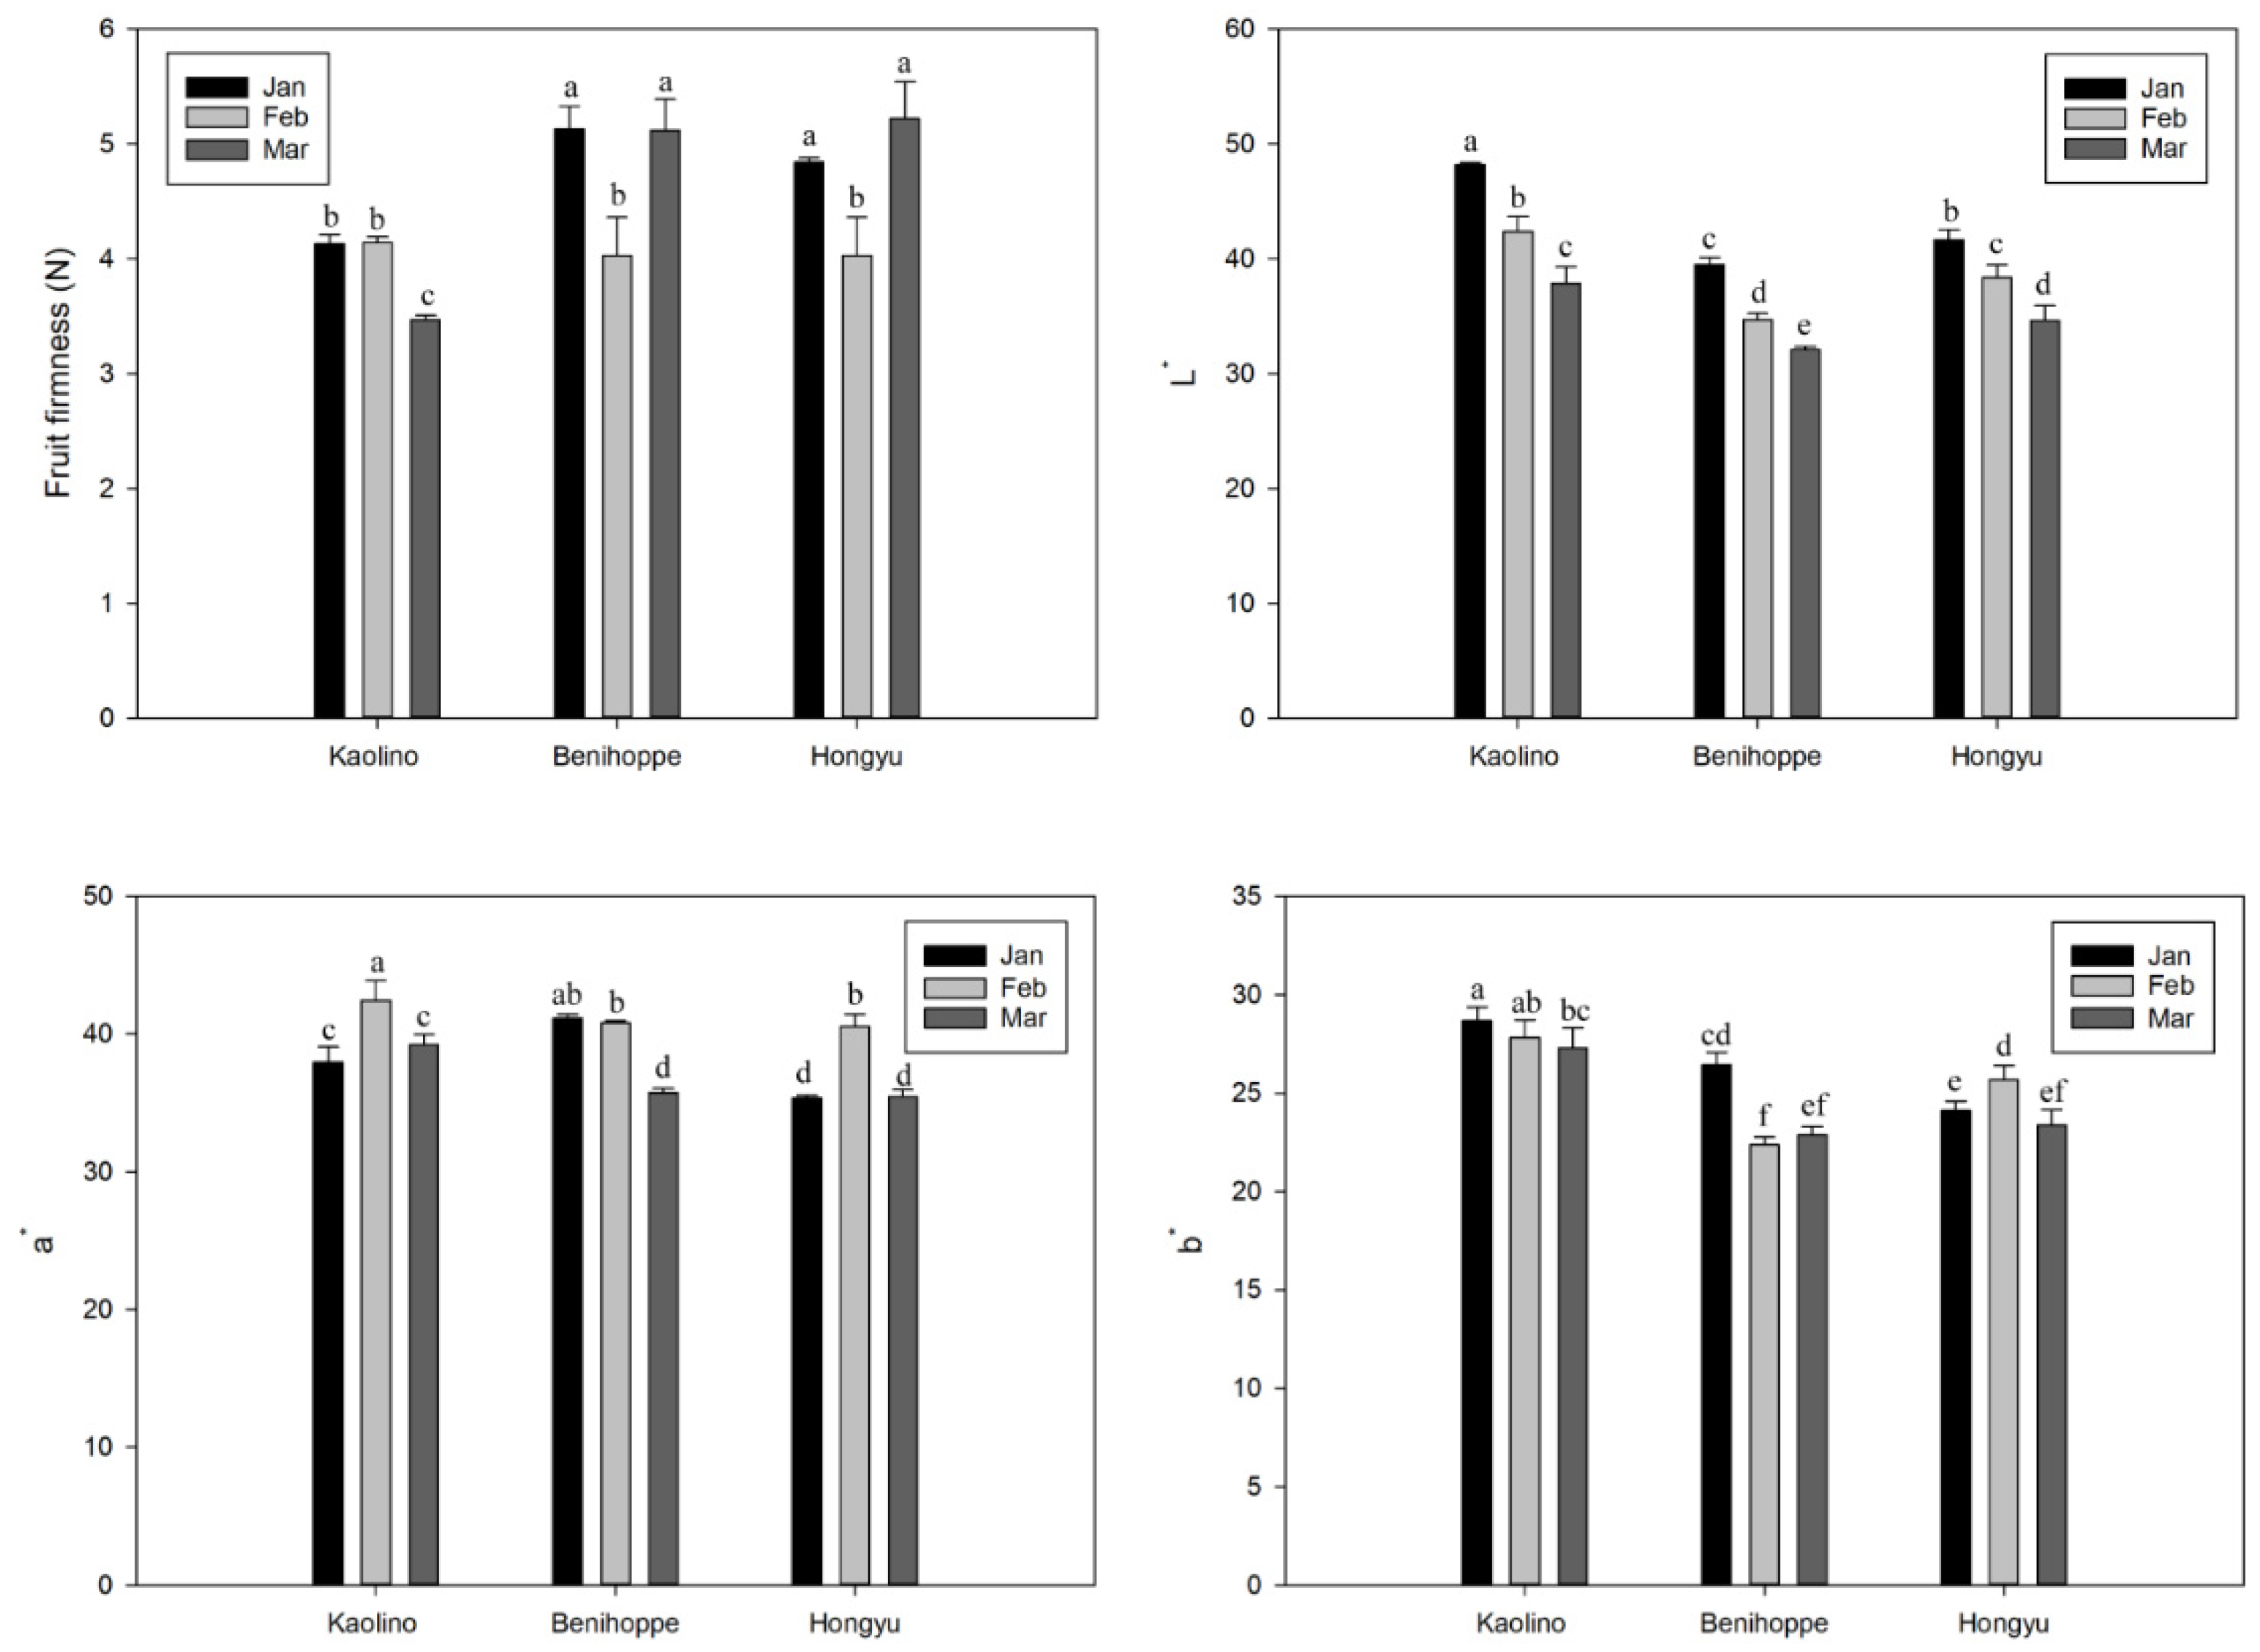
3.2. Fruit Firmness and Surface Color

Fruit firmness and color are important factors that can affect consumers’ quality perception of strawberry fruit. Firmness in cultivars ‘Benihoppe’ and ‘Hongyu’ had no significant differences and showed a similar trend at different harvest dates. Cultivar ‘Kaolino’ showed lower firmness than the other two analyzed cultivars, especially in March. The value of L* decreased in three cultivars at the later harvesting date. ‘Benihoppe’ had a significantly lower L* value at each harvest date, compared with ‘Kaolino’ and ‘Hongyu’. Value a* was generally higher in February strawberries. Furthermore, cultivar ‘Kaolino’ showed a relatively higher b* value than other two cultivars over the harvest date (Figure 2).

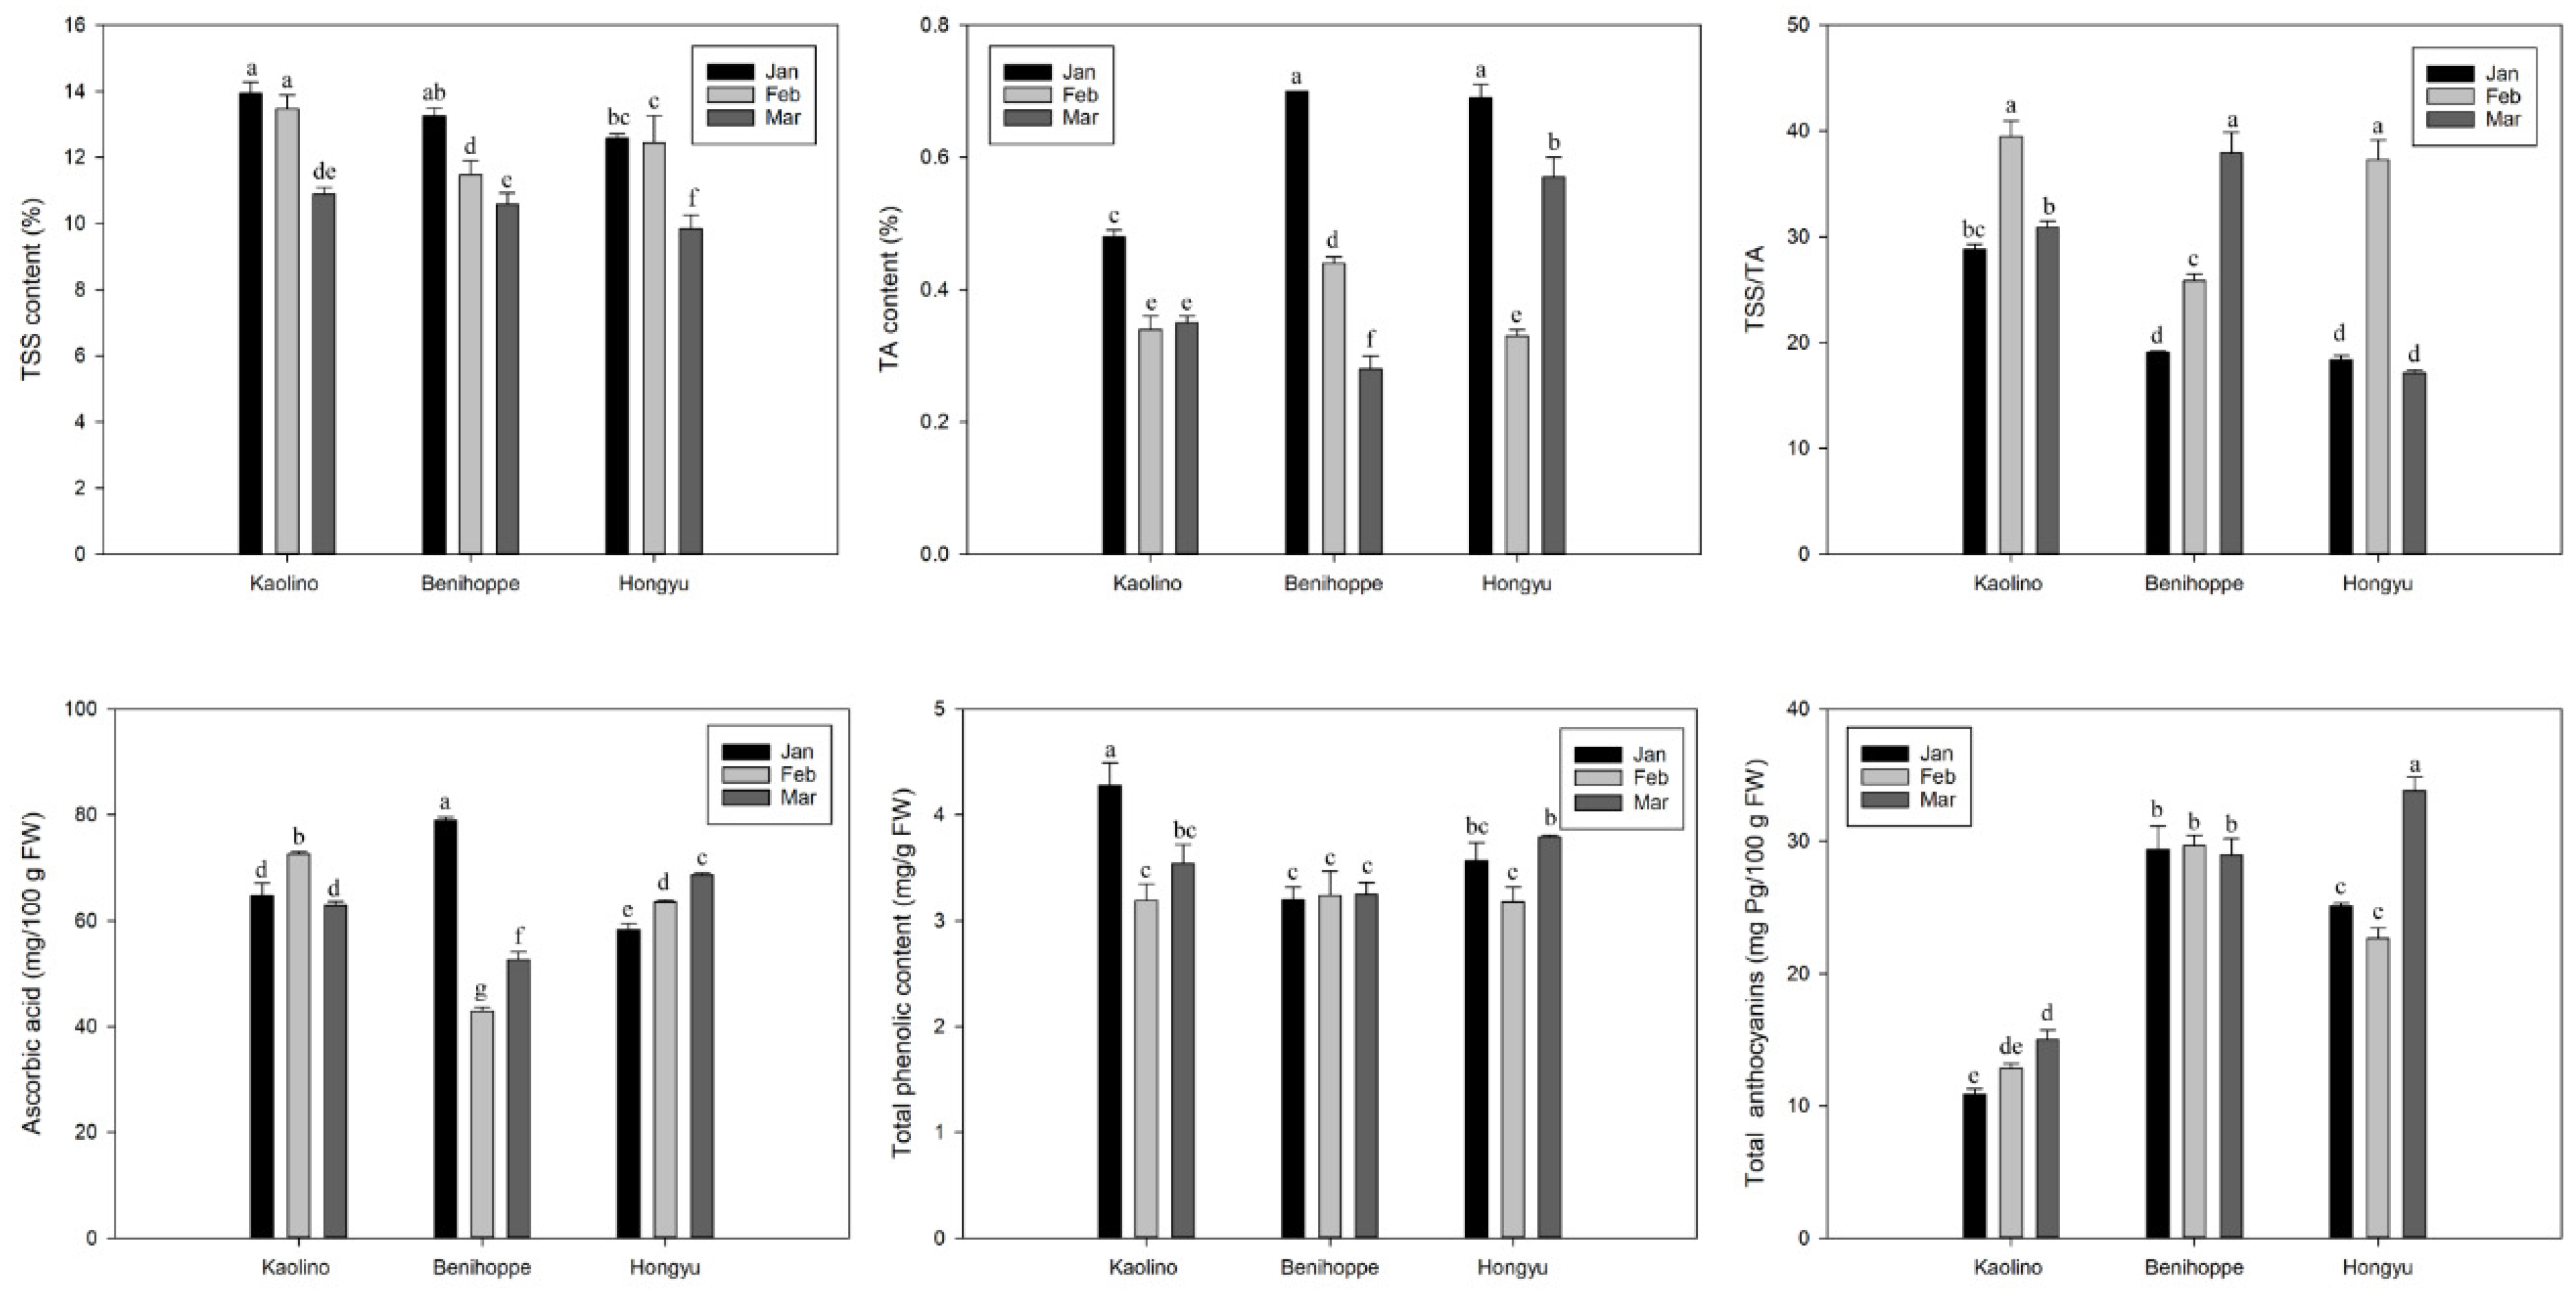
3.3. TSS, TA, TSS/TA Ratio, AsA, Total Phenolics, and Anthocyanins

All genotypes had a higher TSS content in January and February than in March, especially for Benihoppe. There was a great seasonal variation for TA content, and the highest TA content was obtained in January in three cultivars. The TSS/TA ratio in ‘Kaolino’ or ‘Hongyu’ was highest in February and showed no significant difference between January and March. In ‘Benihoppe’, the TSS/TA ratio remarkably increased at the later harvesting date. The highest and lowest contents of AsA were obtained in January and February, respectively for Benihoppe. AsA content in ‘Hongyu’ noticeably increased at the later harvesting date, while AsA content in ‘Kaolino’ showed no significant difference in January and March. Clearly, harvest date did not affect the accumulation of total phenolics and anthocyanins in ‘Benihoppe’. The total phenolic content in ‘Benihoppe’ from harvest date to harvest date was generally lower than the other two cultivars. ‘Kaolino’ had lower anthocyanin content than ‘Benihoppe’ and ‘Hongyu’ for the three harvest dates, while ‘Benihoppe’ accumulated more anthocyanins than ‘Hongyu’ except for March (Figure 3).

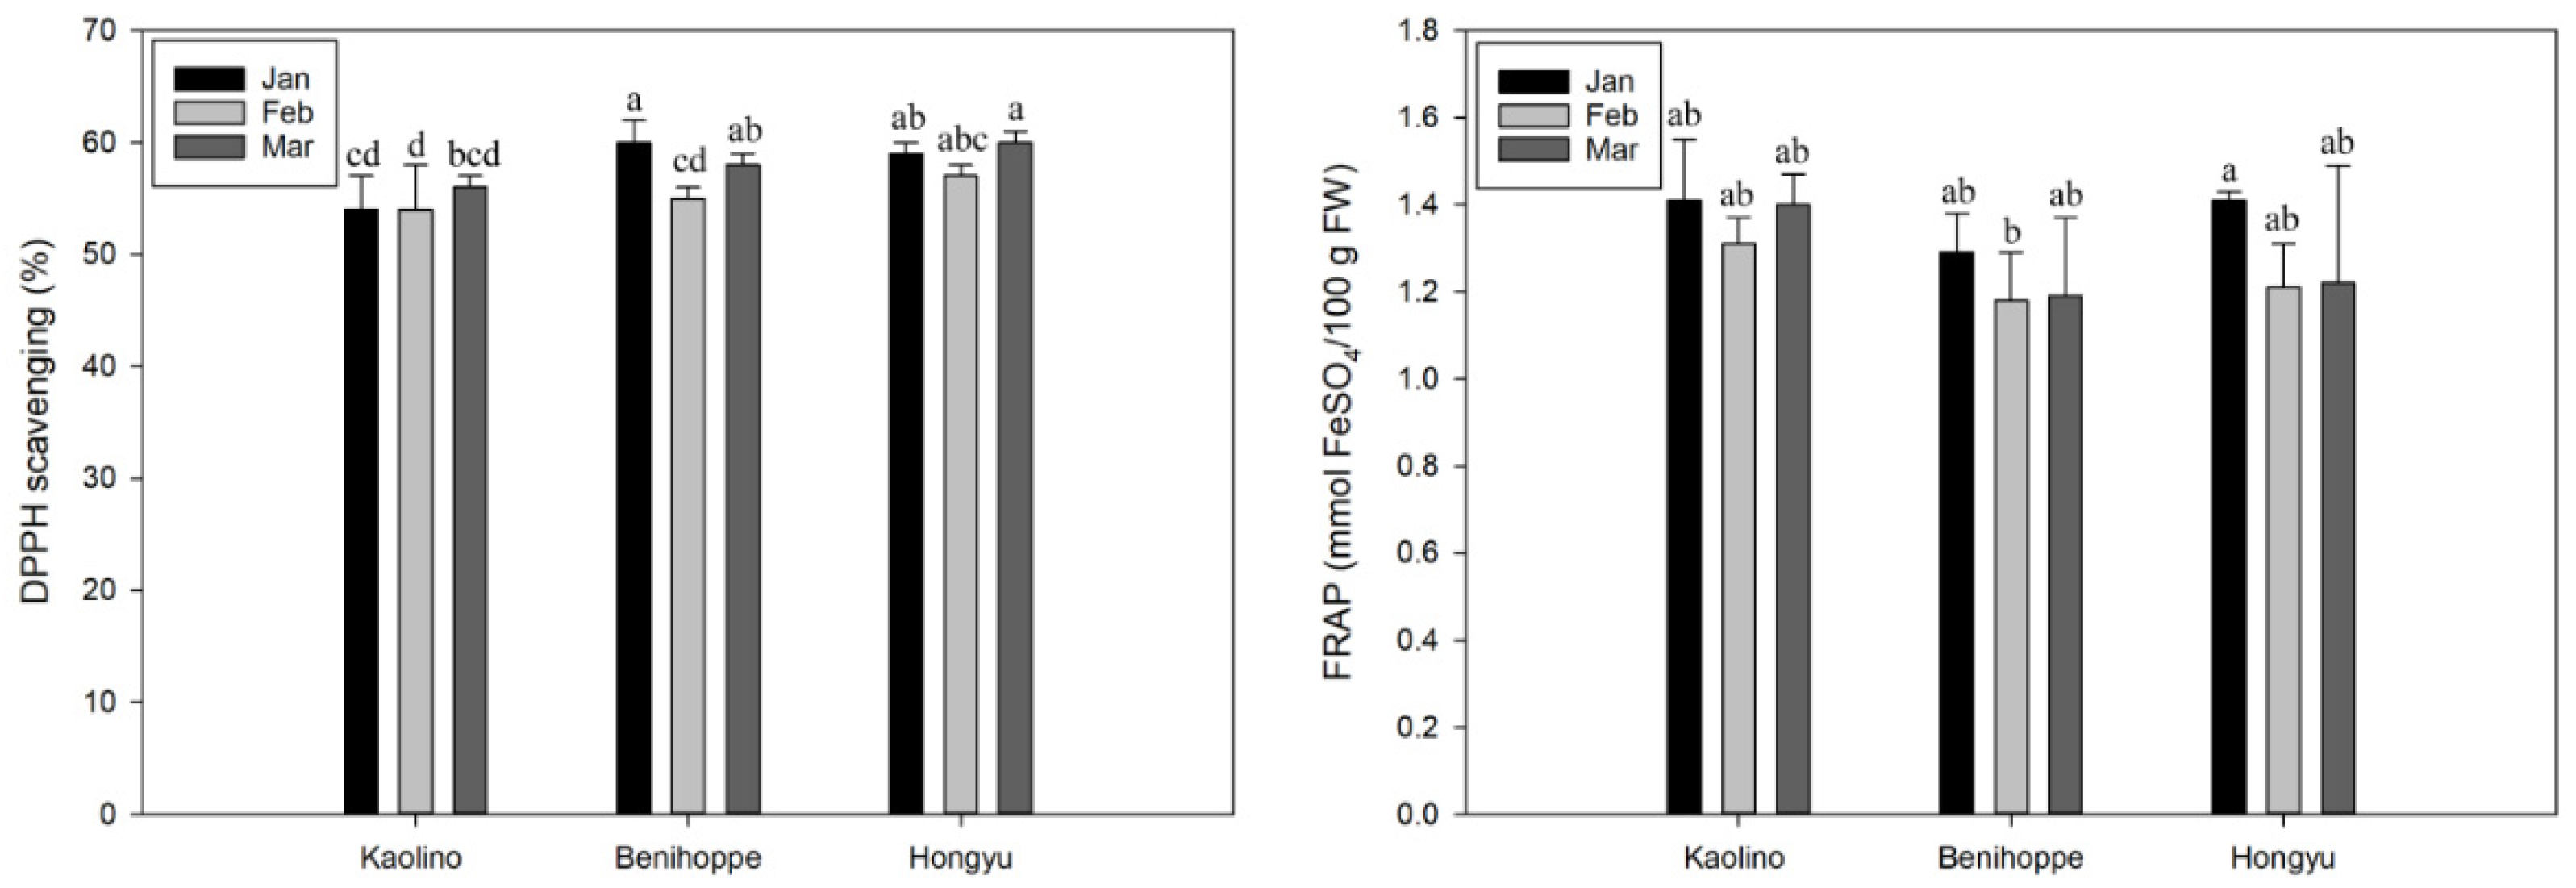
3.4. Antioxidant Capacity
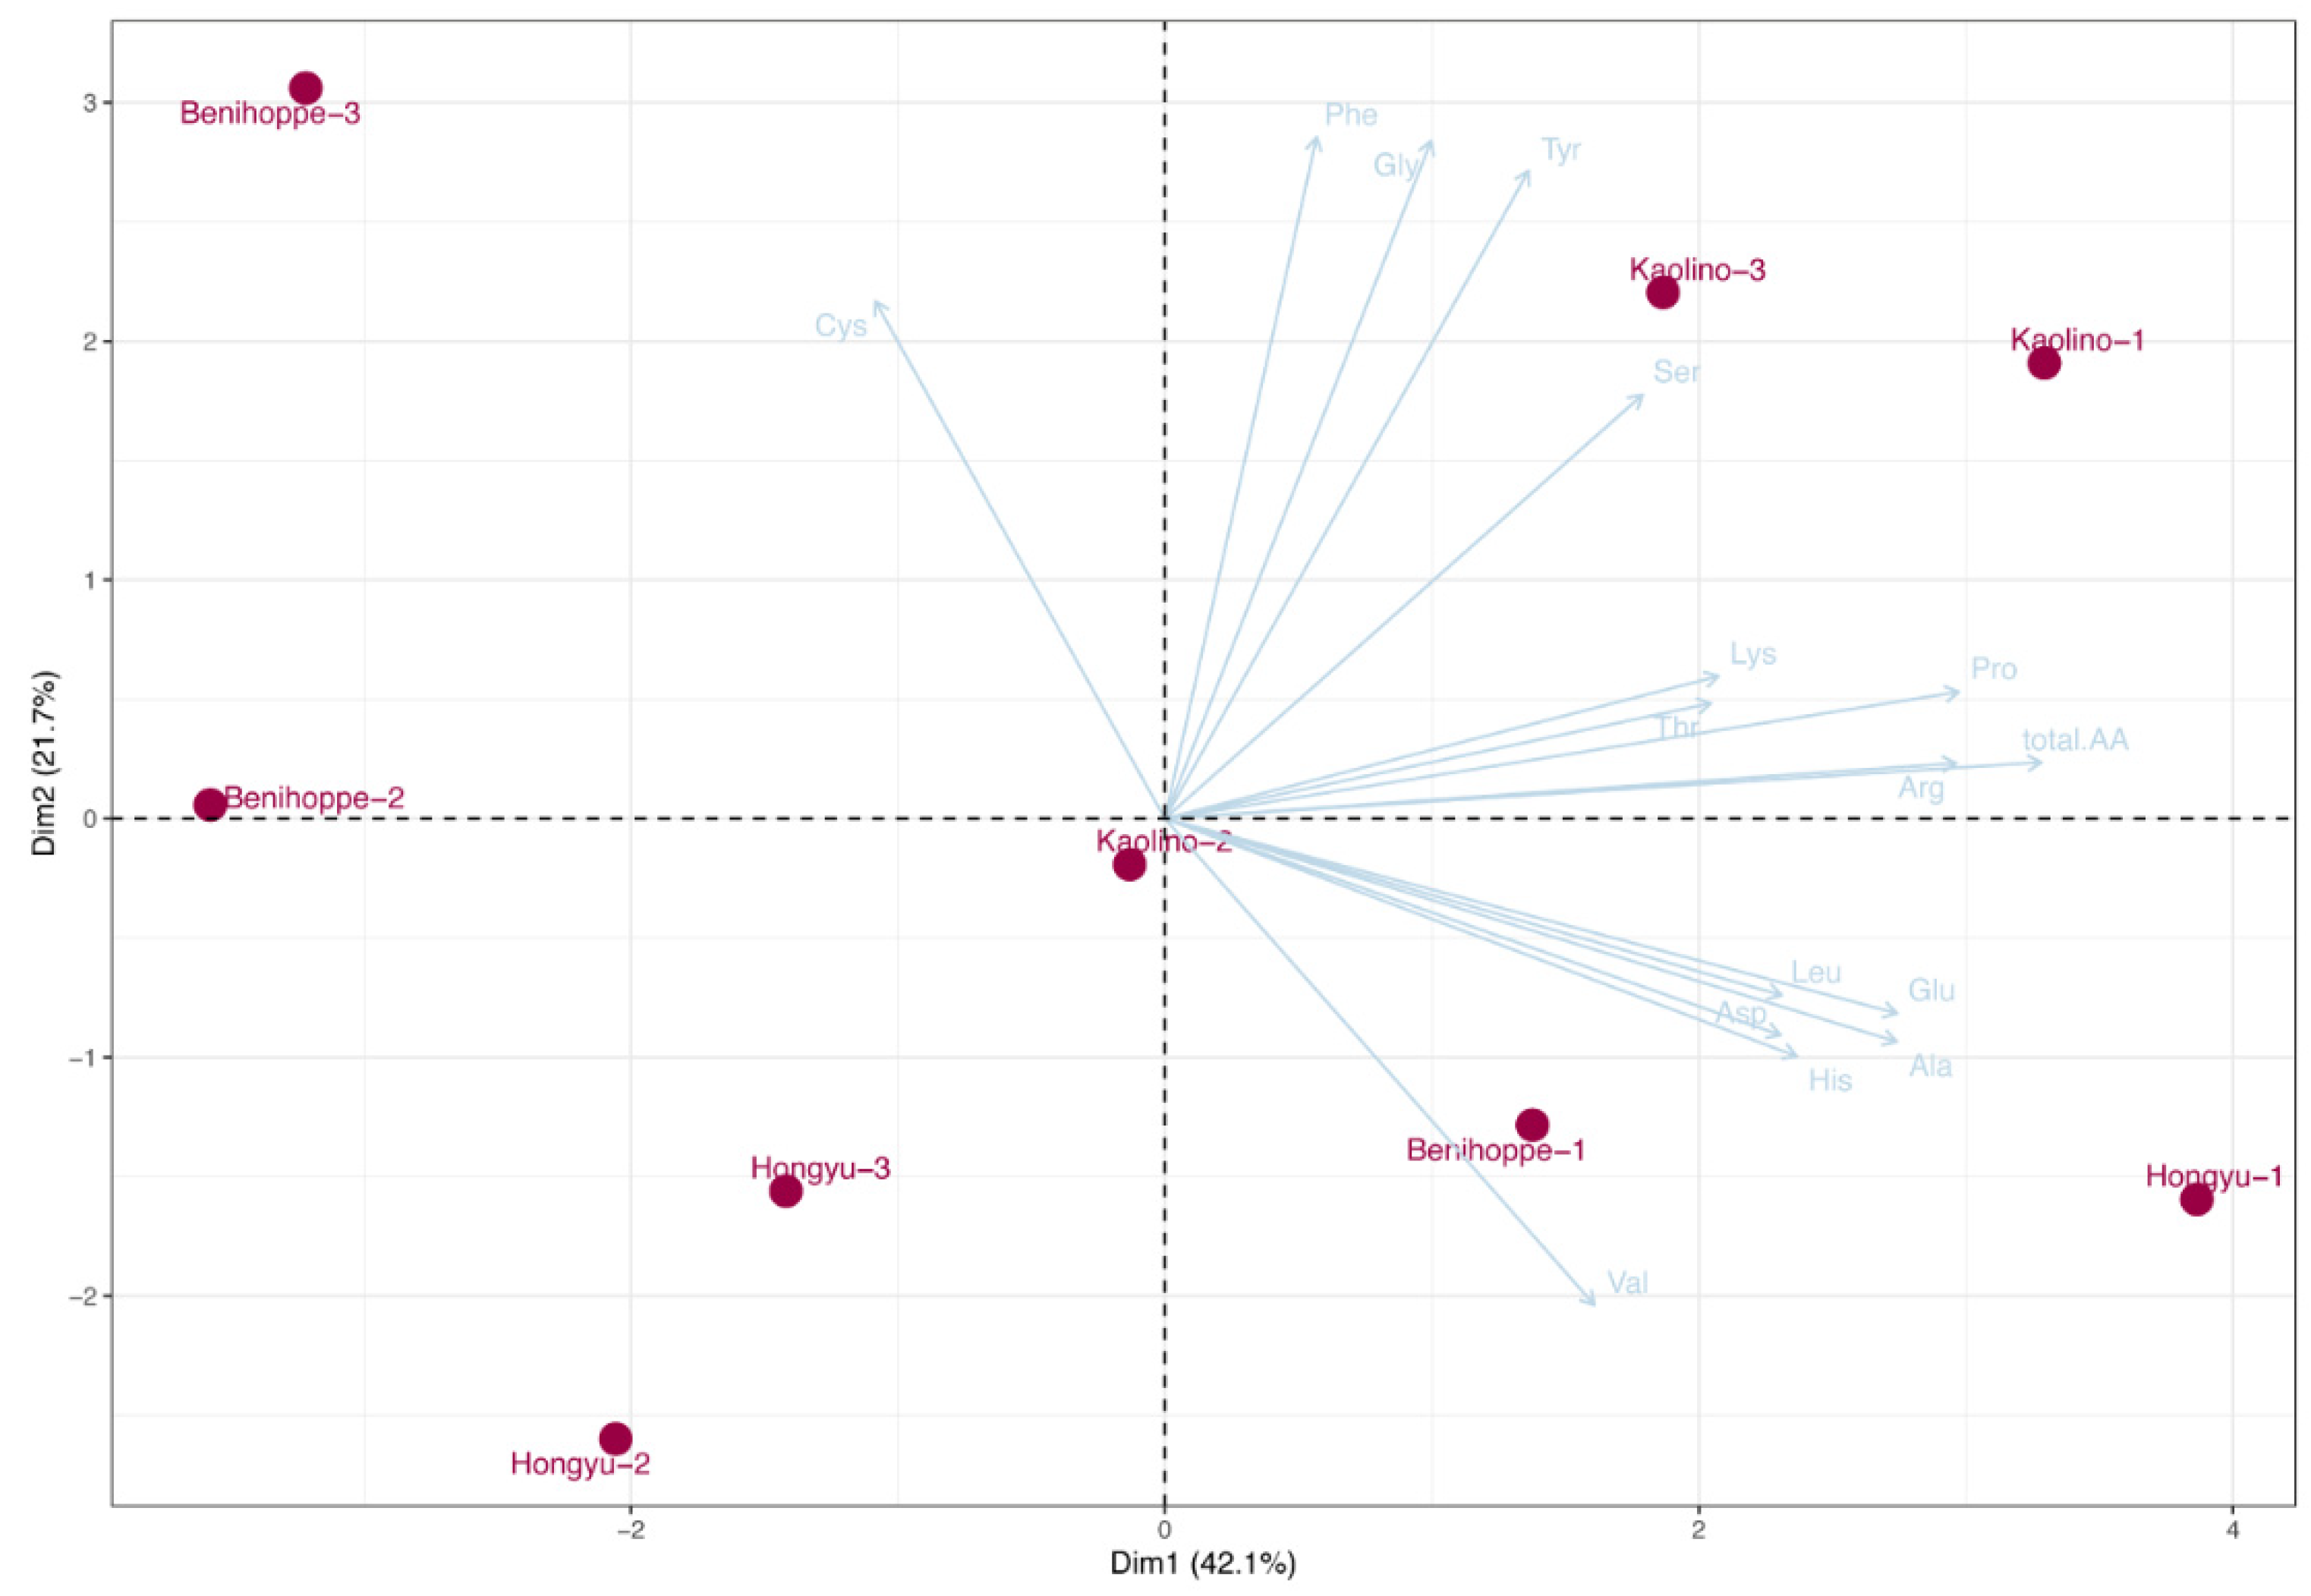
The antioxidant capacity was investigated using both FRAP and DPPH assays. The lowest antioxidant capacity was detected in February, but showed almost no significant difference from the other two harvesting dates in the same cultivar. The three cultivars were not significantly different at the three harvesting dates at the FRAP level. Interestingly, the antioxidant capacity of ‘Kaolino’ was lower than the other two cultivars at all harvesting dates except February ‘Benihoppe’ at the DPPH level (Figure 4).

3.5. Amino Acid

The amino acids of the three cultivars at three different harvesting dates are shown in Table 2 and Table 3. A total of 15 amino acids could be detected in this study. Of the eight essential amino acids, strawberries had five (Lys, Phe, Thr, Leu, and Val). Asp and Glu were the main amino acids found in the three cultivars. Their content declined at the later harvesting date, but was hardly affected by harvest date within certain cultivars. In March, ‘Kaolino’ had the highest levels of Thr and Ser, compared with ‘Benihoppe’ and ‘Hongyu’. The content of Gly in ‘Kaolino’ at all three harvesting stages was higher than the other two cultivars except for ‘Benihoppe’ in March. There was no significant difference for Ala among all genotypes at the same harvest date. Cys was almost undetectable in all samples. Harvest date and genotype had almost no impact on Ser, Val, and Phe. Leu, Arg, and Pro showed the highest levels in January for each cultivar, with almost no significant difference between February and March among the three cultivars. The change in harvest date did not obviously influence the Tyr accumulation in a specific cultivar. Lys content in January was highest in ‘Benihoppe’ and ‘Hongyu’, but the opposite result in ‘Kaolino’. The pattern of His accumulation was almost consistent in all cultivars across all harvesting dates. Obviously, the total amino acids (TAA) in ‘Kaolino’ were highest on all three harvest dates, while the TAA in ‘Benihoppe’ was lowest. Additionally, the TAA in ‘Benihoppe’ and ‘Hongyu’ gradually decreased at the later harvesting date.
Principal component analysis (PCA) was used for the investigation of necessary components to explain the greater part of variance with a minimum loss of information and to find the relationship between objects. The results explained that the first principal component (PC1) and PC2 accounted for 42.1% and 21.7% of the total variation, respectively. As shown in Figure 5, most of amino acids were grouped on the right side of PCA plot. By overlapping the positions of amino acids and analyzed samples, it was evident that ‘Kaolino’ and strawberries produced in January showed higher performance in terms of amino acids, indicating that the content of amino acids was co-regulated by genotype and harvest date.

4. Discussion

The quality of strawberry is a result of the complex balance among appearance, aroma, texture, and sweetness, which affects consumers’ liking and willingness. In recent years, the high content of health-promoting compounds such as anthocyanin, ascorbic acid, and polyphenol in strawberry has attracted more attention [25,26,27]. Several reports available in the literature indicate that the key factors affecting fruit quality attributes and bioactive compounds include genotype and harvest dates [28,29,30].
It is well known that different strawberry varieties display a wide range of fruit firmness [17,31,32]. In the present study, ‘Benihoppe’ and ‘Hongyu’ fruits were clearly firmer than ‘Kaolino’, although the firmness was affected by harvest date. The analysis of variance showed that the variation in firmness could be mainly attributed to genotypic differences since relatively large differences among the firmness of the three cultivars were observed for three harvest dates. Hence, it is a potential strategy to conduct strawberry classification with respect to firmness. Šamec et al. [13] reported that appearance color was more under the influence of genotype, whereas sampling dates did not affect the color of the cultivars. In contrast with that study, our results showed that both harvest date and genotype had a significant effect on color (L* and a* value), with harvest date playing a greater role. The value of L* decreased in ‘Kaolino’, ‘Benihoppe’, and ‘Hongyu’ at the later harvesting date, while the value of a* was generally higher in February strawberries.
In addition to firmness and appearance color, parameters such as TA, TSS, and TSS/TA have a critical role in determining strawberry fruit quality. In our study, TA, TSS and TSS/TA ratio depended on harvest date and genotype, consistent with the observations of other authors [12,33]. Moreover, their variance caused by harvest date appeared to be larger. However, some other reports showed that the variance of TA was mainly genetically determined, while the variance of TSS may have been predominantly due to the harvest date [12,16,34,35]. ‘Kaolino’ and ‘Hongyu’ were interesting for their higher TSS/TA ratio in February, while ‘Benihoppe’ had a higher TSS/TA ratio in March. For an acceptable strawberry flavor, a minimum TSS of 7% and a maximum TA of 0.8% are recommended [36]. Hence, continuously monitoring TSS, TA, and TSS/TA ratio across production season can individuate the optimum strawberry harvesting time for better taste quality to fulfill consumers’ expectations.
AsA, TP, and ANT in fruit play important roles in scavenging reactive oxygen species. It has been documented that they are controlled by genotype and external conditions [37,38,39]. Our results showed that cultivar and harvest date noticeably influenced their accumulation, and significant interactions between genotype and harvest date was also observed in these traits, in accordance with a previous study in strawberry [40]. Anthocyanin was more affected by genotype, as reported elsewhere [39,41], while AsA was more affected by the interaction of genotype and harvest date. In addition, FRAP data showed that the antioxidant capacity was not influenced by cultivars and harvest date, in contrast to the result of DPPH, which was significantly regulated by the two factors. Clearly, the antioxidant capacity of ‘Kaolino’ was lower than that of the other two cultivars across all harvesting dates except ‘Benihoppe’ in February at the DPPH level. The different results of antioxidant capacity given by the FRAP and DPPH method may be due to their different reaction principles.
Several studies have shown that amino acids influence plant resistance and fruit quality [42,43,44]. For instance, proline is involved in response to various environmental signals related to abiotic or biotic stress [45,46,47]. l-Glutamate is responsible for ‘umami’ or delicious taste; it was reported that glutamate is the principal free amino acid of ripe fruits of cultivated varieties in tomato [42]. l-Glycine, l-alanine, serine, and proline provide sweetness [7]. Hence, an investigation of the factors influencing amino-acid accumulation can contribute to strawberry breeding. It was shown that Asp and Glu were the main amino acids found in ‘Kaolino’, ‘Benihoppe’, and ‘Hongyu’, while different results were obtained in other strawberry cultivars [8,45]. The contents of Asp and Glu decreased at the later harvesting date, but were hardly affected by harvest date within a certain cultivar. However, the total amino acid (TAA) displayed a similar effect of genotype and harvest date. ‘Kaolino’ had the highest TAA across the three harvest dates, while ‘Benihoppe’ had the lowest TAA content. The TAA content gradually declined in ‘Benihoppe’ and ‘Hongyu’ at the later harvesting date. PCA results confirmed that the discrepancy in amino acids of strawberry was related to cultivar differences and seasonal collection.

5. Conclusions

The fruit quality, bioactive compounds, and antioxidant capacity of strawberries were jointly regulated by genotype and harvest date. In particular, the harvest date was closely influenced by environmental factors such as light, temperature, and water. Consequently, growers may make an effort to manage environmental factors during fruit production to achieve stability of the above properties after selecting a suitable cultivar.

Author Contributions

Conceptualization, H.T. and Y.L. (Ya Luo); methodology, Y.Z. (Yunting Zhang) and M.Y.; validation, M.Y. and G.H.; visualization, Y.Z. (Yong Zhang) and Q.C.; software, Y.L. (Yuanxiu Lin) and M.L.; formal analysis, Y.W. and W.H.; writing—original draft preparation, Y.Z. (Yunting Zhang); writing—review and editing, Y.L. (Ya Luo); supervision, X.W., H.T. and Y.L. (Ya Luo). All authors have read and agreed to the published version of the manuscript.

Funding

This study was supported by the National Natural Science Foundation of China (3180817), the State Education Ministry, Key projects of Sichuan Provincial Education Department (172A0319) and Key projects of Sichuan Provincial Science and Technology Department (2018NZ0126), and the Service Station Projects of New Rural Development Research Institute, Sichuan Agricultural University (2018, 2020).

Institutional Review Board Statement

Not applicable.

Informed Consent Statement

Not applicable.

Data Availability Statement

Data are contained within this article.

Acknowledgments

The authors thank Yuntian Ye for the technical assistance with principal component analysis.

Conflicts of Interest

The authors declare no conflict of interest.

References

  1. Afrin, S.; Gasparrini, M.; Forbes-Hernandez, T.Y.; Reboredo-Rodriguez, P.; Mezzetti, B.; Varela-López, A.; Giampieri, F.; Battino, M. Promising health benefits of the strawberry: A focus on clinical studies. J. Agric. Food Chem. 2016, 64, 4435–4449. [Google Scholar] [CrossRef] [PubMed]
  2. Giampieri, F.; Forbes-Hernandez, T.Y.; Gasparrini, M.; Alvarez-Suarez, J.M.; Afrin, S.; Bompadre, S.; Quiles, J.L.; Mezzetti, B.; Battino, M. Strawberry as a health promoter: An evidence based review. Food Funct. 2015, 6, 1386–1398. [Google Scholar] [CrossRef] [PubMed] [Green Version]
  3. Battino, M.; Giampieri, F.; Cianciosi, D.; Ansary, J.; Chen, X.; Zhang, D.; Gil, E.; Forbes-Hernández, T. The roles of strawberry and honey phytochemicals on human health: A possible clue on the molecular mechanisms involved in the prevention of oxidative stress and inflammation. Phytomedicine 2021, 86, 153170. [Google Scholar] [CrossRef]
  4. Krüger, E.; Josuttis, M.; Nestby, R.; Toldam-Andersen, T.; Carlen, C.; Mezzetti, B. Influence of growing conditions at different latitudes of europe on strawberry growth performance, yield and quality. J. Berry Res. 2012, 2, 143–157. [Google Scholar] [CrossRef] [Green Version]
  5. Huang, X.; Wang, H.; Luo, W.; Xue, S.; Hayat, F.; Gao, Z. Prediction of loquat soluble solids and titratable acid content using fruit mineral elements by artificial neural network and multiple linear regression. Sci. Hortic. 2021, 278, 109873. [Google Scholar] [CrossRef]
  6. Saridas, M.A.; Simsek, O.; Donmez, D.; Kacar, Y.A.; Kargi, S.P. Genetic diversity and fruit characteristics of new superior hybrid strawberry (Fragaria× ananassa Duchesne ex Rozier) genotypes. Genet. Resour. Crop. Evol. 2021, 68, 741–758. [Google Scholar] [CrossRef]
  7. Ito, H.; Ueno, H.; Kikuzaki, H. Free amino acid compositions for fruits. J. Nutr. Diet. Pract. 2017, 1, 001–005. [Google Scholar]
  8. Zhang, H.; Wang, Z.-Y.; Yang, X.; Zhao, H.-T.; Zhang, Y.-C.; Dong, A.-J.; Jing, J.; Wang, J. Determination of free amino acids and 18 elements in freeze-dried strawberry and blueberry fruit using an amino acid analyzer and ICP-MS with micro-wave digestion. Food Chem. 2014, 147, 189–194. [Google Scholar] [CrossRef]
  9. Dzhanfezova, T.; Barba-Espín, G.; Müller, R.; Joernsgaard, B.; Hegelund, J.N.; Madsen, B.; Larsen, D.H.; Vega, M.M.; Toldam-Andersen, T.B. Anthocyanin profile, antioxidant activity and total phenolic content of a strawberry (Fragaria× ananassa Duch) genetic resource collection. Food Biosci. 2020, 36, 100620. [Google Scholar] [CrossRef]
  10. Villamil-Galindo, E.; Van de Velde, F.; Piagentini, A.M. Extracts from strawberry by-products rich in phenolic compounds reduce the activity of apple polyphenol oxidase. LWT-Food Sci. Technol. 2020, 133, 110097. [Google Scholar] [CrossRef]
  11. Winardiantika, V.; Lee, Y.H.; Park, N.I.; Yeoung, Y.-R. Effects of cultivar and harvest time on the contents of antioxidant phytochemicals in strawberry fruits. Hortic. Environ. Biotechnol. 2015, 56, 732–739. [Google Scholar] [CrossRef]
  12. Samykanno, K.; Pang, E.; Marriott, P.J. Genotypic and environmental effects on flavor attributes of ‘Albion’ and ‘Juliette’ strawberry fruits. Sci. Hortic. 2013, 164, 633–642. [Google Scholar] [CrossRef]
  13. Šamec, D.; Maretić, M.; Lugarić, I.; Mešić, A.; Salopek-Sondi, B.; Duralija, B. Assessment of the differences in the physical, chemical and phytochemical properties of four strawberry cultivars using principal component analysis. Food Chem. 2016, 194, 828–834. [Google Scholar] [CrossRef] [PubMed]
  14. Kim, S.K.; Kim, D.S.; Kim, D.Y.; Chun, C. Variation of bioactive compounds content of 14 oriental strawberry cultivars. Food Chem. 2015, 184, 196–202. [Google Scholar] [CrossRef]
  15. Pelayo-Zaldívar, C.; Ebeler, S.E.; Kader, A.A. Cultivar and harvest date effects on flavor and other quality attributes of california strawberries. J. Food Qual. 2005, 28, 78–97. [Google Scholar] [CrossRef]
  16. Chandler, C.K.; Herrington, M.; Slade, A. Effect of harvest date on soluble solids and titratable acidity in fruit of strawberry grown in a winter, annual hill production system. Acta Hortic. 2003, 626, 345–346. [Google Scholar] [CrossRef]
  17. Dotto, M.C.; Martínez, G.A.; Civello, P.M. Expression of expansin genes in strawberry varieties with contrasting fruit firmness. Plant Physiol. Biochem. 2006, 44, 301–307. [Google Scholar] [CrossRef]
  18. Liu, C.; Zheng, H.; Sheng, K.; Liu, W.; Zheng, L. Effects of melatonin treatment on the postharvest quality of strawberry fruit. Postharvest Biol. Technol. 2018, 139, 47–55. [Google Scholar] [CrossRef]
  19. Zhang, J.; Kirkham, M. Antioxidant responses to drought in sunflower and sorghum seedlings. New Phytol. 1996, 132, 361–373. [Google Scholar] [CrossRef]
  20. Zhang, Y.; Hu, W.; Peng, X.; Sun, B.; Wang, X.; Tang, H. Characterization of anthocyanin and proanthocyanidin biosynthesis in two strawberry genotypes during fruit development in response to different light qualities. J. Photochem. Photobiol. B Biol. 2018, 186, 225–231. [Google Scholar] [CrossRef]
  21. Molan, A.L.; Flanagan, J.; Wei, W.; Moughan, P. Selenium-containing green tea has higher antioxidant and prebiotic activities than regular green tea. Food Chem. 2009, 114, 829–835. [Google Scholar] [CrossRef]
  22. Brand-Williams, W.; Cuvelier, M.-E.; Berset, C. Use of a free radical method to evaluate antioxidant activity. LWT-Food Sci. Technol. 1995, 28, 25–30. [Google Scholar] [CrossRef]
  23. Benzie, I.F.; Strain, J.J. The ferric reducing ability of plasma (FRAP) as a measure of “antioxidant power”: The FRAP assay. Anal. Biochem. 1996, 239, 70–76. [Google Scholar] [CrossRef] [PubMed] [Green Version]
  24. Li, M.; Dong, H.; Wu, D.; Chen, H.; Qin, W.; Liu, W.; Yang, W.; Zhang, Q. Nutritional evaluation of whole soybean curd made from different soybean materials based on amino acid profiles. Food Qual. Saf. 2020, 4, 41–50. [Google Scholar] [CrossRef]
  25. Padula, M.C.; Lepore, L.; Milella, L.; Ovesna, J.; Malafronte, N.; Martelli, G.; de Tommasi, N. Cultivar based selection and genetic analysis of strawberry fruits with high levels of health promoting compounds. Food Chem. 2013, 140, 639–646. [Google Scholar] [CrossRef]
  26. Szajdek, A.; Borowska, E. Bioactive compounds and health-promoting properties of berry fruits: A review. Plant Foods Hum. Nutr. 2008, 63, 147–156. [Google Scholar] [CrossRef]
  27. Fecka, I.; Nowicka, A.; Kucharska, A.Z.; Sokół-Łętowska, A. The effect of strawberry ripeness on the content of polyphenols, cinnamates, L-ascorbic and carboxylic acids. J. Food Compos. Anal. 2021, 95, 103669. [Google Scholar] [CrossRef]
  28. Jouquand, C.; Chandler, C.; Plotto, A.; Goodner, K. A sensory and chemical analysis of fresh strawberries over harvest dates and seasons reveals factors that affect eating quality. J. Am. Soc. Hortic. Sci. 2008, 133, 859–867. [Google Scholar] [CrossRef] [Green Version]
  29. Hadjipieri, M.; Christofi, M.; Goulas, V.; Manganaris, G.A. The impact of genotype and harvesting day on qualitative attributes, postharvest performance and bioactive content of loquat fruit. Sci. Hortic. 2020, 263, 108891. [Google Scholar] [CrossRef]
  30. Redpath, L.E.; Gumpertz, M.; Ballington, J.R.; Bassil, N.; Ashrafi, H. Genotype, environment, year, and harvest effects on fruit quality traits of five blueberry (Vaccinium corymbosum L.) cultivars. Agronomy 2021, 11, 1788. [Google Scholar] [CrossRef]
  31. Hirsch, M.; Langer, S.E.; Marina, M.; Rosli, H.G.; Civello, P.M.; Martínez, G.A.; Villarreal, N.M. Expression profiling of endo-xylanases during ripening of strawberry cultivars with contrasting softening rates. Influence of postharvest and hormonal treatments. J. Sci. Food Agric. 2021, 101, 3676–3684. [Google Scholar] [CrossRef] [PubMed]
  32. Villarreal, N.M.; Rosli, H.G.; Martínez, G.A.; Civello, P.M. Polygalacturonase activity and expression of related genes during ripening of strawberry cultivars with contrasting fruit firmness. Postharvest Biol. Technol. 2008, 47, 141–150. [Google Scholar] [CrossRef]
  33. Neocleous, D. Effects of cultivars and coco-substrates on soilless strawberry production in cyprus. J. Berry Res. 2012, 2, 207–213. [Google Scholar] [CrossRef] [Green Version]
  34. Shaw, D. Genotypic variation and genotypic correlations for sugars and organic acids of strawberries. J. Am. Soc. Hortic. Sci. 1988, 113, 770–774. [Google Scholar]
  35. Shaw, D.V. Response to selection and associated changes in genetic variance for soluble solids and titratable acids contents in strawberries. J. Am. Soc. Hortic. Sci. 1990, 115, 839–843. [Google Scholar] [CrossRef]
  36. Agulheiro-Santos, A.; Ricardo-Rodrigues, S.; Laranjo, M.; Melgão, C.; Velázquez, R. Non-destructive prediction of total soluble solids in strawberry using near infrared spectroscopy. J. Sci. Food Agric. 2022. [Google Scholar] [CrossRef]
  37. Josuttis, M.; Carlen, C.; Crespo, P.; Nestby, R.; Toldam-Andersen, T.; Dietrich, H.; Krüger, E. A comparison of bioactive compounds of strawberry fruit from europe affected by genotype and latitude. J. Berry Res. 2012, 2, 73–95. [Google Scholar] [CrossRef] [Green Version]
  38. Viljevac, V.M.; Krunoslav, D.; Ines, M.; Vesna, T.; Dominik, V.; Zvonimir, Z.; Boris, P.; Zorica, J. Season, location and cultivar influence on bioactive compounds of sour cherry fruits. Plant Soil Environ. 2017, 63, 389–395. [Google Scholar] [CrossRef] [Green Version]
  39. Cocco, C.; Magnani, S.; Maltoni, M.L.; Quacquarelli, I.; Cacchi, M.; Antunes, L.E.C.; D’Antuono, L.F.; Faedi, W.; Baruzzi, G. Effects of site and genotype on strawberry fruits quality traits and bioactive compounds. J. Berry Res. 2015, 5, 145–155. [Google Scholar] [CrossRef] [Green Version]
  40. Pradas, I.; Medina, J.J.; Ortiz, V.; Moreno-Rojas, J.M. ‘Fuentepina’and ‘amiga’, two new strawberry cultivars: Evaluation of genotype, ripening and seasonal effects on quality characteristics and health-promoting compounds. J. Berry Res. 2015, 5, 157–171. [Google Scholar] [CrossRef] [Green Version]
  41. Anttonen, M.J.; Hoppula, K.I.; Nestby, R.; Verheul, M.J.; Karjalainen, R.O. Influence of fertilization, mulch color, early forcing, fruit order, planting date, shading, growing environment, and genotype on the contents of selected phenolics in strawberry (Fragaria× ananassa Duch.) fruits. J. Agric. Food Chem. 2006, 54, 2614–2620. [Google Scholar] [CrossRef] [PubMed]
  42. Sorrequieta, A.; Ferraro, G.; Boggio, S.B.; Valle, E.M. Free amino acid production during tomato fruit ripening: A focus on l-glutamate. Amino Acids 2010, 38, 1523–1532. [Google Scholar] [CrossRef] [PubMed]
  43. Sung, J.; Suh, J.H.; Chambers, A.H.; Crane, J.; Wang, Y. Relationship between sensory attributes and chemical composition of different mango cultivars. J. Agric. Food Chem. 2019, 67, 5177–5188. [Google Scholar] [CrossRef] [PubMed]
  44. Heinemann, B.; Hildebrandt, T.M. The role of amino acid metabolism in signaling and metabolic adaptation to stress-induced energy deficiency in plants. J. Exp. Bot. 2021, 72, 4634–4645. [Google Scholar] [CrossRef]
  45. Keutgen, A.J.; Pawelzik, E. Contribution of amino acids to strawberry fruit quality and their relevance as stress indicators under nacl salinity. Food Chem. 2008, 111, 642–647. [Google Scholar] [CrossRef]
  46. Qamar, A.; Mysore, K.; Senthil-Kumar, M. Role of proline and pyrroline-5-carboxylate metabolism in plant defense against invading pathogens. Front. Plant Sci. 2015, 6, 503. [Google Scholar] [CrossRef] [Green Version]
  47. Batista-Silva, W.; Heinemann, B.; Rugen, N.; Nunes-Nesi, A.; Araújo, W.L.; Braun, H.P.; Hildebrandt, T.M. The role of amino acid metabolism during abiotic stress release. Plant Cell Environ. 2019, 42, 1630–1644. [Google Scholar] [CrossRef] [Green Version]
Figure 1. The ripe fruits of three cultivars.
Horticulturae 08 00348 g001
Figure 2. Firmness and appearance color in three cultivars of strawberry fruits at three harvest dates. Values represent the mean ± standard error. Different lowercase letters indicate statistically significant differences at p ≤ 0.05 as determined by Duncan’s test.
Horticulturae 08 00348 g002
Figure 3. Total soluble solids (TSS), titratable acidity (TA), TSS/TA ratio, ascorbic acid (AsA), total phenolics (TP), and anthocyanins (ANT) in three cultivars of strawberry fruits at three harvest dates. Values represent the mean ± standard error. Different lowercase letters indicate statistically significant differences at p ≤ 0.05 as determined by Duncan’s test.
Horticulturae 08 00348 g003
Figure 4. Antioxidant capacity in three cultivars of strawberry fruits at three harvest dates measured by DPPH and FRAP. Values represent the mean ± standard error. Different lowercase letters indicate statistically significant differences at p ≤ 0.05 as determined by Duncan’s test.
Horticulturae 08 00348 g004
Figure 5. Principal component analysis (PCA) showing interrelation of amino acids with the combination of cultivar and harvest date.
Horticulturae 08 00348 g005
Table 1. Source of variation (F-value) in quality traits of strawberry.
Quality TraitF-Value (Significance)
Harvest DateCultivarHarvest Date × Cultivar
F21.183 **40.416 **17.339 **
L*156.776 **125.703 **4.576 **
b*16.537 **89.085 **12.414 **
a*80.503 **32.401 **19.431 **
TSS110.55 **20.098 **5.062 **
TA692.841 **183.217 **170.539 **
TSS/TA692.841 **183.217 **170.539 **
AsA39.143 **44.581 **141.297 **
TP6.942 **5.719 *4.457 *
ANT19.979 **274.147 **12.206 **
DPPH6.635 **11.879 **1.212
FRAP2.6342.9470.396
TAA12.073 **12.328 **0.502
*, ** F-values are significant at the 95% and 99% confidence interval, respectively. F, firmness; TSS, total soluble solids; TA, titratable acidity; AsA, ascorbic acid; TP, total phenolics; ANT, anthocyanin; DPPH, 1,1-diphenyl-2-picryl-hydrazyl; FRAP, ferric reducing antioxidant power; TAA, total amino acids.
Table 2. Amino acid content in three cultivars of strawberry fruits at three harvest dates.
Harvest DateCultivarAspThrSerGluAlaGlyCysVal
Kaolino1.06 ± 0.09 a0.15 ± 0.00 b0.18 ± 0.02 b1.48 ± 0.21 a0.18 ± 0.01 a0.20 ± 0.02 abcd0.01 ± 0.00 a0.11 ± 0.01 b
JanuaryBenihoppe0.91 ± 0.04 ab0.11 ± 0.01 c0.12 ± 0.01 b1.19 ± 0.09 ab0.11 ± 0.00 cd0.20 ± 0.00 abc0.00 ± 0.00 c0.16 ± 0.01 a
Hongyu1.05 ± 0.10 a0.11 ± 0.00 c0.17 ± 0.02 b1.37 ± 0.09 ab0.11 ± 0.00 bc0.21 ± 0.00 a0.00 ± 0.00 c0.15 ± 0.02 a
Kaolino1.00 ± 0.02 ab0.10 ± 0.00 c0.12 ± 0.01 b1.33 ± 0.05 ab0.13 ± 0.01 b0.18 ± 0.00 cd0.00 ± 0.00 c0.11 ± 0.01 b
FebruaryBenihoppe0.86 ± 0.06 b0.15 ± 0.01 b0.13 ± 0.01 b1.06 ± 0.10 b0.07 ± 0.01 e0.18 ± 0.01 d0.01 ± 0.00 ab0.10 ± 0.01 b
Hongyu0.95 ± 0.03 ab0.10 ± 0.00 c0.13 ± 0.01 b1.14 ± 0.08 b0.10 ± 0.00 cd0.19 ± 0.00 abcd0.00 ± 0.00 c0.13 ± 0.00 ab
Kaolino0.85 ± 0.05 b0.30 ± 0.01 a0.26 ± 0.06 a1.18 ± 0.02 ab0.17 ± 0.01 a0.20 ± 0.00 ab0.00 ± 0.00 bc0.12 ± 0.01 ab
MarchBenihoppe0.84 ± 0.03 b0.11 ± 0.01 c0.14 ± 0.02 b0.74 ± 0.07 c0.19 ± 0.00 a0.18 ± 0.00 bcd0.01 ± 0.00 a0.11 ± 0.00 b
Hongyu0.88 ± 0.04 ab0.12 ± 0.00 c0.12 ± 0.00 b1.05 ± 0.07 b0.09 ± 0.00 de0.20 ± 0.01 ab0.00 ± 0.00 c0.13 ± 0.01 ab
Values represent the mean ± standard error. Different lowercase letters in the same column indicate statistically significant differences at p ≤ 0.05 as determined by Duncan’s test.
Table 3. Amino acid content in three cultivars of strawberry fruits at three harvest dates.
Harvest DateCultivarLeuTyrPheLysHisArgproTotal AA
Kaolino0.11 ± 0.00 b0.07 ± 0.00 a0.18 ± 0.01 a0.11 ± 0.00 e0.07 ± 0.00 a0.12 ± 0.00 a0.11 ± 0.00 a4.13 ± 0.35 a
JanuaryBenihoppe0.16 ± 0.01 a0.06 ± 0.01 ab0.17 ± 0.02 a0.13 ± 0.01 bc0.06 ± 0.00 a0.11 ± 0.01 abc0.08 ± 0.00 bc3.57 ± 0.18 bcd
Hongyu0.11 ± 0.01 b0.05 ± 0.00 bc0.15 ± 0.01 ab0.15 ± 0.00 a0.07 ± 0.00 a0.12 ± 0.00 ab0.10 ± 0.01 a3.92 ± 0.15 ab
Kaolino0.08 ± 0.00 cd0.06 ± 0.00 ab0.17 ± 0.02 a0.12 ± 0.00 cd0.05 ± 0.00 b0.08 ± 0.00 de0.08 ± 0.00 bc3.59 ± 0.07 bc
FebruaryBenihoppe0.06 ± 0.00 d0.04 ± 0.00 c0.17 ± 0.01 a0.11 ± 0.00 e0.05 ± 0.00 b0.06 ± 0.00 e0.00 ± 0.00 d3.06 ± 0.13 de
Hongyu0.08 ± 0.00 cd0.04 ± 0.00 c0.12 ± 0.00 b0.07 ± 0.00 f0.05 ± 0.00 b0.09 ± 0.01 cd0.07 ± 0.00 c3.26 ± 0.11 cde
Kaolino0.09 ± 0.00 bc0.07 ± 0.01 a0.18 ± 0.01 a0.14 ± 0.00 b0.06 ± 0.00 a0.10 ± 0.01 bcd0.08 ± 0.00 b3.81 ± 0.04 ab
MarchBenihoppe0.07 ± 0.01 cd0.07 ± 0.00 a0.18 ± 0.00 a0.11 ± 0.00 de0.03 ± 0.00 c0.09 ± 0.01 cd0.07 ± 0.00 c2.94 ± 0.13 e
Hongyu0.08 ± 0.00 cd0.05 ± 0.00 bc0.15 ± 0.00 ab0.12 ± 0.00 de0.06 ± 0.00 a0.08 ± 0.00 de0.07 ± 0.00 c3.21 ± 0.08 cde
Values represent the mean ± standard error. Different lowercase letters in the same column indicate statistically significant differences at p ≤ 0.05 as determined by Duncan’s test.
Publisher’s Note: MDPI stays neutral with regard to jurisdictional claims in published maps and institutional affiliations.

