Next Article in Journal
Impact of Pseudomonas sp. SVB-B33 on Stress- and Cell Wall-Related Genes in Roots and Leaves of Hemp under Salinity
Previous Article in Journal
Integrative Seed and Leaf Treatment with Ascorbic Acid Extends the Planting Period by Improving Tolerance to Late Sowing Influences in Parsley
 
 
horticulturae-logo
Article Menu

Article Menu

Article

Performance of Cowpea under Different Water Regimes in Amazonian Conditions

by
Denis de Pinho Sousa
1,
Hildo Giuseppe Garcia Caldas Nunes
1,
Denilson Pontes Ferreira
1,
Vandeilson Belfort Moura
1,
William Lee Carrera de Aviz
1,
Helane Cristina Aguiar Santos
1,
João Vitor de Novoa Pinto
1,
Igor Cristian de Oliveira Vieira
1,
Gabriel Siqueira Tavares Fernandes
1,
Ewelyn Regina Rocha Silva
1,
Lucas Tavares Belém
1,
Jaime Borges da Cunha Junior
1,
Marcus José Alves de Lima
1,
Adriano Marlisom Leão de Sousa
1,
Vivian Dielly da Silva Farias
2,
Joyse Tatiane Souza Santos
2 and
Paulo Jorge de Oliveira Ponte de Souza
1,*
1
Grupo de Pesquisa Interações Solo Planta Atmosfera da Amazônia, Programa de Pós Graduação em Agronomia, Universidade Federal Rural da Amazônia, Avenida Presidente Tancredo Neves 2501, Belém 66077-830, PA, Brazil
2
Grupo de Pesquisa Interações Solo Planta Atmosfera da Amazônia, Agronomy Department, Universidade Federal do Pará, Av. Cel. José Porfírio 2515, Altamira 68372-040, PA, Brazil
*
Author to whom correspondence should be addressed.
Horticulturae 2022, 8(4), 335; https://doi.org/10.3390/horticulturae8040335
Submission received: 15 February 2022 / Revised: 26 March 2022 / Accepted: 29 March 2022 / Published: 15 April 2022
(This article belongs to the Section Plant Nutrition)

Abstract

:
Water availability is a crucial factor in the final productivity of cowpea. The objective of this work was to evaluate the production and productivity components of cowpea under different irrigation depths in Amazonian conditions. The experiment was carried out at the School Farm of the Federal Rural University of Amazonia, in the municipality of Castanhal-PA, using the cultivar BR3 Tracuateua, from September to November 2014, 2015, and 2016. The experimental design was conducted on six blocks and four treatments, where the four irrigation depths of 0, 25, 50, and 100% of crop evapotranspiration were tested. The productivity analysis was performed when 90% of the plants were in the phenological stage R9. The evaluated production components were pod length, number of pods per plant, number of grains per pod, mass of one hundred grains, and harvest index. There was a statistical difference among all treatments for the components of production and among productivities. An average reduction of 827 kg ha−1 in cowpea productivity was observed during the three years of study, when the treatment without irrigation was compared with the treatment irrigated with 100% of the crop’s water demand. It was found in this research that the simple fulfillment of the nutritional and phytosanitary demands of the crop, associated with an adequate planning of when to plant in the region, would already help in the improvement of local production when choosing times where the water deficit in the reproductive phase is less than 33 mm.

1. Introduction

Cowpea has great economic, nutritional, and environmental importance, and is known as the main crop that serves as a source of essential nutrients for the human diet and as a means of providing forage for livestock. Nowadays, cowpea is grown all over the world in more than 100 countries. Cowpea production in 2020 is estimated to be around 9.8 million, while in 2030, the projected production is expected to increase to 12.3 million tons [1]. Thus, cowpea is indeed a multifaceted crop, providing income for millions of small farmers as well as traders selling the nutritious grain.
Cowpea (Vigna unguiculata L.) is a prominent feature in the north and northeast regions of Brazil. When presenting its production with common bean (Phaseolus vulgaris L.), it still does not have a significant production in the country, due to the low technological investment in its cultivation [2].
In addition, the production and annual productivity of cowpea is highly affected by climatic variations, mainly rainfall [3], which protects cowpea cultivation in the restricted state of Pará from high rainfall in the Amazon region to the first half of the year, when there is a greater concentration of rainfall, not requiring water supply for irrigation [4].
Although cowpea is a drought-tolerant species when compared to other crops, its productivity can be harmed by irregular rainfalls [5]. The reduction in the availability of water for the plants is mainly caused by the phenomenon of climate change, which is the main obstacle to agricultural crops currently [6].
Natural climatic variability was one of the decisive factors for the state of grain pro-duction to decline since 2003, reducing the area occupied by cowpea in 33 thousand hectares [7], with an average yield of only 821 kg ha−1 [8]. In this scenario, several studies have been developed, especially the effects of water availability on the growth and productivity phases of the bean in the north of the country, especially in the state of Pará [4,9].
Thereby, irrigation can be an alternative to reduce the impacts generated by the re-duction of rainfall during the growth and development of crops [10], always aiming to guarantee adequate agricultural yield. Thus, the use of irrigation must be planned to ensure the lowest water supply in order to obtain higher production parameters and productivity [11].
Therefore, studies that demonstrate the impacts caused by different water regimes on cowpea are essential to assist in agricultural planning, contributing to the most appropriate management, allowing the production of greater productivity in the region and greater economic gains for the producer.
Considering the lack of technical and scientific information on the production of cowpea in the state and aiming to contribute to the crop development in the region, the study was planned to evaluate the hypothesis that over the period of lower rainfall in the Amazon region, its cultivation can reach production parameters and yields above the national average when total and deficient water supplementation is carried out through irrigation. From then on, this work aimed to evaluate the growth, production components, and productivity of cowpea submitted to different lack of water resulting from different irrigation depths during the reproductive phase of the crop in the climatic conditions of the northeast of Pará.
The newness of the study comes in generating technical information on the growth parameters, production, and productivity of cowpea when total and partial water supplementation is carried out through irrigation in a period when the species is not cultivated due to low rainfall in the region.

2. Methods

2.1. Area Description

The experiment was carried out in the northeast region of the state of Pará, in the municipality of Castanhal, in the year 2014 in an area of 1.5 ha and in the years 2015 and 2016 in an area of 0.5 ha, located in the Experimental Farm of the Federal Rural University of Amazonia-UFRA (1°19′24.48′′ S latitude, 47°57′38.20′′ W longitude and altitude of 41 m).
The soil of the experimental field was classified as a dystrophic yellow latosol with a sandy loam texture with 8% and 4% of clay in the areas of 1.5 and 0.5 ha, respectively. The local climate is characterized as Am, tropical climate, presenting moderate dry season with average annual rainfall of 2000 to 2500 mm, with annual average temperature of 26 °C, maximum and minimum of 28 and 22 °C, respectively, and relative humidity values ranging between 95 and 79% with an average of 86%. The driest period of the year occurs between June and November, while from December to May the period of greatest rainfall occurs [3].
Two soil samples were taken, one undisturbed for the physical characterization and the other deformed for chemical analysis, at depth of 0 to 20 cm. The samples were analyzed by the Soil Laboratory of Embrapa Amazônia Oriental, whose results are shown in Table 1.

2.2. Crop Management

Seeding was carried out on 9, 17, and 23 September in 2014, 2015, and 2016, respectively, with the help of a seeder, using BR3-Tracuateua bean cultivar. The spacing used was 0.5 m between planting lines and 0.1 m between plants, with a total density of 200,000 plants per hectare.
The fertilization was carried out according to the results of soil chemical analysis, using 195 kg ha−1 of NPK chemical fertilizer of the formulation 6-18-15 in 2014, 300 kg ha−1 in 2015 in the formulation 10-20-20 (NPK), and 210 kg ha−1 in formulation 9-18-15 (NPK), following the Embrapa Amazonia Oriental fertilization recommendations.

2.3. Measurements of Meteorological Variables and Crop Evapotranspiration

At the center of the experimental area an automatic weather station with a CR10X Datalogger (Campbell Scientifc Instrument, Logan, UT, USA) was installed, with reading programmed every ten seconds, and total averages every ten minutes to collect global solar radiation, temperature and humidity data, relative air content, volumetric soil water content, and rainfall. The available water (AD) in the soil was calculated according to Souza et al. [12]. To quantify the deficiencies imposed by the treatments submitted to the water deficit, the sequential water balance was performed according to Carvalho et al. [13] considering the available water capacity (CAD) of the experimental area and the effective depth of the radicular system visually observed in the field [14].
The experimental design was based on randomized block design with six blocks and four treatments, which consisted of different levels of water availability during the reproductive phase of the cowpea, and the T100 treatment consisted of 100% water replenishment (ETc), the T50 treatment in 50% ETc replacement, the T25 treatment in 25% ETc replacement, and the T0 treatment did not restore ETc by means of irrigation in the reproductive phase, exposed only to the rain in 2014, as in the years of 2015 and 2016 mounted polypropylene panels were installed that prevented the entrance of water in the treatment T0 during the reproductive phase during the rain events.
The water applied daily was distributed through a drip irrigation system, based on the reference evapotranspiration (ET0) calculated by means of the Penman–Monteith equation [15] with the obtained data of the meteorological station of the National Institute of Meteorology installed 3 km from the experiment. Afterwards, ET0 was multiplied by the cultivation coefficient of each stage of the cowpea available in the literature [16] in order to obtain crop evapotranspiration.

2.4. Growth, Production Parameters, and Productivity

During the vegetative phase, the treatments received the same water slide, corresponding to T100. The treatments started on the 36th day after sowing (DAS) in the three years of experiment, when the crop reached the reproductive phase (R5) and extended to 57th DAS in 2014, 58th DAS in 2015, and 61th DAS in 2016, when the beginning of the grain maturation stage (R9) was reached. The phenological development of cowpea was evaluated daily, selecting 1 m long lines containing 10 plants, using the scale proposed by Fernández et al. [17].
Data for the analysis of crop growth were collected from the 9th DAS in 2014 and the 15th DAS in 2015 and 2016, on a weekly scale, from two 20 m lines in each treatment, from which five plants were removed in medium lines, following the randomized block design, with six replicates each. Each sample had its separate organs in stem, petiole, leaf, peduncle, flower, pod, and grain (when present). Subsequently, the samples were dried in an oven, and incubated at 70 °C for 72 h to obtain the constant weight, to measure the total aerial dry matter (TADM). The leaf area index (LAI) was determined by the disc method described by Benincasa [18] using the dry matter of leaves.
The final productivity analysis was collected at 63rd DAS in 2014, 65th DAS in 2015, and at 73rd DAS in 2016, when 90% of the plants were in the R9 phenological stage. The productivity was obtained in two central lines of planting, separated previously in each treatment, from which three samples of 1 m2 represented by lines of two meters of length were collected. After the grains were collected in the demarcated areas, they were placed to dry for 72 h, and later they were weighed and the productivity estimate was made in each treatment.
The evaluated production components were the pod length (PL): mean length, in cm, of all pods of the area of each treatment in all blocks; number of pods per plant (NPP): mean number of direct pod count of all plants of the useful area divided by total plants; number of grains per pod (NGP): corresponds to the average number of grains in all pods harvested in the useful area; mass of one hundred grains (M100): referring to the mass, expressed in grams, of 100 dry grains chosen at random in the working area; and harvest index (HI): it was determined by dividing grain yield by TADM production.

2.5. Statistics Analysis

We evaluated the influence of the different water regimes on the growth data (LAI and TADM), production components (PL, NPP, NGP, M100, and HI), and dry grain yield, (ANOVA test F), and the comparison of means by the Tukey test at 5% probability (p < 0.05), using the statistical program Assistat.

3. Results and Discussion

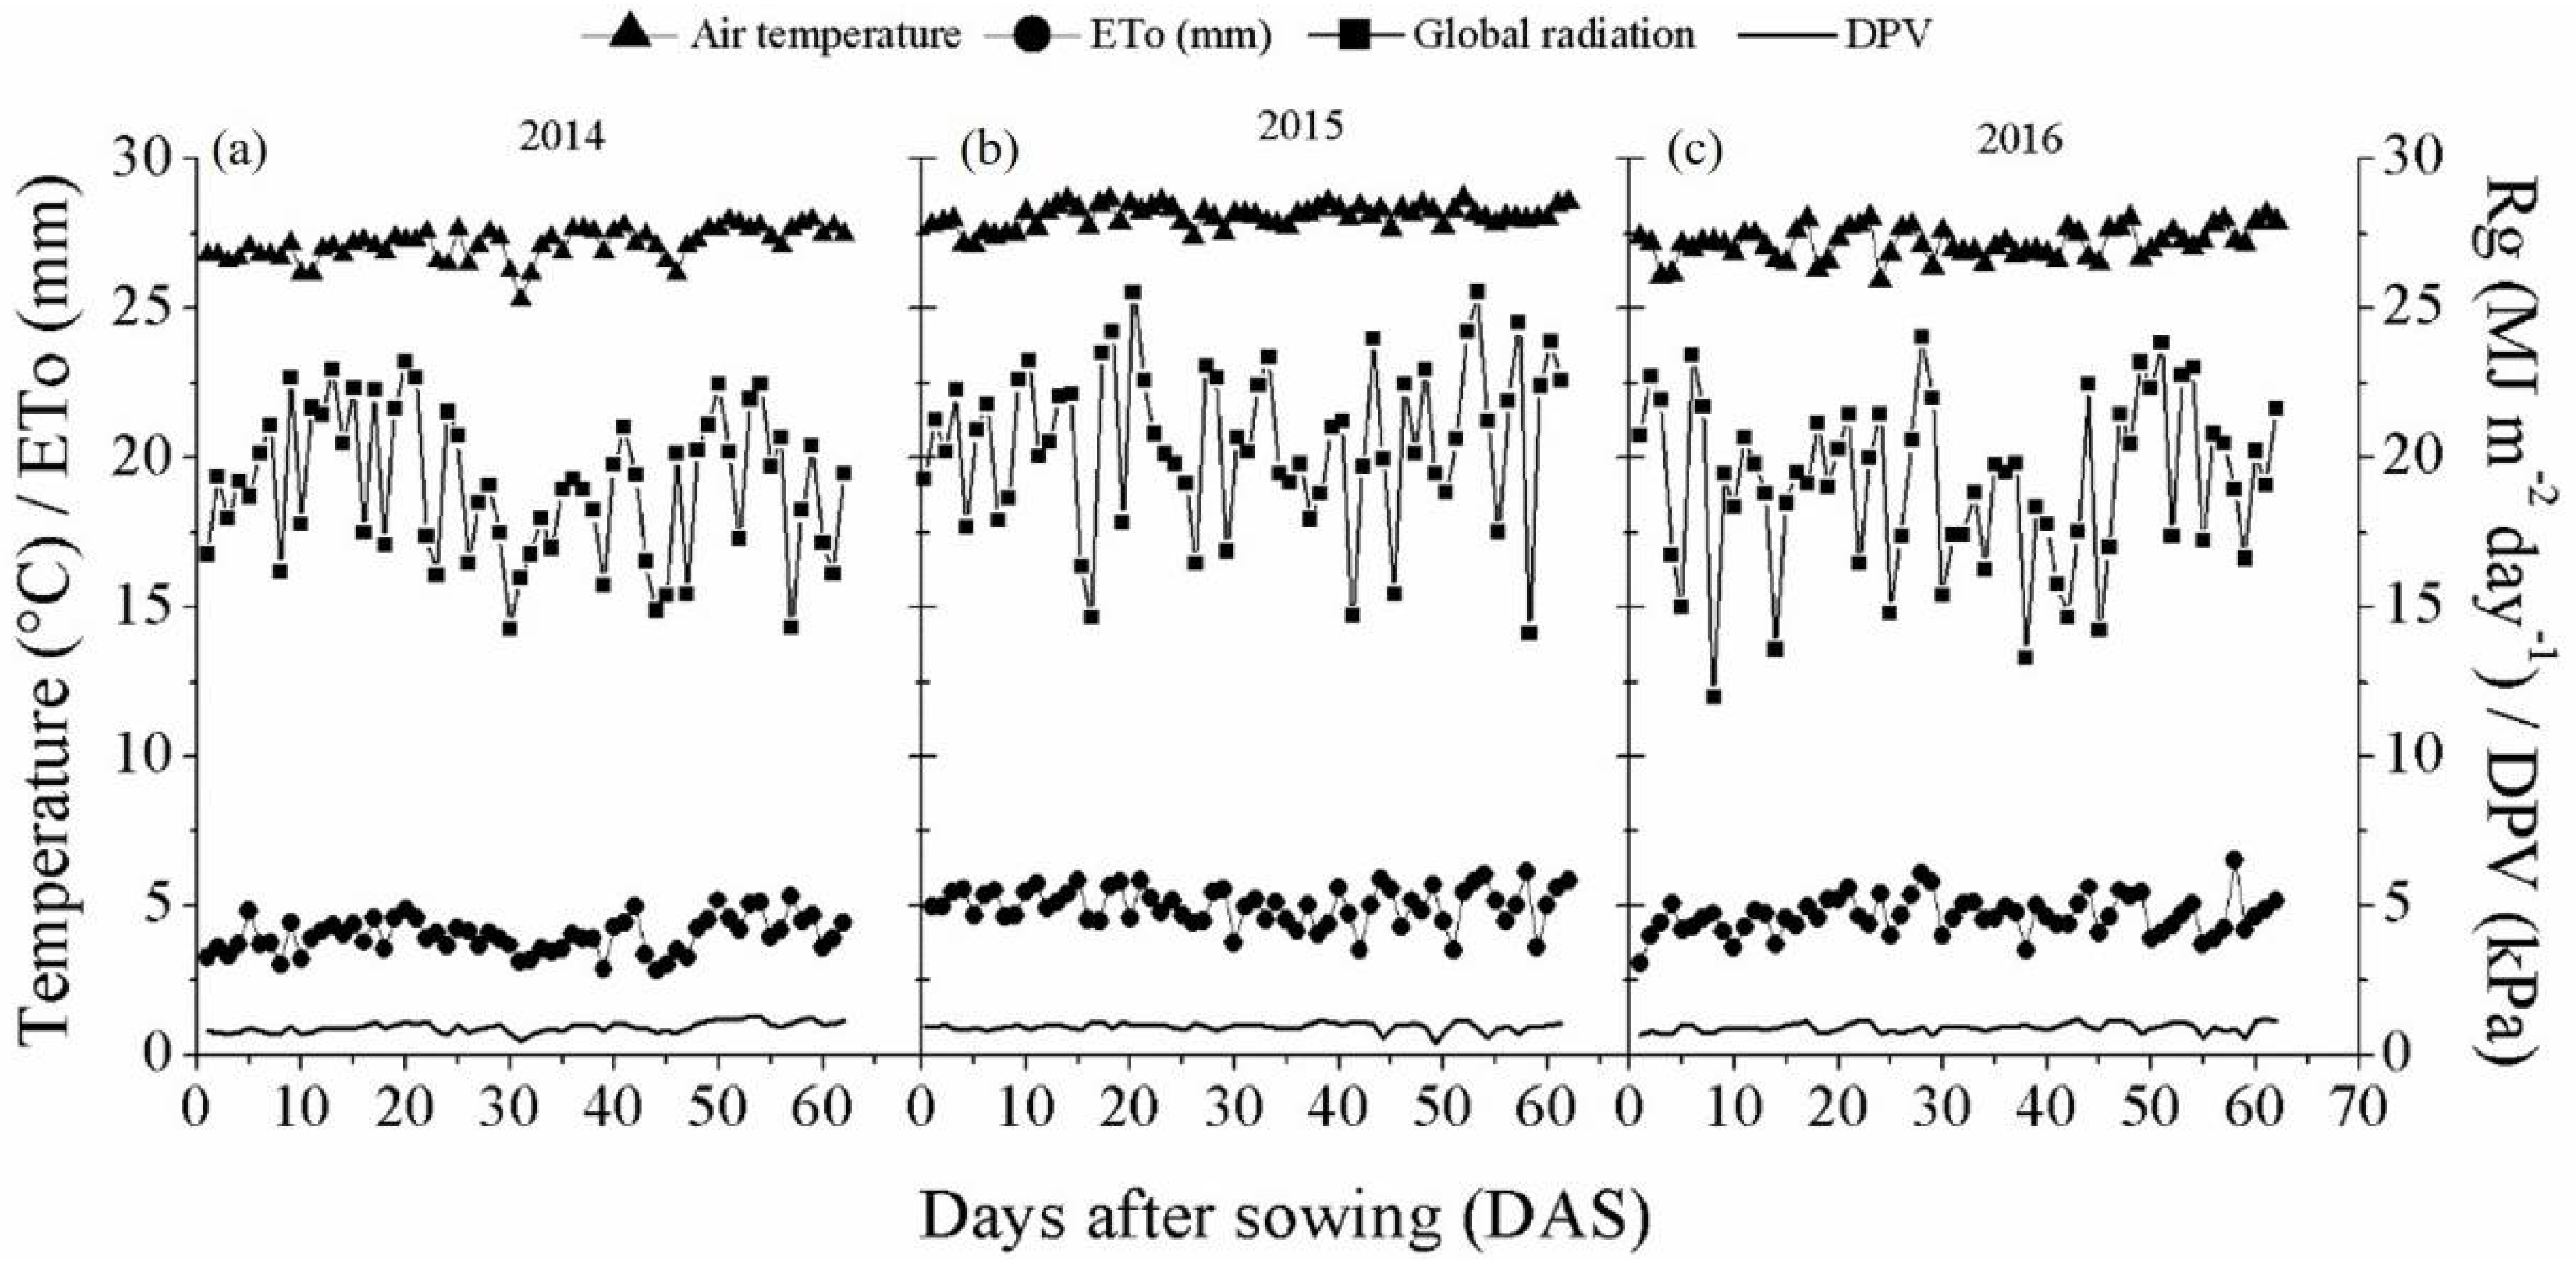
3.1. Environmental Conditions

Mean air temperatures during the 2014 experiments (Figure 1a) and 2016 (Figure 1c) ranged from 22.14 to 34.64 °C, averaging 27.14 °C in 2014 and 27.26 °C in 2016. As early as 2015 (Figure 1b), temperatures ranged from 22.59 to 34.85 °C. The average increase of 0.9 °C in the temperature of 2015 compared to 2014 and 2016 was due to the fact that this year recorded the climatic phenomenon of El Niño, in which, in the Amazon region, this phenomenon causes reduction of rainfall, which contributed to the increase in temperature in the year 2015 [19].
The ET0 presented mean values of 4.01, 5.03, and 4.67 mm·dia−1 in 2014, 2015, and 2016, respectively. The Rg during the 2014, 2015, and 2016 experiments were 19.22, 20.61, and 19.50 MJ·m−2·dia−1. The DPV in 2014 and 2016 had an average of 0.93 kPa, already in 2015 the average was 0.96 kPa. In 2015, the reduction of rainfall events during the whole experiment culminated in the reduction of cloudiness, favoring higher values of ET0, Rg, and DPV, when compared to the years 2014 and 2016.

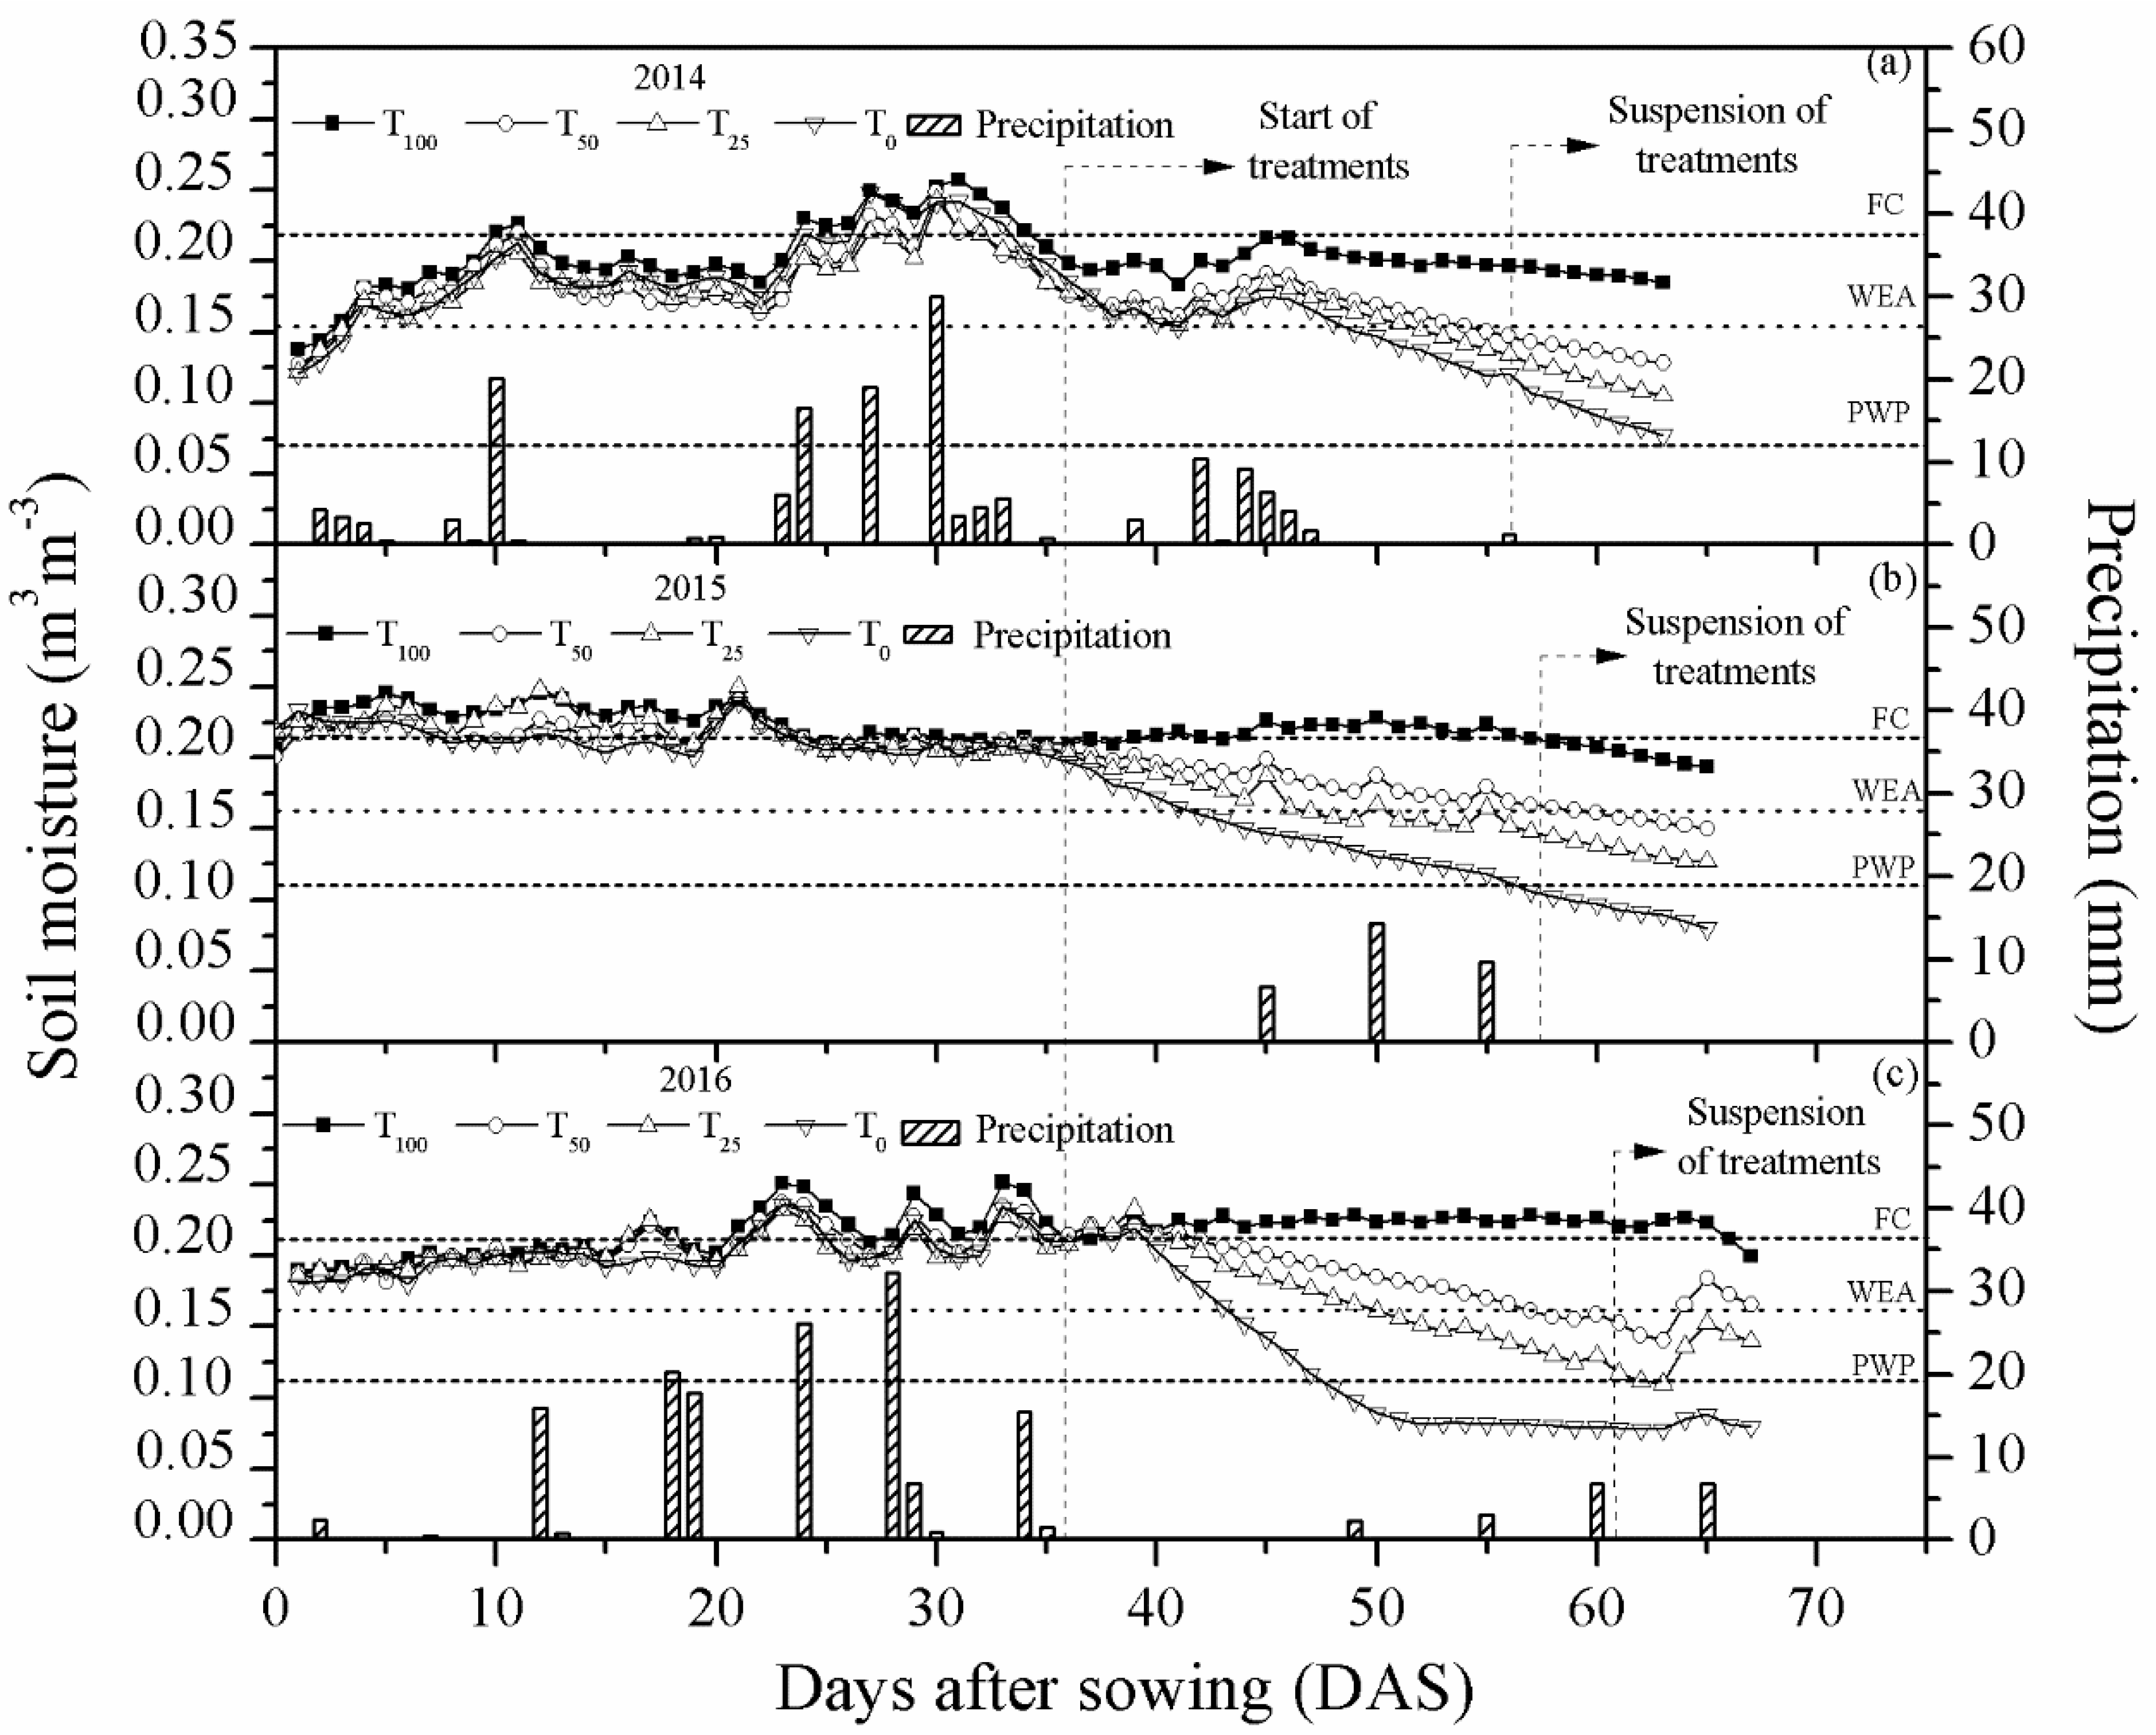
3.2. Variability of Soil Water Volumetric Content

The total rainfall observed during the 2014 experiments (Figure 2a) (158 mm) and 2016 (Figure 2c) (153 mm) were similar and quite different when compared to that observed in 2015 (30 mm) (Figure 2b), when there was an 81% reduction in precipitation (Figure 2). During the vegetative phase, total precipitation was 122 mm in 2014, 0 mm in 2015, and 141 mm in 2016, while in the reproductive phase the occurrence was 36 mm (2014), 30 mm (2015), and 12 mm (2016).
The occurrence of less water availability in the soil was verified in treatments T0, T25, and T50 between the 38th and 41st DAS of 2014, which were softened by the rains that occurred between the 42nd and 47th DAS. In 2015 and 2016, with the reduction of rainfall events, it was observed that as soon as the treatments were differentiated (36th DAS), there was a progressive increase in water deficit in the deficit treatments, except for the 46th, 50th, and 54th DAS (2015) and 43rd, 49th, and 56th DAS (2016) when rainfall reduced the deficiency in T25 and T50, since the T0 treatment was protected with mobile coverings, in order to simulate the crop in the reproductive phase without water replacement.
The attainment of the R9 stage (physiological maturation) in the soil water content (AD) in each treatment was 22, 0, and 0% in T0; of 36, 25, and 12% in T25; and 47, 49, and 45% in T50; in 2014, 2015, and 2016, respectively. Nascimento et al. [20] verified that at 60% of AD, the plant significantly decreases its productivity, showing a greater variation in the components of cowpea production due to the greater water deficiencies imposed by the irrigation treatments.
In 2014, due to rainfall up to the 47th DAS, and because there was no effective control of soil water intake, the total water deficit for T50 treatment was only 8 mm, 21 mm for T25, and 33 mm for the T0. In 2015 and 2016, due to the reduction of rainfall and the installation of mobile coverings in the T0 treatment, a greater control of soil water entry was obtained, which resulted in a greater change in soil moisture in all treatments, generating water deficiencies of accumulated values of 30 and 33 mm for the T50, 58 and 59 mm for the T25, and 113 and 94 mm for the T0, respectively.

3.3. Growth and Development of Cowpea

Maximum leaf area index values were observed during the reproductive phase at 63rd, 57th, and 64th DAS in 2014 (Figure 3a), 2015 (Figure 3b), and 2016 (Figure 3c), respectively, for all treatments. The results obtained corroborate Bastos et al. [21], who obtained maximum LAI values varying between 3.0 and 4.3 for cowpea, indicating their full development and representing the maximum interception of the radiation, when there are no limiting factors.
Low LAI development was observed for T0 treatment in all years because the culture was submitted to water limitation. It was verified that the increase in the maximum value of the LAI in the T0 treatment of 2014 (Figure 3a) was due to rainfall occurring between 38th and 45th DAS. These results confirm the negative effect that water limitation has on LAI once it causes a reduction in gas exchange [22], due to the influence of low soil moisture on the closure of the stomatal opening, which reduces the absorption of nutrients in the photosynthetic process and the production of photoassimilates as a consequence [23]. The mean reduction in LAI of the T0 treatment was 16% in 2014 and 18% in 2015 and 2016, when compared to the T100 treatment. A similar result was found by Nascimento et al. [24], who obtained a reduction of 20% in the average LAI studying cowpea genotypes under water deficit.
The TADM produced by the cowpea showed increasing response due to the greater availability of water in the soil, with a peak of production for all treatments at the end of the crop cycle, presenting a significant difference (p < 0.05) among all treatments in the years of 2014, 2015, and 2016, with the T100 treatment having the highest TADM value, producing 575.64 g·m−2 in 2014 (Figure 3d), 571.70 g·m−2 in 2015 (Figure 3e), and 576.32 g·m−2 in 2016 (Figure 3f). The treatments T50 and T25 underwent, respectively, a reduction in TADM of 10.00 and 15.80% (2014), 20.87 and 30.02% (2015), and 8.84 and 17.81% (2016).
The T0 treatment had the production of TADM penalized in 23.96% in 2014, 42.25% in 2015, and 31.04% in 2016 when compared to the treatment that received the adequate water supply.
The results found in this research corroborate Dharminder et al. [11] in such a way that the highest growth rates are attributed to treatments that present the highest levels of soil moisture, as water in the soil acts as a solvent, which increases the availability of essential nutrients in the soil solution, making them more available to plants [25].

3.4. Production and Productivity Components

The results of the analysis of variance for the production components: pod length (PL), number of pod per plant (NPP), number of grains per pod (NGP), one hundred grain mass (M100), harvest index (HI), and productivity are presented in Table 2.
The factors water blade, year, and treatments significantly (p < 0.05) affected all production components (PL, NPP, NGP, M100, and HI) and productivity (Table 2), so that the highest mean values occurred when applied the 100% replacement of ETc. The interactions between irrigation lamellae versus year, pod length, and number of pods per plant were statistically significant (p < 0.05), as well as 100 grain mass and yield (p < 0.01). The number of grains per pod and the harvest index did not present statistical influence (p > 0.05) for the leaf versus year interaction (Table 2).
In 2014, the T100 and T50 treatments did not present a statistically significant difference for the PL (p > 0.05), while the treatments T25 and T0 were statistically different between themselves and the other treatments (p < 0.05), with (T25) and 10.45% (T0), in relation to T100 (Table 3). In 2015 and 2016, all treatments were significantly influenced (p < 0.05) by the different water regimes with reductions of 4.21%, 7.57%, and 13.29% for T50, T25, and T0, respectively, in 2015 when compared to the treatment that did not suffer water deficiency. In 2016, PL reductions were 3.73% (T50), 7.32% (T25), and 12.61% (T0).
The water deficiency regime in the soil reduced the absolute values of the PL of the treatments T50, T25, and T0, when compared to the treatment of full replacement of ETc. Costa Junior et al. [26], working with the agronomic performance of cowpea cultivar BRS Tumucumaque under different water regimes, concluded that PL tends to increase with the increase in soil water availability. This trend is due to the fact that higher soil moisture contents influence greater nutrient absorption [11], which leads to increased transpiration and photosynthesis [22], which influence the tissue development and, consequently, greater PL growth.
It is also worth noting that, even with half of the water demand for cowpea, the PL did not differ from the condition where the crop was completely replenished due to the precipitation between 38th and 42nd days after sowing, which raised the soil moisture above that considered critical for the crop.
The mean number of pods per plant (NPP) presented a significant difference (p < 0.05) among all treatments in the three years of experiment (Table 3), with the highest absolute values obtained in the T100 treatments with a mean of 6.58 in 2014, 5.84 in 2015, and 6.57 in 2016. When contrasting the T100 treatments with the others, there was a reduction of 7.60% (T50), 13.22% (T25), and 23.10% (T0) in 2014; 22.43% (T50), 42.29% (T25), and 57.36% (T0) in 2015; and 23.44% (T50), 43.08% (T25), and 49.77% (T0) in 2016.
The number of pods per plant is the most sensitive agronomic component to bean water status [27], as the water stress caused by low soil moisture during the flowering period and pod formation reduces photosynthetic activity, which directly impacts its growth and development [22], causing abortion and flower drop and, therefore, reducing the number of pods per plant [26].
The average number of grains per pod (NGP) obtained in treatments that did not undergo water deficit was 10.34 in 2014, 9.47 in 2015, and 10.46 in 2016 (Table 3). As with PL and NPP, NGP also showed a statistically significant reduction (p < 0.05) as the amount of water was reduced through different irrigation treatments. T50 and T25 treatments reduced NGP by 8.41 and 17.80% (2014), 22.70 and 32.21% (2015), and 24.86 and 32.98% (2016), respectively. The T0 treatment obtained the lowest absolute values (Table 2) and the highest percentage reductions, with 25.82%, 47.73%, and 40.06% for the years 2014, 2015, and 2016, respectively. The results found in this study for the variable NGP, in the treatment that did not suffer from water deficit, corroborate the results found by Santos et al. [28], who obtained an average value of 10.65 grains per pod of cowpea cultivar Cariri in Paraíba.
The low soil moisture in treatments T50, T25, and T0 in the pod-filling stage resulted in a significant reduction in NGP, since it was influenced by the production of empty pods at the tips (filling occurs from the base to the tips) due to the deregulation in the source–drain relationship caused by the lower absorption of the soluble fraction of nutrients present in the soil solution [6] and by damage to the photosynthetic apparatus that reduces the production of photoassimilates [22].
The mean values of the 100 grain mass (M100) obtained in the three years of experiments (Table 3) showed a decrease with the increase of the water deficit, presenting a significant difference (p < 0.05) among all treatments analyzed in all years, with maximum absolute values obtained in the T100 treatments of 28.09 g in 2014, 27.71 g in 2015, and 28.51 g in 2016.
The T0 treatment in the three experimental years presented the greatest percentage reductions in the M100 when contrasted with the T100 treatment, with negative impacts of 13.21%, 32.44%, and 26.24% in the years of 2014, 2015, and 2016, respectively. For treatments T50 and T25, the percentage losses in this order were 7.23 and 10.25% (2014), 12.16 and 19.49% (2015), and 13.12 and 20.24% (2016).
The results obtained in this study for the mass of 100 grains contrast the results found by Locatelli et al. [29] that found no difference when evaluating this component. This is probably due to the fact that the mulch was used to cover the treatments, which reduced the loss of water through evaporation and increased the available soil moisture for the plant and, consequently, led to greater absorption of water and nutrients [10].
Regarding the grain yield of cowpea in the three years of experiment, it was found that the decrease in soil moisture significantly influences (p < 0.05), in a negative way, the productivity of all the treatments, because the greater the water deficiencies were, the smaller the values in kg ha−1 of the grain were (Table 3).
When comparing the average of the treatments with higher productivity (T100) and that of the lowest (T0), a reduction of 49.19% was observed in 2014, 63.95% in 2015, and 57.15% in 2016. For the T50 treatments and T25, the percentage reduction of 20.84 and 35.73% in 2014 was observed, respectively, 34.11 and 51.44% in 2015, and 18.92 and 33.08% in 2016. By adequately supplying the water requirement of cowpea, it is possible to maintain the flow of water and nutrients from the soil to the plant [10] and the physiological processes [22], promoting its growth and development properly and increasing productivity [6,30].
Similar results were found by Nunes et al. [5], who observed an average reduction of 38.03% in the productivity of a non-irrigated treatment when compared to another that received adequate water supplementation to maintain soil moisture close to field capacity. Souza et al. [17] found reductions of 72% and 41% when subjecting the same cultivar to water deficiencies of 76 and 26 mm in relation to treatments with irrigations during the whole cycle.
The harvest index (HI) of cowpea for the four treatments in the years 2014, 2015, and 2016 demonstrated sensitivity to the water deficit, presenting a statistically significant difference (p < 0.05) between the treatments. The treatments T100 and T0 presented the highest and lowest absolute values of HI (Table 3), respectively. The treatments T50, T25, and T0 presented a reduction of 13.79, 24.14, and 34.48% in 2014; 26.92, 38.46, and 46.15% in 2015; and 14.28, 25.00, and 39.28% in 2016.
The harvest index is one of the most important components of production, since it can identify if a cultivar has the ability to adapt most of its dry matter production to the components of economic interest when subjected to adverse environmental conditions; however, because it is strongly correlated with genotype–environment interaction, it should not be extrapolated to other regions, in order not to overestimate or underestimate such parameters [31].
Among the three experimental years, it was verified that in 2015 the growth parameters (LAI and TADM), production components (PL, NPP, NGP, M100, and HI), and productivity had lower absolute values than in 2014 and 2016, due to the fact that rainfall was 81% lower during the whole experiment, caused by the El Niño effect, which caused the wet area of the soil in the experiment to be only in the planting lines (drip irrigation), different to the other years that had a more uniform wetting throughout the area in several days (irrigation + rain).
When comparing the productivity results obtained with the average productivity in the state (821 kg ha−1), it is verified that the simple fulfillment of the nutritional and phytosanitary demands of the crop, associated with an adequate planning of when to plant in the region, would already help in the improvement of local production when choosing times where the water deficit in the reproductive phase was less than 33 mm.

4. Conclusions

All the production components showed a high sensitivity to the variation of water content in the soil, reducing its absolute values as the water reserves of the soil depleted, and water deficiencies in the reproductive phase of more than 30 mm are responsible for the low productivity found in the region. The use of irrigation with only 50% of the crop water demand during the reproductive phase would already allow significant increases in the regional productivity of this crop, although future studies on economic efficiency are required.

Author Contributions

Cowpea experiment: D.d.P.S., P.J.d.O.P.d.S., D.P.F., H.G.G.C.N., L.T.B., J.B.d.C.J., J.V.d.N.P., V.D.d.S.F., M.J.A.d.L., J.T.S.S., E.R.R.S., I.C.d.O.V. and V.B.M.; data organization: D.d.P.S., V.D.d.S.F., D.P.F., L.T.B., J.B.d.C.J., G.S.T.F., E.R.R.S., I.C.d.O.V. and V.B.M.; data quality control: D.d.P.S., J.V.d.N.P., H.G.G.C.N., V.D.d.S.F., J.T.S.S., G.S.T.F., W.L.C.d.A., H.C.A.S. and M.J.A.d.L.; data analysis: D.d.P.S., D.P.F., W.L.C.d.A., H.C.A.S., A.M.L.d.S. and V.D.d.S.F.; writing—original draft preparation: D.d.P.S., D.P.F., V.D.d.S.F. and P.J.d.O.P.d.S.; writing—review and editing: D.d.P.S., V.D.d.S.F., A.M.L.d.S. and P.J.d.O.P.d.S.; supervision: P.J.d.O.P.d.S.; project administration, P.J.d.O.P.d.S. and A.M.L.d.S.; funding acquisition, P.J.d.O.P.d.S. and A.M.L.d.S. All authors have read and agreed to the published version of the manuscript.

Funding

This research was funded by the National Council for Scientific and Technological Development (CNPq) through the Universal project (process n° 483402/2012-5).

Institutional Review Board Statement

Not applicable.

Informed Consent Statement

Not applicable.

Acknowledgments

The Federal Rural University of Amazon are acknowledged for the structural support during the experiment, as well as the graduate program in agronomy (PGAGRO) for the support offered to students.

Conflicts of Interest

The authors declare no conflict of interest. The funders had no role in the design of the study; in the collection, analyses, or interpretation of data; in the writing of the manuscript, or in the decision to publish the results.

References

  1. Omomowo, O.I.; Babalola, O.O. Constraints and Prospects of Improving Cowpea Productivity to Ensure Food, Nutritional Security and Environmental Sustainability. Front. Plant Sci. 2021, 12, 751731. [Google Scholar] [CrossRef] [PubMed]
  2. Martey, E.; Etwire, P.M.; Mockshell, J. Climate-smart cowpea adoption and welfare effects of comprehensive agricultural training programs. Technol. Soc. 2021, 64, 101468. [Google Scholar] [CrossRef] [PubMed]
  3. Farias, V.D.S.; Lima, M.J.A.; Nunes, H.G.G.C.; Sousa, D.P.; Souza, P.J.O.P. Water demand, crop coefficient and uncoupling factor of cowpea in the eastern Amazon. Rev. Caatinga 2017, 30, 190–200. [Google Scholar] [CrossRef] [Green Version]
  4. Nunes, H.G.G.C.; Farias, V.D.S.; Sousa, D.P.; Costa, D.P.; Pinto, J.V.N.; Moura, V.B.; Teixeira, E.; Lima, M.J.A.; Ortega-Farias, S.; Souza, P.J.O.P. Parameterization of the AquaCrop model for cowpea and assessing the impact of sowing dates normally used on yield. Agric. Water Manag. 2021, 252, 106880. [Google Scholar] [CrossRef]
  5. Nunes, H.G.G.C.; Sousa, D.P.; Moura, V.B.; Ferreira, D.P.; Pinto, J.V.N.; Vieira, I.C.O.; Farias, V.D.S.; Oliveira, E.C.; Souza, P.J.O.P. Performance of the AquaCrop model in the climate risk analysis and yield prediction of cowpea (Vigna unguiculatta L. Walp). Aust. J. Crop Sci. 2019, 13, 1105–1112. [Google Scholar] [CrossRef]
  6. Singh, S.P.; Mahapatra, B.; Pramanick, B.; Yadav, V.R. Effect of irrigation levels, planting methods and mulching on nutrient uptake, yield, quality, water and fertilizer productivity of field mustard (Brassica rapa L.) under sandy loam soil. Agric. Water Manag. 2021, 244, 106539. [Google Scholar] [CrossRef]
  7. Fundação Amazônia de Amparo a Estudos e Pesquisas. Boletim Agropecuário do Estado do Pará 2015; No. 1; Fundação Amazônia de Amparo a Estudos e Pesquisas: Belém, Brazil, 2015; 38p. [Google Scholar]
  8. Moreira, W.K.O.; Oliveira, S.S.; Alves, J.D.N.; Ribeiro, R.A.R.; Oliveira, I.A.; Sousa, L.A.S. Evolução da produtividade do feijão-caupi para os principais produtores do nordeste paraense no período de 2000 à 2014. Nucleus 2017, 14, 341–351. [Google Scholar] [CrossRef] [Green Version]
  9. Kanda, E.K.; Senzanje, A.; Mabhaudhi, T. Calibration and validation of the AquaCrop model for full and deficit irrigated cowpea (Vigna unguiculata (L.) Walp). Phys. Chem. Earth Parts A/B/C 2021, 124, 102941. [Google Scholar] [CrossRef]
  10. Das, P.; Pramanick, B.; Goswami, S.B.; Maitra, S.; Ibrahim, S.M.; Laing, A.M.; Hossain, A. Innovative Land Arrangement in Combination with Irrigation Methods Improves the Crop and Water Productivity of Rice (Oryza sativa L.) Grown with Okra (Abelmoschus esculentus L.) under Raised and Sunken Bed Systems. Agronomy 2021, 11, 2087. [Google Scholar] [CrossRef]
  11. Dharminder; Singh, R.K.; Kumar, V.; Pramanick, B.; Alsanie, W.F.; Gaber, A.; Hossain, A. The Use of Municipal Solid Waste Compost in Combination with Proper Irrigation Scheduling Influences the Productivity, Microbial Activity and Water Use Efficiency of Direct Seeded Rice. Agriculture 2021, 11, 941. [Google Scholar] [CrossRef]
  12. De Souza, J.L.M.; Fezer, K.F.; Gurski, B.C.; Jerszurki, D.; Pachechenik, P.E.; Evangelista, A.W.P. Atributos Físicos E Balanço Hídrico do Solo com Floresta Ombrófila Mista, em Latossolo Vermelho-Amarelo, em TelêMaco Borba—PR. Ciência Florest. 2018, 28, 90–101. [Google Scholar] [CrossRef] [Green Version]
  13. Carvalho, H.P.; Dourado Neto, D.; Teodoro, R.E.F.; Melo, B. Balanço hídrico climatológico, armazenamento efetivo da água no solo e transpiração na cultura de café. Biosci. J. 2011, 27, 221–229. [Google Scholar]
  14. Souza, P.J.O.P.; Farias, V.D.S.; Lima, M.J.A.; Ramos, T.F.; Sousa, A.M.L. cowpea leaf area, biomass production and productivity under different water regimes in Castanhal, Pará, Brazil. Rev. Caatinga 2017, 30, 748–759. [Google Scholar] [CrossRef] [Green Version]
  15. Allen, R.G.; Pereira, L.S.; Howell, T.A.; Jensen, M.E. Evapotranspiration information reporting: I. Factors governing measurement accuracy. Agric. Water Manag. 2010, 98, 899–920. [Google Scholar] [CrossRef] [Green Version]
  16. Bastos, E.A.; Ferreira, V.M.; Da Silva, C.R.; Andrade Júnior, A.S.D. Evapotranspiração e coeficiente de cultivo do feijão-caupi no vale do Gurguéia, Piauí. Irriga 2008, 13, 182–190. [Google Scholar] [CrossRef]
  17. Fernández, F.C.; Gepts, P.; López, M. Etapas de Desarrollo de la Planta de Fríjol Común (Phaseolus vulgaris L.); Centro Internacional de Agricultura Tropical (CIAT): Cali, Colombia, 1986; 33p. [Google Scholar]
  18. Benincasa, M.M.P. Análise de Crescimento de Plantas: Noções Básicas; FUNEP: Jaboticabal, Brazil, 2003; 41p. [Google Scholar]
  19. Grimm, A.M.; Aceituno, P. El niño, novamente! Rev. Bras. Meteorol. 2015, 30, 351–357. [Google Scholar] [CrossRef] [Green Version]
  20. Nascimento, J.T.; Pedrosa, M.B.; Sobrinho, J.T. Efeito da variação de níveis de água disponível no solo sobre o crescimento e produção de feijão caupi, vagens e grãos verdes. Hortic. Bras. 2004, 22, 174–177. [Google Scholar] [CrossRef] [Green Version]
  21. Bastos, E.A.; Nascimento, S.P.D.; Silva, E.M.; Freire Filho, F.R.; Gomide, R.L. Identification of cowpea genotypes for drought tolerance. Rev. Ciência Agronômica 2011, 42, 100–107. [Google Scholar] [CrossRef] [Green Version]
  22. Ferreira, D.P.; Sousa, D.P.; Nunes, H.G.G.C.; Pinto, J.V.N.; Farias, V.D.S.; Costa, D.L.P.; Moura, V.B.; Teixeira, E.; Sousa, A.; Pinheiro, H.A.; et al. Cowpea Ecophysiological Responses to Accumulated Water Deficiency during the Reproductive Phase in Northeastern Pará, Brazil. Horticulturae 2021, 7, 116. [Google Scholar] [CrossRef]
  23. Slattery, R.A.; Ort, D.R. Perspectives on improving light distribution and light use efficiency in crop canopies. Plant Physiol. 2021, 185, 34–48. [Google Scholar] [CrossRef]
  24. Nascimento, S.P.D.; Bastos, E.A.; Araujo, E.C.E.; Filho, F.R.F.; Da Silva, E.M. Tolerância ao déficit hídrico em genόtipos de feijão-caupi. Rev. Bras. Eng. Agrícola Ambient. 2011, 15, 853–860. [Google Scholar] [CrossRef]
  25. Jacoby, R.; Peukert, M.; Succurro, A.; Koprivova, A.; Kopriva, S. The Role of Soil Microorganisms in Plant Mineral Nutrition—Current Knowledge and Future Directions. Front. Plant Sci. 2017, 8, 1617. [Google Scholar] [CrossRef] [PubMed] [Green Version]
  26. Costa Junior, M.D.J.N.D.; Bastos, E.A.; Cardoso, M.J.; Andrade Júnior, A.S.D. Agronomic performance of the cowpea under different irrigation depths and row spacing. Rev. Ciência Agronômica 2017, 48, 774–782. [Google Scholar] [CrossRef]
  27. Guimarães, C.M.; Stone, L.F.; Del Peloso, M.J.; De Oliveira, J.P. Genótipos de feijoeiro comum sob deficiência hídrica. Rev. Bras. Eng. Agrícola Ambient. 2011, 15, 649–656. [Google Scholar] [CrossRef] [Green Version]
  28. Santos, J.F.; Grangeiro, J.I.T.; Brito, C.H.; Santos, M.C.C.A. Produção e componentes produtivos de variedades de feijão-caupi na microregião Cariri paraibano. Rev. Eng. Ambient. 2009, 6, 214–222. [Google Scholar] [CrossRef] [Green Version]
  29. Locatelli, V.E.R.; De Medeiros, R.D.; Smiderle, O.J.; Albuquerque, J.A.A.; Araujo, W.F.; De Souza, K.T.S. Componentes de produção, produtividade e eficiência da irrigação do feijão-caupi no cerrado de Roraima. Rev. Bras. Eng. Agrícola Ambient. 2014, 18, 574–580. [Google Scholar] [CrossRef]
  30. Bastos, E.A.; Ramos, H.M.M.; Andrade Júnior, A.S.; Nascimento, F.N.; Cardoso, M.J. Parâmetros fisiológicos e produtividade de grãos verdes do feijão-caupi sob déficit hídrico. Water Resour. Irrig. Manag. 2012, 1, 31–37. [Google Scholar]
  31. Fancelli, A.L. Fisiologia, Nutrição e Adubação de Milho para Alto Rendimento; Anais; Departamento de Produção Vegetal ESALQ/USP: Piracicaba, Brazil, 2000; 9p. [Google Scholar]
Figure 1. Daily mean values of air temperature, reference evapotranspiration, vapor pressure deficit, and global solar radiation during in 2014 (a), 2015 (b), and 2016 (c) with cowpea in Castanhal-PA.
Horticulturae 08 00335 g001
Figure 2. Variation of soil moisture and total daily precipitation in the experimental area during the years 2014 (a), 2015 (b), and 2016 (c) in Castanhal-PA. FC: Field capacity; WEA: Water easily available; PWP: Permanent wilting point; Horticulturae 08 00335 i001 Precipitation; ■ T100: Replacement of 100% of evapotranspiration of culture (ETc); ○ T50: Replacement of 50% ETc; Δ T25: Replacement of 25% ETc; ▽T0: Does not have irrigation during the reproductive phase.
Horticulturae 08 00335 g002
Figure 3. Evolution of leaf area index (LAI) and total aerial dry matter (TADM) as a function of days after sowing in 2014 (a,d), 2015 (b,e), and 2016 (c,f) in Castanhal-PA. V4: Third trifoliate leaf (last vegetative stage); R5: Pre-flowering; R9: Maturation; ● T100: Replacement of 100% of evapotranspiration of culture (ETc); □ T50: Replacement of 50% ETc; Δ T25: Replacement of 25% ETc; ▽T0: Does not have irrigation during the reproductive phase.
Horticulturae 08 00335 g003
Table 1. Chemical and physical properties of the soil at the experimental site.
YearpH (H2O)NpK+Na+Ca2+Ca2+ + Mg2+Al3+
--(%)(mg∙dm−3)(mg∙dm−3)(cmolc∙dm−3)
20145.40.061811.02.01.01.50.3
20154.90.05226.09.00.50.80.8
20163.70.002030.02.01.01.20.6
YearSandSiltClayBulk DensityFC 1PWP 2
-(g∙kg−1)(g∙cm−3)(m3∙m−3)
2014804116801.410.220.07
2015835125401.560.200.11
2016835125401.560.200.11
1 Field capacity, 2 permanent wilting point.
Table 2. Analysis of variance of pod length (PL), number of pods per plant (NPP), number of grains per pod (NGP), mass of 100 grains (M100), harvest index (HI), and cowpea productivity, under different irrigation depths in Castanhal-PA.
FVGLMean Square
PLNPPNGPM100HIProductivity
Irrigation depth (a)313.58 **36.37 **51.60 **77.63 **0.03261 **2,290,374.57 **
Treatment113.95 **10.56 **15.28 **26.52 **0.01391 **806,345.87 **
Interaction a × b 60.24 **0.01 **0.035 ns1.60 *0.00064 ns21,310.41 *
Residual550.060.190.440.650.00041691,532,228
Blocks 50.22 ns0.16 ns0.060 ns0.49 ns0.00047 ns12,589.73 ns
Year (b)20.65 **3.46 **6.52 **24.63 **0.02569 **935,409.17 **
CV--9.425.476.877.989.2611.34
*, **, and ns—significant at 5% and 1%, and not significant, respectively, by F-test.
Table 3. Total accumulated deficiency in the reproductive phase and average of the components of production: pod length (PL), number of pods per plant (NPP), number of grains per pod (NGP), mass of 100 grains (M100), harvest index (HI), and cowpea productivity, under different irrigation depths in Castanhal-PA.
YearTreatmentsWater Deficiency (mm)Production Components and Productivity
PLNPPNGPM100HIProductivity
2014T100015.89 ± 4.52 a6.58 ± 1.36 a10.34 ± 2.54 a28.09 ± 7.23 a0.29 ± 0.06 a1559 ± 248 a
T50815.49 ± 4.67 a6.08 ± 1.10 b9.7 ± 2.15 b26.06 ± 6.88 b0.25 ± 0.04 b1234 ± 196 b
T252114.87 ± 3.98 b5.71 ± 0.93 c8.50 ± 1.87 c25.21 ± 6.47 c0.22 ± 0.04 c1002 ± 142 c
T03314.23 ± 3.34 c5.06 ± 0.87 d7.67 ± 1.43 d24.38 ± 5.76 d0.19 ± 0.03 d792 ± 113 d
2015T100015.20 ± 4.13 a5.84 ± 1.23 a9.47 ± 2.17 a27.71 ± 6.91 a0.26 ± 0.04 a1299 ± 185 a
T503014.56 ± 3.85 b4.53 ± 1.01 b7.32 ± 1.74 b24.34 ± 6.13 b0.19 ± 0.04 b856 ± 137 b
T255814.05 ± 3.24 c3.37 ± 0.86 c6.42 ± 1.52 c22.31 ± 4.72 c0.16 ± 0.03 c630 ± 102 c
T011313.18 ± 2.78 d2.49 ± 0.76 d4.95 ± 1.25 d18.72 ± 3.96 d0.14 ± 0.03 d468 ± 79 d
2016T100015.84 ± 4.64 a6.57 ± 1.28 a10.46 ± 2.36 a28.51 ± 6.89 a0.28 ± 0.05 a1597 ± 235 a
T503315.25 ± 4.21 b5.03 ± 1.03 b7.86 ± 2.54 b24.77 ± 6.21 b0.24 ± 0.05 b1295 ± 191 b
T255914.68 ± 3.42 c3.74 ± 1.04 c7.01 ± 1.68 c22.74 ± 5.25 c0.21 ± 0.03 c1068 ± 133 c
T09413.86 ± 3.65 d3.30 ± 0.85 d6.27 ± 1.31 d21.03 ± 4.48 d0.17 ± 0.03 d684 ± 108 d
Mean values followed by the same letters in the same column do not differ among themselves (p < 0.05) by a Tukey’s test.
Publisher’s Note: MDPI stays neutral with regard to jurisdictional claims in published maps and institutional affiliations.

