Article

A Win–Win Situation: Performance and Adaptability of Petite Sweetpotato Production in a Temperate Region

1
Department of Plant Science, The Pennsylvania State University, University Park, PA 16802, USA
2
Horticultural Science, North Carolina State University, Raleigh, NC 27695, USA
*
Author to whom correspondence should be addressed.
Horticulturae 2022, 8(2), 172; https://doi.org/10.3390/horticulturae8020172
Submission received: 7 January 2022 / Revised: 3 February 2022 / Accepted: 8 February 2022 / Published: 19 February 2022

Abstract

:
New-found interest in sweetpotato production in the Mid-Atlantic and Northeastern U.S. has been steadily increasing in the last several years. Sweetpotatoes are usually grown for fresh market use and novel marketing strategies and new consumer niches are providing farmers options of growing new sweetpotato varieties with exciting colors and flavor profiles that are adapted to the Mid-Atlantic and Northeastern U.S. Petite sweetpotatoes have gained market attention because they are easier to handle and faster to cook compared to U.S. No. 1 storage roots. The goal of this research was to determine the performance and adaptableness of eight commercial sweetpotato varieties and two unreleased accessions for U.S. No.1 and Petite sweetpotato production under black plastic mulch tailored for the mild temperate growing conditions of the Mid-Atlantic and Northeastern U.S. Two in-row spacings (15 cm and 30 cm) and two harvest dates (90 and 120 days after planting, DAP) were evaluated during the 2018 and 2019 growing seasons. Our results showed that the ideal harvest time is at least 120 DAP compared to an early harvest at 90 DAP as there was a 2-fold difference in marketable yield at both 15 and 30 cm in-row spacing with marketable yield between 20 and 54 t ha−1. ‘Averre’ and ‘Beauregard’ produced the highest U.S. No. 1 and Petite yields under both in-row spacing treatments harvested at 120 DAP for both years evaluated, though the general effect of in-row spacing and DAP interaction (separate years) on yield performance was cultivar specific. We also found that growing degree days is a better predictor for harvest than days after planting, with an accumulation of at least ~700 GDD (base temperature 15.5 °C) or ~1300 GDD (base temperature 10 °C) for both U.S. No. 1 and Petite roots. Additional studies are required to identify the stability of cultivars tested and treatments imposed with environmental interactions in this region. In addition, there is an urgency for updated sweetpotato management practices exclusively designed for sweetpotato varieties for the Mid-Atlantic and Northeastern U.S.

1. Introduction

Sweetpotato (Ipomoea batatas [L.] Lam.), like many other vegetable commodities, are marketed in several ways depending on industry and consumer demand. Sweetpotatoes are usually produced for fresh consumption but now are progressively used for alternate markets, such as processed foods (e.g., French fries and chips) and commercial products (e.g., starch, flour, and food dyes) and suchlike. In the U.S., diverse varieties of sweetpotatoes, for instance, purple- and cream-fleshed as well as orange-fleshed are increasing in obtainability and quality. Traditionally, commercial production of sweetpotato has concentrated in North Carolina, Mississippi, Louisiana, and California, fulfilling over 88% of total area planted for 2017 [1].
In contrast, the Mid-Atlantic and Northeastern United States, defined here as the combination of states conforming the subregions of New England and the Mid-Atlantic (in all, Connecticut, Maine, Massachusetts, New Hampshire, Rhode Island, Vermont, New York, Delaware, Maryland, New Jersey, Pennsylvania, Virginia, West Virginia, and Washington, D.C.) accounts for ~786 acres (1.12% of the total U.S. hectares) harvested for fresh consumption in 2017 [1]. Numerous Mid-Atlantic and Northeastern growers’ plant and harvest sweetpotatoes as part of a diverse farm shifting between 0.4 and 141 hectares [1]. Although the Mid-Atlantic and Northeast sweetpotato hectares have increased ~19% in the last 10 years [1], the bulk of sweetpotatoes used in the Mid-Atlantic and Northeastern U.S. are transported and disseminated from southern U.S. states, such as North Carolina and Louisiana [2]. Lately, with increased consumer preference for more nutritious foods, updated marketing strategies and novel breeding methods, sweetpotato has gradually improved its importance in the U.S. and the crop is now ranked as one of the most nutritious vegetables [3]. Novel marketing strategies and new consumer niches can help increase the adoption of newer sweetpotato varieties with exciting colors and flavor profiles adapted to the Mid-Atlantic and Northeastern U.S. by farmers.
U.S.-grown sweetpotatoes are advertised following the “United States Standards for Grades of Sweetpotato” [4]. Consumers, retailers, wholesalers, and exporters alike demand consistency and quality along grade classes. Grade standards are outlined mainly along size guidelines, but quality traits are also critical. The premium grade of sweetpotatoes in the U.S. is termed a U.S. No. 1, which is defined as a storage root between 7.6 and 22.8 cm in length, weighing no more than 5.6 g, and with a diameter ranging from 4.4 cm to 8.9 cm [5]. Likewise, a U.S. No. 1 storage root should be firm, smooth, well-shaped, and free from damage attributed to biotic stresses. Other grade classes include U.S. No. 1 Petite (henceforth, Petite), U.S. Extra No. 1, U.S. Commercial, and U.S. No. 2, that differ in size and quality requirements compared to a U.S. No. 1. Other processor grade storage roots that use alternative terminology include “Jumbo” and “Canner”. “Jumbo” sweetpotatoes, as their name implies, are of larger size compared to U.S. No. 1 that can be sold in fresh market venues, as well as to processors. “Canner” or processor grade storage roots are smaller and slender sized compared to Petite and are sold to the fruit and vegetable canning, pickling, and drying industry (i.e., canneries) to produce added-value foodstuffs.
Petite sweetpotatoes are of smaller diameter (3.8–5.7 cm) and length (7.6–17.8 cm), with no defined weight requirement when compared to U.S. No. 1’s; however, they are subject to the same quality standards (Figure 1). Over the past several years, the Petite sweetpotato has gained market attention throughout the U.S. mainly because Petite storage roots (i.e., fingerling sweetpotato; baby sweetpotato) are easier to handle and faster to cook when compared to U.S. No. 1 roots [6]. Typically, Petite sweetpotatoes are packed in special microwavable or steamable bags (4 to 6 storage roots per bag) or in small mesh bags (6 to 10 storage roots per bag) and sold at premium prices at supermarkets, specialty grocery stores and farmers markets, among others.
Hence, Petite sweetpotato production could be especially important to Mid-Atlantic and Northeastern U.S. states. Currently, the greatest challenges for sweetpotato production in these regions are: (1) a shorter growing period, (2) milder climate, (3) irregular and variable rainfall events, (4) non-adapted varieties, (5) inadequate farm infrastructure, (6) post-harvest handling, and (7) market opportunities, among others [2]. However, sweetpotato and vegetable farmers alike could take advantage of the disadvantages stated above. The adoption of superior sweetpotato varieties, earlier harvest periods, tighter planting densities, and field preparation that could hasten and increase Petite sweetpotato growth might result in production proficiencies which, in turn, can expand grower’s profitability as a unique opportunity for Petite sweetpotato. The conceivable significance of Petite sweetpotato production coupled with a sound marketing strategy could benefit both seasoned and beginner commercial vegetable growers in the Mid-Atlantic and Northeastern U.S. involved in specialty crops. Specifically, Petite sweetpotato can represent a growth in grower revenue, innovative commercial collaborations, and fruitful direct-to-consumer scenarios.
The goal of this research was to establish the behavior and adaptableness of ten sweetpotato varieties for U.S. No.1 and Petite sweetpotato production aimed for conditions of the Mid-Atlantic and Northeastern U.S. under black plastic mulch in a temperate environment. The outcomes of this research over 2 years in Rock Springs, PA, are explained.

2. Materials and Methods

2.1. Field Preparation

The field experiments were conducted at the Russell E. Larson Agricultural Research Center of The Pennsylvania State University located in Rock Springs, PA over 2 years (2018 and 2019). The field soil was dominated by a Murilll channery silt loam soil with slopes from 0 to 3%. Monthly temperature and precipitation data were obtained from the Network for Environmental and Weather Applications (NEWA), Rock Springs, PA, weather station [7].
Slips (G2 planting stock; rooted cuttings) of eight commercial varieties—‘Averre’ (orange/copper skin; orange-fleshed), ‘Beauregard’ (orange/copper skin; orange-fleshed), ‘Bonita’ (tan skin; white-fleshed), ‘Carolina Ruby’ (red skin; orange-fleshed), ‘Covington’ (orange/copper skin; orange-fleshed), ‘Japanese’ (purple skin; white-fleshed), ‘Murasaki’ (purple skin; white-fleshed), and ‘Orleans’ (light rose skin; orange-fleshed), and two unreleased accessions—‘NC413’ (purple skin; purple-fleshed) and ‘NCP13-0030’ (purple skin; purple-fleshed) were kindly provided by North Carolina State University, Raleigh, NC. For the 2018 field trial, ‘Japanese’ and ‘NCP13-0030’ were not assessed. For the 2019 field trial, ‘Murasaki’ and ‘NC413’ were not assessed.
Field preparation and experiment design was performed following Duque [2]. In short, land was tilled and 91.4 cm wide by 20.3 cm high raised beds were formed using a raised bed–mulch–drip tape layer implement (model 2400 Mini Layer: Rain-Flo Irrigation, East Earl, PA, USA). A single line of 6 mm thick drip irrigation tape with 20.3 cm emitter spacing (T-Tape; T Systems International, San Diego, CA, USA) was laid on top of each row. Each bed was covered with 1-mil-thick black embossed plastic mulch (part no. BLK324, Rain-Flo Irrigation). Distance between bed centers was 152.4 cm.
Two in-row spacings (15 cm and 30 cm) and two harvest dates (90 and 120 days after planting, DAP) were used for the field experiments. Slips were spaced either at 15 cm (20 plants block−1; plant density = 43,056 plants ha−1) or 30 cm (10 plants block−1; plant density = 21,528 plants ha−1) apart in a single row and hand-planted into the plastic mulch on 28 May 2018 (year 1) and 31 May 2019 (year 2). Border rows were planted to each side of every replicate. All trials used a randomized complete block design with four replicates of either 10 or 20 plants per experimental plot, with a 152.4 cm break between plots (please refer to Supplementary File S1 for experimental design layout).
Soil testing was completed 15 d before field preparation for both years and were performed by the Agricultural Analytical Services Laboratory of The Pennsylvania State University. Soil test reports showed phosphorus (P) levels at 239.6 kg ha−1 and potassium (K) levels at 222.4 kg ha−1 as determined by the Mehlich 3 soil test. Before laying down the black plastic mulch, 39.2 kg ha−1 of calcium nitrate (15.5 N–0 P–0 K) and 61.6 kg ha−1 of magnesium sulfate (0 N–0 P–0 K–9 Mg) were incorporated preplant based on soil test report recommendations. After 30 d, an additional 39.2 kg ha−1 calcium nitrate was fertigated in one single event. Fertilization continued the same for both years. All trials were watered as needed by means of the “feel and appearance” method [8] during the growing season. Weeding was completed regularly in June and July of each year.

2.2. Harvesting

For 2018, sweetpotatoes were harvested on 2 September and 3 October 2018, which corresponded to 97 d and 128 d after transplanting, respectively. For 2019, sweetpotatoes were harvested on 3 September and 1 October 2019, corresponding to 93 d and 124 d after transplanting, respectively. Vines were removed using a string trimmer (model ST 100; Cub Cadet, Cleveland, OH, USA), and plastic mulch was removed manually.

2.3. Manual Sorting, Curing, Storage and Data Collection

Storage roots were harvested using a one-row potato digger (model D 10 M; U.S. Small Farm Equipment Co., Worland, WY, USA) and classified using U.S. standards for grades of sweetpotatoes [5]: U.S. No.1 (maximum (max.) diameter, 8.9 cm; minimum (min.) diameter, 4.4 cm; max. length, 22.8 cm; min. length, 7.6 cm), petite (max. diameter, 5.7 cm; min. diameter, 3.8 cm; max. length, 17.8 cm; min. length, 7.6 cm), jumbo (diameter, >8.9 cm; length, >22.8 cm), canner (max. diameter, 5.7 cm; min. diameter, 3.8 cm; max. length, 17.8 cm; min. length, 7.6 cm), and cull (storage roots of any size that exhibited off-shapes and/or damages from bruises, scarring, growth cracks, decay, insects, or other means). After the storage roots were categorized, they were weighed to calculate marketable yield (MY) and total yield (TY), where MY equals the sum of all categories excluding cull and TY equals MY plus cull. All yield data were expressed in ton/hectare (t ha−1).

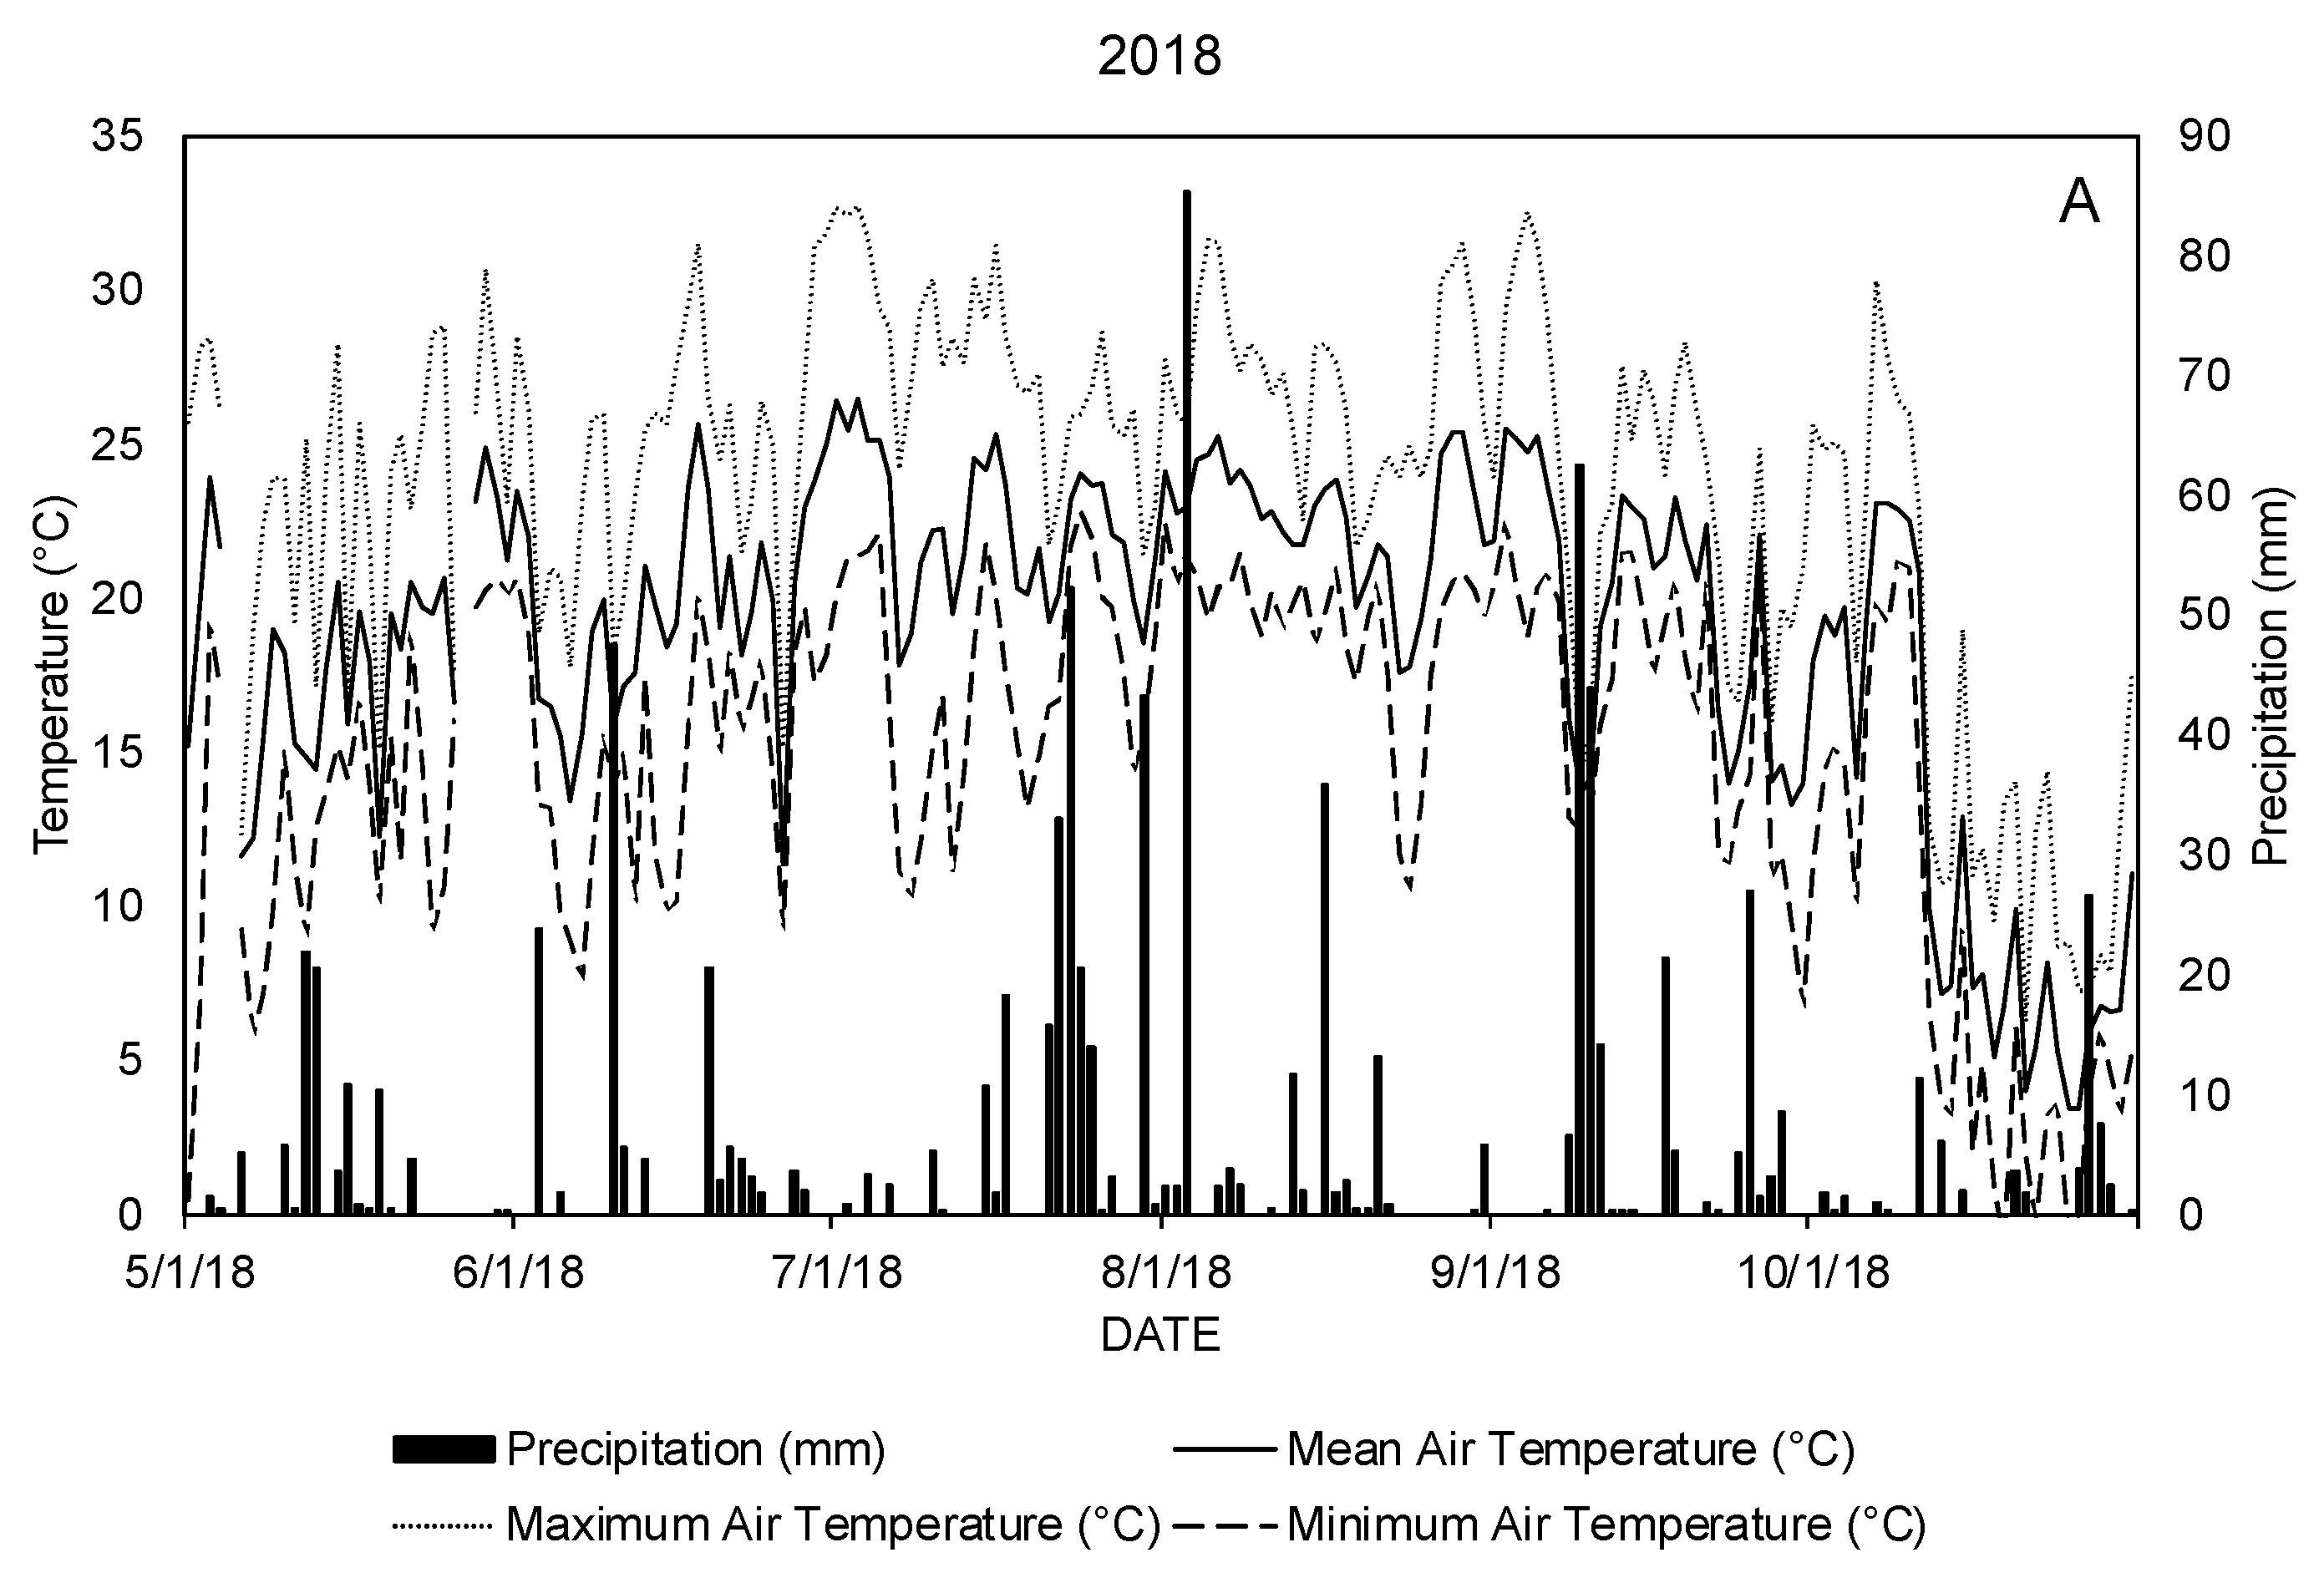
2.4. Growing Degree Days (GGD)

Daily growing-degree days were calculated as follows:
[ daily   maximum   air   T ° + daily   minimum   air   T ° 2 ] base   T °
where base temperature was set to 15.5 °C [9,10]. If the average of the minimum and maximum air temperatures was below the base temperature, the number of GDD was set to the base temperature. GDD with a base temperature of 10 °C were also calculated for comparison. Cumulative GDD were the sums of daily degree days from planting date until harvest date.

2.5. Statistical Analysis
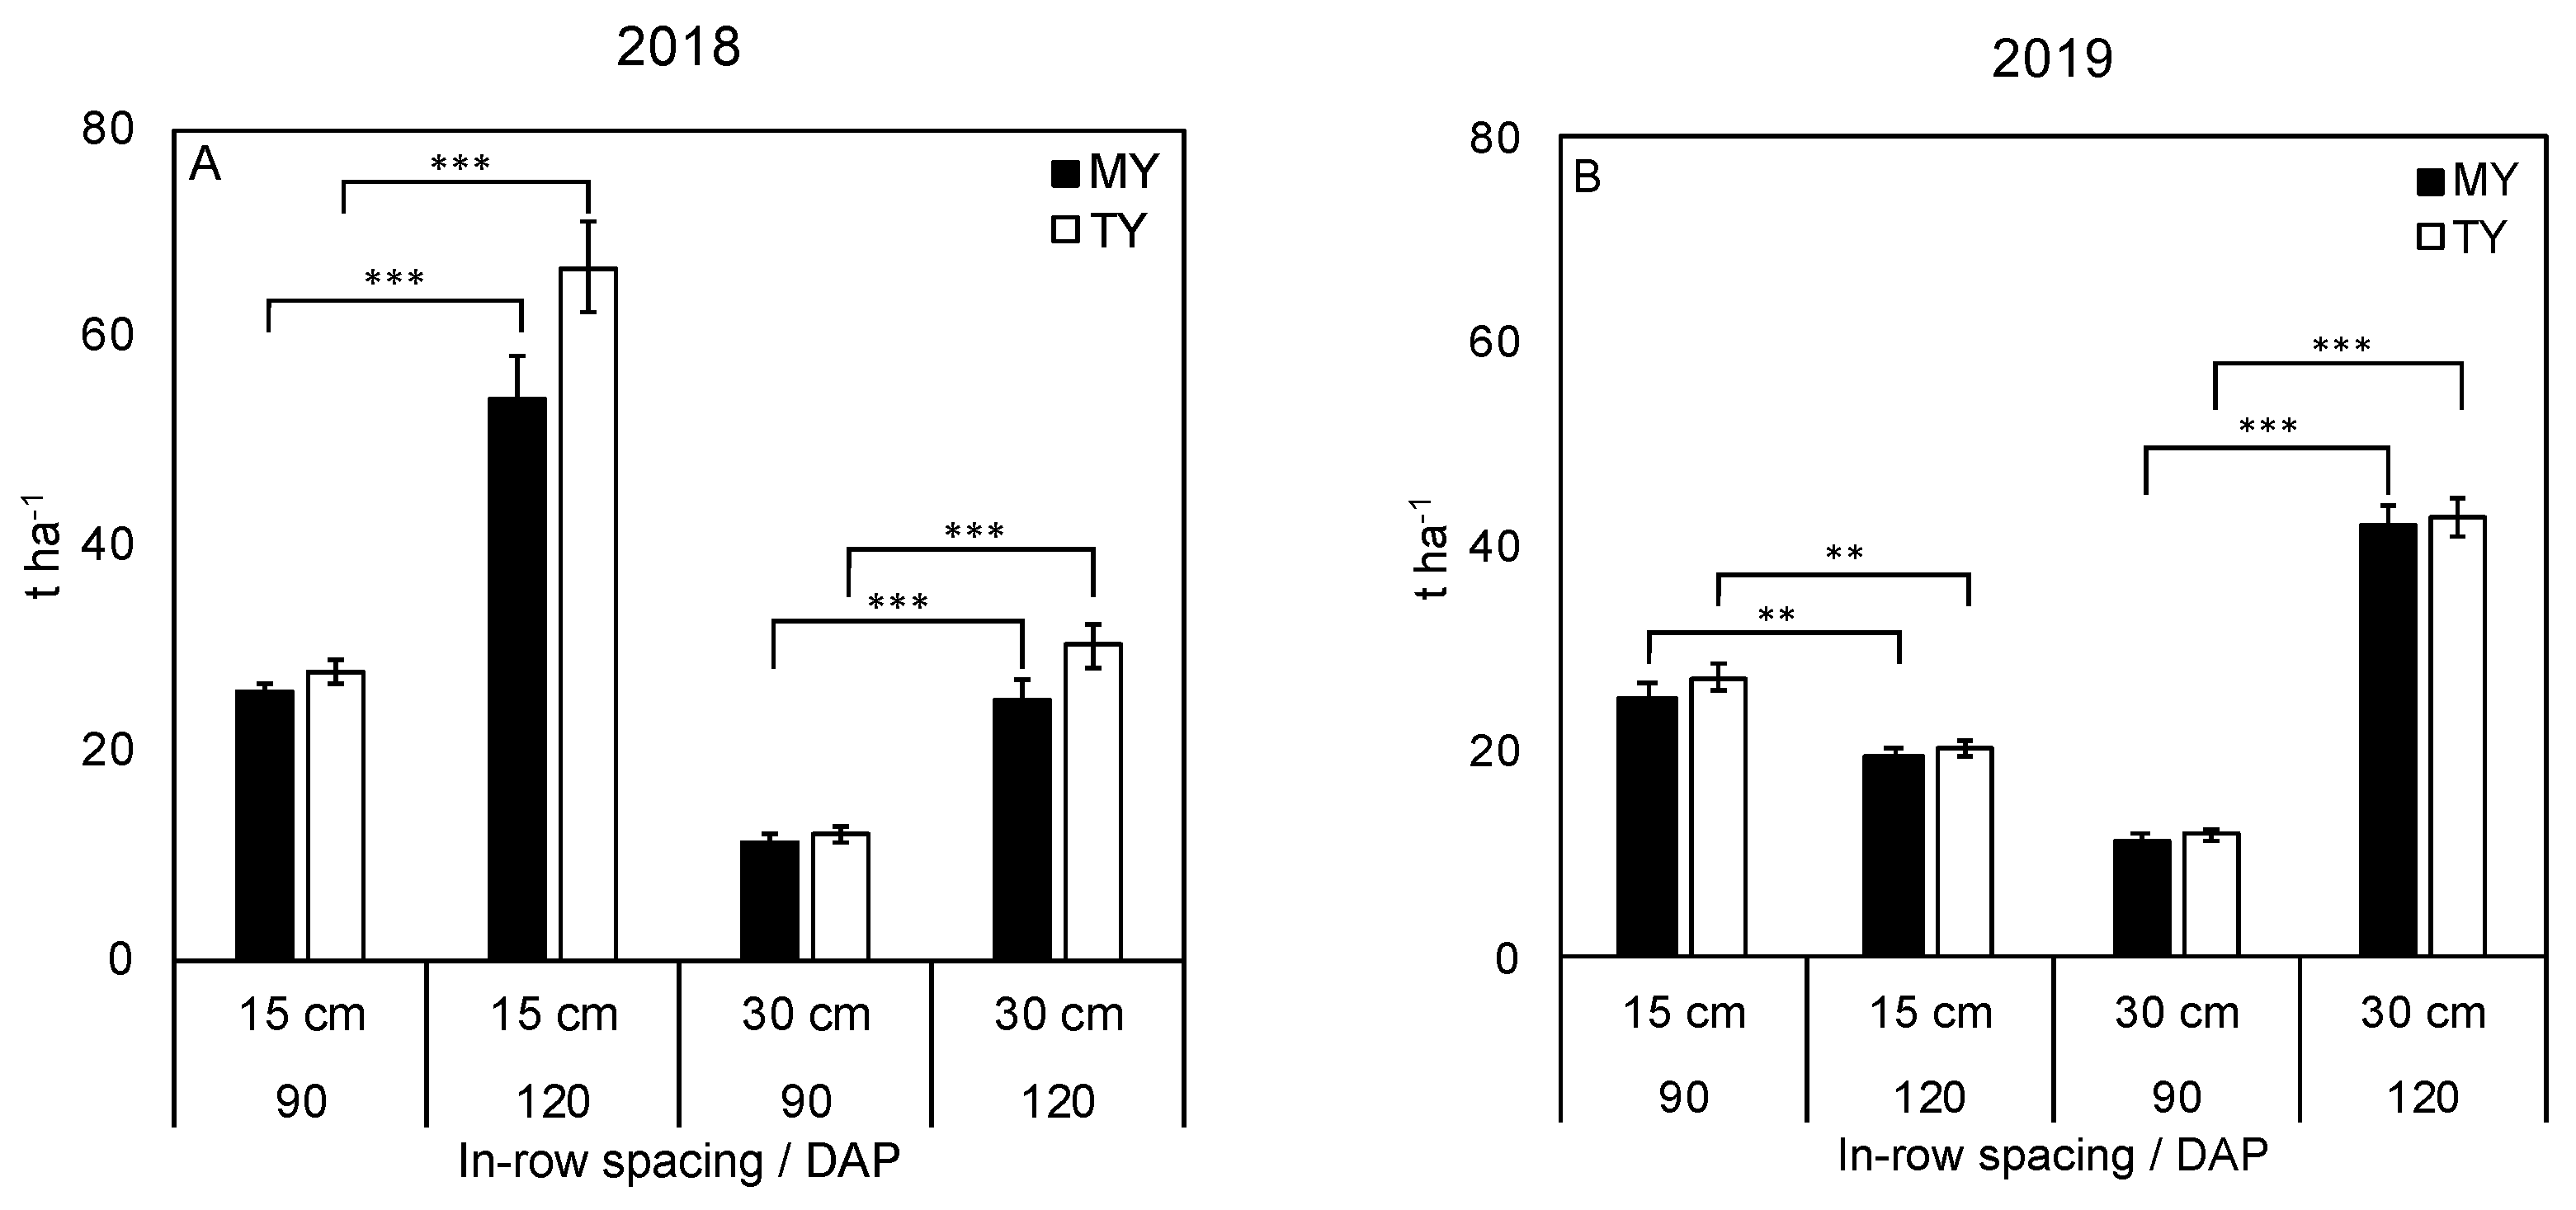
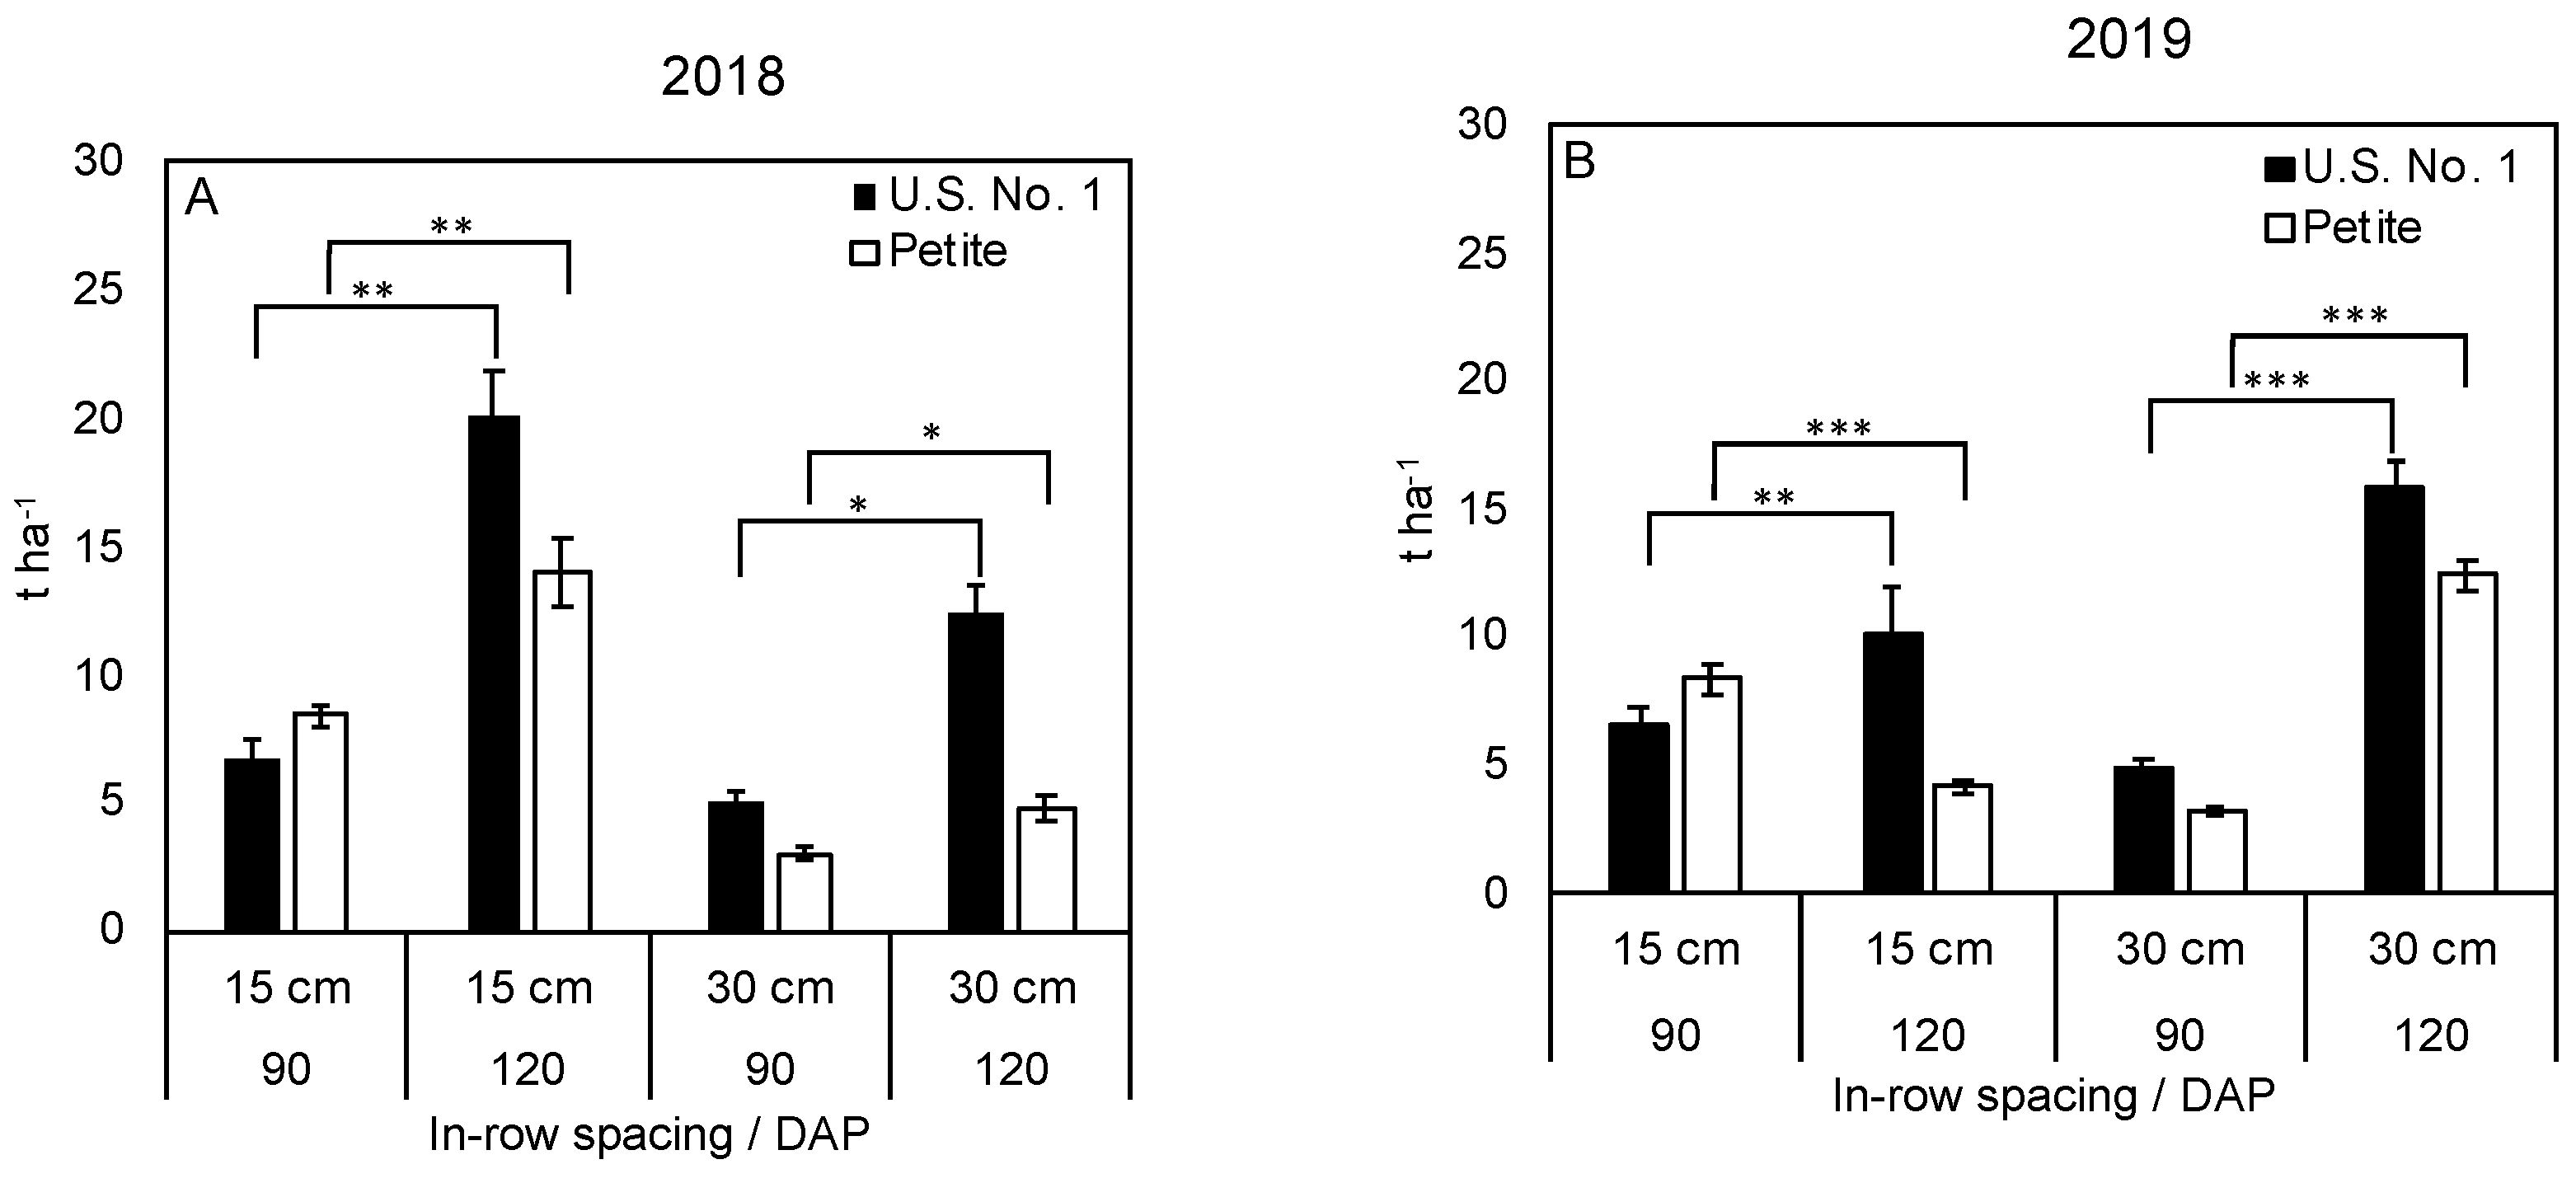
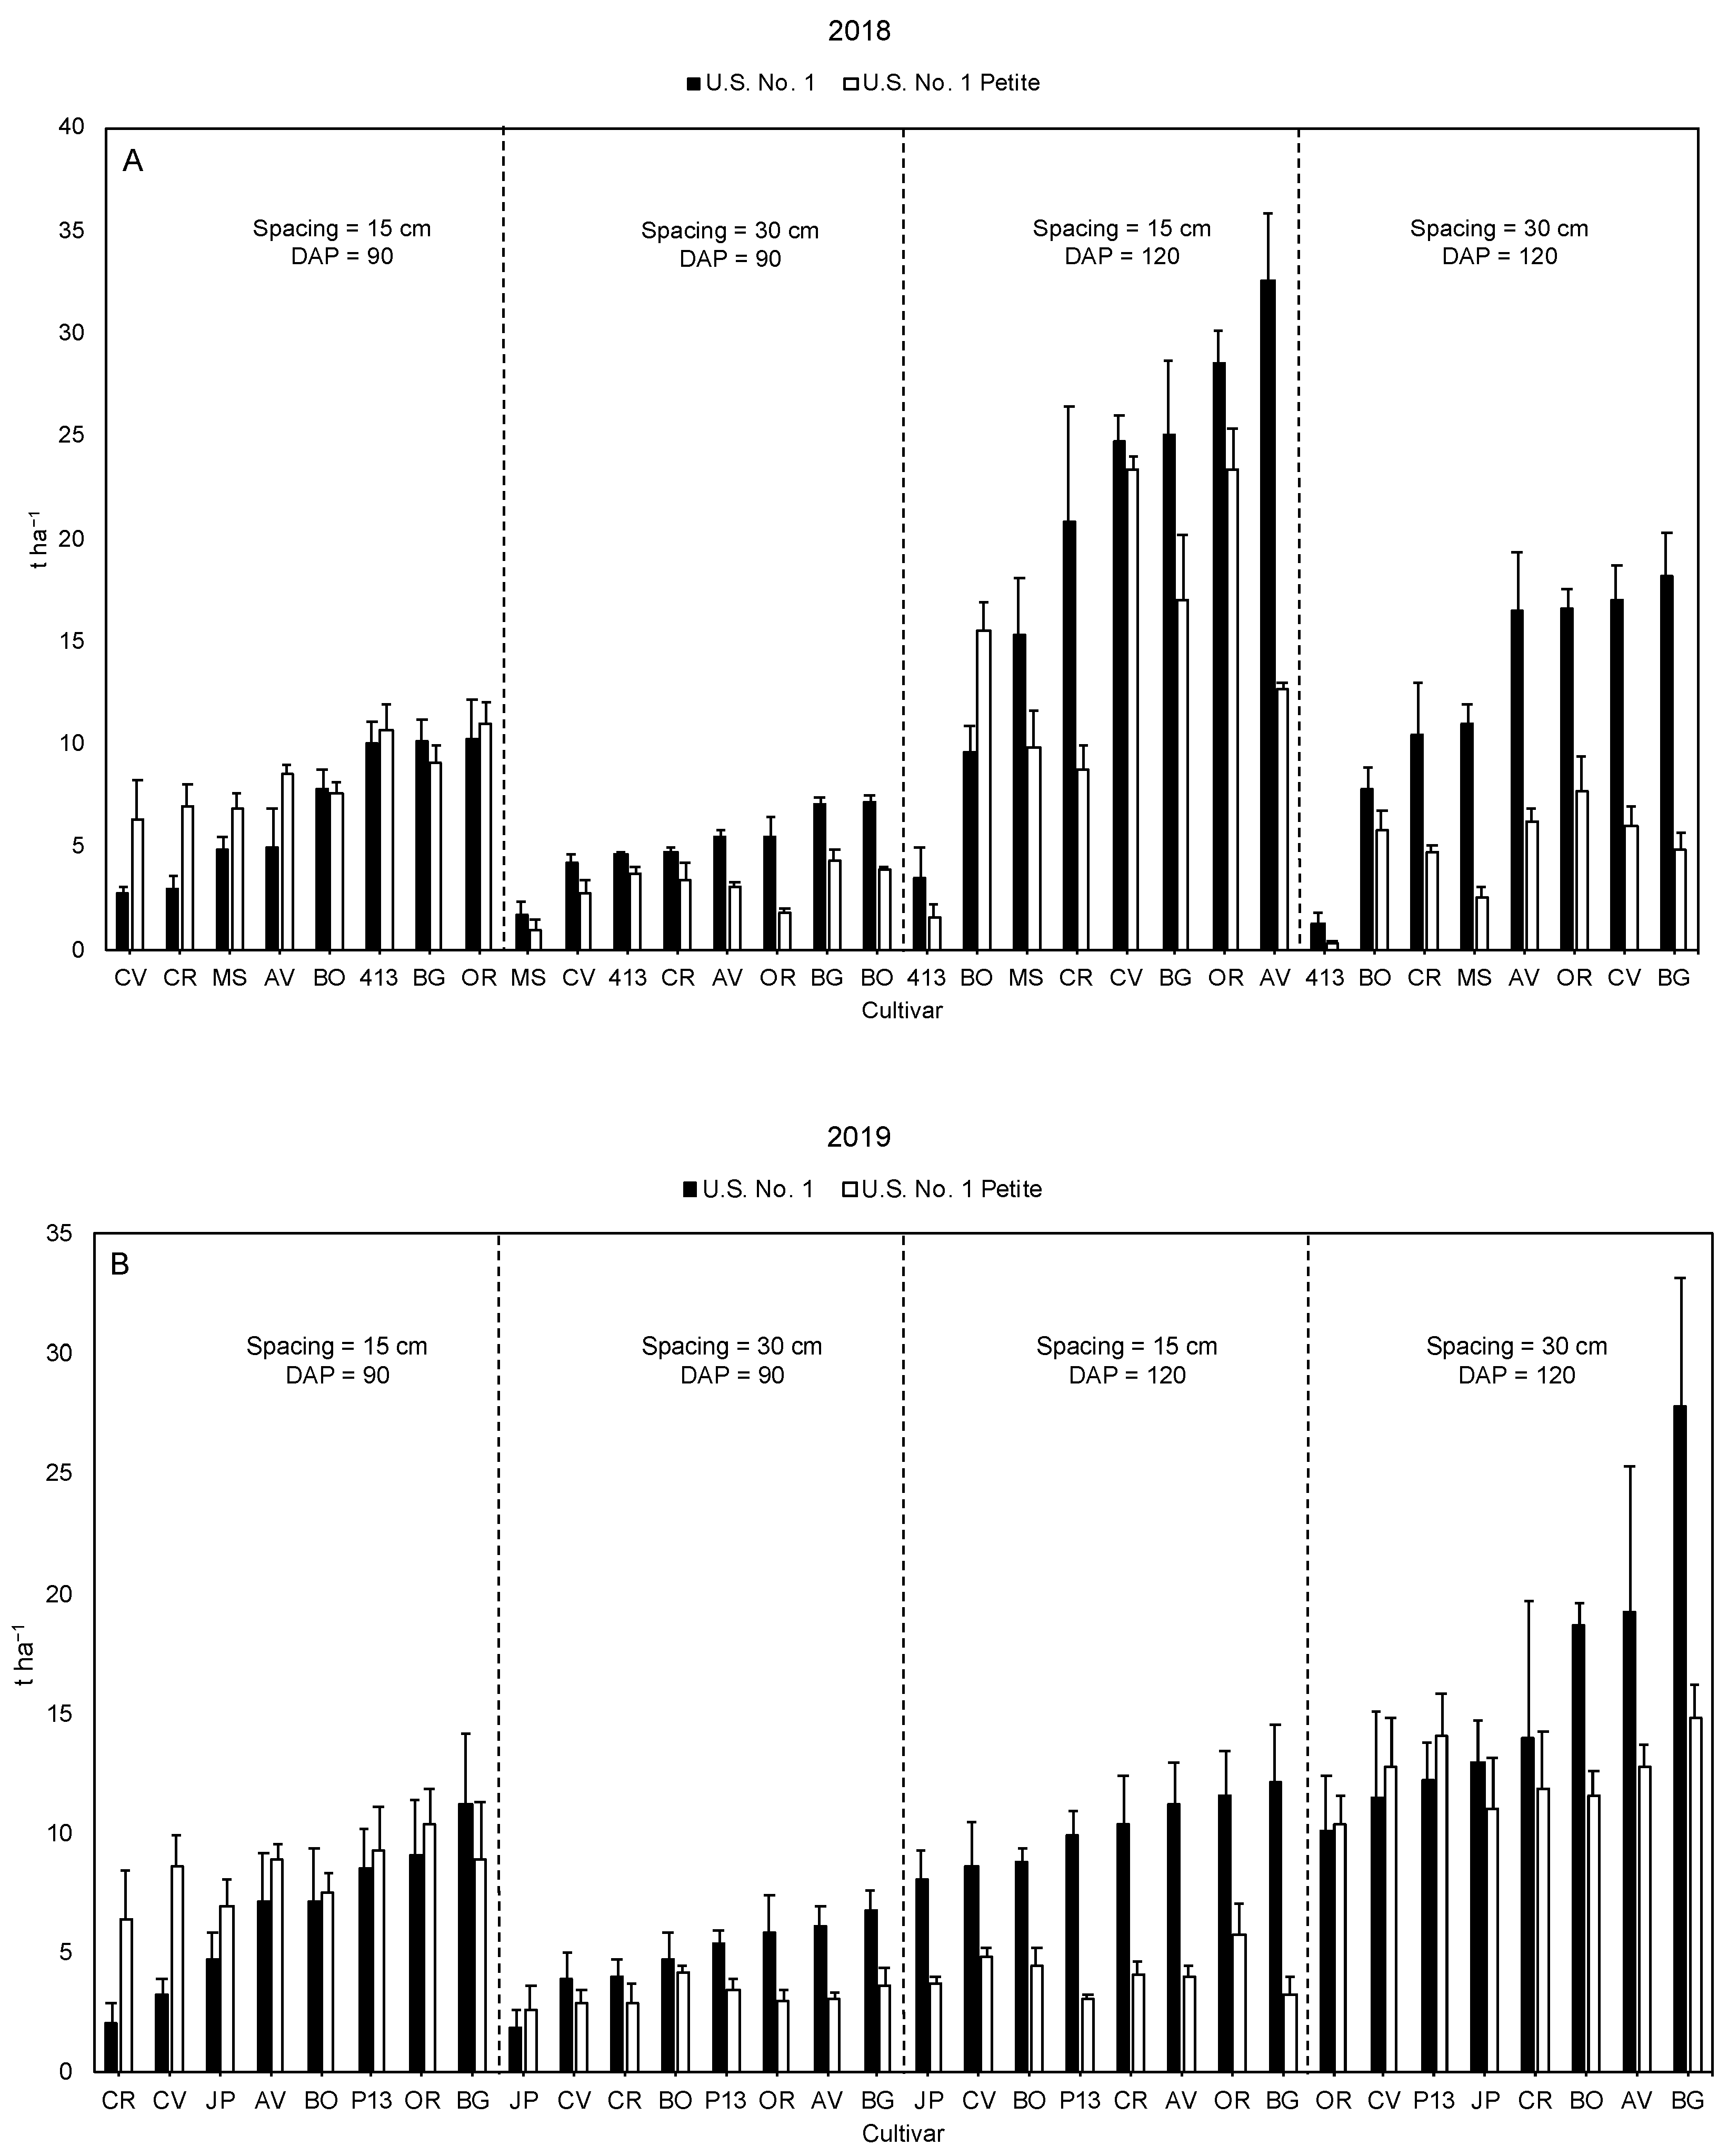
Data were tested for normality (we used two Goodness of Fit tests, Shapiro–Wilk, and Anderson Darling, respectively) and homogeneity of variance (Levene’s test). Both tests are contained in JMP Pro (version 16; SAS Institute, Cary, NC, USA). Afterwards, data were subject to analysis of variance using JMP Pro (version 16; SAS Institute, Cary, NC, USA). When comparing varieties, when the overall F test was significant (p ≤ 0.05), means separations were evaluated using Tukey’s honestly significant difference test at p ≤ 0.05.

3. Results

Daily precipitation, maximum, minimum, mean air temperatures, and GDD data are presented for the 2018 and 2019 growing seasons for Rock Springs, PA (Figure 2, Table 1). This information is offered to illustrate the environmental differences for both years during the experimental period and to offer an estimation of shifting weather patterns for the region. Specifically, 2018 was warmer and rainier compared to 2019 which displayed somewhat cooler and drier climate representative of this region. Particularly, Pennsylvania recorded the rainiest July (2018) in recorded history, with a mean precipitation of 19.1 cm and a 6-month mean of 15.9 cm (May–October). In 2018, mean air-temperature averaged 21.1 °C (4-month mean, June–September) compared with 19.8 °C in 2019 [7].
GDD under both base temperatures (10 °C and 15.5 °C) offered an indication of phenological development of all varieties studied harvested at 90 and 120 DAP (Table 1). As indicated above, overall air temperature averages in 2018 were higher when compared to 2019. As a result, cumulative GDD in 2018 at 120 DAP was 1393.5 (base temperature 10 °C) and 783.6 (base temperature 15.5 °C) compared to 1251.7 (base temperature 10 °C) and 691 (base temperature 15.5 °C) in 2019.
The field experiments performed both in 2018 and 2019, including all varieties, in-row spacing, and DAP (as main effects), and certain interactions between variables presented statistically significance differences in TY and MY (Table 2). For 2018, there were significant interactions between variety and in-row spacing and/or DAP showing that most varieties differed in their response to in-row spacing and DAP treatments. However, in 2019 the interactions between variety and in-row spacing and/or DAP treatments were not significant (Table 2). Therefore, data were reanalyzed separately for each year independently and the results for each variety, variable, and year are presented separately.
In 2018, TY was higher (>69%) using 15 cm spacing and harvested at 120 DAP when compared to 2019. However, using 30 cm spacing and harvested at 120 DAP there was a ~42% increase in TY in 2019 compared to 2018 (Figure 3). There was no significant difference when comparing both spacings harvested at 90 DAP in both years evaluated. Likewise, MY presented a similar difference to TY in both years (Figure 3). In 2018, U.S. No. 1 and Petite average yields (all varieties averaged as a whole) were higher under 15 cm in-row spacing and harvested at 120 DAP (~20 t ha−1 and ~14 t ha−1, respectively) followed by 30 cm in-row spacing harvested at 120 DAP for U.S. No. 1 (~12 t ha−1) and 15 cm in-row spacing and 90 DAP for Petite (~8 t ha−1) (Figure 4). For 2019, overall yields for U.S. No. 1 and Petite decreased by ~12% by taking all treatment combinations into account compared to 2018. Specifically, U.S. No. 1 and Petite sweetpotatoes showed the highest yields under 30 cm in-row spacing and harvested at 120 DAP (~16 t ha−1 and ~12 t ha−1, respectively) (Figure 4). For 2018, MY of the highest yielding varieties were ‘Covington’, ‘Beauregard’, and ‘Averre’ under 15 cm in-row spacing and harvested at 120 DAP (range, 70–74 t ha−1), whereas the lowest yielding variety ‘Murasaki’, produced as little as 4.4 t ha−1 under 30 cm in-row spacing and harvested at 90 DAP. In contrast, MY ranged from 6.8 to 52.5 t ha−1 in 2019. In both years, ‘Beauregard’ and ‘Averre’ either produced the highest yields of marketable roots or produced yields not significantly different from each other (2018 = 15 cm in-row spacing, 120 DAP; 2019 = 30 cm in-row spacing, 120 DAP (Table 3)). Both MS (30 cm in-row spacing, 90 DAP) and 413 (30 cm in-row spacing, 120 DAP) produced the lowest MY in 2018, with 4.4 and 4.5 t ha −1, respectively. However, in 2019 the lowest MY was produced by ‘Japanese’ (6.8 t ha−1) and ‘Covington’ (9.2 t ha−1), both varieties under 30 cm in-row spacing and harvested at 90 DAP.
To further examine grade standards for U.S. No.1 and Petite sweetpotato, all varieties tested during both years were graded meticulously, measured, and weighed to report for differences between jumbo, canner, and cull categories (Table 3).
For 2018, ‘Averre’ presented the highest overall yield of U.S. No. 1 under 15 cm in-row spacing and harvested at 120 DAP (32.6 t ha−1) followed by ‘Orleans’, ‘Beauregard’, and ‘Covington’ (Table 3). For 2019, ‘Beauregard’ under 30 cm in-row spacing and harvested at 120 DAP gave the highest U.S. No. 1 yield (27.9 t ha−1) followed by ‘Averre’, ‘Bonita’, and ‘Carolina Ruby’. However, when comparing both years separately, there was a 28.1% U.S. No. 1 yield reduction in 2019 (110.9 to 79.7 t ha-1). ‘Covington’ produced the highest yield of Petite roots in 2018 (23.4 t ha−1) under 15 cm in-row spacing and harvested at 120 DAP, followed by ‘Orleans’, ‘Beauregard’, and ‘Bonita’ (23.3, 17.0, and 15.5 t ha−1, respectively) (Table 3). Comparable to U.S. No. 1 yield trend, Petite followed a decrease in yield in 2019. ‘Beauregard’ under 30 cm in-row spacing and harvested at 120 DAP was the highest yielder (14.8 t ha−1) followed by ‘NCP13-0030’, ‘Covington’, and ‘Averre’ (14.0, 12.8, and 12.7 t ha−1, respectively) (Table 3). Jumbo yield varied significantly when harvested between 90 and 120 DAP for both years (Table 3). Overall, jumbo yield in 2018 at 120 DAP was 9.0 t ha−1, while at 90 DAP was 1.4 t ha−1 (both in-row spacings and varieties averaged together). Following this same trend in 2019, jumbo yield at 120 DAP was 1.7 t ha−1, while in 2019 was 0.9 t ha−1 (both in-row spacings added together). ‘Beauregard’ produced the highest yield of jumbo roots, with 11.7 t ha−1 under 30 cm in-row spacing and harvested at 120 DAP, whereas ‘Averre’, ‘Bonita’, and ‘Covington’ produced no jumbo roots for 2018 (15 cm in-row spacing; 90 DAP). Likewise, ‘Murasaki’ was the highest jumbo root yielder with 2.6 t ha−1 for 2019 (15 cm in-row spacing, 120 DAP). ‘Bonita’ consistently produced the highest yield of canner roots in both years (25.1 t ha−1 (15 cm in-row spacing, 120 DAP); 19.7 t ha−1 (30 cm in-row spacing, 120 DAP), respectively). The cull category was dominated by ‘Averre’ and ‘Beauregard’ in 2018 and ‘Carolina Ruby’ and ‘Beauregard’ in 2019, which displayed signs of growth cracks and off-shapes and resulted in cull yields between 18.3 and 20.6 t ha−1 for 2018. Interestingly for 2019, all varieties produced very low cull yields (range, 0.0–4.1 t ha−1) (Table 3).
The effect of DAP, like that of in-row spacing, varied with year and variety. For 2018, the combination of 15 cm in-row spacing and harvest at 120 DAP had a marked effect on TY, MY, U.S. No. 1, and Petite roots for most varieties tested (Table 3, Figure 5). In contrast, the early harvest treatment (90 DAP) combined with 30 cm in-row spacing reduced TY, MY, U.S. No. 1, and Petite considerably compared to the late harvest treatment. ‘Averre’, ‘Orleans’, ‘Beauregard’, and ‘Covington’ presented the highest U.S. No. 1 and Petite yields using both 15 and 30 cm in-row spacing and harvested at 120 DAP, albeit yields under the 15 cm in-row spacing were 2-fold higher when compared to 30 cm in-row spacing (Figure 5). For 2019, the highest yielding treatment combination was 30 cm in-row spacing harvested at 120 DAP, followed by 15 cm in-row spacing harvested at 90 DAP (Figure 5). Within the highest yielding treatment, ‘Beauregard’, ‘Averre’, ‘Bonita’, and ‘Carolina Ruby’ were the varieties with the highest U.S. No. 1 yields. However, there was a tradeoff between U.S. No.1 and Petite yield under 15 cm in-row spacing harvested either at 90 or 120 DAP (Figure 5).

4. Discussion

Sweetpotato is recognized as a climate resilient crop, adopted in low and high input agricultural management systems, and adapted to cope to numerous types of soils and climates [9], with their North American planting distribution ranging from Florida to southern Ontario, Canada [10]. Briefly, sweetpotatoes are a warm-season crop with daily maximum air-temperatures between 29.7 °C and 35.3 °C that are ideal for storage root production. However, sweetpotato is frost-sensitive requiring between 90 to 150 days of a frost-free growing period [9]. Soils for sweetpotato production range from sand to loamy sand in texture, are well drained, and low in salts. Yet, sweetpotato can grow in heavy soils, but yield and quality can decrease. However, recent studies have shown potential in adapting sweetpotato management and production strategies in less-than-ideal scenarios [2,11,12,13,14]. Considering that, the adaptability and adoptability of sweetpotato in the northern latitudes (e.g., Canada, Mid-Atlantic, and Northeast U.S.) has been well-researched [2,11,12,13,14]. Worldwide, sweetpotato is grown in similar conditions in northern latitudes. For example, in China sweetpotato is grown in five major areas regarding environmental conditions and management systems. These are: the Northern Spring Region, the Yellow-Huai River Valley Spring–Summer Region, the Yangtze River Valley Spring–Summer Sweetpotato Region, the Southern Summer–Autumn Sweetpotato Region, and the Southern Autumn–Winter Sweetpotato Region. Specifically, the Northern Spring Region has a short summer and long winter periods with large differences in day and night temperatures. Yearly mean temperatures are near 10.5 °C with a frost-free period of 170 days [15].
In this study, a total of ten sweetpotato varieties with different with diverse skin, flesh, and culinary attributes were examined for two growing seasons. Interestingly, this is the first study that evaluates the production of Petite sweetpotato separate from other sweetpotato standards for grades of sweetpotato using different varieties in the Mid-Atlantic and Northeastern U.S. region. The U.S. population has steadily increased its consumption of fresh market sweetpotato, but sweetpotato is also progressively being used for high-value alternate markets, such as processed foods (e.g., French fries and chips) and industrial products (starch, flour, food dyes), among others [2]. Typically, direct-market sales through local farmers’ markets and grocery stores are the principal outlet for vegetable farmers, and locally grown sweetpotatoes throughout the Mid-Atlantic and Northeastern U.S. [2]. In general, orange-skinned, orange-fleshed varieties, such as, ‘Averre’, ‘Beauregard’, and ‘Orleans’ performed better than most varieties tested in both years and under all treatments. These results are comparable with those of Wees et al. [11,12], Hochmuth and Howell [13], Sideman [14], Nair et al. [15], Goldy and Wendzel [16], Bornt [17], and Duque [2], where orange-skinned, orange-fleshed varieties consistently had higher yields and better physical and increased nutritional attributes (e.g., storage root shape/smoothness and higher beta-carotene content) compared with other varieties tested. Treatment effects [in-row spacing (15 cm and 30 cm) and harvest time (90 and 120 days)] provided somewhat similar results with [18,19]. Specifically, Schultheis et al. [19] showed as in-row plant spacing decreased, yield of U.S. No. 1, canners, and total marketable yield increased when plants were harvested at 100 days or later after transplanting with ‘Beauregard’ presenting the highest marketable yield and U.S. No.1 at 15 cm in-row spacing. However, Arancibia et al. [20] showed only marginal effects on yield at different row widths and in-row spacings.
We also observed that growing degree days is a better predictor for harvest than days after planting, with an accumulation of at least ~700 GDD (base temperature 15.5 °C) or ~1300 GDD (base temperature 10 °C) for both U.S. No. 1 and Petite roots. In prior research, Villordon et al. [21] characterized a GDD predicative model for sweetpotato production in Louisiana, USA. They found that harvest schedules could be done at ~2600 GDD. This difference in GDD between Louisiana and the NE could be due to divergent climatic conditions, longer versus shorter growing seasons and ultimately the use of black plastic mulch.
Commonly, orange-skinned, orange-fleshed sweetpotatoes (e.g., ‘Beauregard’ and ‘Covington’), with high yields and favorable physical attributes have been the first choice in consumer preference [20]; however, unusual skin/flesh combinations, such as ‘Carolina Ruby’ (red-skinned, orange-fleshed), ‘Bonita’ (tan-skinned, tan-fleshed), and ‘Murasaki’ (purple-skinned, white-fleshed) also offer acceptable yields and are of consumer interest. Our study indicates that ‘Beauregard’ and ‘Averre’ are recommended choices for Mid-Atlantic and Northeastern U.S. farmers for U.S. No. 1 and Petite sweetpotato yield and environmental adaptability. Additionally, but with slightly lower marketable yields, growing ‘Carolina Ruby’, ‘Murasaki’, ‘Bonita’, and purple-skinned, purple-fleshed varieties can guarantee a mix of colors, textures, and flavors that are preferred for potential developing markets for the Mid-Atlantic and Northeastern U.S. regions. That said, exploiting the variability in standards for grades of sweetpotato root sizes, allows small farmers and mid to large acreage producers to maximize their profit potential. Storage roots that do not meet certain criteria for one market may be highly valued by another.

Supplementary Materials

The following are available online at https://www.mdpi.com/article/10.3390/horticulturae8020172/s1, File S1: Experimental design layout in the field.

Author Contributions

Conceptualization, L.O.D.; methodology, L.O.D.; formal analysis, L.O.D. and E.S.; writing—original draft preparation, L.O.D.; writing—review and editing, L.O.D., E.S., C.Y. and K.P. All authors have read and agreed to the published version of the manuscript.

Funding

This research was funded by the Pennsylvania Department of Agriculture Specialty Crop Block Grant Program under Grant Agreement #4417652 and #C9400000527 and the U.S. Department of Agriculture, National Institute of Food and Agriculture and hatch Appropriations under Project#PEN04582 and Accession #1005492.

Institutional Review Board Statement

Not applicable.

Informed Consent Statement

Not applicable.

Data Availability Statement

Readers can contact authors.

Acknowledgments

The corresponding author would like to thank Russell E. Larson Agricultural Research Center field team and interns at The Pennsylvania State University for technical support and support. I am grateful for the guidance and collaboration of the National Sweetpotato Collaborator’s Group.

Conflicts of Interest

The authors declare no conflict of interest.

References

  1. USDA National Agricultural Statistics Service. Available online: https://data.nal.usda.gov/dataset/nass-quick-stats (accessed on 6 July 2020).
  2. Duque, L.O. Performance of Sweetpotato Varieties Grown Using Black Plastic Mulch in Pennsylvania. Horttechnology 2020, 30, 797–802. [Google Scholar] [CrossRef]
  3. Truong, V.D.; Avula, R.Y.; Pecota, K.V.; Yencho, G.C. Sweetpotato Production, Processing, and Nutritional Quality. In Handbook of Vegetables and Vegetable Processing; John Wiley and sons Ltd.: New York, NY, USA, 2018; pp. 811–838. [Google Scholar]
  4. USDA. United States Standards for Grades of Sweetpotatoes Agricultural Marketing Service/Fruit and Vegetable Division. Available online: https://www.ams.usda.gov/sites/default/files/media/Sweetpotato_Standard%5B1%5D.pdf (accessed on 6 July 2020).
  5. Hoffman, M. Fingerling Sweetpotatoes Are the Next “It” Vegetable and We Are Fully on Board. Available online: https://www.epicurious.com/ingredients/what-are-fingerling-sweet-potatoes-how-to-cook-them-article (accessed on 10 June 2021).
  6. Northeast Regional Climate Center. Available online: http://www.nrcc.cornell.edu/ (accessed on 10 July 2020).
  7. Estimating Soil Moisture by Feel and Appearance. Available online: https://www.nrcs.usda.gov/Internet/FSE_DOCUMENTS/nrcs144p2_051845.pdf (accessed on 6 August 2020).
  8. OMAFRA. Vegetable Production Recommendations 2010–2011; Publication 363; Ontario Ministry of Agriculture, Food and Rural Affairs: Guelph, ON, Canada, 2010.
  9. Jansson, R.K.; Raman, K.V. Sweetpotato pest management: A global overview. In Sweetpotato Pest Management, A Global Perspective; CRC Press: Boca Raton, FL, USA, 1991; pp. 1–12. [Google Scholar]
  10. Bouwkamp, J.C. Introduction—Part I. In Sweetpotato Products; Bouwkamp, J.C., Ed.; CRC Press: Boca Raton, FL, USA, 1985; pp. 11–16. [Google Scholar]
  11. Wees, D.; Seguin, P.; Boisclair, J. Sweetpotato production in a short-season area utilizing black plastic mulch: Effects of cultivar, in-row plant spacing, and harvest date on yield parameters. Can. J. Plant Sci. 2016, 96, 139–147. [Google Scholar] [CrossRef] [Green Version]
  12. Wees, D.; Seguin, P.; Boisclair, J.; Gendre, C. Performance and Quality of Sweetpotato Cultivars Grown in Quebec, Canada with Biodegradable Plastic Mulch. Horttechnology 2015, 25, 815. [Google Scholar] [CrossRef] [Green Version]
  13. Hochmuth, G.J.; Howell, J.C., Jr. Effect of black plastic mulch and raised beds on sweetpotato growth and root yield in a northern region. HortScience 1983, 18, 467–468. [Google Scholar]
  14. Sideman, R.G. Performance of Sweetpotato Cultivars Grown Using Biodegradable Black Plastic Mulch in New Hampshire. Horttechnology 2015, 25, 412–416. [Google Scholar] [CrossRef] [Green Version]
  15. Nair, A.; Bergaum, B.; Bilenky, M. Sweetpotato Cultivar Trial. Available online: http://farms.ag.iastate.edu/sites/default/files/SweetPotatoCultivar.pdf (accessed on 6 July 2020).
  16. Goldy, R.; Wendzel, V. Evaluation of Ten Sweetpotato Cultivars in Southwest Michigan. Available online: https://extension.umd.edu/sites/extension.umd.edu/files/_docs/programs/mdvegetables/MidwestVegTrialReport_2008.pdf (accessed on 6 July 2020).
  17. Bornt, C. Improving the Yield and Quality of Sweetpotatoes Grown in New York, 2012 Final Report. Available online: https://projects.sare.org/project-reports/lne10-292/ (accessed on 6 July 2020).
  18. Schultheis, J.R.; Walters, S.A.; Adams, D.E.; Estes, E.A. In-row Plant Spacing and Date of Harvest of ‘Beauregard’ Sweetpotato Affect Yield and Return on Investment. HortScience 1999, 34, 1229. [Google Scholar] [CrossRef] [Green Version]
  19. Arancibia, R.A.; Smith, C.D.; LaBonte, D.R.; Main, J.L.; Smith, T.P.; Villordon, A.Q. Optimizing Sweetpotato Production for Fresh and Processing Markets through Plant Spacing and Planting-harvest Time. Horttechnology 2014, 24, 16–24. [Google Scholar] [CrossRef] [Green Version]
  20. Smith, T.P.; Stoddard, S.; Shankle, M.; Schultheis, J. Sweetpotato Production in the United States. In The Sweetpotato; Loebenstein, G., Thottappilly, G., Eds.; Springer: Dordrecht, The Netherlands, 2009; pp. 287–323. [Google Scholar]
  21. Villordon, A.; Clark, C.; Ferrin, D.; LaBonte, D. Using Growing Degree Days, Agrometeorological Variables, Linear Regression, and Data Mining Methods to Help Improve Prediction of Sweetpotato Harvest Date in Louisiana. Horttechnology 2009, 19, 133. [Google Scholar] [CrossRef] [Green Version]
Figure 1. Size comparison of a U.S. No. 1 and Petite sweetpotato (cultivar ‘Averre’) storage root following the “United States for Grades of Sweetpotato” [4].
Horticulturae 08 00172 g001
Figure 2. Daily precipitation (mm) and air temperature (°C) at Rock Springs, PA, field sites during the (A) 2018 and (B) 2019 growing seasons.
Horticulturae 08 00172 g002aHorticulturae 08 00172 g002b
Figure 3. Main effects of in-row spacing and days after planting on total and marketable yields of sweetpotato for the 2018 (A) and 2019 (B) field seasons. Error bars are one standard error from the mean. Statistically significant comparisons are indicated on the graphs with ** and *** denoting, respectively a p-value ≤ 0.01 and 0.001. DAP = days after planting; TY = total yield; MY = marketable yield.
Horticulturae 08 00172 g003
Figure 4. Main effects of in-row spacing and days after planting on U.S. No. 1 and Petite sweetpotato roots for the 2018 (A) and 2019 (B) field seasons. Error bars are one standard error from the mean. Statistically significant comparisons are indicated on the graphs with *, ** and *** denoting, respectively a p-value ≤ 0.05, ≤0.01 and 0.001. DAP = days after planting.
Horticulturae 08 00172 g004
Figure 5. The yield of U.S. No. 1 and Petite sweetpotato roots under 15 cm and 30 cm in-row spacing and harvested at 90 or 120 days after planting in the 2018 (A) and 2019 (B) field season. Varieties are ‘Averre’ (AV), ‘Beauregard’ (BG), ‘Bonita’ (BO), ‘Carolina Ruby’ (CR), ‘Covington’ (CV), ‘Murasaki’ (MS), ‘NC413’ (413), ‘Orleans’ (OR), ‘Japanese’ (JP), and ‘NCP13-0030’ (P13). DAP = days after planting.
Horticulturae 08 00172 g005
Table 1. Number of days after planting (DAP) and growing degree days accumulated using two base temperatures from the date of planting of sweetpotatoes until the corresponding harvest dates.
Growing Degree-Days (GDD)
Base 10 °CBase 15.5 °C
YearHarvest DateDAPActual DAPCumulative GDDIncrease in GDDCumulative GDDIncrease in GDD
20182 September90971096.0-628.3-
3 October1201281393.5297.5783.6155.3
20193 September9093999.3-558.3-
1 October1201241251.7252.4691132.7
DAP = target harvest following days after planting. Actual DAP = actual harvest following days after plants.
Table 2. Analysis of variance F-ratio results for total yield (YT) and marketable yields (MY) for variety, days after planting (DAP), in-row spacing, and interactions effects for the 2018 and 2019 growing seasons at Rock Springs, PA.
Sources20182019
TY (t ha−1)MY (t ha−1)TY (t ha−1)MY (t ha−1)
dfF-Ratiop-ValuedfF-Ratiop-ValuedfF-Ratiop-ValuedfF-Ratiop-Value
Cultivar737.3<0.0001737.1<0.000172.90.009572.80.0098
DAP1751.1<0.00011485.9<0.00011104.10.00011109.0<0.0001
In-row spacing1628.0<0.00011510.1<0.000119.60.0025113.00.0005
Cultivar × DAP739.6<0.0001741.8<0.000170.50.81470.60.7274
Cultivar × In-row spacing73.90.000873.90.000871.50.182571.70.1223
DAP × In-row spacing199.7<0.0001158.9<0.00011259.30.00011230.4<0.0001
Cultivar × DAP × In-row spacing78.1<0.000178.2<0.000171.50.192671.40.2123
df = degree(s) of freedom, t ha−1 = tons per hectare, p < 0.05 is statically significant.
Table 3. Main effects (by variety, days after planting, and in-row spacing) on yields of U.S. No. 1, Petite, Jumbo, Canner, and Cull sweetpotato grades, total and marketable yield for the 2018 (A) and 2019 (B) field season.
YearVarietyDAPIn-Row Spacing (cm)U.S. No. 1 (t ha−1)Petite (t ha−1)Jumbo (t ha−1)Canner (t ha−1)Cull (t ha−1)TY (t ha−1)MY (t ha−1)
2018AV90154.9H8.6DEFGHIJ0.0C10.6DEFG1.3EF25.4FGHIJK24.1DEFGHI
90305.4GH3.1HIJKLMN0.0C2.6JKL0.7EF11.8KLM11.1IJK
1201532.6A12.7BCD9.3AB16.2CD20.6A91.3A70.7A
1203016.5CDEF6.3EFGHIJKLMN4.3ABC3.1IJKL4.8EF35.0DEFGH30.2DEFG
BG901510.1EFGH9.1DEFGH1.1BC7.8EFGHIJK2.5EF30.7DEFGHI28.2DEFGH
90307.0FGH4.3GHIJKLMN2.0BC1.8KL0.5F15.7IJKLM15.2HIJK
1201525.1ABC17.0B8.1ABC24.4AB18.3AB92.8A74.5A
1203018.2CDE4.9EFGHIJKLMN11.7A4.2HIJKL7.0CDEF45.9CD38.9CD
BO90157.8FGH7.6DEFGHIJKL0.0C14.1CDE2.1EF31.6DEFGHI29.5DEFGH
90307.2FGH3.9GHIJKLMN0.0C4.9GHIJKL0.7EF16.7IJKLM16.0GHIJK
120159.6EFGH15.5BC0.4C25.1A3.7EF54.3C50.6BC
120307.9FGH5.8EFGHIJKLMN0.3C8.5EFGHIJ1.4EF23.8FGHIJKL22.4EFGHIJ
CR90153.0H7.0DEFGHIJKLM1.1BC9.5EFGH4.2EF24.7FGHIJKL20.6FGHIJ
90304.7H3.4HIJKLMN0.4C4.2HIJKL1.0EF13.6JKLM12.6IJK
1201520.8BCD8.7DEFGHI8.3ABC16.9CD16.5ABC71.2B54.7B
1203010.4EFGH4.7FGHIJKLMN2.4BC6.3FGHIJKL4.4EF28.2EFGHIJ23.8EFGHI
CV90152.7H6.3EFGHIJKLMN0.0C11.9DEF1.8EF22.8GHIJKL21.0EFGHIJ
90304.2H2.8IJKLMN0.3C1.4L0.3F9.0LM8.7JK
1201524.7ABC23.4A8.3ABC18.4BC10.5BCDE85.3AB74.8A
1203017.0CDEF6.0EFGHIJKLMN3.4ABC4.9GHIJKL8.3CDEF39.7CDEF31.4DEF
MS90154.9H6.9DEFGHIJKLM2.5BC7.8FGHIJK1.0EF23.0GHIJKL22.0EFGHIJ
90301.7H1.0MN0.3C1.4L0.6F4.9M4.4K
1201515.3CDEFG9.8CDEFG4.0ABC6.8FGHIJKL8.2CDEF44.0CDE35.8CDE
1203011.0DEFGH2.5JKLMN2.6BC1.7KL1.4EF19.2HIJKLM17.8FGHIJK
413901510.1EFGH10.7CDEF1.3BC9.5EFGH1.8EF33.4DEFGH31.6DEF
90304.6H3.7GHIJKLMN0.7BC3.4HIJKL0.0F12.5JKLM12.5IJK
120153.5H1.5LMN2.5BC0.8L14.9ABCD23.3GHIJKL8.4JK
120301.3H0.3N1.5BC1.4L6.4DEF11.0KLM4.5K
OR901510.2EFGH11.0BCDE1.4BC5.5GHIJKL1.9EF30.0DEFGHI28.1DEFGH
90305.5GH1.8KLMN0.4C3.2HIJKL0.9EF11.8KLM10.9IJK
1201528.5AB23.3A1.2BC9.3EFGHI8.4CDEF70.8B62.4AB
1203016.6CDEF7.7DEFGHIJK4.2ABC3.5HIJKL6.3DEF38.2CDEFG31.9DEF
p > F0.00540.00010.26040.00010.06080.00010.0001
2019AV90157.1BCD8.9ABCDEFG0.0A10.2BCDEFG2.2AB28.3CDEFGH26.1DEFGH
90306.1BCD3.1G0.0A2.8HIJ0.6B12.5GHIJ12.0GHI
1201511.2BCD3.9FG0.9A3.2GHIJ0.6B19.7FGHIJ19.2EFGHI
1203019.2AB12.7ABC1.0A13.4ABCD0.0B46.4ABC46.4ABC
BG901511.1BCD8.9ABCDEFG0.7A7.2CDEFGHIJ2.6AB30.5CDEFG28.0CDEFG
90306.8BCD3.6G0.9A1.8J0.8B13.9GHIJ13.1GHI
1201512.1BCD3.2G1.8A1.8J0.9B19.8FGHIJ19.0EFGHI
1203027.9A14.8A0.6A9.3BCDEFGHI0.5B53.0A52.5A
BO90157.1BCD7.5BCDEFG0.0A13.1ABCDE1.6AB29.4CDEFGH27.7DEFGH
90304.7D4.2FG0.0A5.3FGHIJ0.5B14.7GHIJ14.2FGHI
120158.8BCD4.5EFG0.5A6.2EFGHIJ0.7B20.6FGHIJ19.9EFGHI
1203018.7ABC11.5ABCD0.0A19.7A1.4AB51.3AB49.9AB
CR90152.0D6.3CDEFG0.4A10.1BCDEFG4.1A22.9EFGHIJ18.8EFGHI
90304.0D2.9G0.5A3.3GHIJ1.4AB12.0HIJ10.7GHI
1201510.4BCD4.1FG0.3A3.8GHIJ2.3AB20.9FGHIJ18.6EFGHI
1203013.9BCD11.8ABCD0.4A15.0AB1.2B42.3ABCD41.1ABCD
CV90153.2D8.6ABCDEFG0.0A13.8ABC1.8AB27.5DEFGHI25.6DEFGH
90303.9D2.9G0.2A2.3IJ0.6B9.8IJ9.2HI
120158.6BCD4.8EFG0.5A5.0FGHIJ0.0B18.9FGHIJ18.9EFGHI
1203011.5BCD12.8ABC0.0A15.2AB0.8B40.2ABCDE39.5ABCD
JP90154.7D6.9CDEFG1.5A6.7DEFGHIJ1.5AB21.4FGHIJ19.8EFGHI
90301.9D2.6G0.3A1.9J0.4B7.2J6.8I
120158.0BCD3.7FG2.6A3.3GHIJ0.3B17.9FGHIJ17.7EFGHI
1203013.0BCD11.0ABCDE1.2A9.4BCDEFGH1.4AB36.1ABCDEF34.6ABCDE
P1390158.5BCD9.2ABCDEFG0.6A9.3BCDEFGHI1.0B28.7CDEFGH27.7DEFGH
90305.3D3.4G1.2A3.4GHIJ0.0B13.3GHIJ13.3FGHI
120159.9BCD3.1G1.9A4.6FGHIJ0.9B20.4FGHIJ19.5EFGHI
1203012.2BCD14.0AB0.0A14.1ABC0.5B40.9ABCDE40.4ABCD
OR90159.1BCD10.4ABCDEF0.9A7.8CDEFGHIJ1.5AB29.6CDEFGH28.1CDEFG
90305.8CD2.9G0.3A3.0HIJ0.8B12.9GHIJ12.1GHI
1201511.6BCD5.8DEFG2.2A4.3FGHIJ0.7B24.6DEFGHIJ23.9DEFGHI
1203010.1BCD10.4ABCDEF0.0A11.4BCDEF1.2B33.0BCDEF31.8BCDEF
p > F0.1 0.41 0.84 0.02 0.96 0.19 0.2
Varieties are ‘Averre’ (AV), ‘Beauregard’ (BG), ‘Bonita’ (BO), ‘Carolina Ruby’ (CR), ‘Covington’ (CV), ‘Murasaki’ (MS), ‘NC413’ (413), ‘Orleans’ (OR), ‘Japanese’ (JP), and ‘NCP13-0030’ (P13). TY = total yield; MY = marketable yield; DAP = days after planting. A–N = Means within a column followed by the same letter are not significantly different at p < 0.05, according to Tukey’s HSD.
Publisher’s Note: MDPI stays neutral with regard to jurisdictional claims in published maps and institutional affiliations.

