1. Introduction
Many apple cultivars (
Malus domestica Borkh.) have anthocyanins in their skin where they are responsible for the red blush. Anthocyanins have antioxidant, anticancer and anti-aging properties and are believed to decrease the incidence of cardiovascular disease. They are therefore considered beneficial in the human diet [
1,
2]. In recent years, genotypes of apple have become available that also have anthocyanins in the flesh. This is unusual and novel. Red-fleshed apple cultivars are attractive to consumers due to their appearance and health-related benefits. A recent survey even established preference of Italian consumers for red-fleshed apples [
3].
The intensity of the red colour differs among the red flesh apple cultivars and also within a cultivar between seasons and sites. While the genetic basis of colour formation has largely been identified [
4,
5], the reason for the environmental variation is less clear. Only in recent years has research begun across the world on the effects of production factors on the redness of the red flesh apples [
6]. Such research requires accurate and reproducible assessment of colour intensity and/or anthocyanin content. For breeders, it is particularly important that these assessments are reproducible from site to site, region to region and continent to continent.
Classical analysis and quantification of anthocyanin are laboratory-based. The protocol involves multiple steps: extraction, then dilution and finally quantification—often using a spectrophotometer [
6,
7,
8,
9]. Recently, we introduced a procedure that predicted anthocyanin content based on colour assessment by digital photography and image analysis [
6]. Digital images were calibrated using RSH colour charts and a calibration curve. The calibration curve described the relationship between the L-value, as quantified in the L*a*b* colour space using a hand-held spectrophotometer, and the anthocyanin absorbance of the flesh extract. This relationship accounted for more than 98% of the variation in anthocyanin content. The procedure proved to be a precise and rapid method for quantifying the redness of the flesh of apples that did not require a laboratory or a spectrophotometer. Furthermore, the images may be taken in one region and easily emailed for remote analysis in another region. However, some limitations still apply. These include (1) the requirement for photography under standardised conditions, i.e., a studio equipped with photo stand, light sources and dark room, and (2) the need to define colour thresholds during image analysis to quantify different intensities of redness. In addition, it is not known whether the procedure we developed using two red flesh apple genotypes also works for other red fleshed genotypes grown under a range of orchard conditions (site, season, etc.).
The objectives of this study were to refine the procedure and so to establish a robust protocol that allows accurate and reproducible quantification of flesh anthocyanin content based on digital photography. For this purpose, selections of red-fleshed apples were chosen that covered a broad range of anthocyanin content. ‘Golden Delicious’ was included to extend the range of fruit to those genotypes and growing conditions where little or no anthocyanin is synthesised.
2. Materials and Methods
2.1. Plant Material
Mature fruit of the red-fleshed apple (Malus domestica Borkh.) selections Y101, Y102, Y103, R201, R202, R204 (IFORED SAS, Seiches-sur-le-Loire, France) and B3F103 (Better3fruit; Rillar, Belgium) from trees grafted on M9 were obtained from the Elbe-Obst Erzeugerorganisation, Apensen, Germany. Fruit of these selections are marketed under the label Kissabel®. ‘Golden Delicious‘ fruit was purchased locally. All fruit were held in a cold room pending analysis (2 ± 1 °C).
2.2. Sample Preparation
‘Flesh cylinders’ (a cork borer, 12 mm diameter, 25 mm long) and ‘flesh discs’ (a sharp blade, 5 mm thick slices through the whole fruit) were taken from the equatorial plane of the fruit. Care was taken to select cylinders that were of uniform colour. The core tissues were removed from the flesh discs. The cylinders and discs were either scanned or photographed as described below (see
Section 2.3). Thereafter, the skin was removed from the cylinders and discs using a razor blade. The flesh discs were then cut radially into 12 wedges of approximately equal size.
2.3. Extraction and Anthocyanin Quantification
Anthocyanins were extracted from cylinders and wedges in a methanol:conc. HCl (99:1 v/v) mixture for 12 h at 22 °C on a shaker. Extraction volumes were 8 mL per cylinder and 150 mL per 12 wedges of a single disc. Larger volumes (12 mL and 250 mL) were used for deeply coloured fruit. The extracts were filtered (Whatman® grade 1; Cytiva Europe; Freiburg, Germany) and absorption was measured at 530 nm using a spectrophotometer (Specord 210; Analytik Jena, Jena, Germany). Solutions were diluted as necessary when absorbance exceeded a value of 1.
2.4. Preparation of Images for Scanning and Photography
Digital images of flesh cylinders and flesh discs were obtained using three different methods.
First, images were obtained using a standard flatbed scanner (Epson Perfection 3200 Photo, Model G80B; Epson Deutschland, Meerbusch, Germany) (‘Scan’). Precautions were taken to avoid stray light. The lid of the scanner was covered using black fibreboard, and the scanner window was covered using black cotton cloth. All scanner settings were adjusted to their defaults, automatic corrections were disabled.
Second, images were taken in the studio by photography using a camera (Canon EOS 550 D, Macro lens EF-S 18–55 mm; Canon, Tokyo, Japan) mounted on a photo stand (RB 5000 DL, No. 5556 + Prolite 5000, No. 2190; Kaiser Phototechnik, Buchen, Germany) (‘Studio’). The photo stand was equipped with three fluorescent tubes (Osram TC-L, code 954, 5400 K; Osram, Munich, Germany). The camera settings were flashlight disabled, autofocus enabled, exposure time, aperture and white balance all set by the camera unless specified otherwise, iso set at 400. The focal length was ~24 mm. The flesh discs were placed on a light box underneath the photo stand. Care was taken to avoid shade.
Third, for some studies, photographs were taken outdoors without a photo stand and under varying daylight conditions (‘Outdoor’).
A colour checker (ColorChecker Classic; Pantone-X-Rite, Grand Rapids, MI, USA) was included as a reference in all scans and photographs taken in the studio or outdoors.
2.5. Image Analysis and Processing of Colour Data
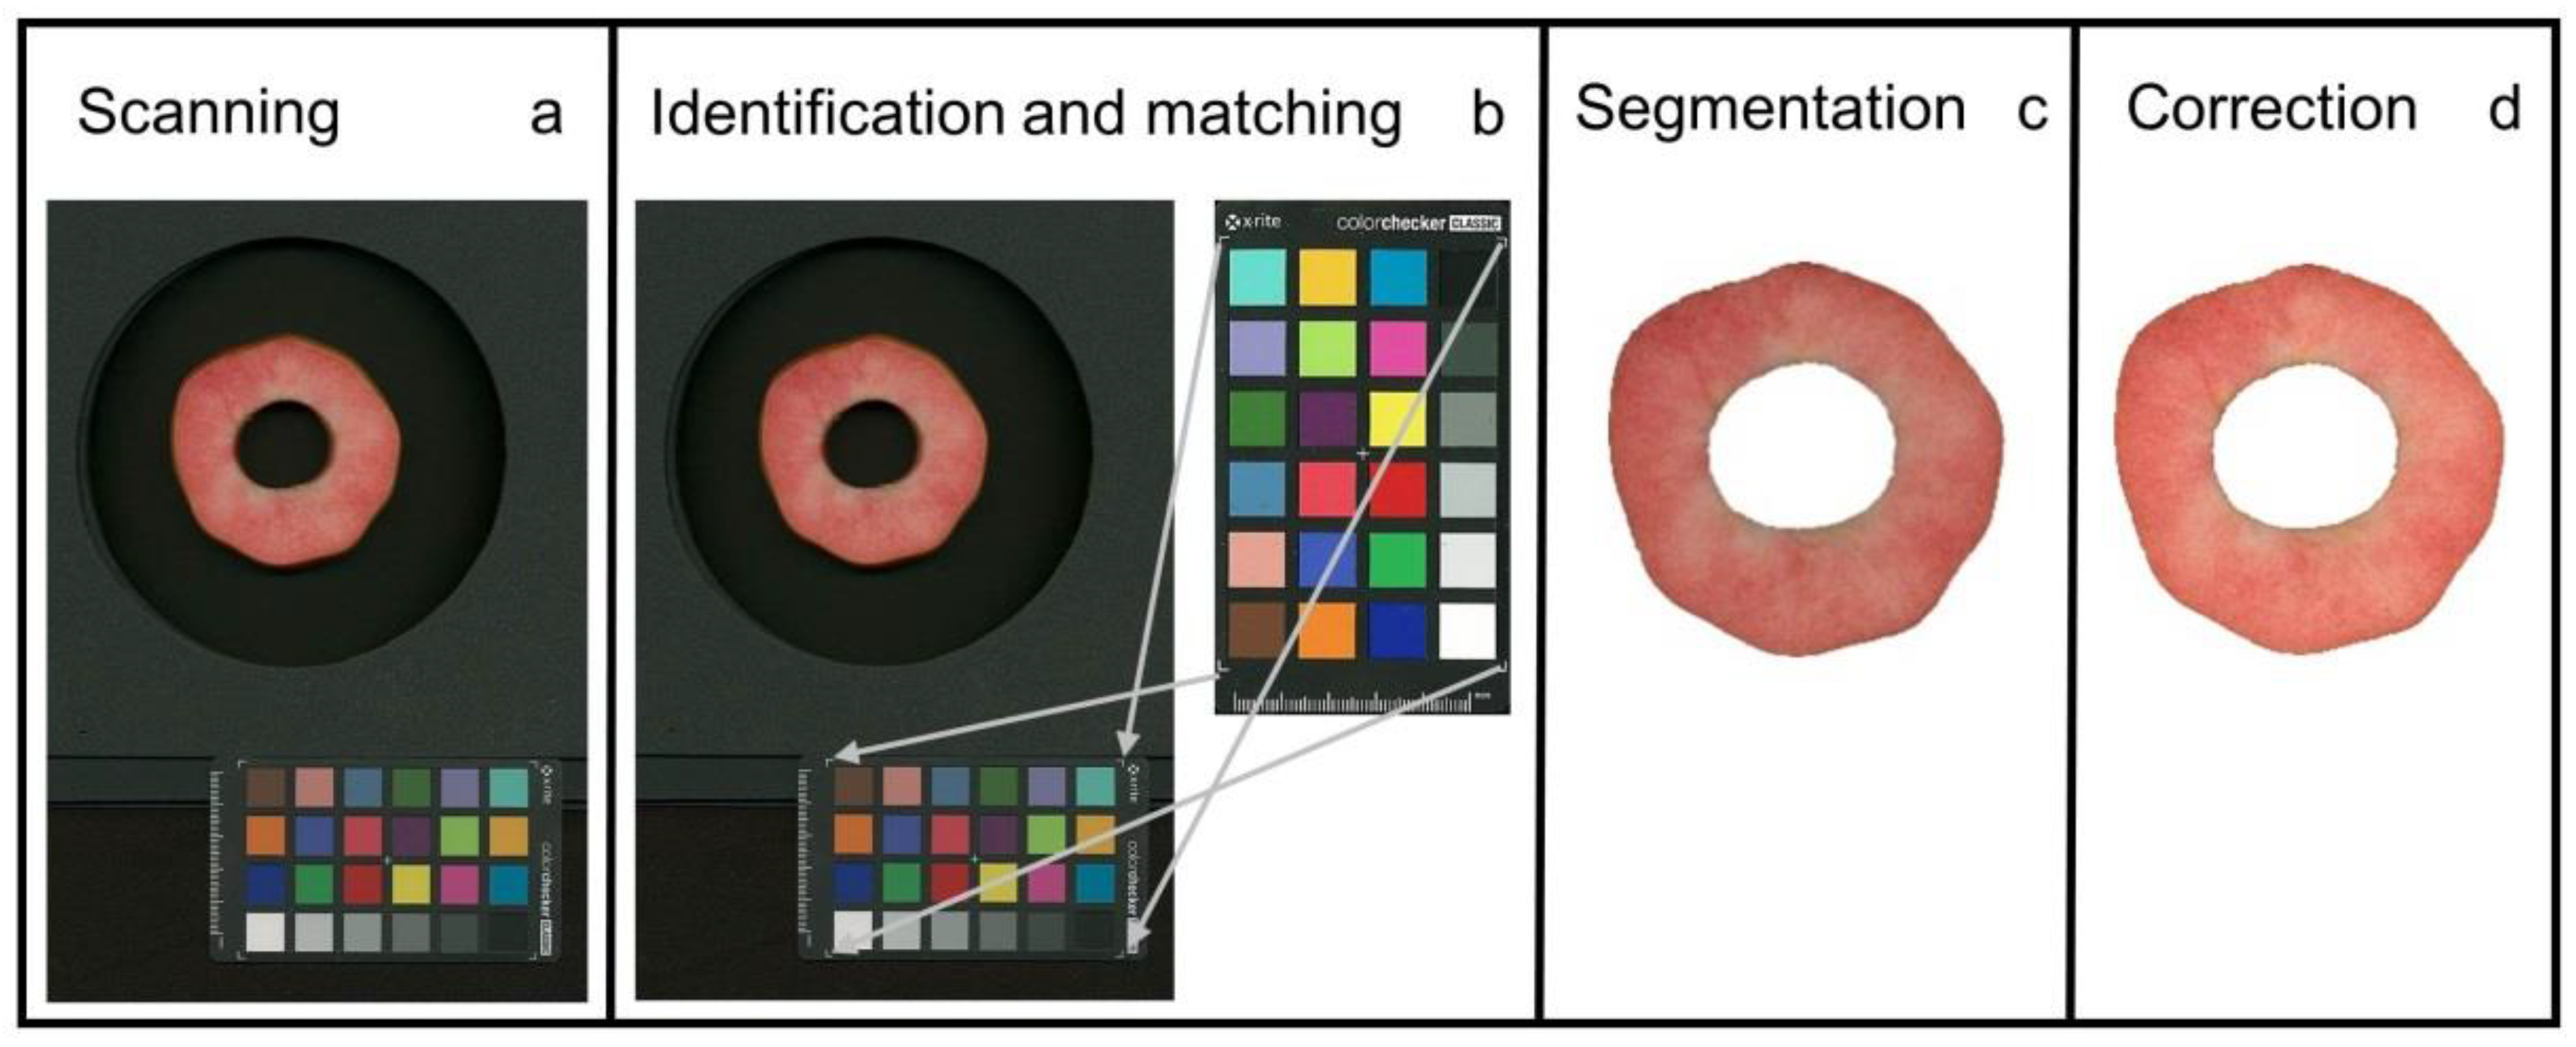
Image analysis comprised the following steps: (1) identification of flesh disc and colour checker and (
Figure 1a,b), (2) removal of the background (segmentation) (
Figure 1c) and (3) colour correction using the colour checker (
Figure 1d), and (4) translation of colour parameter(s) into anthocyanin content on a pixel-by-pixel basis.
First, we established a procedure for automatic identification and extraction of the apple disc and the colour checker from the image. The method in [
10] was used based on machine learning. We trained the algorithm on apple flesh discs. Preliminary attempts using thresholding and morphological image processing and the OpenCV software [
11] worked well for scanning under standardised light conditions but not under the variable daylight conditions for outdoor photography (Kuhnke, unpublished data). Using the OpenCV software, the colours of the colour checker were identified and extracted.
Second, the colours of the apple discs were corrected using the extracted colours of the colour checker and the Colour 0.3.15 software [
12]. This software package provides a comprehensive range of algorithms commonly used in colour science [
12]. These algorithms were used to correct the sRGB (RGB) values of original images. Because the RGB values are gamma-compressed, a second data set was created on gamma-expanded linear-light values (LLV) [
13]. The following corrections were applied to the RGB and the LLV values of all images: a third-order polynomial for Cheung corrections (‘Cheung (3, LLV)’, ‘Cheung (3, RGB)’) [
14], a second-order polynomial for Finlayson corrections (‘Finlayson (2, LLV)’, ‘Finlayson (2, RGB)’) [
15] and a first-order equation for Vandermonde corrections (‘Vandermonde (1, RGB)’) [
12]. The higher-order polynomials tended to yield artefacts. For representative examples of effects of colour corrections see
Figure S1. Following colour correction, the RGB values were also converted into the CIE L*a*b colour space (using the OpenCV software [
12]) so that a total of six colour channels R,G,B and L*, a*, b* were examined in our experiments. The conversion of RGB values into the CIE L*a*b colour space was preferred over direct measurement of L*a*b using a colorimeter because (1) commercial colorimeters only have a small measurement window, (2) flatbed scanners and cameras only produce RGB values and (3) colorimeters are expensive compared to a flatbed scanner or camera.
Third, the logarithm of the corrected colour parameters was linearly related to the absorbance of the apple tissue extracts. A linear regression then allowed the log-transformed colour parameters (
with log
= log G or log B or log L*) to be converted into the absorbance of an anthocyanin extract (
) of apple tissue on a pixel-by-pixel basis (for the equation used see
Table 1 and Figure 3). The anthocyanin content (
) of the flesh cylinder was calculated as the mean of the
pixels. The coefficients of this linear regression equation (slope term
, intercept term
) were established using a series of flesh cylinders selected for homogeneity of colour. The colour parameters and the anthocyanin contents were then determined. For the flesh discs that represented the entire cross section of the fruit and consequently were less homogenous in colour as compared to the cylinders, a weighted average of the anthocyanin contents was then calculated. The relationship established using the homogeneous cylinders served as a ‘calibration line’ for the conversion of the colour information for anyone pixel of the flesh discs. The model was
2.6. Data Analysis
Data symbols in figures represent images obtained by scanning or photography of cylinders or discs from individual fruit. Regression analyses were conducted using the statistical software package SAS (Version 9.1.3; SAS Institute, Cary, NC, USA). Figures were prepared using the graphics software package SigmaPlot 12.5 (Systat, Erkrath, Germany).
3. Results and Discussion
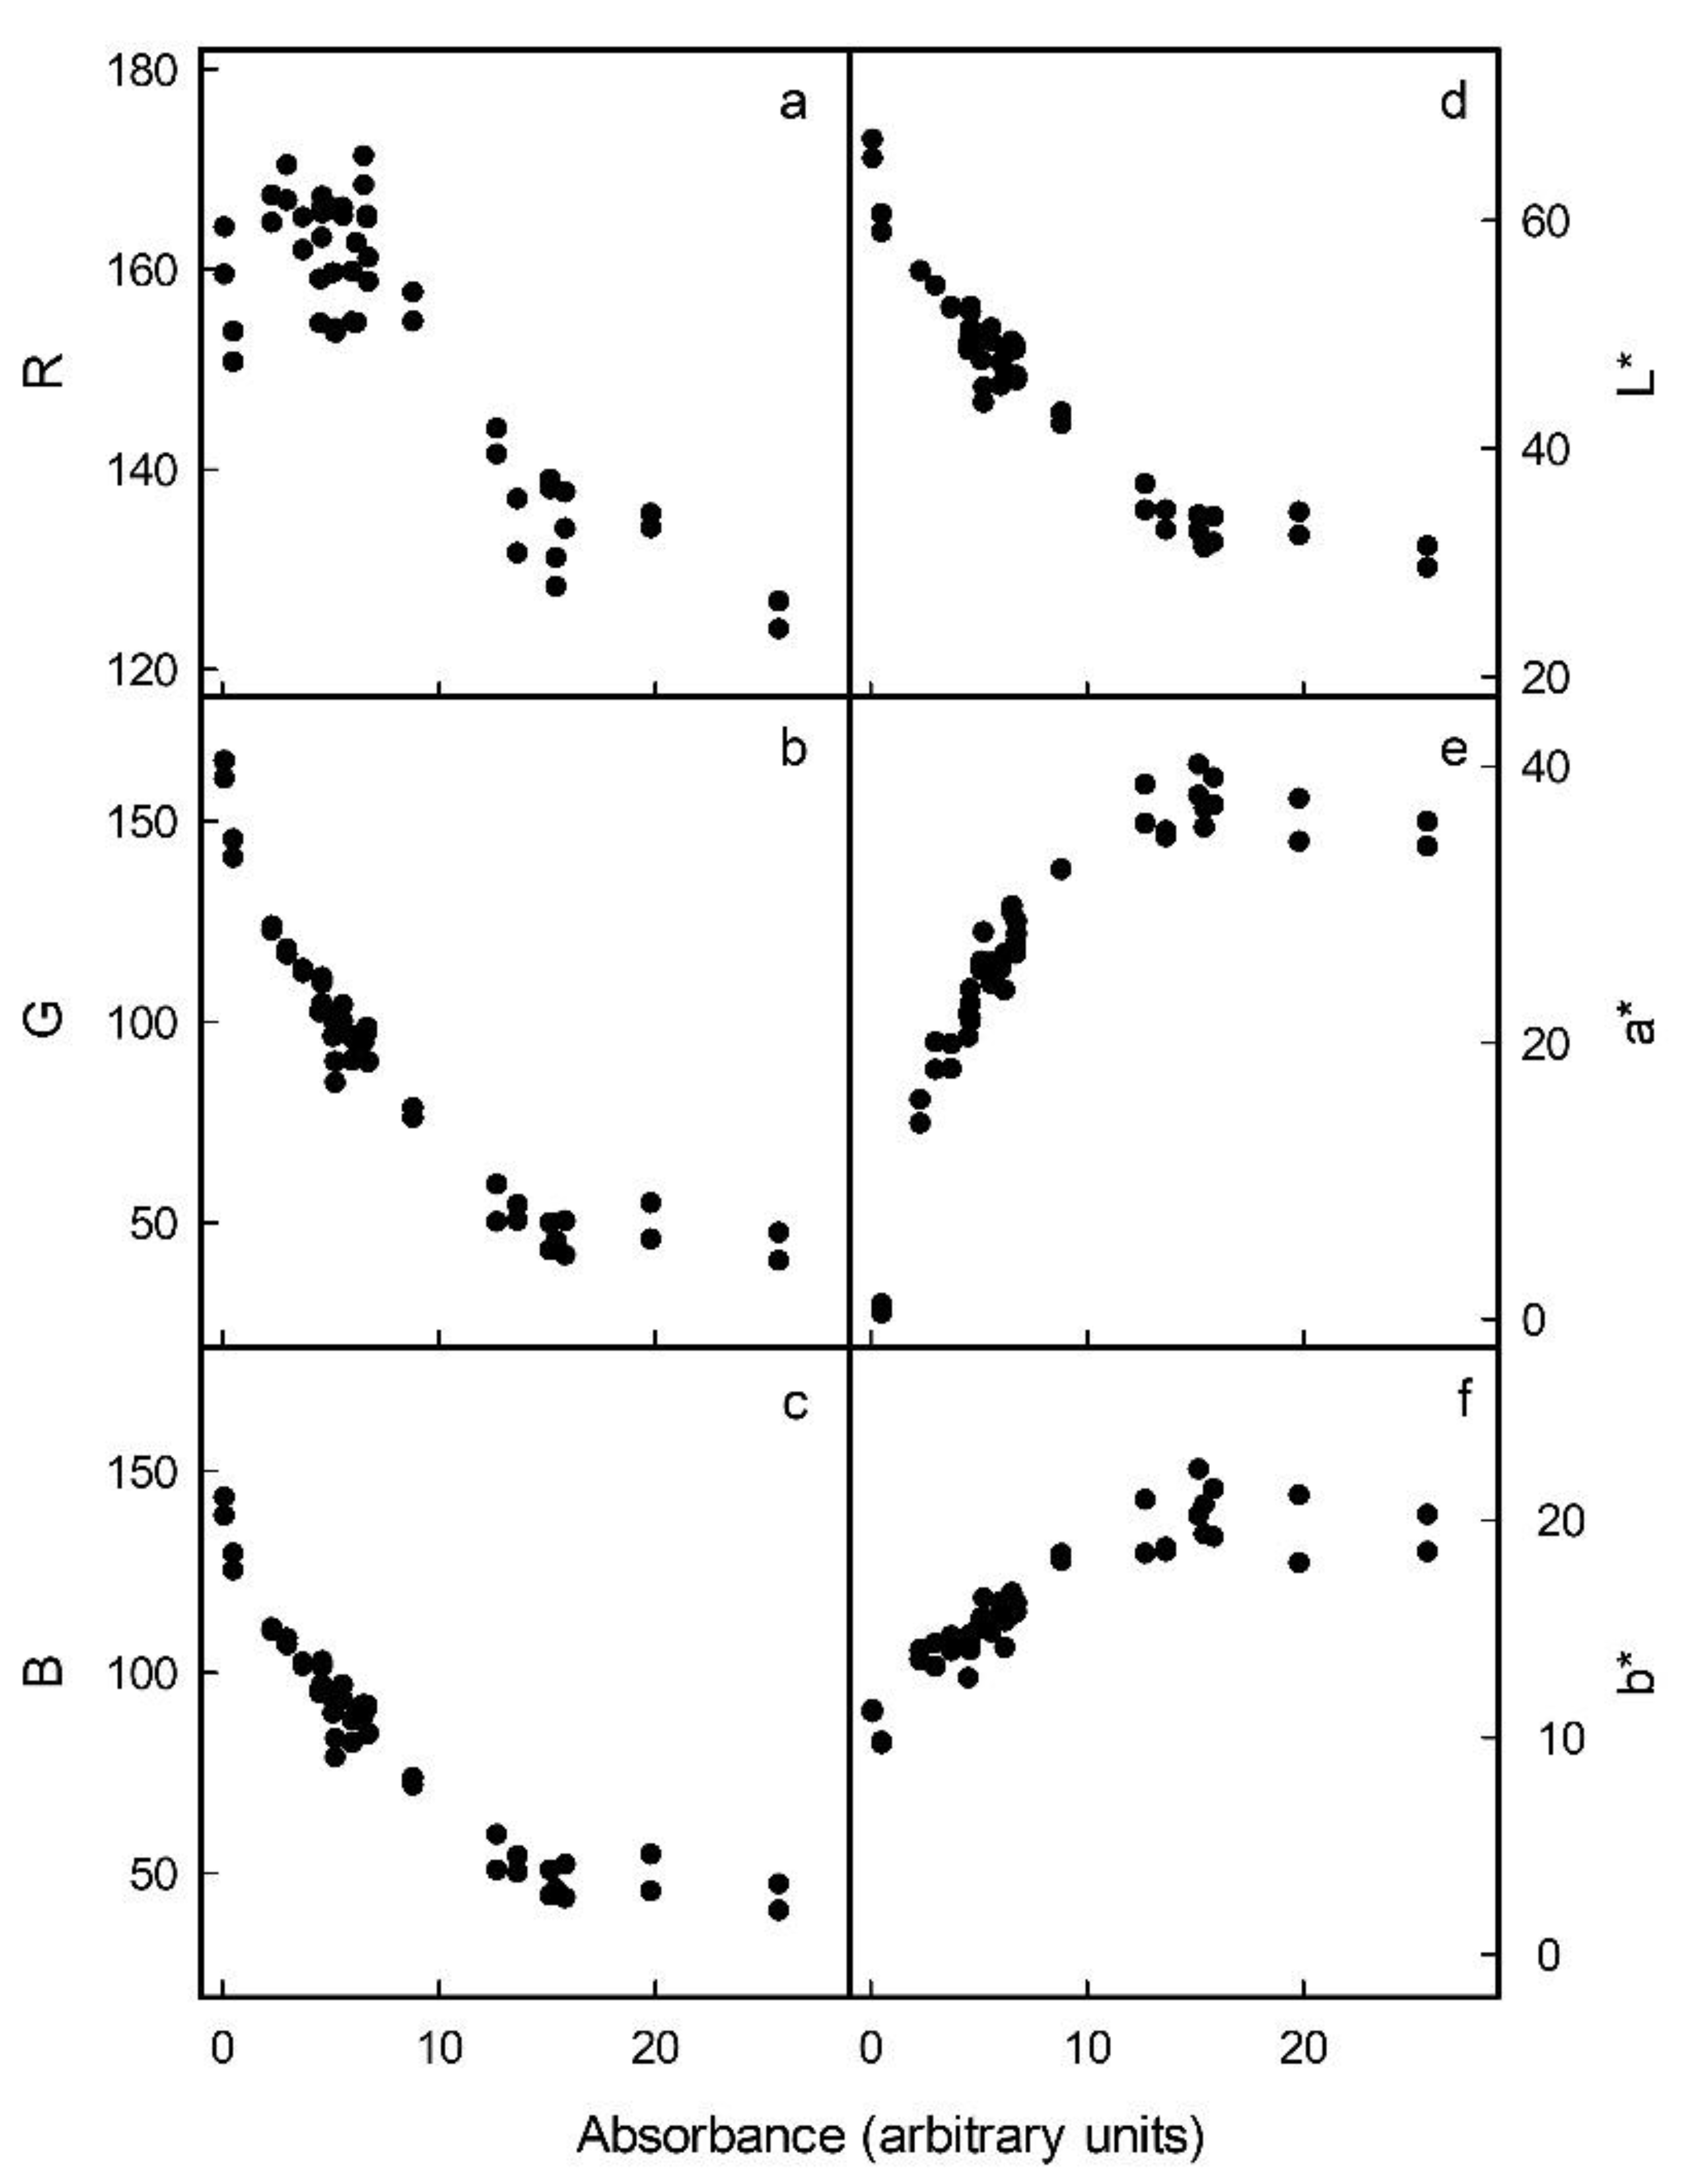
Increases in the anthocyanin concentrations of flesh cylinders excised from the different apple cultivars were correlated with decreases in R, G and B in the RGB colour space (
Figure 2a–c). In the L*a*b* colour space, the L* of the flesh cylinders decreased, whereas a* and b* increased and levelled off or even decreased slightly at anthocyanin concentrations exceeding 15 arbitrary units (
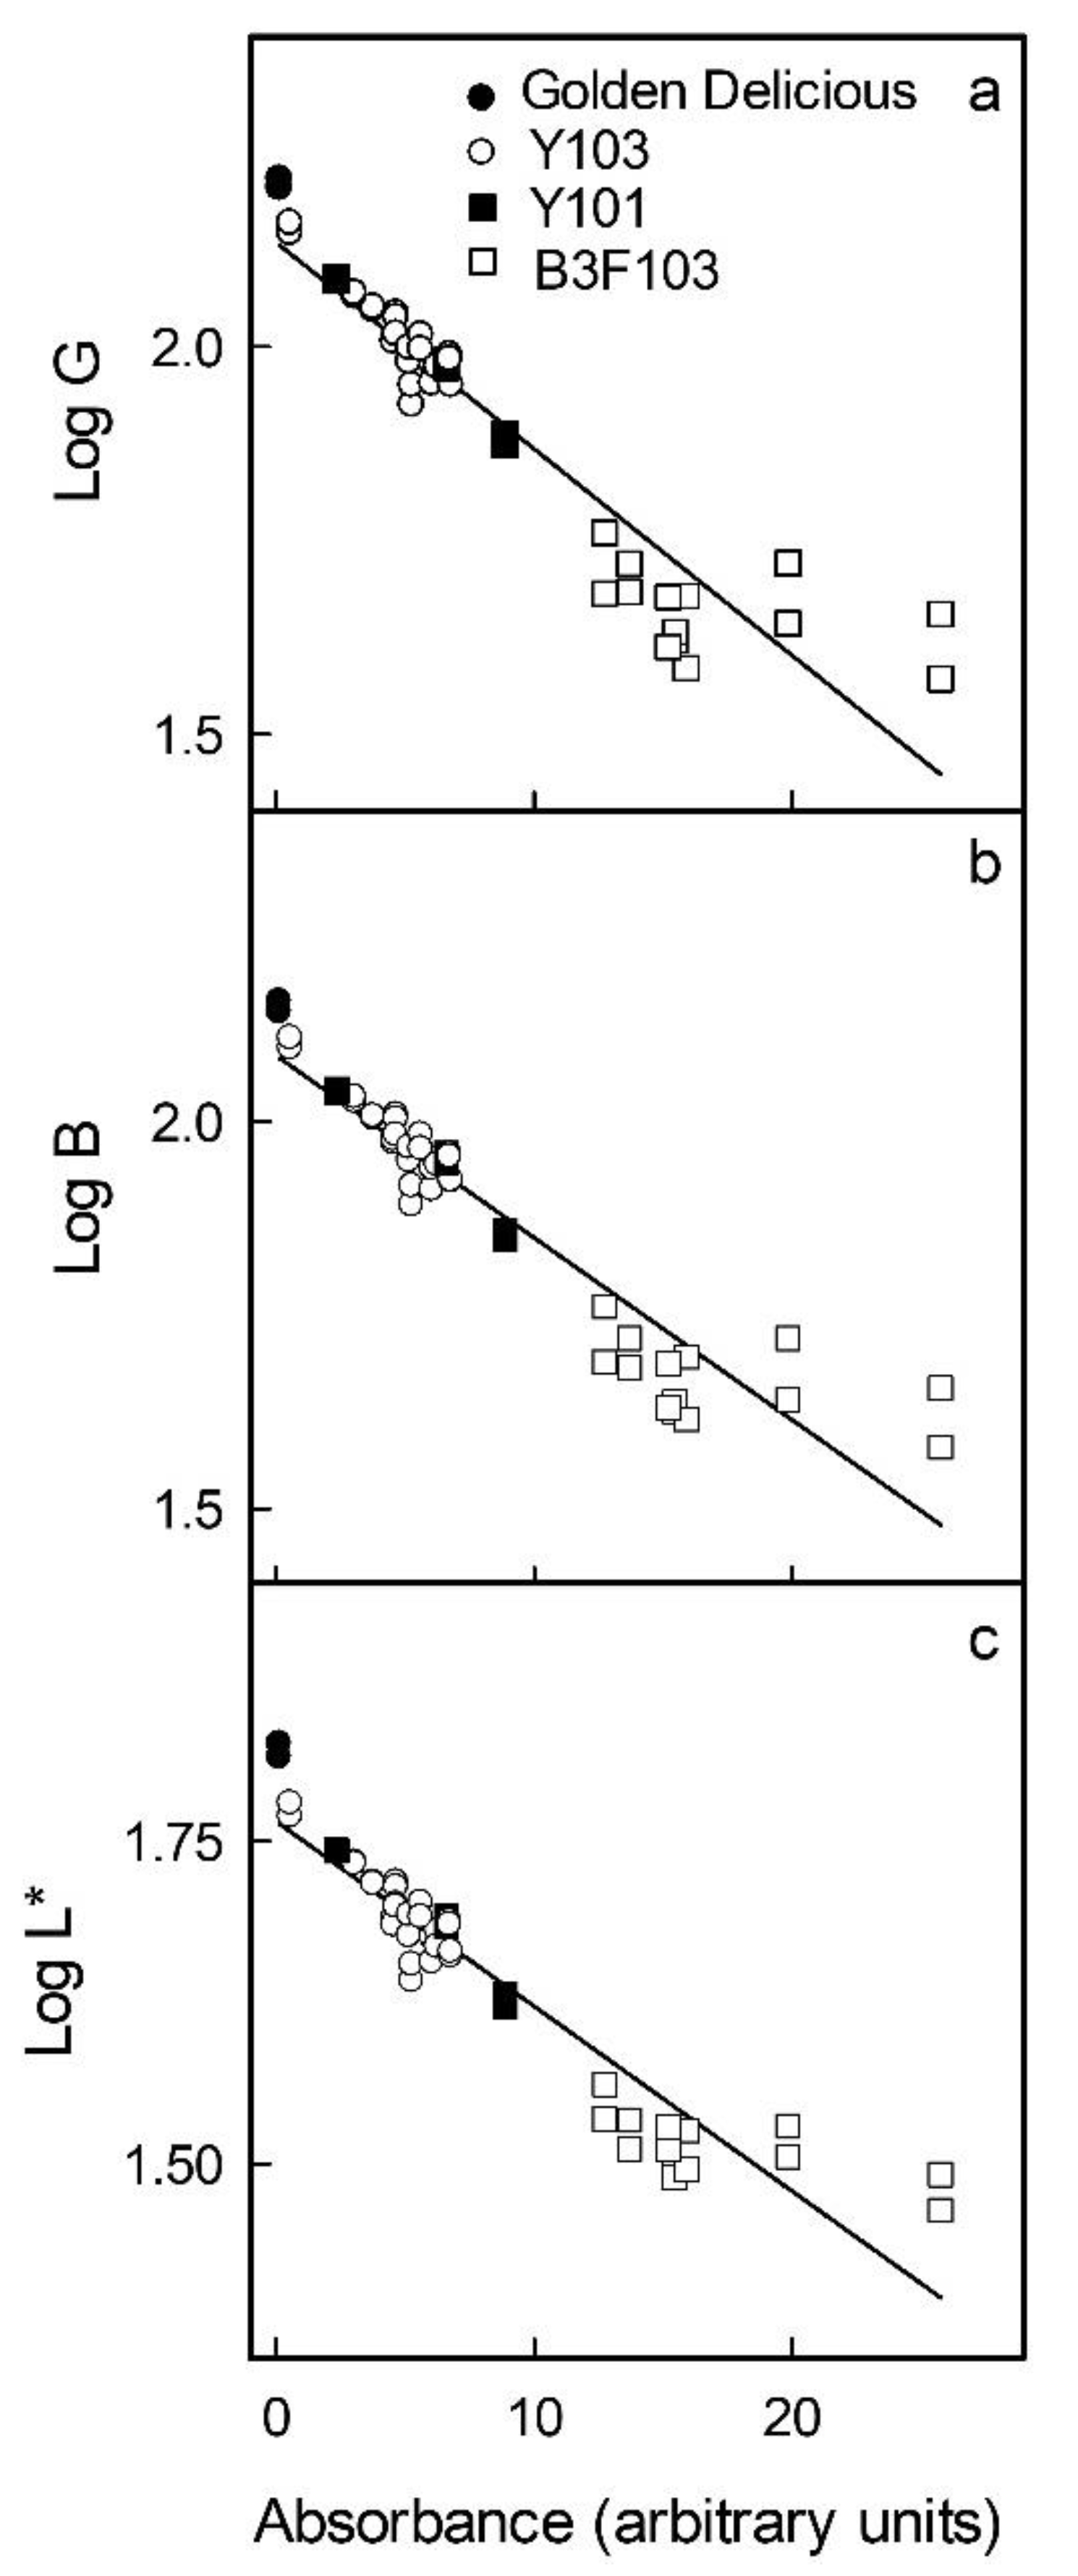
Figure 2d–f). Based on these relationships, the parameters G and B of the RGB and L* of the L*a*b* colour space were selected, as these changed monotonically with increasing anthocyanin concentration. The logarithms of G, B and L* were all linearly and highly significantly related to the absorbance of a flesh extract and, thus, to the anthocyanin content (
Figure 3). The coefficients of determination of the linear regression equations ranged from r
2 = 0.88 *** to r
2 = 0.89 *** (
Table 1). Data obtained using selections of red flesh apples differing widely in colour intensity and anthocyanin content all followed the same relationship. Using these relationships, it was then possible to predict the absorbance of flesh extracts and, thus, the anthocyanin content based on flesh colour.
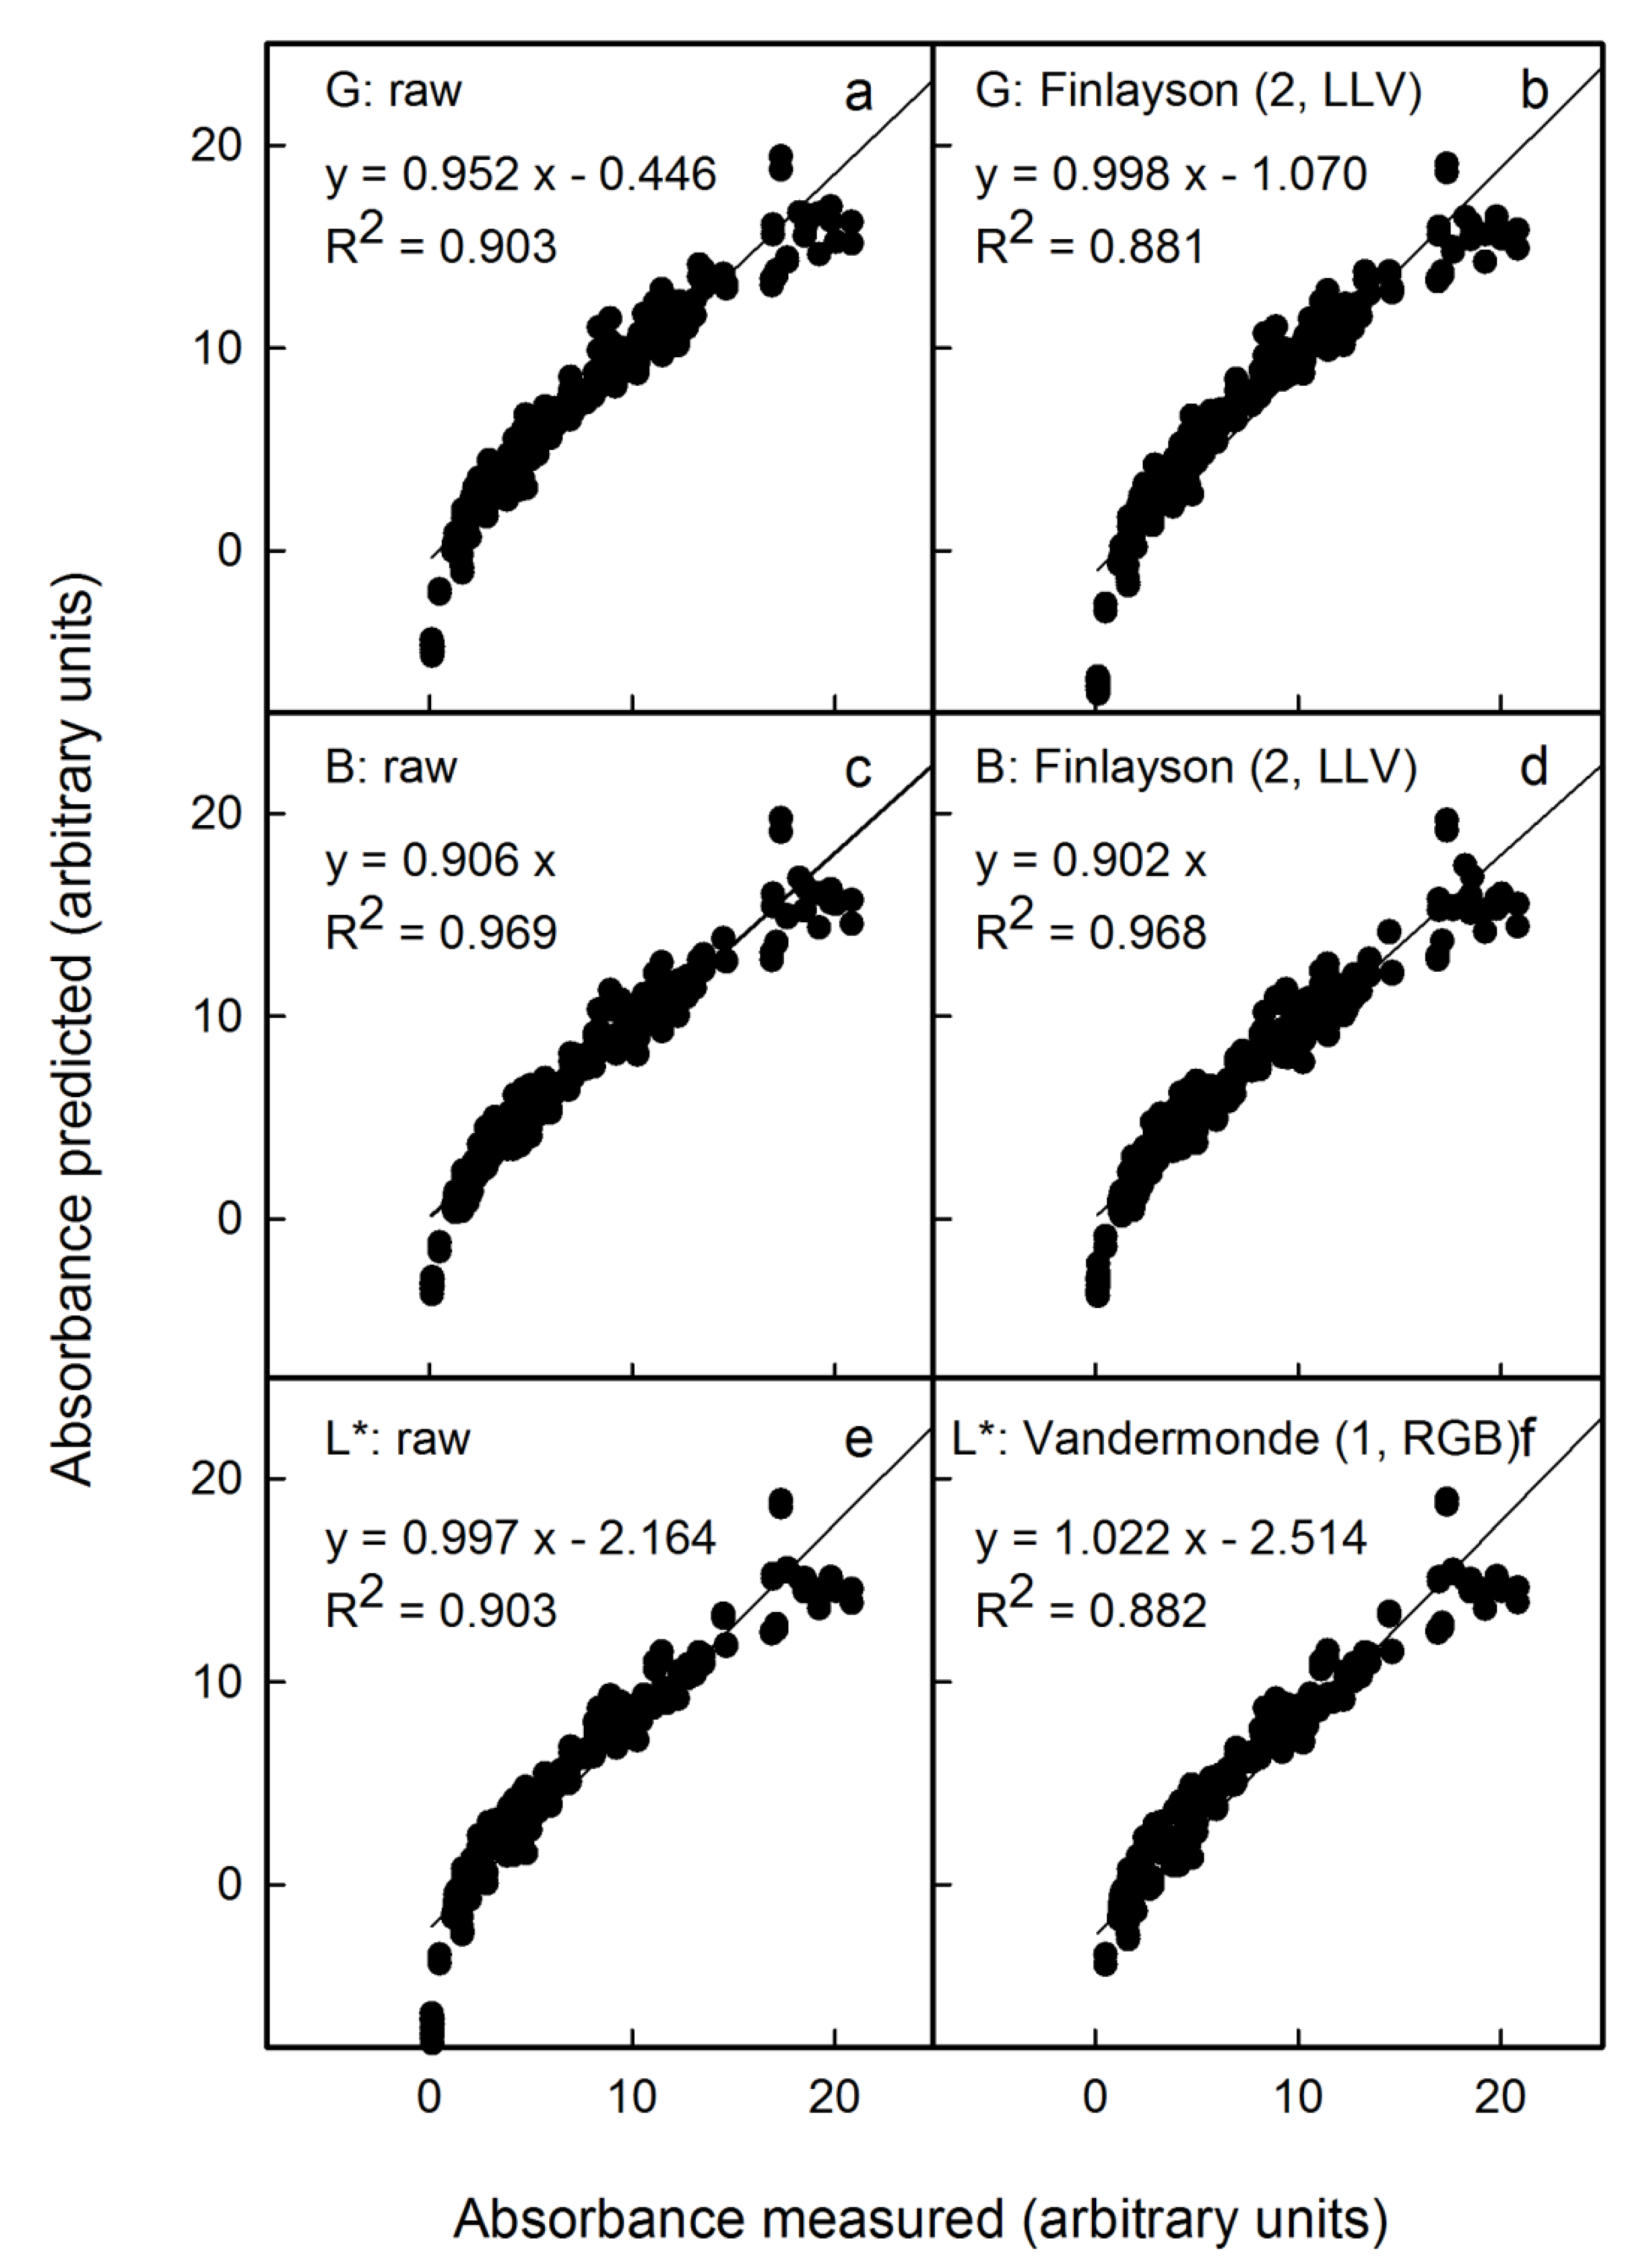
The above results were obtained on scans of flesh cylinders that were of uniform colour. The question arises as to whether the anthocyanin content can be predicted with reasonable accuracy from scans and photographs of an entire flesh disc prepared by cross-sectioning a whole fruit. Compared with a flesh cylinder, a flesh disc is less homogeneous in colour. The photographs were taken in the studio under standardised conditions and also under non-standardised conditions outdoors. Under the latter, light conditions and the distance between the camera and the flesh disc varied. The colour of the image had to be corrected using the standard reference colour checker included in all images. Selected examples of the results of colour correction are shown in
Figure 4 for scans, in
Figure 5 for photographs taken in the studio (with and without automatic corrections for exposure time by the camera) and in
Figure 6 for photographs taken outdoors.
Figure 3.
Relationship between colour as assessed by the G (
a) and B (
b) parameters in the RGB and by the L* parameter (
c) in the CI.E L*a*b* colour space and the logarithm of the absorbance of anthocyanin extracts obtained from homogenous flesh cylinders of apple clones differing in redness of the flesh. The logarithm was used to linearise the relationship between the anthocyanin content and the colour parameter. For regression equations see
Table 1.
To be effective, corrections should meet the following requirements: (1) the slope of a plot of calculated vs. measured anthocyanin content as indexed by the absorbance of flesh extracts must be close to 1, (2) the
x-axis intercept should not differ significantly from zero and (3) the coefficient of determination (r
2) should be close to 1. Across all conditions, Finlayson (2, LLV) was an effective correction for the G and B parameters of the RGB colour space and Vandermonde (1, RGB) for the L* parameter of the L*a*b* colour space. All other corrections were generally inferior. For a comprehensive comparison, the reader is referred to the supplemental tables for scans (
Table S1), for photography in the studio (
Table S2) or for photography outdoors (
Table S3). In general, colour correction had little effect within any one light regime, provided the variability between different images was not extreme. For example, there was little change when correcting images obtained by scanning (
Figure 4) or by outdoor photography (
Figure 6). However, the variability was larger, for example, when images were obtained without or with automatic correction of the exposure time by the camera in the studio. Here, corrections were highly effective and definitely required (
Figure 5).
Table 1.
Relationship between the logarithm of colour parameters (
) as assessed by the mean G (
= G) and mean B (
= B) in the RGB and by the mean L* (
= L*) in the CIE L*a*b* colour spaces and the absorbance of anthocyanin extracts (
y) obtained from
homogeneous flesh cylinders. Cylinders were excised from the flesh of a range of apple cultivars using a biopsy punch. The regression model used was
. For plots see
Figure 3.
| Independent Variable | Regression Parameters | R2 |
|---|
| | | | |
|---|
| Log G | −0.027 ± 0.001 | 2.135 ± 0.015 | 0.881 *** |
| Log B | −0.024 ± 0.001 | 2.085 ± 0.013 | 0.886 *** |
| Log L* | −0.014 ± 0.001 | 1.765 ± 0.008 | 0.889 *** |
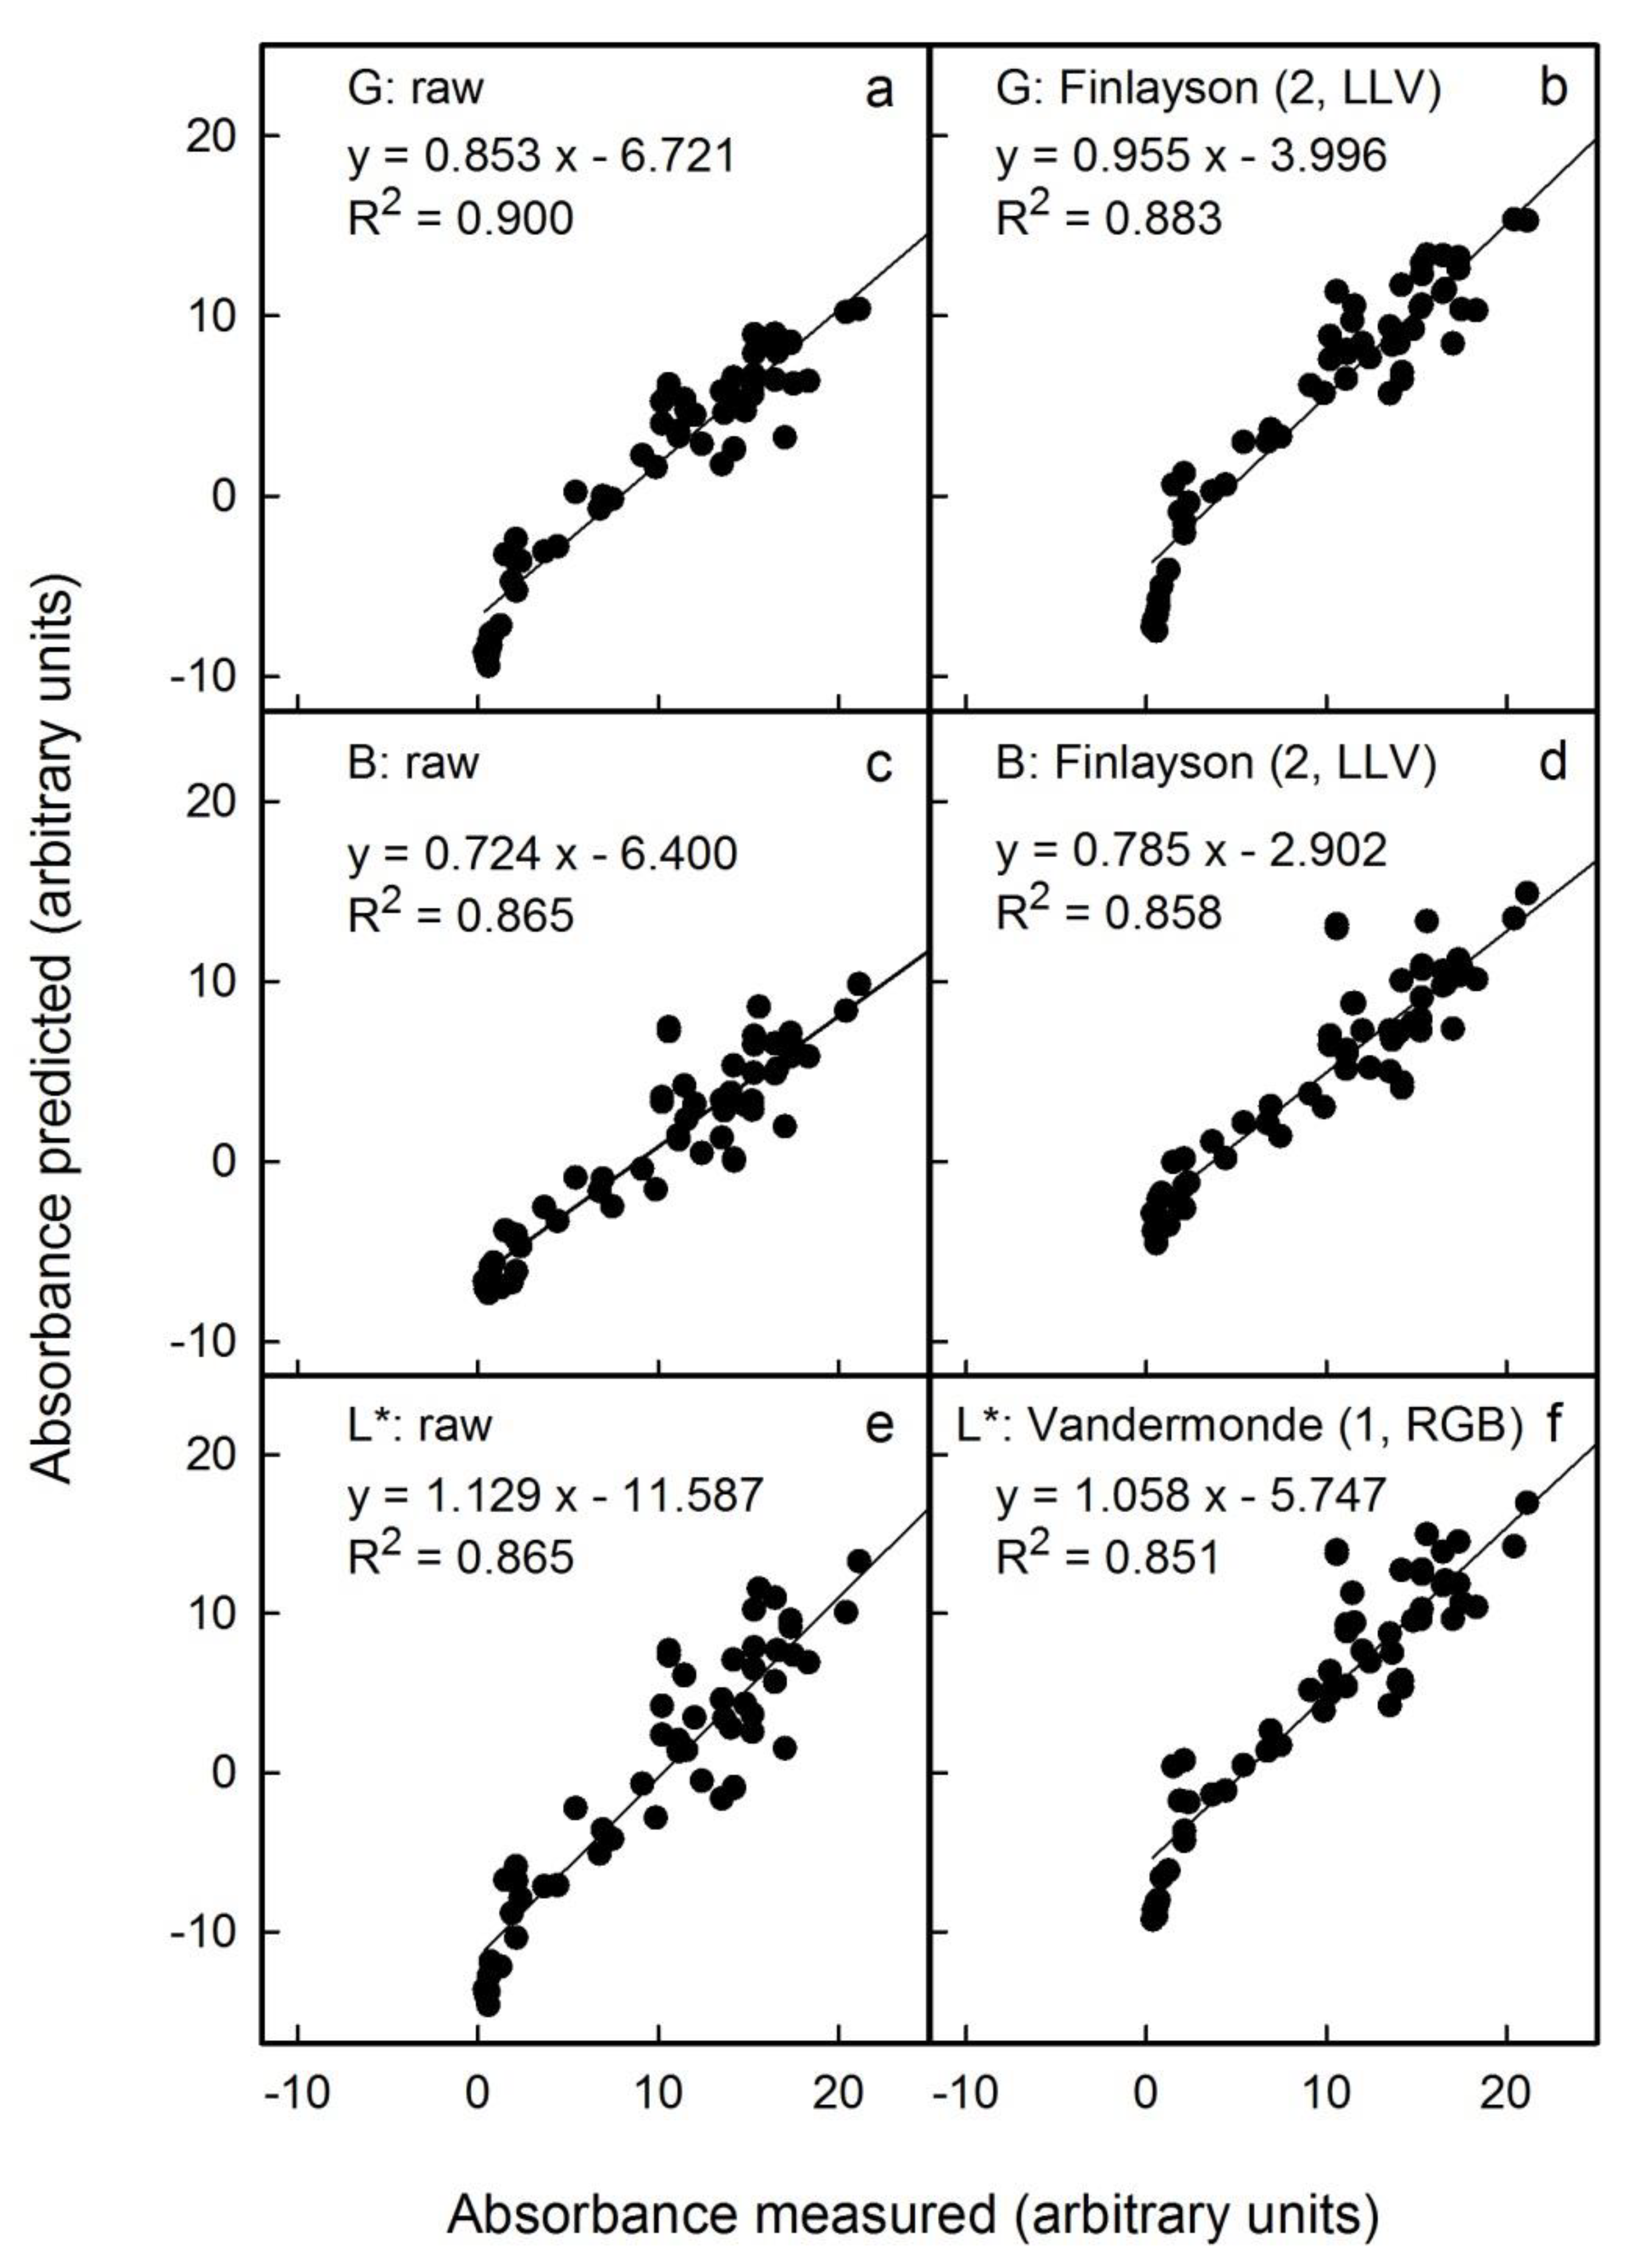
Among the three different sources of images studied, scanning flesh discs and applying the Finlayson (2, LLV) correction to the G channel of the RGB colour space was the most effective method (
Figure 4b). This procedure estimated anthocyanin content precisely. The mean deviation of the slope of a plot of predicted vs. measured anthocyanin was 0% (±2%). The detection limit, as estimated from the intercept term, was 1.2 (
Table S1). The G channel combined with a correction using the Finlayson (2, LLV) algorithm was also best for studio and outdoor photography (
Tables S2 and S3). The predicted anthocyanin content was slightly underestimated (studio: −2 ± 5%; outdoor: −4 ± 5% as estimated from the slope term) and the limit of detection increased to 4.6 units (as estimated from the intercept term) for both methods (
Tables S2 and S3).
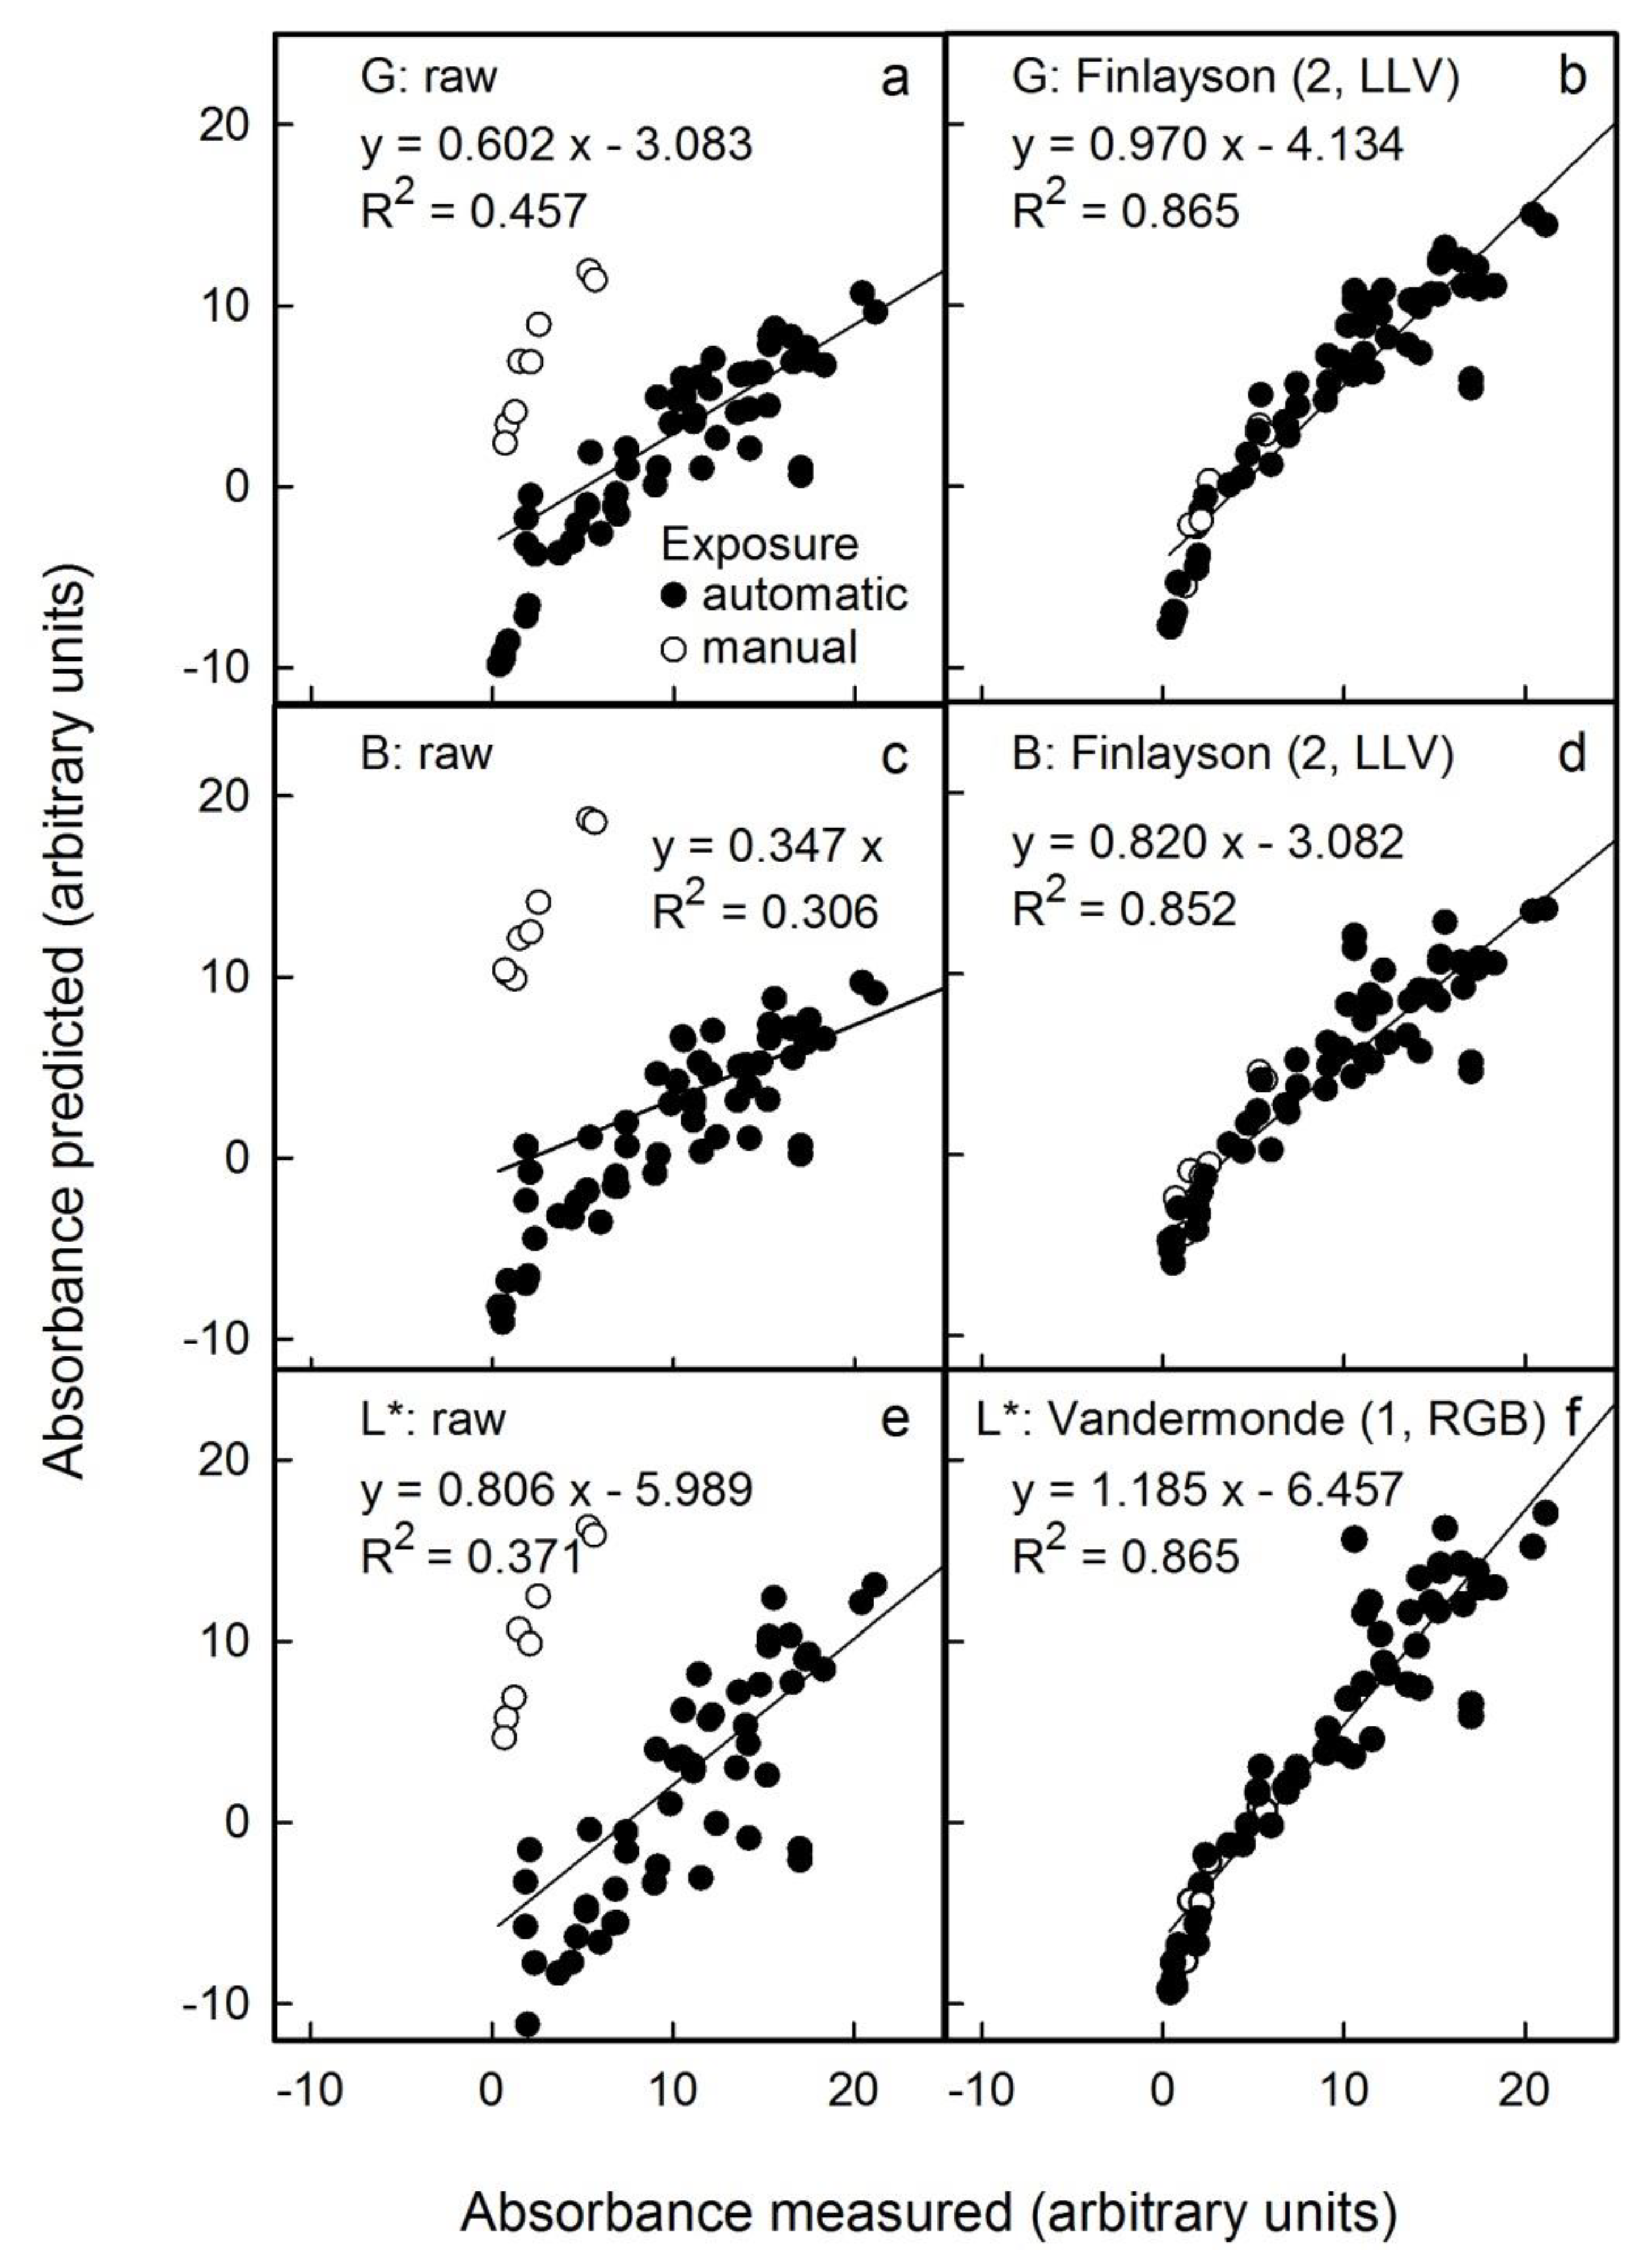
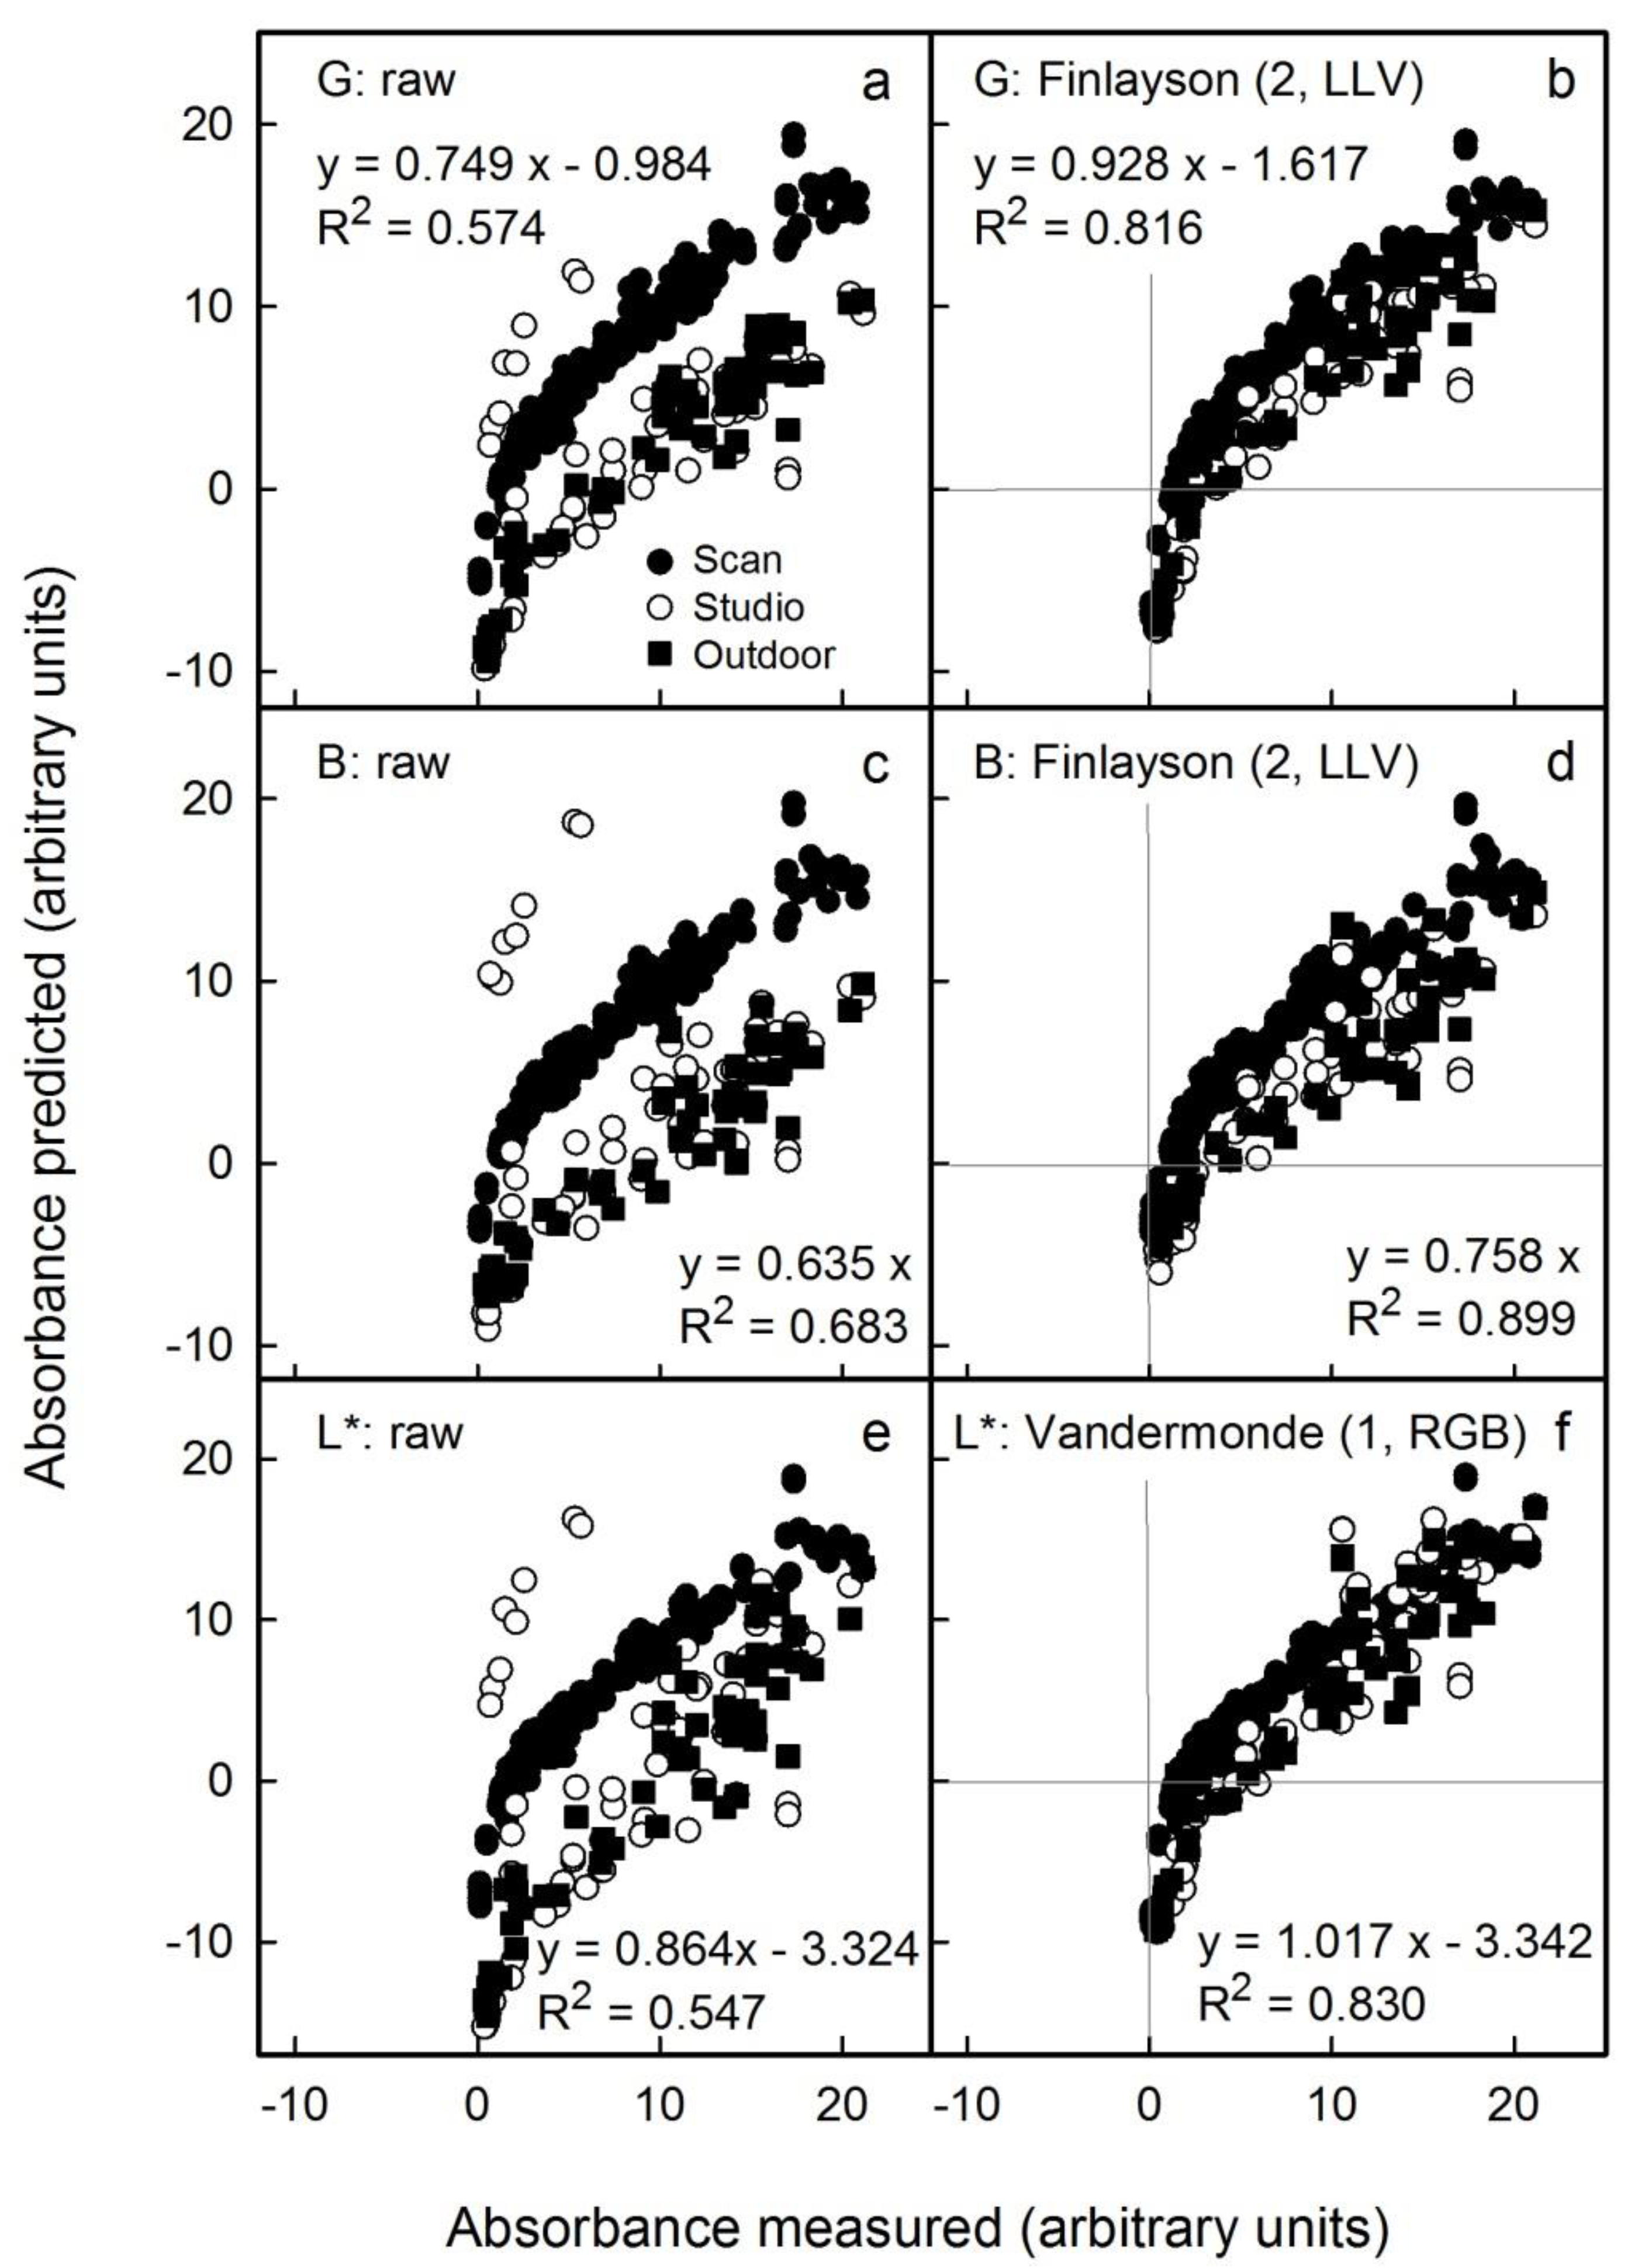
We also mimicked variable conditions for imaging by pooling results from all images to create a single data set (i.e., images obtained by scanning and by photography, both in the studio and outdoors). Under these conditions, the non-corrected results revealed systematic differences between the different sources in the relationships between predicted and measured anthocyanin content (
Figure 7a,c,e). However, after applying the appropriate colour corrections, all results displayed a common relationship (
Figure 7b,d,f). For non-standardised conditions and images obtained from these mixed sources, the L* parameter corrected using the Vandermonde (1, RGB) algorithm yielded the lowest error (
Figure 7f). Using this procedure, the anthocyanin concentration would be overestimated on average by 2 ± 2% (as estimated from the slope term;
Table S4), and the detection limit as estimated from the intercept term was overestimated by 3.7 units (
Table S4). In contrast, predictions using the G channel corrected using the Finlayson (2, LLV) algorithm underestimated the anthocyanin content on average by 7 ± 2% (estimated from the slope term). Therefore, the L* parameter corrected using the Vandermonde (1, RGB) algorithm was the most suitable method for high anthocyanin contents. The G channel corrected using the Finlayson (2, LLV) algorithm would be an alternative, particularly for fruit samples having lower anthocyanin contents.
4. Conclusions
Our results demonstrate that the anthocyanin content of red flesh apple discs can be accurately predicted from digital images of scans or photographs. Inclusion of a colour checker chart as a reference and appropriate algorithms for colour corrections ensures that images can be analysed and the anthocyanin contents predicted with high accuracy. If available, scanning flesh discs using a standard flatbed scanner is the method of choice, as light conditions are perfectly standardised. Here, the G channel of the RGB colour space corrected using the Finlayson algorithm (2, LLV) is the method of choice. For images taken under variable non-standardised light conditions, there are two options: (1) The anthocyanin content is predicted either from the G parameter of the RGB colour space corrected using the Finlayson (2, LLV) algorithm or (2) from the L* parameter of the L*a*b* colour space followed by a colour correction using the Vandermonde (1, RGB) algorithm. The colour information so obtained is then transformed into an anthocyanin content on a pixel-by-pixel basis, thereby producing a weighted average for the entire cross section of a red flesh apple fruit. Randomisation of samples during scanning or photography helps ensure the absence of systematic variation.
The procedure developed here has several logistical advantages. First, images taken in one region or on one continent can easily be emailed round the world for remote analysis of anthocyanin content. This allows comparisons to be made round the world without physical transport of samples. Second, once calibrated, the procedure requires no laboratory, no special/expensive equipment and no chemicals (e.g., solvents). A flatbed scanner, a colour chart and a PC is all that is needed. Such equipment is cheap and available in most offices. Third, the analysis can easily be automated and so run by a technician. Fourth, for regular checking, standard images may be used that are subjected to the same analyses as the flesh disc images. Fifth, the time from sampling to result is extremely short. These properties make the procedure introduced here a useful tool for horticultural research on red fleshed apples cultivars. It likely has much wider application potential in many other biological fields where accurate pigmentation analyses are required.


