Article

Tomato (Solanum lycopersicum L.) Genotypes Respond Differently to Long-Term Dry and Humid Heat Stress

by
Mathieu Anatole Tele Ayenan
1,2,
Agyemang Danquah
1,3,*,
Peter Hanson
2,
Isaac Kwadwo Asante
1,4 and
Eric Yirenkyi Danquah
1,3
1
West Africa Centre for Crop Improvement, College of Basic and Applied Science, University of Ghana, Legon PMB 30, Ghana
2
World Vegetable Center, West and Central Africa—Coastal and Humid Regions, IITA-Benin Campus, Cotonou 08 BP 0932, Benin
3
Department of Crop Science, Faculty of Agriculture, College of Basic and Applied Sciences, University of Ghana, Legon LG44, Ghana
4
Department of Plant Biology and Environmental Science, College of Basic and Applied Sciences, University of Ghana, Legon LG55, Ghana
*
Author to whom correspondence should be addressed.
Horticulturae 2022, 8(2), 118; https://doi.org/10.3390/horticulturae8020118
Submission received: 10 November 2021 / Revised: 20 January 2022 / Accepted: 21 January 2022 / Published: 27 January 2022

Abstract

:
Tomato production in coastal areas in West Africa is constrained by heat stress. There is currently limited empirical evidence on the extent of the effect of heat stress on tomato yield in the sub-region. In this study, we assessed the effects of heat stress on yield and yield components among 16 tomato genotypes with varying heat tolerance status and explored the potential of stress tolerance indices to identify heat tolerant genotypes. The experiments were conducted under three temperature and humidity regimes, namely optimal season (28.37/23.71 °C and 71.0/90.4% day/night), long-term mild and humid (greenhouse, 30.0/26.2 °C and 77.6/97.2%), and long-term mild and dry (open field, 31.50/28.88 °C and 66.72/77.82%) heat stress (HS). All genotypes exhibited significantly higher fruit set percentage, fruit number per plant, fruit weight, and fruit weight per plant in the optimal season compared to both heat stress conditions. In general, the genotypes demonstrated higher performance under dry HS (i.e., HS in open field HSO) than humid HS (i.e., HS in greenhouse HSG). Fruit set decreased by 71.5% and 68.3% under HSG and HSO, respectively, while a reduction of 75.1% and 50.5% occurred in fruit weight per plant under HSG and HSO, respectively. The average sum of ranks values from nine stress tolerance indices and fruit weight per plant (used as proxy trait of yield) identified CLN2498D, CLN3212C, CLN1621L, and BJ01 as heat tolerant under HSG and BJ01, BJ02, Fla.7171, and P005 as heat tolerant under HSO. Fruit weight per plant under long-term heat stress (Ys) and optimal growing conditions (Yp) were suitable to select high performing genotypes under HSO, HSG, and optimal conditions while relative stress index, yield stability index, yield index, stress susceptibility index, and harmonic mean were suitable to select heat tolerant genotypes under either HSG or HSO. Our findings shed light on the extent of the effect of HS on tomato production in the off-season in coastal areas in West Africa and provide new insight concerning the heat tolerance status of the evaluated tomato genotypes.

1. Introduction

Tomato is an important vegetable worldwide. In West Africa, is the most widely grown vegetable with a total land area of 1,005,958 ha and a total production of 5,201,574 tons [1]. Tomato is an important source of income for actors involved in its value chains [2,3]. It plays a key role in health and nutritional security, being an excellent source of vitamins (A and C), potassium, and other minerals, antioxidants (lycopene and other carotenoids), and fiber [4]. In West Africa, tomato is a versatile crop, which is used daily in a large variety of dishes [5]. Tomato is mainly grown in open fields and its production is highly seasonal [6,7]. Like in other regions [8,9], off-season (November to June) tomato production in coastal areas in West African countries offers an opportunity for farmers to increase profits because of high market value [10]. However, during the off-season, tomato production is constrained by water availability, highly unmarketable yields due to blossom end rot, cracking, sunscald and other fruit problems, high viral disease pressure [11,12]. Off-season in the coastal areas in West African countries is also characterized by heat stress [13].
Heat stress causes high flower abortion, low fruit set and extremely low tomato yields [14,15,16]. In addition to the heat stress that traditionally occurs in off-season, frequent heat waves due to climate change in West Africa region poses a serious threat to crops, including tomato [17,18]. Quantifying the magnitude of heat stress on yield and yield components traits will help in the design of effective breeding strategies, as well as inform and support needed investments in crop improvement research to increase the resilience of food systems. However, there is limited knowledge on the extent of the effect of heat stress on tomato yield in comparison with the optimal season in the western Africa coastal countries.
Elsewhere, recent studies revealed variability in the yield penalty of different tomato varieties under moderate to severe heat stress. Ro et al. [19] reported a yield decrease of 37–98% under heat stress in the greenhouse (23.62–42.98 °C), and 6–95% under heat stress in the field (23.47–38.84 °C), compared to optimal field conditions (20.13–37.65 °C) in Cambodia. Similarly, in India, Vijayakumar et al. [20] reported a decrease in the number of fruits per plant, fruit set percentage, fruit weight, and fruit yield per plant in all tomato genotypes under induced heat stress in a temperature-controlled greenhouse (36 ± 2 °C). Under controlled conditions, Sherzod et al. [21] found that heat stress (about 40 °C) decreased fruit yield, fruit weight, and number of fruits per plant for most accessions but some showed increased performance in these traits. These reports show that changes in performance of tomatoes under heat stress vary across environments and genotypes. Growing environment, defined here by the combination of temperature and air relative humidity, plays a critical role in tomato response to heat stress [22]. Temperature and relative humidity define the nature and the intensity of heat stress to which plants are subjected [22]. Characterizing heat stress and tomato response to each heat stress regime is not well documented [15]. Empirical evidence of the effects of heat stress on off season tomato production in the sub-region are solely based on the evaluation of tomato germplasm collections under heat stress [14,23,24].
We previously evaluated the tomato germplasm under long-term mild heat stress in the greenhouse and open field [23,24]. In this present study, we reanalyzed the data from those experiments by adding data from optimal tomato growing season in coastal West Africa. Comparing the performance of genotypes under long-term mild heat stress and optimal conditions offers the opportunity to quantify changes in tomato yield and yield components traits (fruit set percentage, fruit weight, number of fruits per plant, fruit weight per plant). Moreover, we provide new insight regarding the heat stress tolerance status of the genotypes by computing nine stress tolerance indices. Gaining insight into the extent of yield penalty due to heat stress and the identification of heat tolerant genotypes based on stress indices will provide critical information to plant breeders to swiftly improve heat tolerance in tomatoes.
In this study, we assessed the effects of long-term heat stress regimes (dry and humid) on tomatoes yield components and the potential of stress indices to identify heat tolerant tomato genotypes.

2. Materials and Methods

2.1. Plant Materials

Sixteen tomato genotypes of different fruit weight categories (small, moderate, large and extra-large) were included in this study. These genotypes were previously clustered based on genomic data and heat-related phenotypic data under long-term mild heat stress conditions and identified four groups of genotypes, namely highly tolerant, moderately tolerant, moderately sensitive, and highly sensitive [24] (Table 1).

2.2. Screening Conditions and Data Collection

Tomato genotypes were evaluated under long-term mild heat stress in the greenhouse (HSG) and the open field (HSO), and under optimal season (OPT). The evaluation of the genotypes in HSG and HSO was previously described in Ayenan et al. [24]. The evaluation in OPT was conducted from July to October 2020 in Abomey-Calavi, Republic of Benin (Latitude 6°30′15.160″ N; Longitude 2°20′44.716″ E). The rainout shelter (a transparent plastic roof without sides) was used to protect the plants against heavy precipitation that occurred during this season. This period is the major tomato growing season in the Region with relatively lower temperatures and considered to be the optimal tomato growing season (Table 2). Temperature and relative humidity data were collected at Legon, Zè and Abomey-Calavi using the climate sensor Ventilated Cell (NaanDanJain Irrigation Ltd., Naan, Israel), Caliber IV (Cigar Oasis, New York, USA), and WatchDog 2700 (Spectrum Technologies, Inc., Illinois, USA), respectively. For the three trials, adequate water was supplied through drip irrigation. The trials were set up in a randomized complete block design with two replications and eight plants per plot. Soil conditions and agronomic practices are indicated in Appendix A. To limit the effects of confounding factors, we ensured that the plants received adequate solar radiation, nutrients, and water across the three trials.
Data were recorded on fruit set percentage, the number of fruits per plant, fruit weight, and fruit weight per plant following Ayenan et al. [23,24]. Briefly, three plants were selected per plot and number of flowers and fruits were recorded on three inflorescences per plant, i.e., nine inflorescences per plot. The average fruit set percentage per plot was computed as FS = ((NFr * 100)/NFl) where NFr was the number of fruits and NFl was the number of flowers on the nine inflorescences. We recorded the number of fruits and fruits weight per plot at each fruit picking until the termination of the experiment. We divided the total number of fruits and the total fruit weight by the number of plants per plot to obtain the average number of fruits per plant (NFP) and average fruit weight per plant (FWP), respectively.

2.3. Data Analysis

We assessed whether the day and night temperatures and relative humidity values were significantly different among the three trials. Since the assumptions (normality of the residuals and homogeneity of variance) for parametric tests (t-test) were violated, we used the Wilcoxon test for pairwise comparison in the package ggpubr [25].
Descriptive statistics (means and standard deviation) were computed for each variable and genotype. We computed the proportion of change in performance of the variables for each genotype under long-term mild heat stress conditions in the greenhouse and open field relative to the performance of the genotype in the optimal season.
% change   X = 100 × ( X HS X OPT ) X OPT
with X, X HS , X OPT being the variable, the average value of the variable under long-term mild heat stress conditions, and the average value of the variable in the optimal season trial, respectively.
To assess whether there were significant differences between means and the interaction effects between genotypes and trials (HSO, HSG, and OPT), we first checked the assumptions of analysis of variance, i.e., normality of the residuals and homogeneity of variances. Because original data did not meet the assumption for ANOVA, we used the Align-and-rank data for a non-parametric ANOVA in the package ARtool [26] for subsequent analysis. The differences between genotype means across trials were visualized using barplots with error bars in ggplot2 [27]
We computed nine stress tolerance indices, namely the tolerance index (TOL), relative stress index (RSI), mean productivity (MP), harmonic mean (HM), yield stability index (YSI), geometric mean productivity (GMP), stress susceptibility index (SSI), stress tolerance index (STI), and yield index (YI). We generated the ranking patterns of the genotypes based on each stress index and computed the average sum rank for all indices to identify heat tolerant genotypes [28]. The lower the average sum rank, the more heat-tolerant the genotype. The indices were computed on the fruit weight per plant, which is a proxy of fruit yield. Pearson correlation between indices and fruit weight per plant under optimal and heat stress conditions were generated and visualized using a correlogram. All the analyses related to the stress indices were performed in iPASTIC [28].We explored the relationship between genotypes and stress tolerance indices through a principal component analysis with a biplot of genotypes and indices and fruit weight per plant under optimal and stress conditions using the package factoextra [29] in R 4.0.5 [30].

3. Results

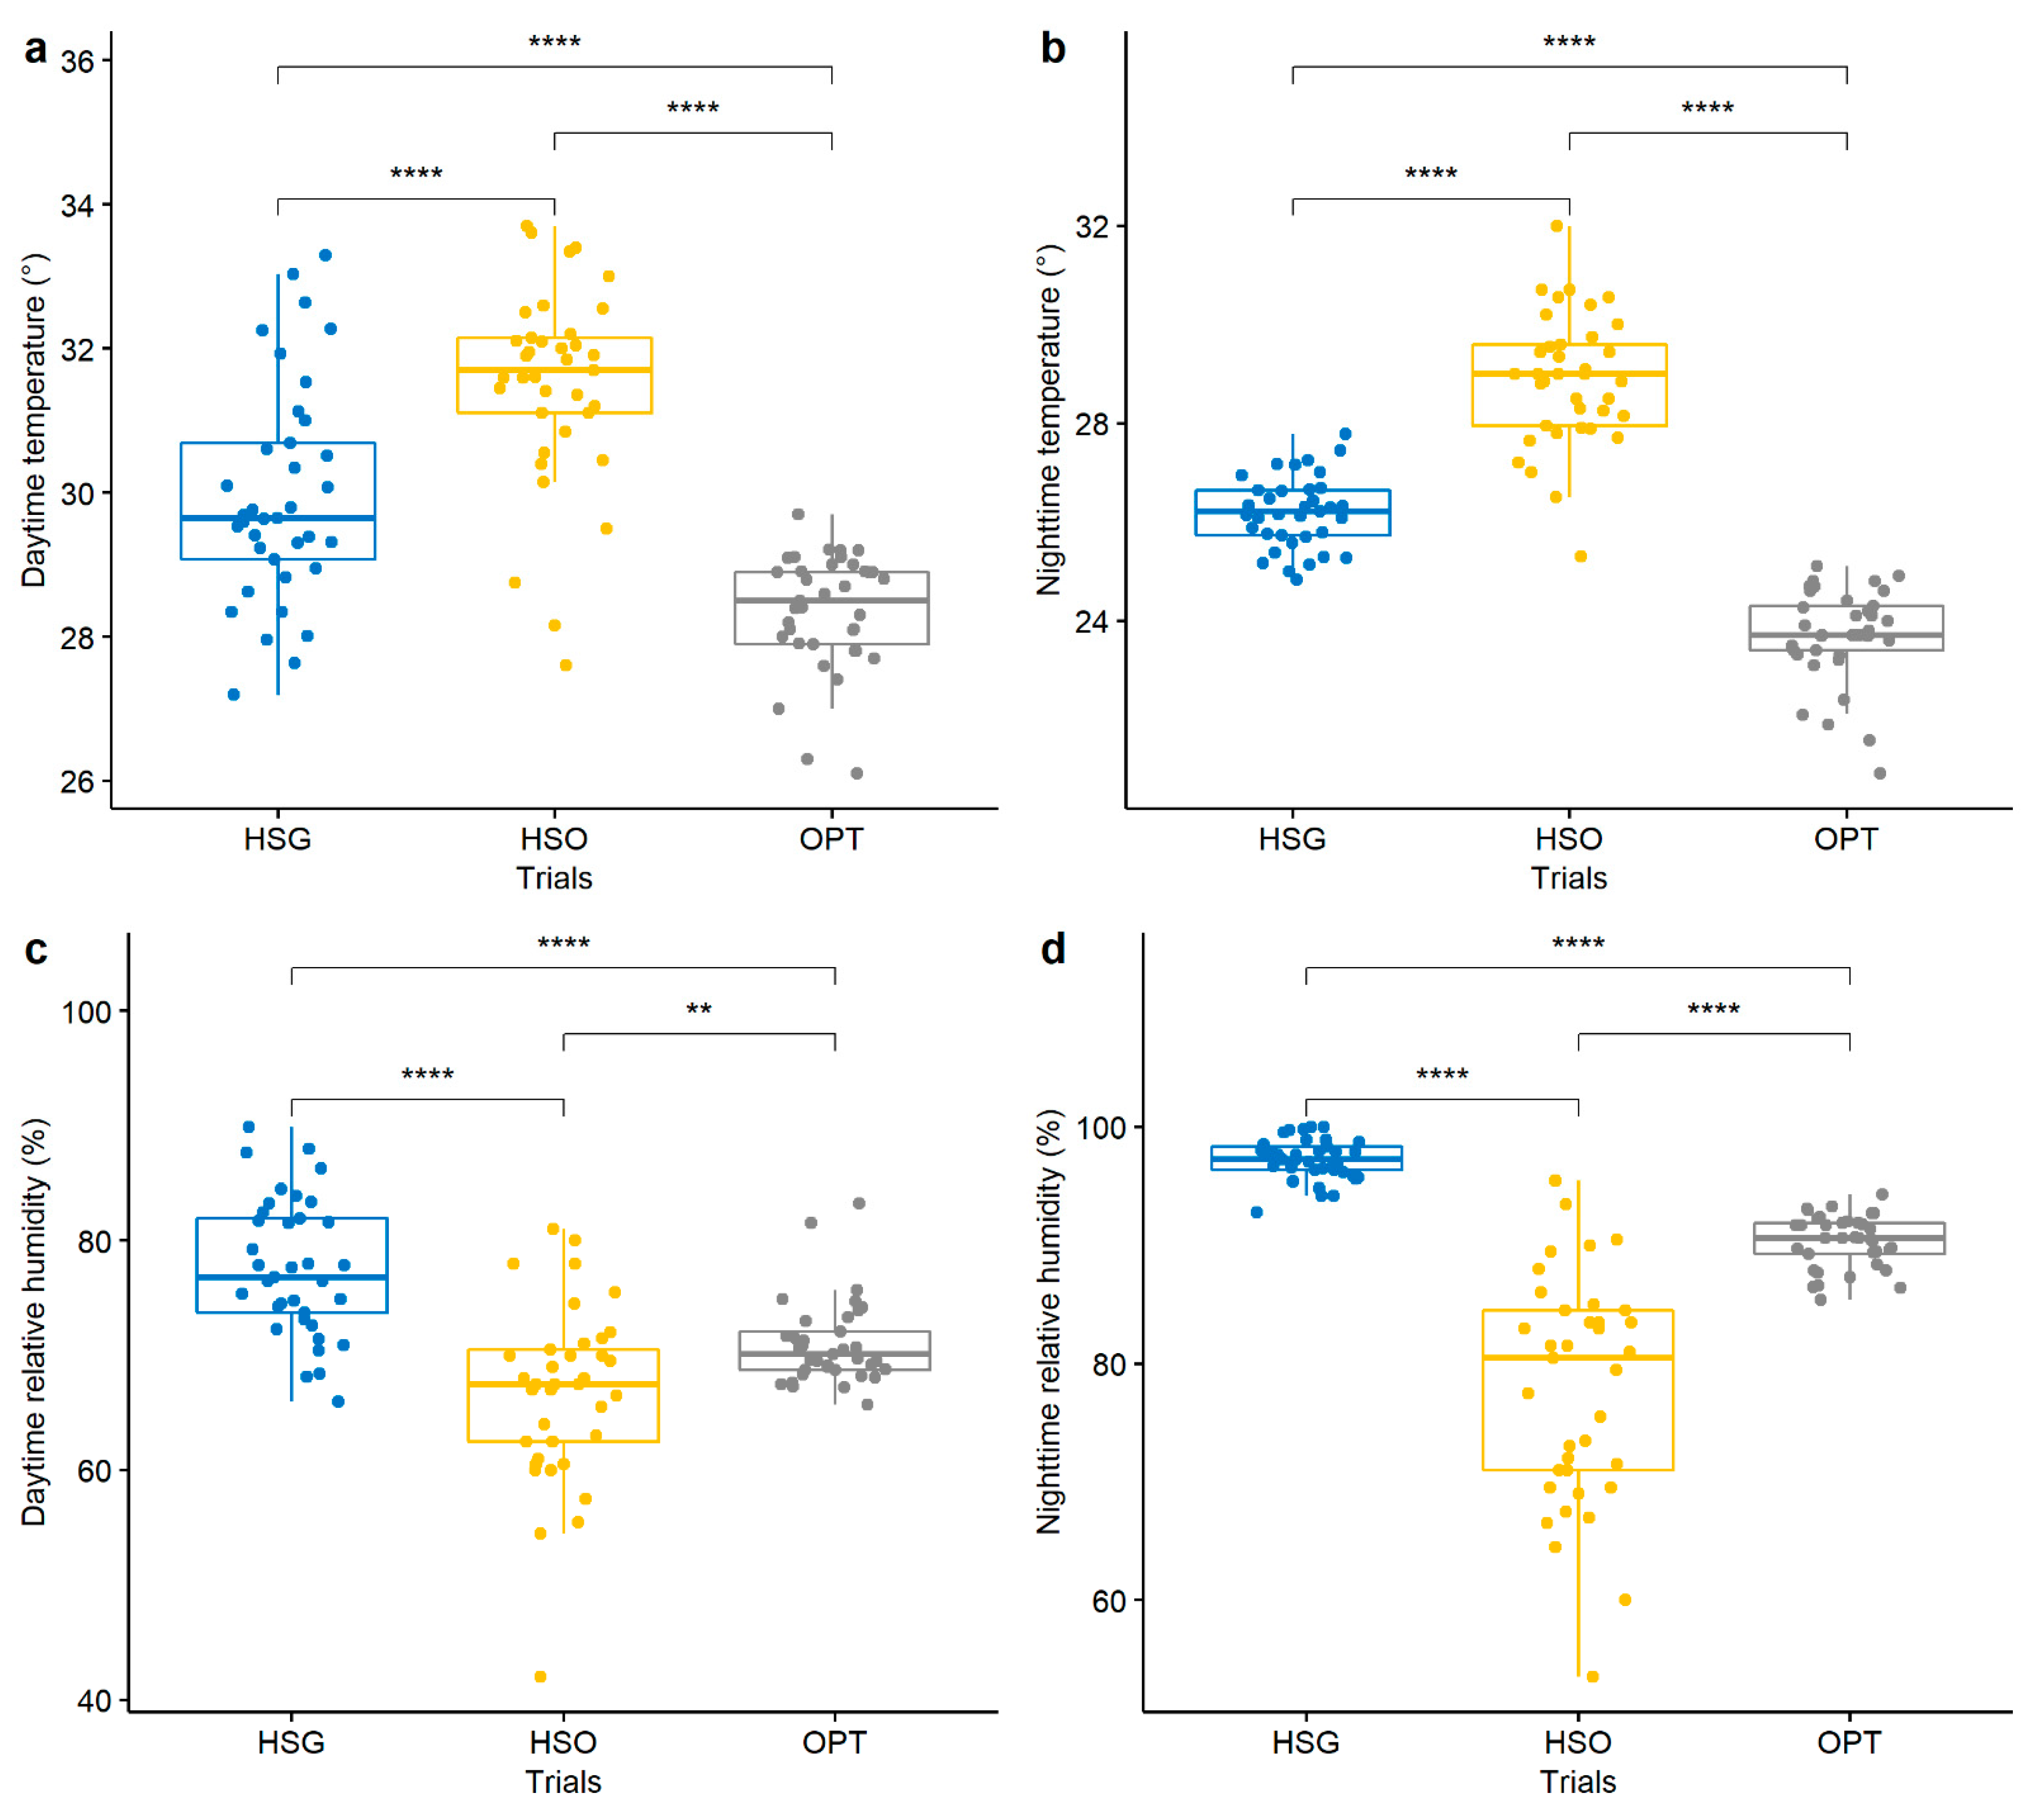
3.1. Temperatures and Relative Humidity in the Growing Environments

The results showed significant differences for temperatures and relative humidity between trials (Figure 1). Day (28.37 °C) and night temperatures (23.71 °C) in OPT were lower than those in HSO and HSG trials (Figure 1). The highest temperatures occurred in the HSO trial. The highest relative humidity was recorded in the HSG trial (77.61% day and 97.23% night) followed by the OPT (Figure 1). The lowest average relative humidity was recorded in the open field (66.72% day and 77.82% night) (Figure 1). Based on recorded temperatures and relative humidity, HSG and HSO were characterized as long-term humid and mild heat stress and long-term dry and mild heat stress, respectively.

3.2. Performance of the Genotypes for Yield Components under Long Term Heat Stress Regimes and Optimal Season Trials

There were significant differences in the interaction effects between genotypes and trials for all the parameters, indicating the influence of the growing environment (trial) on the performance of the tomato genotypes.

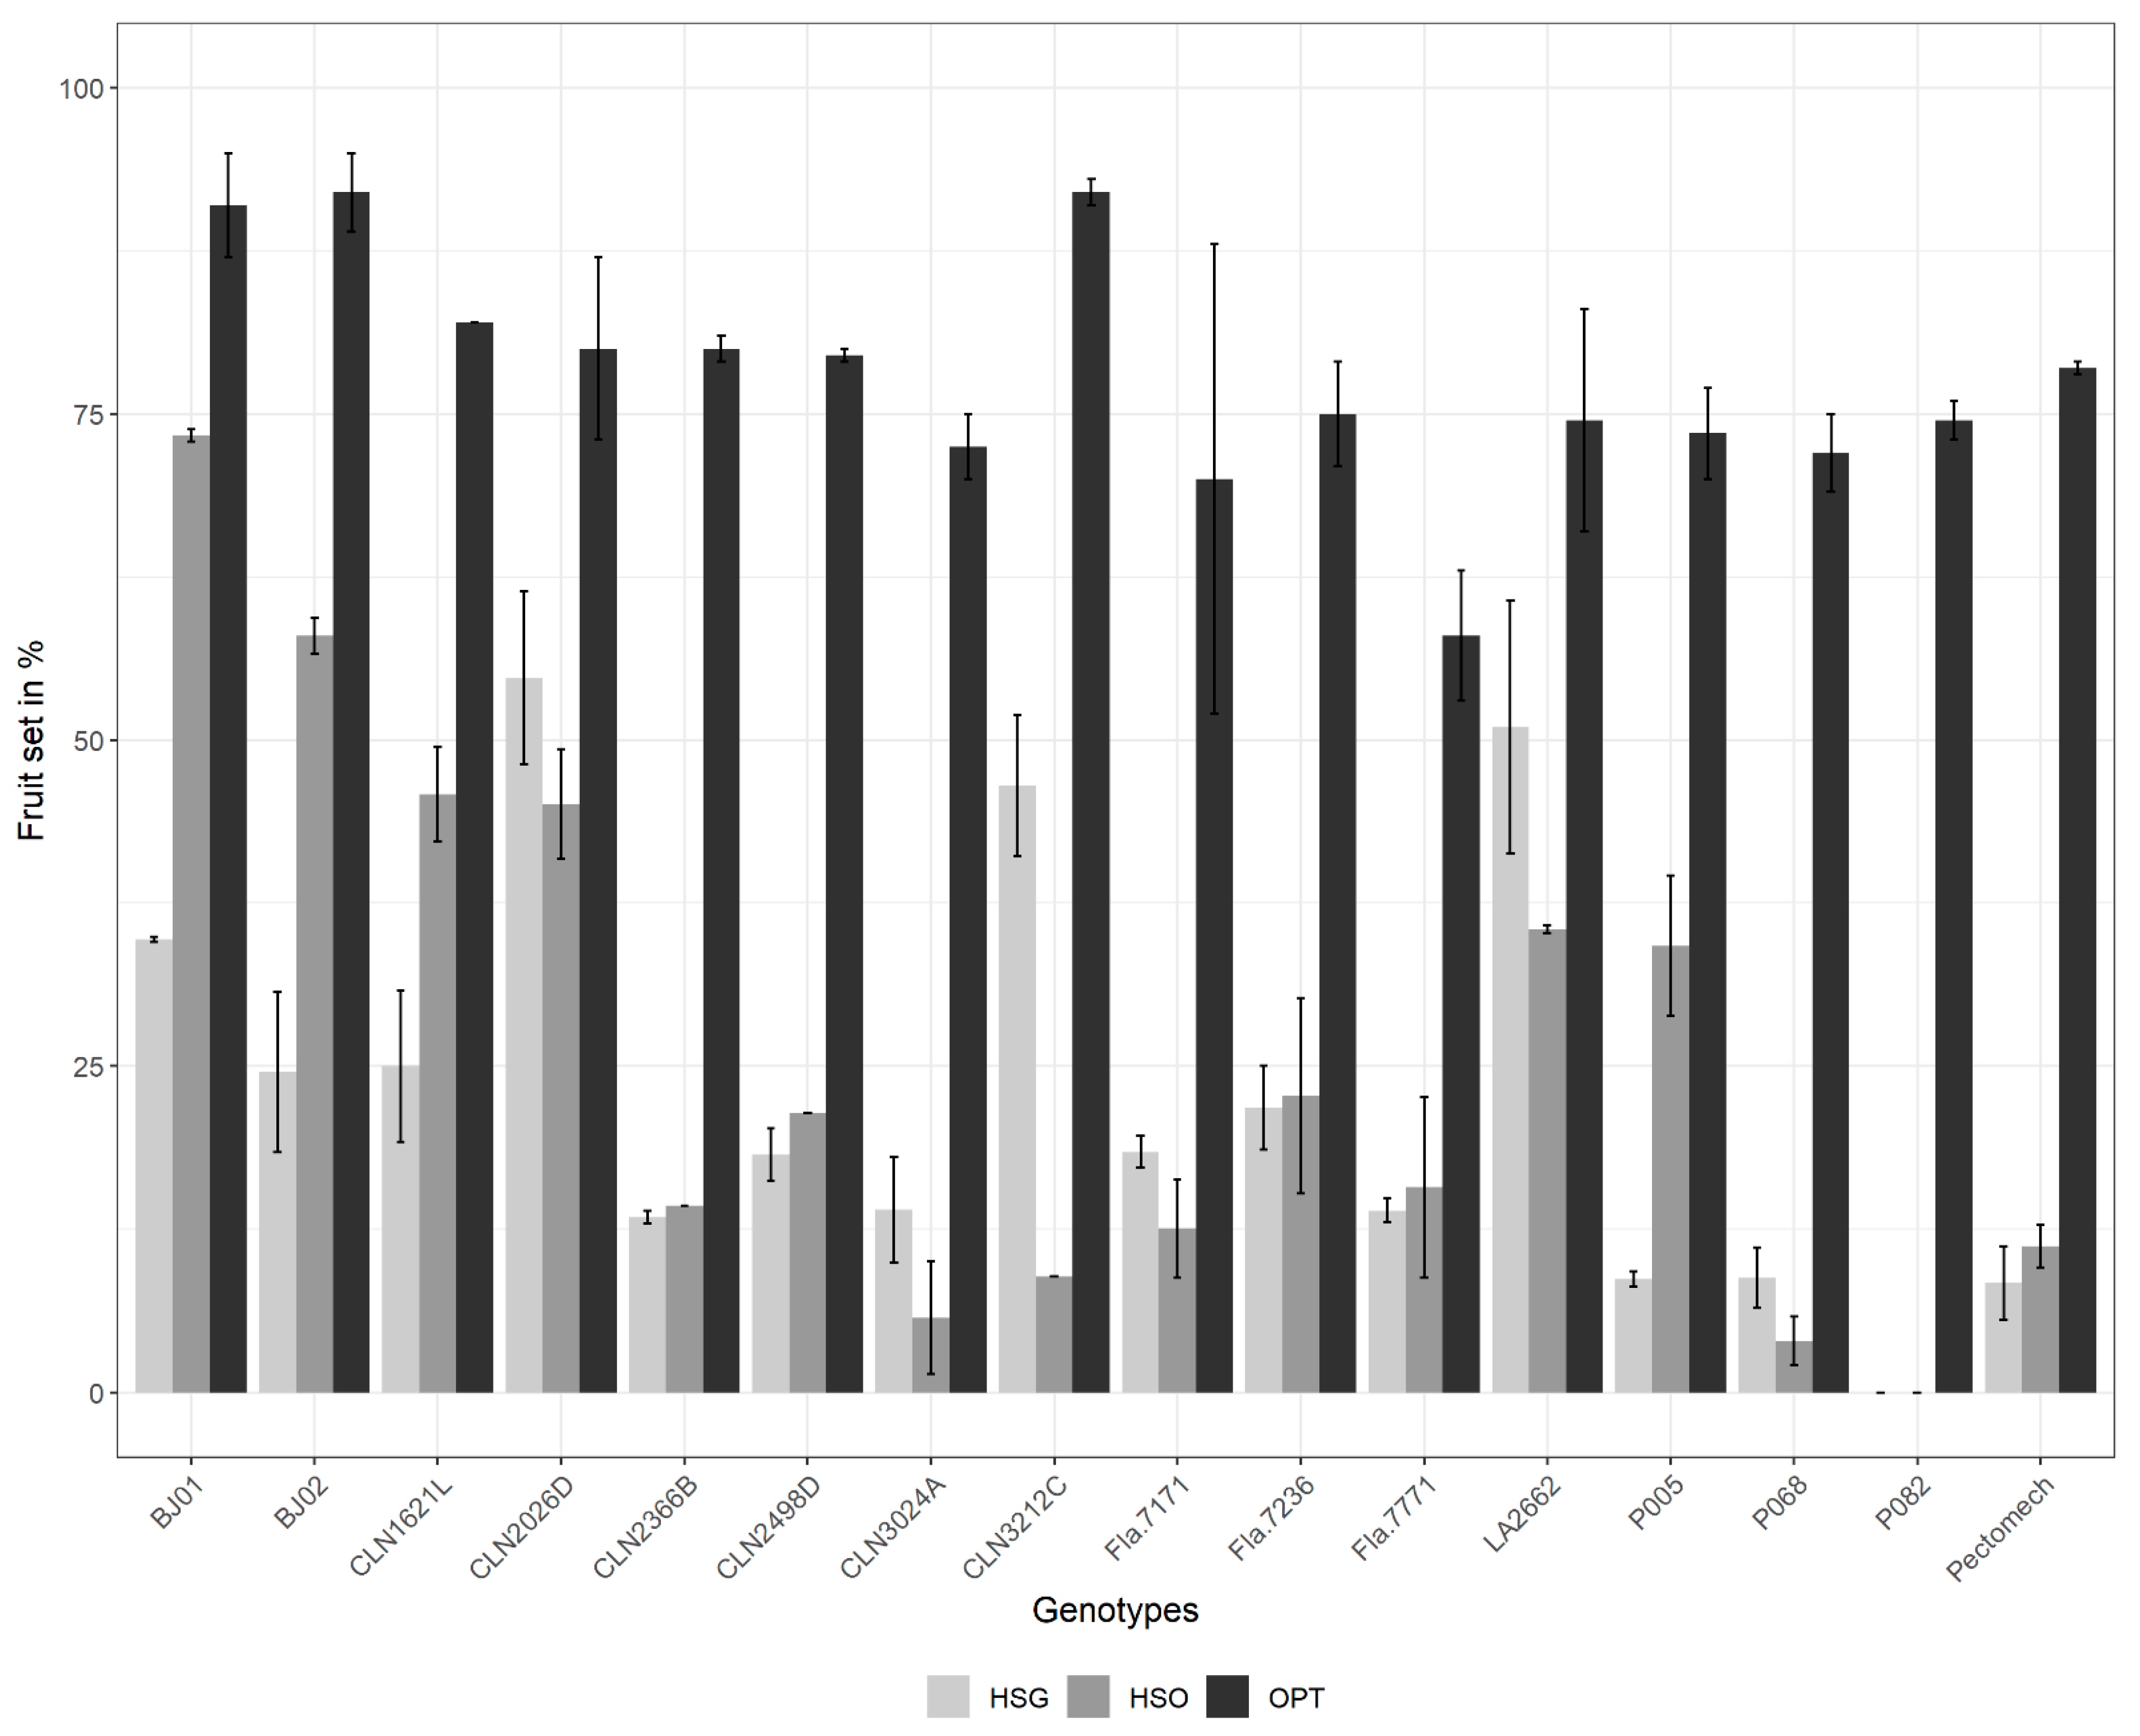
3.2.1. Fruit Set Percentage

In the OPT trial, fruit set percentage ranged from 58% (Fla.7771 extra-large fruit) to 92% (BJ02 small fruit size and CLN3212C large fruit size). In the HSG trial, the fruit set percentage varied from 0% (P082 moderate fruit size) to 34% (BJ01, small fruit size). Under HSG and HSO, P082 recorded both the lowest fruit set percentage (0%) and number of fruits per plant (one fruit per plant under HSG and two fruits per plant under HSO). In the OPT trail, BJ01 had the highest fruit set percentage (73%) followed by BJ02 (58%) (Supplementary Table S1).
Unsurprisingly, all genotypes recorded significantly higher fruit set percentage in OPT compared to both long-term mild heat stress trials (Figure 2). CLN3212C and LA2662 had significantly higher fruit set percentage under HSG than HSO (Figure 2).
All genotypes showed fruit set decreases in greenhouse (HSG) and open field (HSO) trials. The highest reduction in fruit set percentage under HSG and HSO was recorded in P082 (100%). CLN2026D, LA2662 (31.5%), and BJ01 (19.4%) sustained the lowest decreases in fruit set percentage in HSG and HSO trials, respectively. Fruit set decreased by 71.5% and 68.3% under HSG and HSO, respectively (Supplementary Table S1).

3.2.2. Number of Fruits per Plant
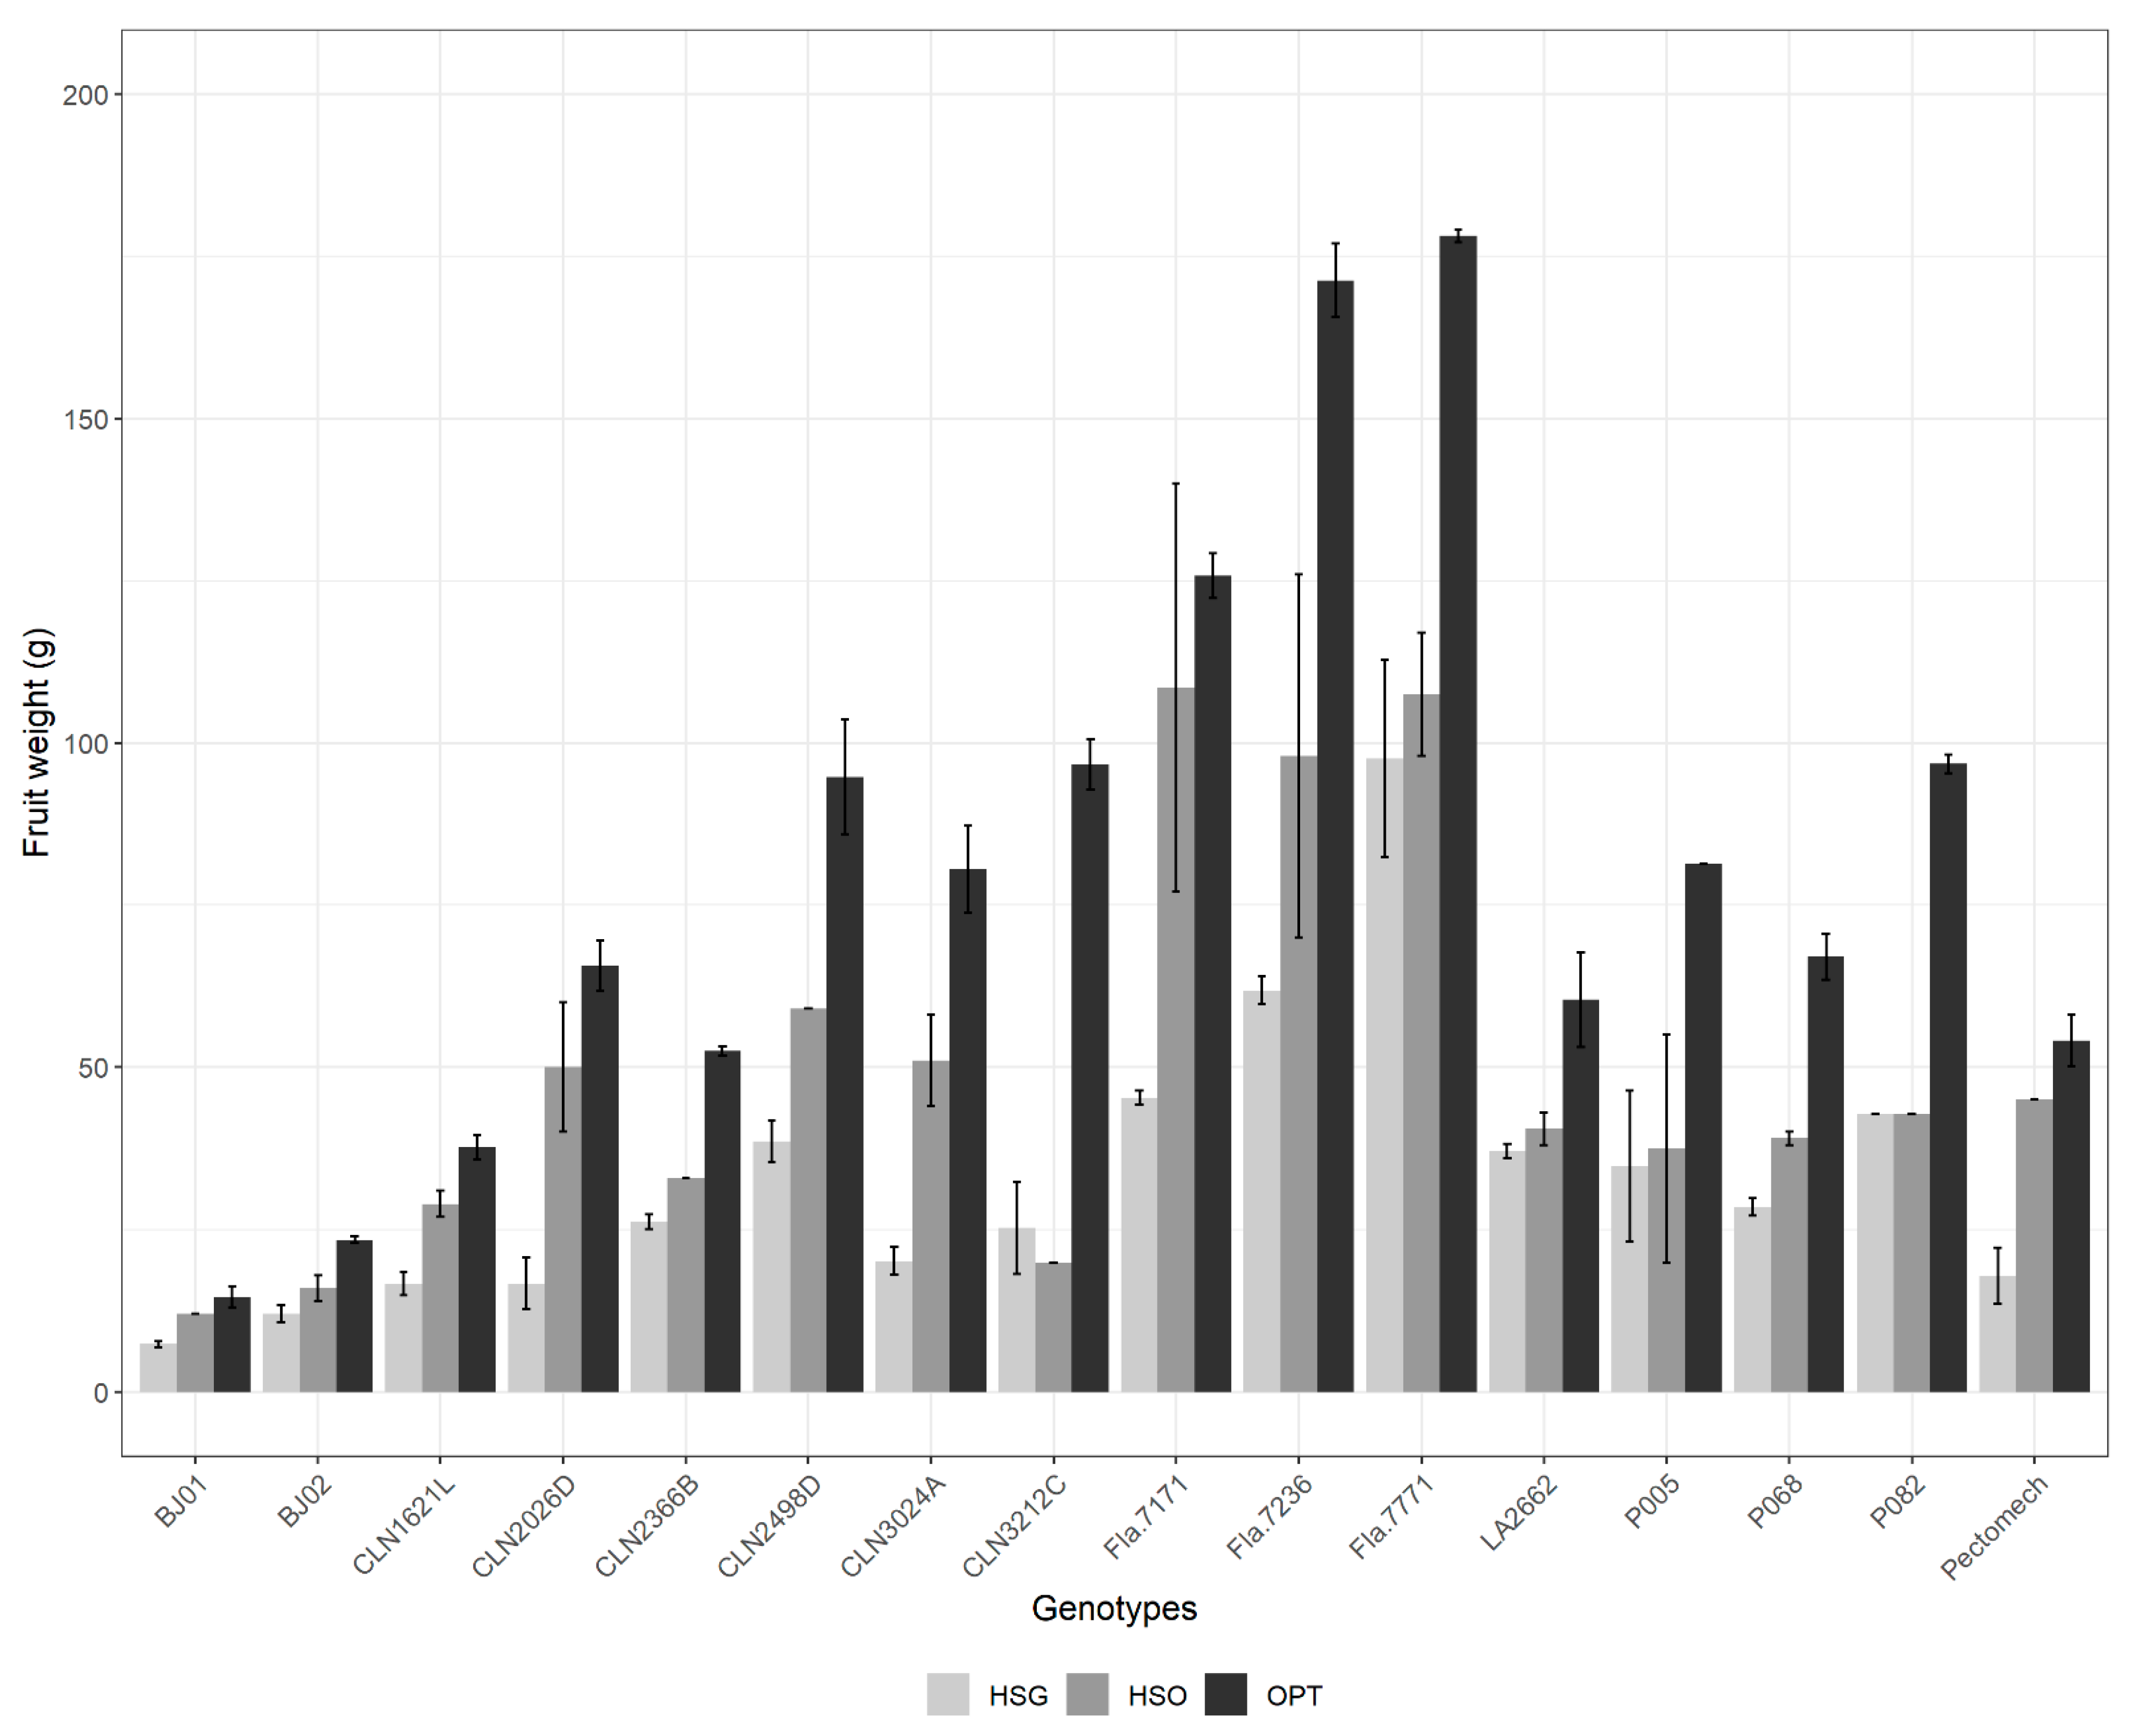
In the OPT trial, fruit number varied from nine (P082) to 138 (BJ02). The highest number of fruits per plant under HSG and HSO was 80 fruits (BJ01) and 187 fruits (BJ02), respectively (Supplementary Table S1). The number of fruits per plant was not significantly different for BJ01, BJ02, CLN1621L, Fla.7171, Fla.7771, LA2662, and P068 under HSO and OPT trials. Only P005 recorded a significantly higher number of fruits under HSO in comparison to OPT. Under HSG, CLN2026D, and CLN3212C had a significantly higher number of fruits per plant compared to optimal season (Figure 3).
The percentage change in number of fruits per plant under HSG varied from −89% (P082) to 119% (CLN2026D) (Supplementary Table S1). Under HSO, P082 and P005 had the highest percentage decrease (79%) and increase (72%) in the number of fruits per plant, respectively. The number of fruits per plant decreased by 32.1% and 23.4% under HSG and HSO, respectively (Supplementary Table S1).

3.2.3. Fruit Weight

BJ01 had the lowest fruit weight across the three growing environments, with as lower as 7.4 g in the HSG trial. In the OPT and HSG trials, Fla.7771 had the highest fruit weight of 178.2 g and 97.6 g, respectively. In the HSO trial, Fla.7171 had the highest fruit weight (108.5 g).
In general, genotypes developed higher fruit weights in the OPT trial compared to HSO and HSG. Only Fla.7171, had comparable fruit weights in both OPT and HSO trials (Figure 4). CLN3212C, Fla.7771, LA2662, P005, and P082 had similar fruit weight under HSG and HSO, while the other genotypes had a lower fruit weight in HSG versus HSO trials (Figure 4, Supplementary Table S1).
CLN3212C (79%) and CLN3024A (74%) had the highest decrease in fruit weight under HSO and HSG, respectively (Figure 4). Fla.7171 (13%) and LA2662 (38%) had the lowest decrease in fruit weight under HSO and HSG, respectively. In general, there was a reduction of 75.1% and 50.5% in fruit weight under HSG and HSO, respectively (Supplementary Table S1).

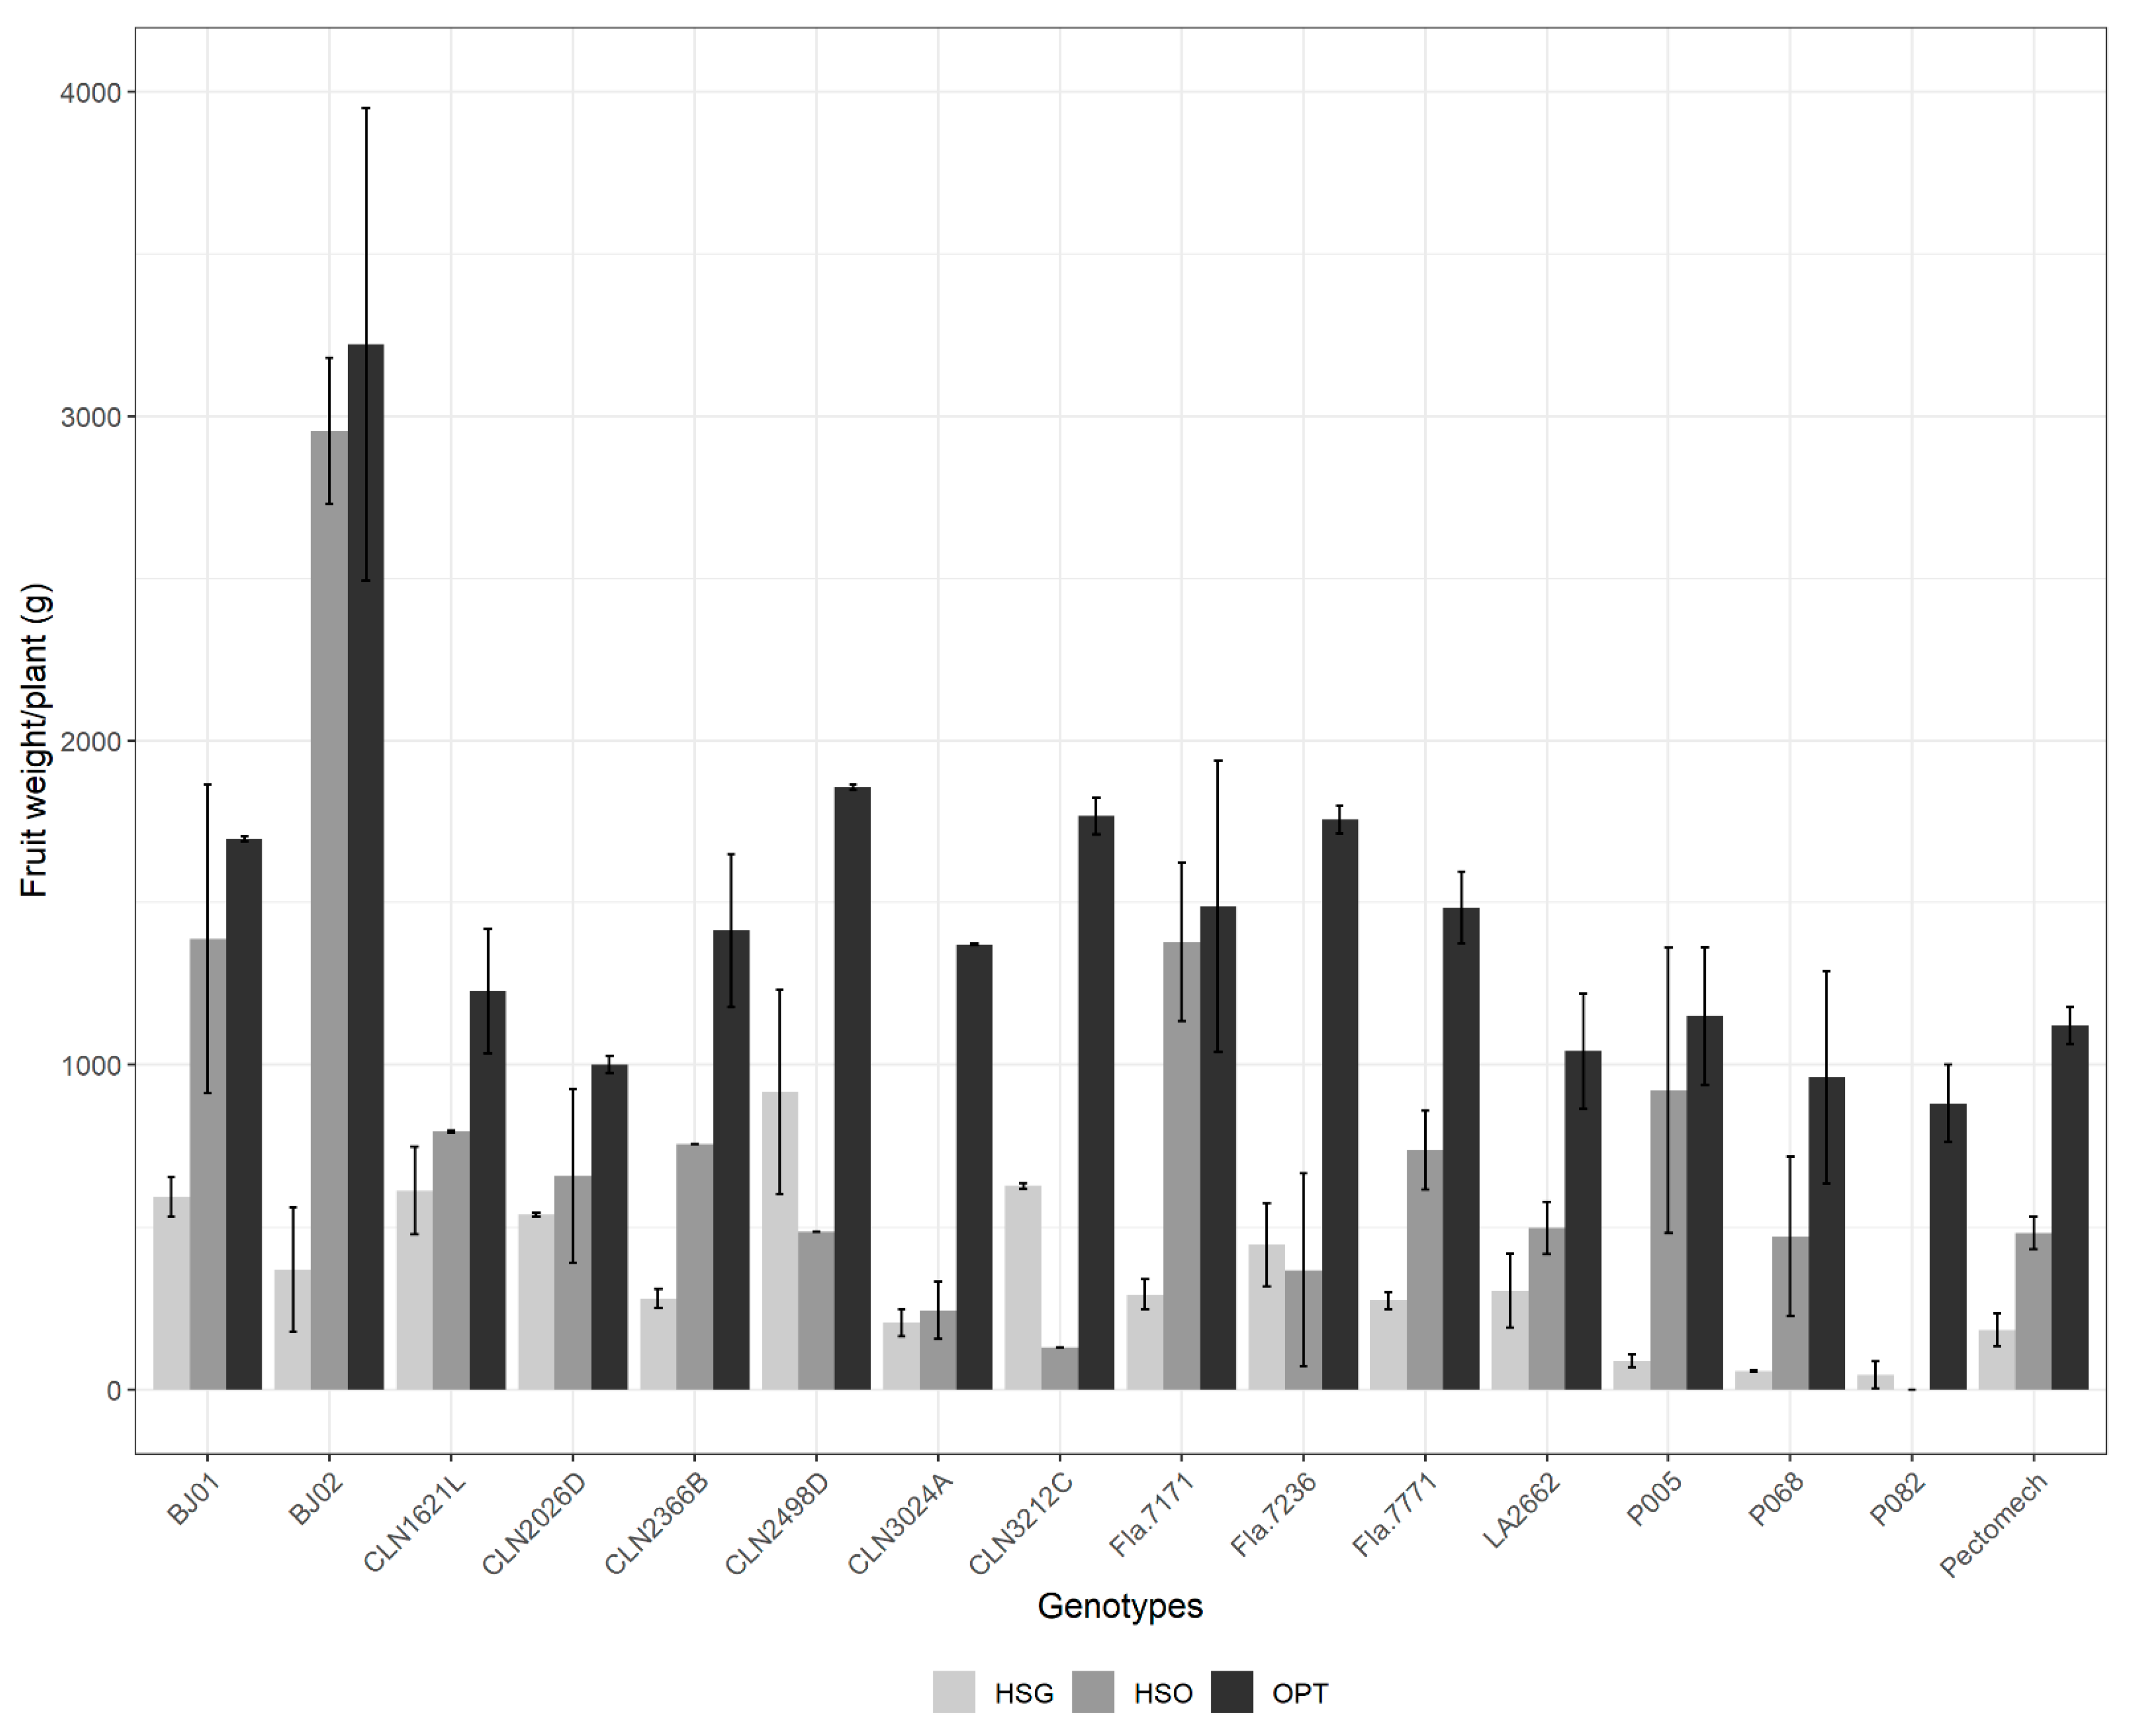
3.2.4. Fruit Weight per Plant

Fruit weight per plant ranged from 880 g (P082) to 3221 g per plant (BJ02). Large fruit size genotypes, CLN2498D and CLN3212C, had higher fruit weight per plant than BJ01. In the HSG trial, fruit weight per plant varied from 44 g (P082) to 916 g (CLN2498D) (Supplementary Table S1). In the HSO trial, fruit weight per plant ranged from 0 g (P082) to 2954 g (BJ02). Across the three trials, BJ01 and Fla.7771 had the lowest and highest fruit weight, respectively (Supplementary Table S1).
In the OPT trial, fruit weight per plant was significantly higher than that of HSG for all the genotypes. Fruit weight per plant was not significantly different between optimal season and HSO for BJ01, BJ02, Fla.7171, and P005 in contrast to the other genotypes which had higher fruit weight under optimal season compared to HSO (Figure 5).
Fruit weight per plant in CLN1621L, CLN2026D, CLN3024A, and Fla.7236 were not significantly different between HSO and HSG. CLN2498D, CLN3212C, and P082 had higher fruit weight per plant under HSG compared to their performance under HSO (Figure 5).
Fla.7171 (7%) and CLN2026D (34%) had the lowest reduction in fruit weight per plant under HSO and HSG, respectively (Figure 5). P068 (94%) and P082 (100%) had the highest decrease in fruit weight per plant under HSO and HSG, respectively (Supplementary Table S1). Across genotypes, fruit weight per plant decreased by 58.5% and 36.6%, under HSG and HSO, respectively (Supplementary Table S1).

3.3. Heat Stress Tolerance Indices

3.3.1. Average Rank of the Genotypes

We computed nine stress tolerance indices and ranked the genotypes based on the value of the indices for each genotype. Under HSG, the average sums of ranks ranged from 2.3 for CLN2498D to 14.9 for P082 (Table 3). Based on the average ranking, CLN2498D, CLN3212C, CLN1621L, and BJ01 had the lowest values, suggesting they were the most heat tolerant genotypes. P082, P068, P005, and Pectomech had the highest values, suggesting that they were the most heat sensitive genotypes.
Under HSO, the average sums of ranks ranged from 1.5 to 15.6 for BJ01 and P082, respectively. BJ01, BJ02, Fla.7171, and P005 had the lowest average sums of ranks, suggesting they were the most heat tolerant genotypes. P082, CLN3212C, CLN3024A, and Fla.7236 had the highest average sums of ranks, indicating that they were the most heat sensitive genotypes (Table 4).

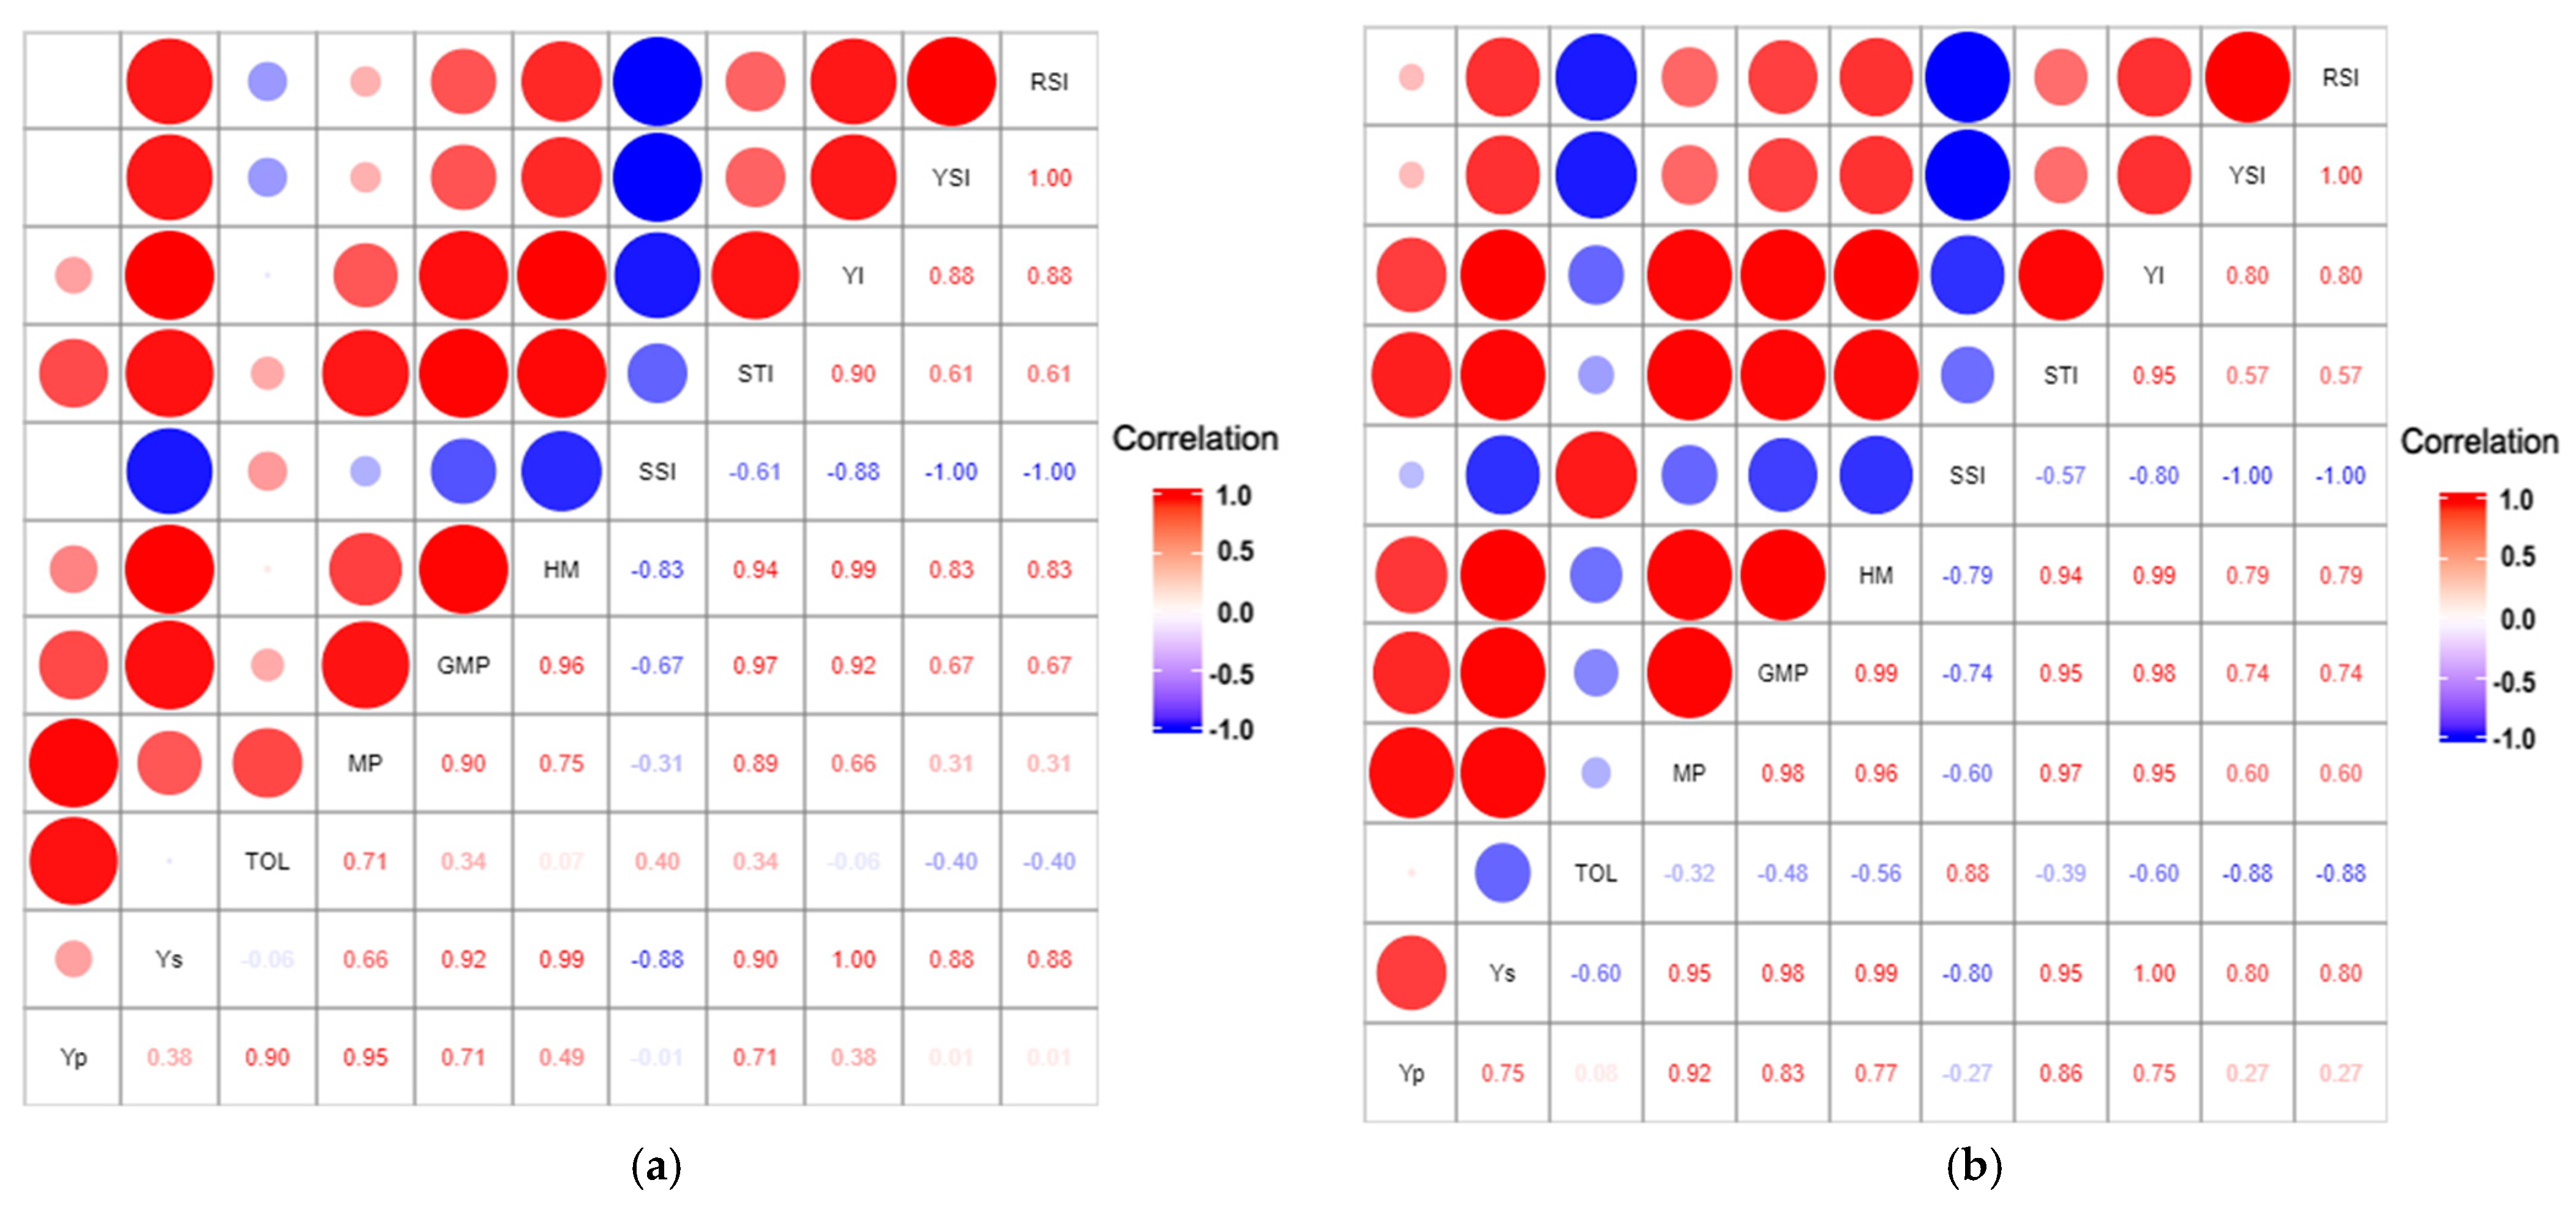
3.3.2. Association between Fruit Weight per Plant and Stress Tolerance Indices

Fruit weight per plant in HSG was positively associated with all the indices except SSI and TOL (Figure 6a). There was perfect and positive association between YI and Ys and between RSI and YSI, while there was perfect and negative association between SSI and YSI and SSI and YSI. TOL was positively correlated with MP. SSI showed negative association with the other indices except TOL. In general, similar trends were observed in the associations between indices under HSO (Figure 6b). There was a stronger association between TOL and SSI under HSO compared to HSG (0.87). Conversely to HSG, neither MP nor Yp were correlated with TOL (Figure 6b). Fruit weight per plant under long-term heat stress (Ys) and optimal growing conditions (Yp) were strongly associated with MP, GMP and STI (Figure 6a,b), indicating that these indices are suitable to select high performing genotypes under stress and optimal conditions. RSI, YSI, YI, SSI, and HM were strongly associated with Ys in both long-term mild heat stress conditions, suggesting that they can be used interchangeably to select heat tolerant genotypes but not high performing genotypes under optimal conditions.

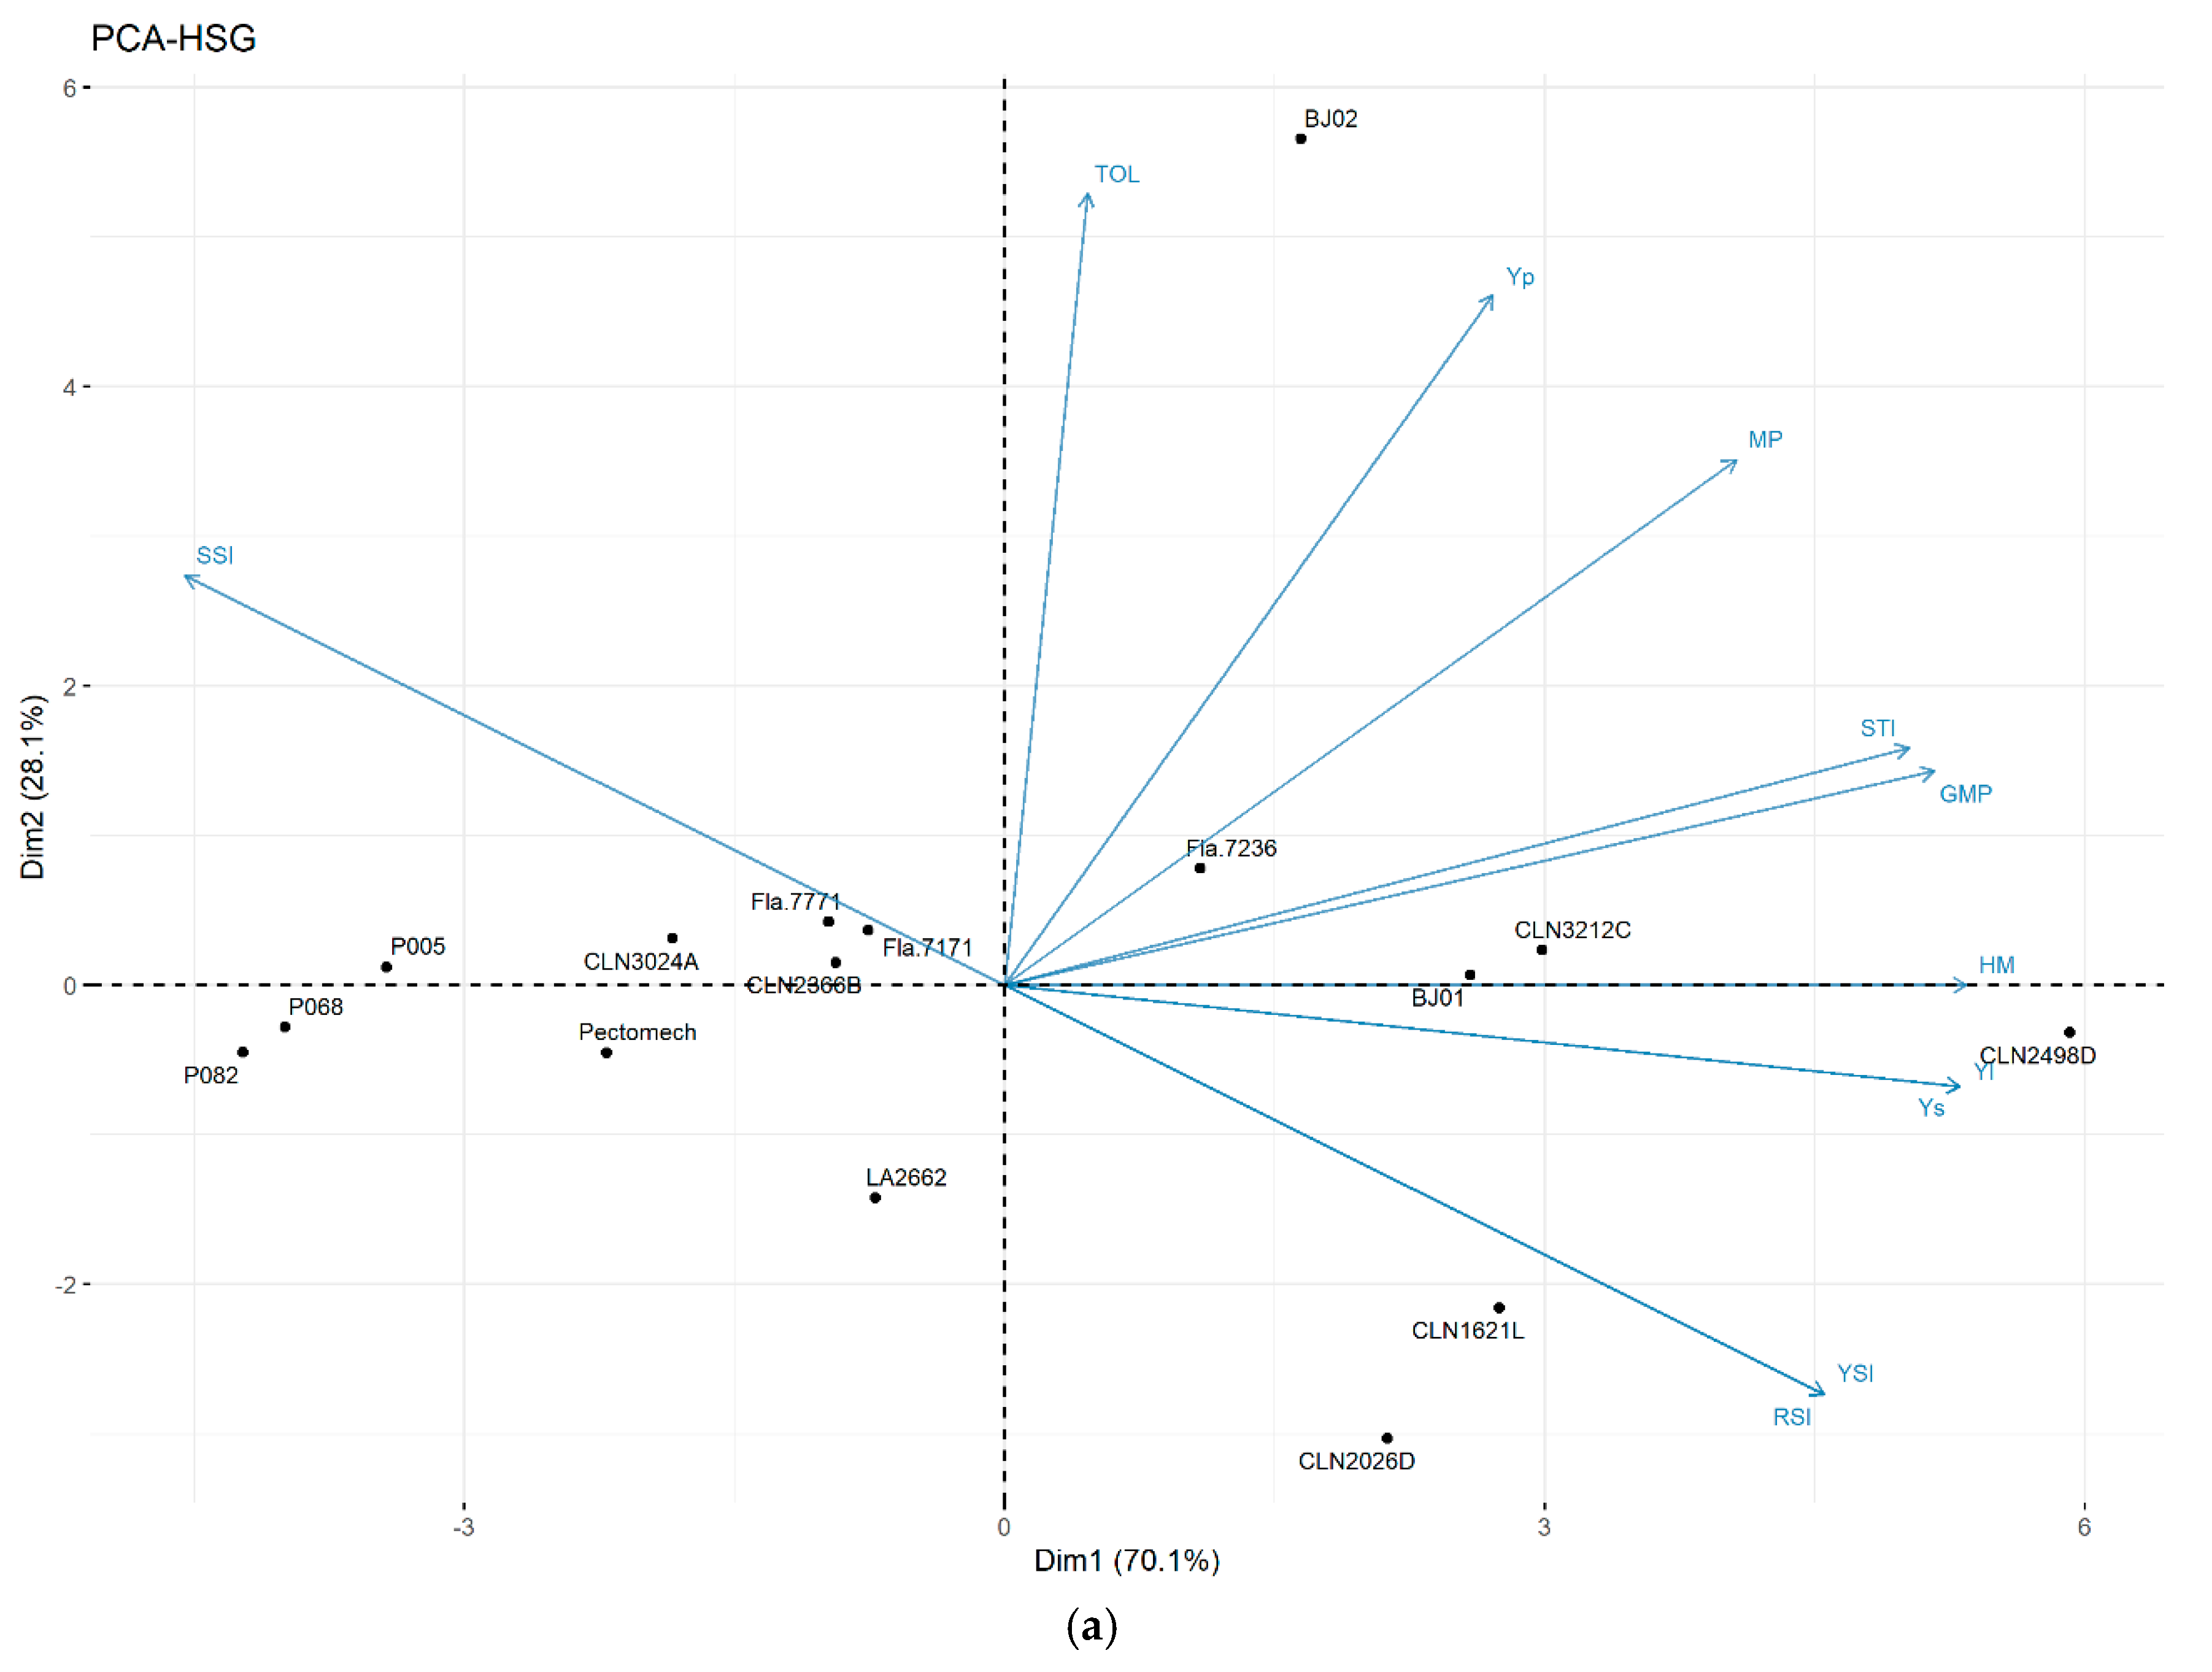
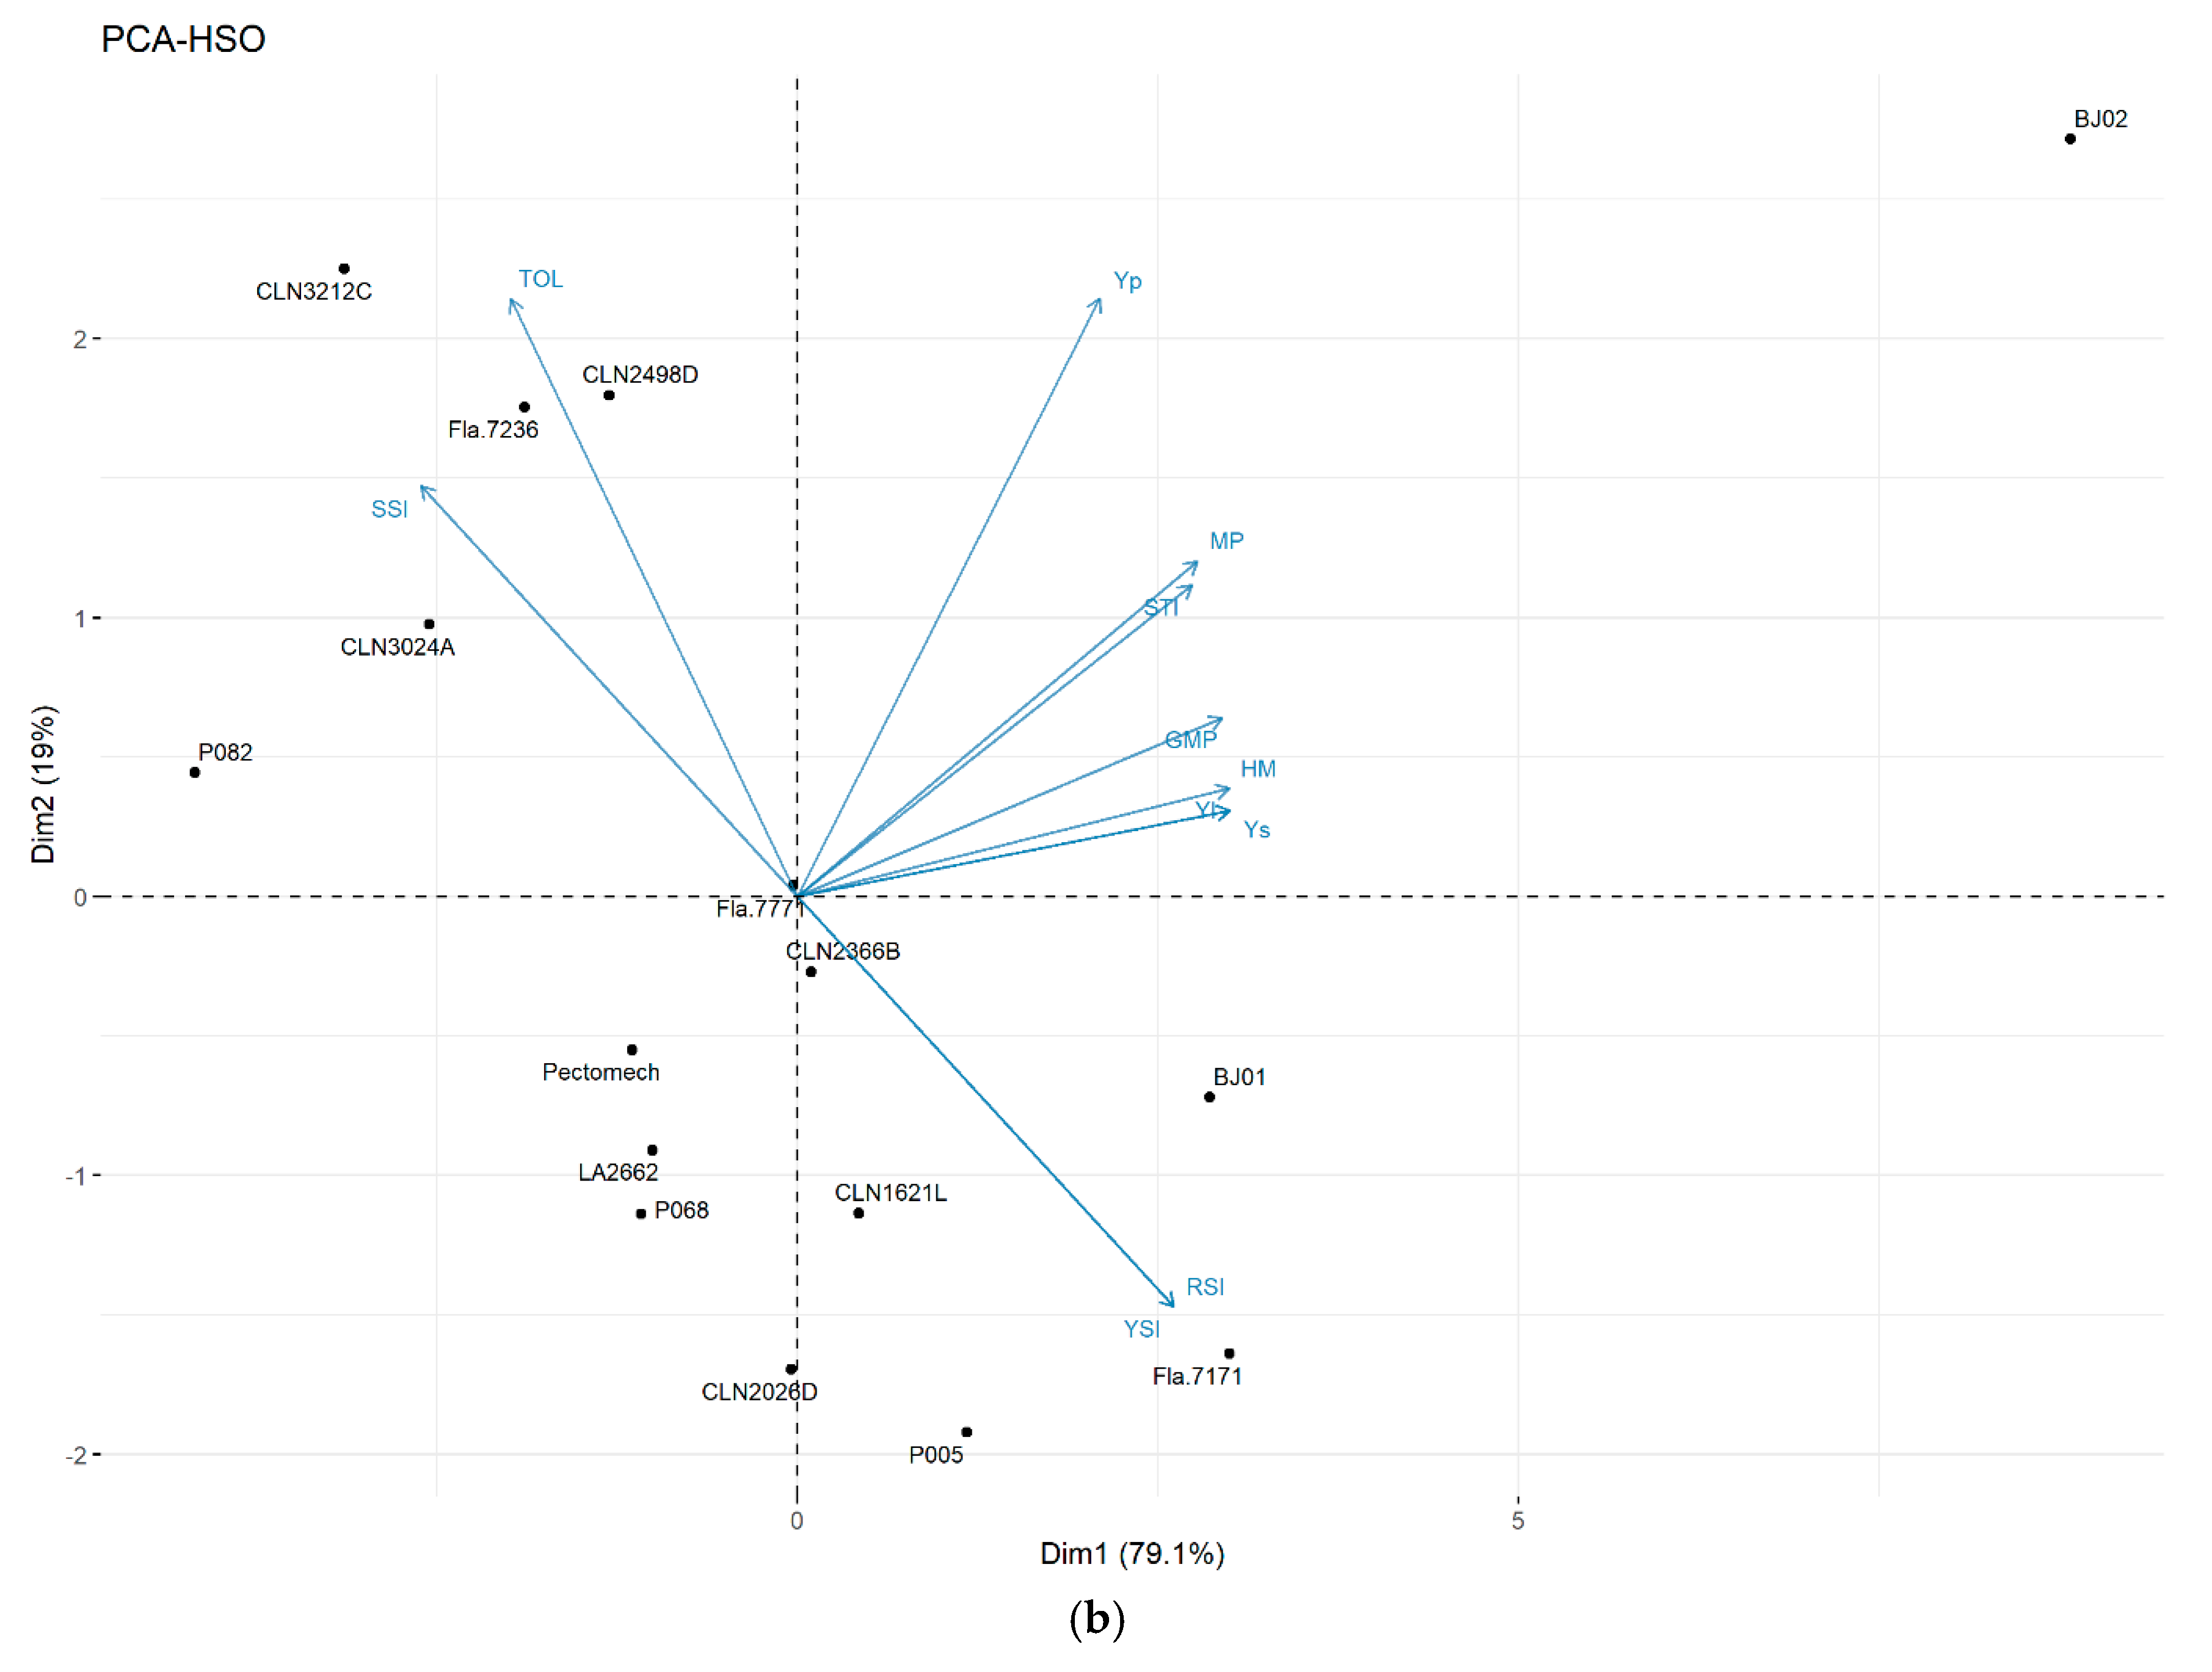
3.3.3. Principal Component Analysis

The principal component analysis (PCA) indicated that the first two principal components had eigen values greater than 1 and accounted for 98.21% of the total variation in the data in the HSG (Figure 7a). In the HSO, the first two principal components had eigen values greater than 1 and explained 98.1% of the total variation (Figure 7b). Under both long-term heat stress conditions, Ys, MP, GMP, HM, STI, YI, YSI, RSI, and SSI had large contributions to the PC1 (Figure 7a). This component describes the stress tolerance indices with desirable maximum values. Yp, and TOL had large contribution to the PC2 (Figure 7b). The PC2 describes stress tolerance indices which selection pattern is based on minimum values. Taken together, these findings suggest that heat tolerant genotypes would have high values for PC1 and low to intermediate values for PC2.
Under HSG, the combination of indices identified BJ01, BJ02, Fla.7236, CLN3212C, CLN1621L, CLN2498D, and CLN2026D as heat tolerant genotypes as opposed to P005, P068, P082, Pectomech, and CLN3024A (Figure 7a). Under HSO, BJ01, BJO2, CLN1621L, CLN2366B, Fla.7171, and P005 as heat tolerant as opposed to P068, P082, Pectomech, LA2662, CLN3212C, Fla.7236, and CLN2498D (Figure 7b). Under both long-term mild heat stress conditions, BJ01, BJO2, and CLN1621L were consistently identified as heat tolerant.

4. Discussion

Breeding for heat stress tolerance requires a comprehensive characterization and understanding of the target environments and the response of genotypes to the different types of heat regimes. In this study, we assessed the effects of long-term mild heat stress on tomatoes yield components, including fruit set, number of fruits per plant, fruit weight and fruit weight per plant with respect to optimal conditions and we used stress indices to identify heat tolerant genotypes. The genotypes were subjected to long-term mild and dry and long-term mild and humid heat stress conditions, and the optimal growing season. The growing conditions were defined by the combination of temperatures and relative humidity. Higher emphasis is often placed on temperatures in heat stress research compared to relative humidity (e.g., [19,31]). However, high relative humidity (above 70%) can aggravate the effect of high temperatures on crops [22,32,33]. More attention should therefore be paid to both temperature and relative humidity when screening for heat stress tolerance in tomato.
Yield and yield components of genotypes showed differential responses after exposure to the different heat stress regimes. All the genotypes showed reduced fruit setting under both heat stress regimes. Similar findings were reported by Peet et al. [22], confirming that both moderate and severe heat stress negatively affect tomato production. In general, decreases in performance of the tomato genotypes were found for the number of fruits per plant, fruit weight, and fruit weight per plant under both heat stress regimes compared to the optimal season trial. However, the genotypes CLN2026D, CLN3212C, and P005 demonstrated increased performance for the number of fruits per plant under either HSG or HSO in comparison to optimal season. Genotypes showing increased number of fruits per plant under heat stress compared to optimal season was also reported by Sherzod et al. [21]. This finding highlights the genotype-specific response of tomato to heat stress regimes.
The performance of the genotypes was generally better under long-term mild and dry heat stress (in the open field) than that recorded under long-term mild and humid heat stress (in the greenhouse). Plant growth in the greenhouse is expected to be less affected by other factors (abiotic and biotic). Higher performance was observed in the field compared to the greenhouse in our study, which could be due to the combination of moderately high temperatures with high relative humidity. Increased relative humidity coupled with increased temperatures results in severe heat stress. As relative humidity approaches 90%, tomato becomes more sensitive to high temperatures [22]. Severe heat stress has higher effects on tomato reproductive organs leading to low yield [22,34]. The performance of the genotypes in terms of fruit set percentage and the number of fruits per plant was lower under HSG than in HSO characterized by lower relative humidity. Increased relative humidity negatively affects pollen shedding and viability and germination and subsequently fruit setting and number of fruits per plant [22,33]. Lower fruit weight was also recorded under high humidity, consistent with the finding of Barker [34] who found that under similar temperature conditions, tomato grown under high relative humidity had lower average fruit weight and yield. High humidity induces reduction in leaf area and kinked trusses restricting phloem sap flow into the fruits and subsequently lead to the reduction of fruit weight [34]. Similarly, a temperature around 30 °C during reproductive stage reduced fresh and dry matter accumulation rates in tomato fruits [35], which could explain the lower fruit weight recorded under severe heat stress (HSG) in our study. The reduction in fruit weight per plant under stress conditions can be attributed to the reduction in fruit weight, fruit setting, and number of fruits per plants. P0068, and P082 were the most affected by heat stress and recorded the highest decrease in fruit set percentage, number of fruits per plant and fruit weight per plant under long-term mild heat stress conditions. The genotype P082 totally failed to set fruits under heat stress conditions. These genotypes produced low number of flowers and pollen, and had poor pollen viability along with splitting of the antheridial cone under heat stress, which resulted in low fruit setting [23].
The high fruit set percentage and number of fruits per plant of small fruited genotypes (e.g., BJ01, BJ02, and CLN1621L) have been reported in previous studies [23,24,36]. In the optimal season, the small fruited genotypes had the highest fruit set percentage and fruit weight per plant. The small size of the fruits of these genotypes is compensated by the number of fruits enabling them to achieve higher yield per plant than the genotypes of other fruit sizes. However, moderate to large fruit sizes are more preferred in the West African market and attract higher market value [37]. Consequently, from a practical point of view, breeding moderate to large fruited varieties with moderate fruit setting under heat stress could be more profitable for farmers than targeting high fruit set but small fruit size under heat stress. Hybrid breeding holds a promise in combining heat tolerance and improved fruit weight. In fact, fruit weight was reported to have partial dominance under heat stress [38] and crossing moderate to extra-large fruited genotypes with heat tolerant and small fruited genotypes would result in farmers and market preferred varieties.
Four genotypes previously identified as moderately sensitive (CLN2498D and CLN3212C) and highly sensitive to heat stress (Fla.7171 and P005) [23,24] recorded low average sums of ranks for the stress tolerance indices suggesting that they were heat tolerant. This finding is in line with the reported heat tolerance status of CLN2498D and CLN3212C rated as “moderate” and “good”, respectively, by the World Vegetable Center [39,40] and Fla.7171 developed and rated by the University of Florida as “heat tolerant” [41]. P005 was reported to be adapted to both rainy and off-seasons in Ghana [42], which implies that it may be heat tolerant as revealed in this study. Integrating genotypes performance data under optimal growing season provides new insight into the tolerance status of tomato genotypes. Interestingly, BJ01, BJ02, and CLN1621L previously reported as heat tolerant [19,23,24,43] was confirmed by the average sums of ranks of the stress tolerance indices and the outputs of the principal component analysis. These findings show the potential of stress tolerance in identifying heat tolerant tomato genotypes. There were discrepancies in the ranking of the genotypes between indices. This supports the idea of using several stress tolerance indices to increase the likelihood of identifying highly performing genotypes [28,44,45]. Besides, the differences in genotype ranking in the long-term heat stress conditions indicates that the genotypes responded differently to the heat stress conditions in terms of their fruit weight per plant. The mean productivity (MP), geometric mean productivity (GMP), and stress tolerance index (STI) were strongly correlated with the fruit weight per plant under optimal and heat stress conditions showing that the selection of genotypes based on MP, GMP, and STI will result in high fruit weight per plant under heat stress and optimal growing season. This finding implies that both optimal season and heat stress conditions can be used as testing environments for the selection of heat tolerant genotypes.

5. Conclusions

The study revealed that the heat stress regimes differently affect the performance of the tomato genotypes. The combination of severe heat stress characterized by a combination of high relative humidity and temperature was more detrimental to the plants. Regardless of the heat stress regimes, all the traits (fruit set percentage, number of fruits per plant, fruit weight, and fruit weight per plant) were negatively affected compared to the optimal season. In heat sensitive genotypes, heat stress causes a total fruit set failure and loss of yield. The combination of stress tolerance indices identified new heat tolerant tomato genotypes.

Supplementary Materials

The following are available online at https://www.mdpi.com/article/10.3390/horticulturae8020118/s1, Table S1: Means and standard deviation of yield parameters under optimal (OPT), heat stress in the greenhouse (HSG) and in open field (HSO) trials.

Author Contributions

Conception and design, M.A.T.A., A.D., P.H., E.Y.D. and I.K.A.; data curation and formal analysis, M.A.T.A.; preparation of original draft, M.A.T.A.; writing—review and editing, M.A.T.A., A.D., P.H., I.K.A. and E.Y.D.; supervision, A.D., P.H., I.K.A. and E.Y.D.; project administration, A.D. and E.Y.D.; funding acquisition, A.D. and E.Y.D. All authors have read and agreed to the published version of the manuscript.

Funding

This work is partially supported through the Africa Centers of Excellence for Development Impact (ACE Impact) project.

Institutional Review Board Statement

Not applicable.

Informed Consent Statement

Not applicable.

Data Availability Statement

The data presented in this study are available in this article and supplementary materials.

Acknowledgments

We acknowledge the C.M. Rick Tomato Genetic Resources Center (University of California, Davis), Crop Research Institute (Ghana), Florida Agricultural Experiment Station (University of Florida), and World Vegetable Center for providing germplasm for this study. The first author acknowledges the German Academic Exchange Service (DAAD) for funding his Ph.D. program. We are grateful to Thierry K. Tovignan and Frejus A. K. Sodedji for their comments on an earlier version of the manuscript.

Conflicts of Interest

The authors declare no conflict of interest.

Appendix A. Plant Husbandry

Appendix A.1. Greenhouse Trial (HSG)

Plants were raised in pots in a greenhouse at the experimental farm of the West Africa Centre for Crop Improvement (University of Ghana). Seeds were sowed on 4 October 2019 and transplanted 21 days later in five liters pots filled with a medium (Sandy-clay-loamy texture). Tecamin max (40 mL/15 L) was applied three days after transplanting to enhance seedling establishment and growth. Eforia (30 g/L Thiamethoxam + 15 g/L Lambda-Cyhalothrin, 50 mL/15 L of water) was applied for the control of aphids and Ridomil Gold (Mefenoxam, 45 mL/15 L), mancozeb (100 g/15 L water), and Nativo (Tebuconazole 50% + Trifloxystrobin 25% w/w, 75 g/15 L) as preventive measures for fungal diseases. NPK (15-15-15) was applied as basal fertilizer and 30 days after transplanting at a rate of 10 g per pot. Subsequently, calcium nitrate was applied twice at the rate of 10 g per plant (63 days and 78 days after transplanting). A foliar application of potassium nitrate (10 g/15 L water) was performed at 75 days after transplanting. Plants were adequately watered to avoid water stress.

Appendix A.2. Open Field Trial (HSO)

The trial was conducted from March to June 2020 in Zè on a ferrasol [46]. The seeds were nursed on 3 March 2020 and transplanted on 27 March 2020. Basal application of poultry manure and NPK (15-15-15) was done at a rate of 15 t/ha and 150 kg/ha, respectively. NPK, urea (46% N), and potassium sulphate were applied at the rate of 150 kg/ha, 100 kg/ha and 75 kg/ha, respectively. Insecticides K-optimal (Lambdacyhalothrin 15 g/L and Acetamiprid 20 g/L) and Top Bio (neem oil) were applied at the rate of 40 mL/15 L water to control insects. The fungicide mancozeb was applied as a preventive measure for fungi diseases at the rate of 100 g/15 L water. Mulching was used to reduce confounding effects related to increased soil temperature. The plants were not staked.

Appendix A.3. Optimal Season Trial (OPT)

The trial was conducted from July to November 2020 in Abomey-Calavi on a ferrasol [46]. The seeds were nursed on 18 July 2020 and the seedlings were transplanted on 7 August 2020. Poultry manure was applied in basal application at the rate of 15 t/ha. The NPK 13-17-17 was first applied at the rate of 150 kg/ha, 9 days after transplanting, followed by a second application at a rate of 150 kg/ha, 24 days after transplanting. TopBio (neem oil) was applied as preventive measure for pest attack at the rate of 40 mL/15 L of water. The plants were staked. Production took place under a screen house to protect plants against heavy precipitations.

References

  1. FAOSTAT FAOSATA. Available online: http://www.fao.org/faostat/en/#data/QC (accessed on 5 April 2021).
  2. Adimabuno, A.M. Marketing and Market Queens: A Study of Tomato Farmers in the Upper East Region of Ghana. Ph.D. Thesis, University of Bonn, Bonn, Germany, 2010; p. 175. [Google Scholar]
  3. Van Wesenbeeck, C.F.; Venus, V.; Keyzer, M.A.; Wesselman, B.; Asare Kye, D. Development of a Horticulture Production Chain in Western Africa: A Case Study of Tomatoes in Burkina Faso and Ghana; Centre for World Food Studies: Amsterdam, The Netherlands, 2014. [Google Scholar]
  4. Beecher, G.R. Nutrient Content of Tomatoes and Tomato Products. Exp. Biol. Med. 1998, 218, 98–100. [Google Scholar] [CrossRef]
  5. Fufa, F.; Hanson, P.; Dagnoko, S.; Dhaliwal, M. AVRDC—The world vegetable center tomato breeding in Sub-Saharan Africa: Lessons from the past, present work, and future prospects. Acta Hortic. 2011, 911, 87–98. [Google Scholar] [CrossRef]
  6. Robinson, E.J.Z.; Kolavalli, S.L. The Case of Tomato in Ghana: Productivity; International Food Policy Research Institute: Accra, Ghana, 2010. [Google Scholar]
  7. Amikuzuno, J.; von Cramon-Taubadel, S. Seasonal variation in price transmission between tomato markets in Ghana. J. Afr. Econ. 2012, 21, 669–686. [Google Scholar] [CrossRef]
  8. Schreinemachers, P.; Wu, M.H.; Uddin, M.N.; Ahmad, S.; Hanson, P. Farmer training in off-season vegetables: Effects on income and pesticide use in Bangladesh. Food Policy 2016, 61, 132–140. [Google Scholar] [CrossRef] [Green Version]
  9. Asgedom, S.; Struik, P.C.; Heuvelink, E.; Araia, W. Opportunities and constraints of tomato production in Eritrea. Afr. J. Agric. Res. 2011, 6, 956–967. [Google Scholar]
  10. Adeoti, R.; Koffi-Tessio, E.; Coulibaly, O.; Manyong, V.; Oloukoï, L. Spatial integration of Vegetable Markets in West Africa: Case of Tomato (Lycopersicum esculentum) between Benin and Burkina Faso. In Proceedings of the 4th International Conference of the African Association of Agricultural Economists, Hammamet, Tunisia, 22–25 September 2013; pp. 1–25. [Google Scholar]
  11. Mensah, A.C.G.; Assogba Komlan, F.; Yarou, B.; Aisso, C.B.R.; Eké, H.; Amadji, L.G. Quel type d ’abri pour mieux réussir la production de tomate de contre saison au Sud-Bénin? Bull. Rech. Agron. Bénin 2019, 205–217. Available online: https://www.researchgate.net/publication/340570349_Quel_type_d'abri_pour_mieux_reussir_la_production_de_tomate_de_contre_saison_au_Sud-Benin (accessed on 14 August 2021).
  12. Perez, K.; Froikin-Gordon, J.S.; Abdourhamane, I.K.; Levasseur, V.; Alfari, A.A.; Mensah, A.; Bonsu, O.; Habsatou, B.; Assogba-Komlan, F.; Mbaye, A.A.; et al. Connecting smallholder tomato producers to improved seed in West Africa. Agric. Food Secur. 2017, 6, 42. [Google Scholar] [CrossRef]
  13. Kugblenu, Y.O.; Danso, E.O.; Ofori, K.; Andersen, M.N.; Abenney-Mickson, S.; Sabi, E.B.; Plauborg, F.L.; Abekoe, M.K.; Jørgensen, S.T.; Jensen, C.R.; et al. Heat tolerance in field grown tomatoes (Lycopersicon esculentum Mill.) under semi-arid conditions of west Africa. Acta Hortic. 2013, 971, 99–106. [Google Scholar] [CrossRef]
  14. Kugblenu, Y.O.; Oppong-Danso, E.; Ofori, K.; Andersen, M.N.; Abenney-Mickson, S.; Sabi, E.B. Screening tomato genotypes for adaptation to high temperature in West Africa. Acta Agric. Scand. Sect. B Soil Plant. Sci. 2013, 63, 516–522. [Google Scholar] [CrossRef]
  15. Ayenan, M.A.T.; Danquah, A.; Hanson, P.; Ampomah-dwamena, C.; Sodedji, A.F.K.; Asante, I.K.; Danquah, E.Y. Accelerating Breeding for Heat Tolerance in Tomato (Solanum lycopersicum L.): An Integrated Approach. Agronomy 2019, 9, 720. [Google Scholar] [CrossRef] [Green Version]
  16. Driedonks, N.; Rieu, I.; Vriezen, W.H. Breeding for plant heat tolerance at vegetative and reproductive stages. Plant Reprod. 2016, 29, 67–79. [Google Scholar] [CrossRef] [Green Version]
  17. IPCC. Summary for Policymakers. An IPCC Special Report on the impacts of global warming of 1.5 °C above pre-industrial levels and related global greenhouse gas emission pathways, in the context of strengthening the global response to 2018. In Global Warming of 1.5 °C; Masson-Delmotte, V., Zhai, P., Pörtner, H.-O., Roberts, D., Skea, J., Shukla, P.R., Pirani, A., Moufouma-Okia, W., Péan, C., Pidcock, R., et al., Eds.; World Meteorological Organization: Geneva, Switzerland, 2018. [Google Scholar]
  18. Perkins-Kirkpatrick, S.E.; Lewis, S.C. Increasing trends in regional heatwaves. Nat. Commun. 2020, 11, 1–8. [Google Scholar] [CrossRef]
  19. Ro, S.; Chea, L.; Ngoun, S.; Stewart, Z.P.; Roeurn, S.; Theam, P.; Lim, S.; Sor, R.; Kosal, M.; Roeun, M.; et al. Response of tomato genotypes under different high temperatures in field and greenhouse conditions. Plants 2021, 10, 449. [Google Scholar] [CrossRef]
  20. Vijayakumar, A.; Shaji, S.; Beena, R.; Sarada, S.; Sajitha Rani, T.; Stephen, R.; Manju, R.V.; Viji, M.M. High temperature induced changes in quality and yield parameters of tomato (Solanum lycopersicum L.) and similarity coefficients among genotypes using SSR markers. Heliyon 2021, 7, e05988. [Google Scholar] [CrossRef]
  21. Sherzod, R.; Yang, E.Y.; Cho, M.C.; Chae, S.Y.; Chae, W.B. Physiological traits associated with high temperature tolerance differ by fruit types and sizes in tomato (Solanum lycopersicum L.). Hortic. Environ. Biotechnol. 2020, 61, 837–847. [Google Scholar] [CrossRef]
  22. Peet, M.; Sato, S.; Clémente, C.; Pressman, E. Heat stress increases sensitivity of pollen, fruit and seed production in tomatoes (Lycopersicon esculentum mill.) to non-optimal vapor pressure deficits. Acta Hortic. 2003, 618, 209–215. [Google Scholar] [CrossRef]
  23. Ayenan, M.A.T.; Danquah, A.; Hanson, P.; Asante, I.K.; Danquah, E.Y. Identification of new sources of heat tolerance in cultivated and wild tomatoes. Euphytica 2021, 217, 33. [Google Scholar] [CrossRef]
  24. Ayenan, M.A.T.; Danquah, A.; Agre, P.A.; Hanson, P.; Asante, I.K.; Danquah, E.Y. Genomic and phenotypic diversity of cultivated and wild tomatoes with varying levels of heat tolerance. Genes 2021, 12, 503. [Google Scholar] [CrossRef]
  25. Kassambara, A. “ggplot2” Based Publication Ready Plots. R Package Version 0.2.5. Available online: https://CRAN.R-project.org/package=ggpubr (accessed on 24 March 2021).
  26. Wobbrock, J.O.; Findlater, L.; Gergle, D.; Higgins, J.J. The Aligned Rank Transform for Nonparametric Factorial Analyses Using Only ANOVA Procedures. In Proceedings of the ACM Conference on Human Factors in Computing Systems (CHI ’11), Vancouver, Canada, 7–12 May 2011; pp. 143–146. [Google Scholar]
  27. Wickham, H. ggplot2: Elegant Graphics for Data Analysis; Springer: New York, NY, USA, 2016. [Google Scholar]
  28. Pour-Aboughadareh, A.; Yousefian, M.; Moradkhani, H.; Moghaddam Vahed, M.; Poczai, P.; Siddique, K.H.M. iPASTIC: An online toolkit to estimate plant abiotic stress indices. Appl. Plant. Sci. 2019, 7, 1–6. [Google Scholar] [CrossRef] [Green Version]
  29. Kassambara, A.; Mundt, F. factoextra: Extract and Visualize the Results of Multivariate Data Analyses. R Package Version 1.0.6. Available online: https://CRAN.R-project.org/package=factoextra (accessed on 24 March 2021).
  30. R Core Team R: A Language and Environment for Statistical Computing; R Foundation for Statistical Computing: Vienna, Austria, 2021; Available online: https://www.R-project.org/ (accessed on 24 March 2021).
  31. Bhattarai, S.; Harvey, J.; Djidonou, D.; Leskovar, D. Exploring Morpho-Physiological Variation for Heat Stress Tolerance in Tomato. Plants 2021, 10, 347. [Google Scholar] [CrossRef]
  32. Tashiro, T.; Wardlaw, I. The Response to High Temperature Shock and Humidity Changes Prior to and During the Early Stages of Grain Development in Wheat. Funct. Plant. Biol. 1990, 17, 551. [Google Scholar] [CrossRef]
  33. Harel, D.; Fadida, H.; Slepoy, A.; Gantz, S.; Shilo, K. The Effect of Mean Daily Temperature and Relative Humidity on Pollen, Fruit Set and Yield of Tomato Grown in Commercial Protected Cultivation. Agronomy 2014, 4, 167–177. [Google Scholar] [CrossRef]
  34. Barker, J.C. Effects of day and night humidity on yield and fruit quality of glasshouse tomatoes (Lycopersicon esculentum Mill.). J. Hortic. Sci. 1990, 65, 323–331. [Google Scholar] [CrossRef]
  35. Ruiz-Nieves, J.M.; Ayala-Garay, O.J.; Serra, V.; Dumont, D.; Vercambre, G.; Génard, M.; Gautier, H. The effects of diurnal temperature rise on tomato fruit quality. Can the management of the greenhouse climate mitigate such effects? Sci. Hortic. 2021, 278, 109836. [Google Scholar] [CrossRef]
  36. Dane, F.; Hunter, A.G.; Chambliss, O.L. Fruit Set, Pollen Fertility, and Combining Ability of Selected Tomato Genotypes under High- temperature Field Conditions. J. Am. Soc. Hort. Sci. 1991, 116, 906–910. [Google Scholar] [CrossRef]
  37. Ayenan, M.A. DLB Product Profile—High-yielding Hot-Set Tomato Hybrid (Benin). Available online: https://www.demandledbreeding.org/sites/g/files/zhg1501/f/2020/08/16/product_profile_handout_tomato_benin_a4.pdf (accessed on 12 August 2021).
  38. Scott, J.W.; Volin, R.B.; Bryan, H.H.; Olson, S.M. Use of Hybrids to Develop Heat Tolerant Tomato Cultivars. Proc. Fla. State Hortic. Soc. 1986, 99, 311–314. [Google Scholar]
  39. AVRDC (World Vegetable Center). Fresh Market Tomato, Lines Developed at the World Vegetable Center. AVTO0301 (CLN2498D). Available online: https://avrdc.org/download/seed/cat-fresh-mark-tomato/AVTO0301.pdf (accessed on 15 August 2021).
  40. AVRDC (World Vegetable Center). Fresh Market Tomato, Lines Developed at the World Vegetable Center. AVTO1314 (CLN3212C). Available online: https://avrdc.org/download/seed/AVTO_1314.pdf (accessed on 15 August 2021).
  41. University of Florida Released Germplasm. Available online: https://tombreeding.ifas.ufl.edu/relsgerm.htm#Heat-Tolerant (accessed on 16 October 2021).
  42. Osei, M.K.; Danquah, E.; Danquah, A.; Blay, E.; Adu-Dapaah, H. Hybridity testing of tomato F1 progenies derived from parents with varying fruit quality and shelf life using single nucleotide polymorphism (SNPs). Sci. Afr. 2020, 8, e00267. [Google Scholar] [CrossRef]
  43. AVRDC (World Vegetable Center). Fresh Market Tomato, Lines Developed at the World Vegetable Center. AVTO9801 (CLN1621L). Available online: https://avrdc.org/download/seed/cat-process-tomato/AVTO9801.pdf (accessed on 15 August 2021).
  44. Basavaraj, P.S.; Gireesh, C.; Bharamappanavara, M.; Manoj, C.A.; Ishwarya Lakshmi, V.G.; Honnappa; Ajitha, V.; Senguttuvel, P.; Sundaram, R.M.; Anantha, M.S. Stress tolerance indices for the identification of low phosphorus tolerant introgression lines derived from Oryza rufipogon Griff. Plant. Genet. Resour. Characterisation Util. 2021, 19, 328–338. [Google Scholar] [CrossRef]
  45. Mohammadi, R. Efficiency of yield-based drought tolerance indices to identify tolerant genotypes in durum wheat. Euphytica 2016, 211, 71–89. [Google Scholar] [CrossRef]
  46. WRB. International Soil Classification System for Naming Soils and Creating Legends for Soil Maps; World Soil Resources Reports No. 106; FAO: Rome, Italy, 2015. [Google Scholar]
Figure 1. Pairwise comparison of (a) daytime temperatures, (b) nighttime temperatures, (c) daytime relative humidity and (d) nighttime relative humidity between greenhouse (HSG), open field (HSO) and optimal season (OPT). Each spot represents data point for a day from flowering to fruiting. “****” and “**” denotes that the means were significantly different at p < 0.0001 and p < 0.01, respectively.
Horticulturae 08 00118 g001
Figure 2. Fruit set percentage of the genotypes under long term mild and humid heat stress (HSG), long term mild and dry heat stress (HSO) and optimal growing season (OPT).
Horticulturae 08 00118 g002
Figure 3. Number of fruits per plant of the genotypes under long term mild and humid heat stress (HSG), long term mild and dry heat stress (HSO) and optimal growing season (OPT).
Horticulturae 08 00118 g003
Figure 4. Fruit weight of the genotypes under long term mild and humid heat stress (HSG), long term mild and dry heat stress (HSO) and optimal growing season (OPT).
Horticulturae 08 00118 g004
Figure 5. Fruit weight per plant of the genotypes under long term mild and humid heat stress (HSG), long term mild and dry heat stress (HSO) and optimal growing season (OPT).
Horticulturae 08 00118 g005
Figure 6. Correlogram showing the association between fruit weight per plant under long term mild heat stress (Ys), optimal growing season (Yp) and stress tolerance indices in the greenhouse (a) and open field (b). The size of circle depicts the strength of the correlation, bigger the circle stronger the association. STI, stress tolerance index; TOL, tolerance index; SSI, stress susceptibility index; RSI, relative stress index; YSI, yield stability index; YI, yield index; HM, harmonic mean; MP, Mean productivity; GMP, geometric mean productivity.
Horticulturae 08 00118 g006
Figure 7. Biplot of genotypes and fruit weight per plant under heat stress (Ys), optimal growing season (Yp) and stress tolerance indices in the greenhouse (a) and open field (b) based on PC1 and PC2. STI, stress tolerance index; TOL, tolerance index; SSI, stress susceptibility index; RSI, relative stress index; YSI, yield stability index; YI, yield index; HM, harmonic mean; MP, Mean productivity; GMP, geometric mean productivity.
Horticulturae 08 00118 g007aHorticulturae 08 00118 g007b
Table 1. Plant materials.
GenotypesFruit Size Category aHeat Tolerance Status
BJ01SmallHighly tolerant
BJ02SmallHighly tolerant
CLN1621LSmallModerately tolerant
CLN3024AMediumHighly sensitive
CLN2366BMediumModerately tolerant
CLN2026DMediumModerately tolerant
PectomechMediumHighly sensitive
LA2662MediumModerately tolerant
P068MediumHighly sensitive
P082LargeHighly sensitive
P005LargeHighly sensitive
CLN3212CLargeModerately sensitive
CLN2498DLargeModerately sensitive
Fla.7236Extra largeHighly sensitive
Fla.7771Extra largeHighly sensitive
Fla.7171Extra largeHighly sensitive
a Extra large: >110 g/fruit, Large: >80 g/fruit, Moderate: >40 g/fruit, Small: <40 g/fruit. The size catgory is based on optimal growing conditions.
Table 2. Temperatures and relative humidity in two long term mild heat stress and non-stress trials.
TrialDay Temperature (°C)Night Temperatures (°C)Day Relative Humidity (%)Night Relative Humidity (%)
Greenhouse (HSG)30.0 ± 1.526.2 ± 0.777.6 ± 5.897.2 ± 1.7
Open field (HSO)31.5 ± 1.428.9 ± 1.366.7 ± 7.677.8 ± 9.6
Optimal season (OPT)28.4 ± 0.823.7 ± 0.971.0 ± 3.690.4 ± 2.2
Table 3. Genotypes ranking patterns based on fruit weight per plant under HSG and OPT, and stress tolerance indices.
GenotypesYpYsTOLMPGMPHMSSISTIYIYSIRSIARSD
BJ01549443544554.71.6
BJ021716127132713137.55.6
Fla.72364615555756776.53.0
Fla.777171114891110911101010.01.8
Fla.71716913788989998.61.7
P08216164161616161616161614.93.6
P00511148141414141414141413.21.9
P06815155151515151515151514.13.0
CLN3212C3211332432443.72.5
CLN1621L1032664263224.22.6
CLN3024A91212101212121212121211.51.0
CLN2366B810109101081010889.21.0
CLN2498D217211311332.31.8
CLN2026D14511176175115.44.3
Pectomech12136131313111313111111.72.1
LA26621383121196118668.53.1
Fruit weight per plant under heat stress (Ys) and optimal growing season (Yp); STI, stress tolerance index; TOL, tolerance index; SSI, stress susceptibility index; RSI, relative stress index; YSI, yield stability index; YR, yield reduction ratio; YI, yield index; HM, harmonic mean; GMP, geometric mean productivity; AR, Average average sum of ranks; SD, Standard deviation.
Table 4. Genotypes ranking patterns based on fruit weight per plant under HSO and OPT, and stress tolerance indices.
GenotypesYpYsTOLMPGMPHMSSISTIYIYSIRSIARSD
BJ01524222322332.71.0
BJ02113111211221.50.7
Fla.72364131571013131013131311.33.3
Fla.77717711545847886.72.1
Fla.7171631333133112.51.5
P082161612161616161616161615.61.2
P0051142864464445.22.5
P06815127151312913129911.52.6
CLN3212C31516101515151515151513.53.8
CLN1621L1056977675666.71.6
CLN3024A91413121414141414141413.31.6
CLN2366B8610656756776.61.4
CLN2498D210144891281012129.23.6
CLN2026D14851198598557.92.9
Pectomech12119131110111111111111.01.0
LA2662139814121110129101010.71.8
Fruit weight per plant under heat stress (Ys) and optimal growing season (Yp); STI, stress tolerance index; TOL, tolerance index; SSI, stress susceptibility index; RSI, relative stress index; YSI, yield stability index; YR, yield reduction ratio; YI, yield index; HM, harmonic mean; GMP, geometric mean productivity; AR, Average average sum of ranks; SD, Standard deviation.
Publisher’s Note: MDPI stays neutral with regard to jurisdictional claims in published maps and institutional affiliations.

