Article

Assessment of the Breeding Potential of a Set of Genotypes Selected from a Natural Population of Akebia trifoliata (Three–Leaf Akebia)

State Key Laboratory of Plant Breeding and Genetics, Sichuan Agricultural University, Chengdu 611130, China
*
Author to whom correspondence should be addressed.
Horticulturae 2022, 8(2), 116; https://doi.org/10.3390/horticulturae8020116
Submission received: 23 December 2021 / Revised: 19 January 2022 / Accepted: 24 January 2022 / Published: 27 January 2022

Abstract

:
Akebia trifoliata (three-leaf akebia) has long been used as a medicinal herb and has the potential to be used in diverse ways, especially as a fruit crop. However, efforts to domesticate and cultivate new varieties for commercial use are only in their infancy. Here, we evaluated the genetic diversity of 29 genotypes, which were previously selected from a natural population consisting of 1447 genotypes and exhibiting high resistance to fungal diseases and a smooth peel of A. trifoliata using 85 genome-specific single sequence repeat (SSR) markers. We also characterized variation in 19 phenotypic traits and nutritional components. Large variation in phenotypic traits and nutritional components was observed, especially in vitamin C, seed/pulp, and fruit color. Correlation analyses revealed that many phenotypic traits and nutritional components were significantly correlated. A principal component analysis identified five principal components, which explained 83.2% of the total variation in the data. The results of the SSR analysis revealed that 80 of the 85 SSR markers were polymorphic; the total number of alleles amplified was 532. The expected heterozygosity was 0.672, and Shannon’s information index was 1.328. A Ward dendrogram and unweighted pair group method with arithmetic mean dendrogram revealed high diversity among the 29 genotypes and suggested that the measured morphological and nutritional traits were genetically independent of disease resistance and texture traits, as well as SSR marker loci. Finally, our results suggest that additional rounds of selection from the selected population, despite its small size, could be effective for the development of new A. trifoliata fruit cultivars.

1. Introduction

Akebia trifoliata (three-leaf akebia) is a woody perennial climbing vine in the family Lardizabalaceae [1] that is used in traditional Chinese medicine [2,3]. It also has the potential to be bred as a new edible fruit [4], a future oil crop [5], and ornamental plant [6]. A. trifoliata is a popular medicinal plant that has been widely used in East Asia for at least 2000 years, and it was recently listed in the national pharmacopeias of China [7], Japan [8], and Korea [9]. A. trifoliata has also received much attention from researchers for the high content and quality of oil in its seeds, and some studies have suggested that A. trifoliata could be used as an oil crop in the future [10,11]. A. trifoliata has been cultivated as an ornamental plant for its bright flowers, diverse shapes, colorful fruit, elegant vines, and evergreen leaves in Japan [12], the United States [13], and China [6]. In addition, the fruit of A. trifoliata has been used as an ingredient in skin care products as well as a source of pectin, vinegar, and industrial raw materials [5,14].
Perhaps the most important future use of A. trifoliata might be as a fruit. The earliest study to examine the potential value of A. trifoliata as a fruit crop was conducted at the Shanxi Fruit Research Institute of China in 1971 [4]. Since then, various studies have investigated the cultivation [15], fruit development [16], and fruit storage [17] of A. trifoliata. Recent morphological trait analyses have shown that the genetic diversity of A. trifoliata is high, and several excellent genotypes with improved fruit quality such as larger fruit size, thinner peel, and high edible proportion have been obtained by recurrent selection [18,19]. Both scientists and entrepreneurs have recognized the potential scientific and economic value of A. trifoliata fruit [20,21]; however, efforts to domesticate and develop new varieties of A. trifoliata have only been recently initiated.
Several problems such as fungal diseases and loss of genetic diversity need to be overcome during the domestication of wild plants so that they can be cultivated on a large scale. Although efforts to domesticate and cultivate A. trifoliata are only in their infancy, various diseases such as fruit dry rot caused by Nigrospora oryzae [22], leaf spot caused by Phytophthora nicotianae [23], and anthracnose caused by Colletotrichum gloeosporioides [24] have been documented in artificial gardens with A. trifoliata, and these diseases greatly damage fruit quality and impede its cultivation on commercial scales. Thus, the resistance of A. trifoliata to these fungal pathogens should be an important target of selection during its domestication [25]. In addition, the texture of the peel is another factor that affects the acceptability of fruit by consumers and the economic value of fruit products [26]. Therefore, both disease resistance and fruit texture are important traits that should be prioritized early in the domestication process of A. trifoliata over other characteristics such as fruit morphology, flavor, and nutritional quality.
Abundant genetic diversity is a prerequisite for the development of new varieties [19]. However, genetic diversity tends to be reduced during domestication because of selective pressures, such as pathogens [27] and climate [28], as well as genetic drift [29], which can affect the effectiveness of subsequent stages of the domestication process. Hence, evaluating the genetic diversity of secondary populations selected from wild and natural populations is critically important for ensuring the efficacy of selection during domestication. Although previous studies have suggested that both molecular markers such as simple sequence repeats (SSRs) and phenotypic characters are powerful tools for estimating the genetic diversity of A. trifoliata [19,30], these studies generally examined few variants and used a low number of SSR markers and plant samples; in addition, the regional sampling of plants was narrow in most of these previous studies.
In this study, we evaluated the genetic diversity of 29 genotypes that had been previously selected for disease resistance and fruit texture characters from a natural population of 1447 genotypes collected from various regions in China. We also evaluated the potential for new cultivars to be obtained through further selection of this set of 29 genotypes.

2. Materials and Methods

2.1. Plant Material and Culture Conditions

The 1447 wild genotypes of A. trifoliata were collected from five provinces along the Yangtze River in China, including Sichuan, Hunan, Guizhou, Jiangxi, and Chongqing (Figure 1a), and were planted in 2015 in the Germplasm Nursery at Sichuan Agricultural University Chongzhou Research Station (30°43′ N, 103°65′ E; 521–530 m above sea level) (Figure 1b,c). The study region features a subtropical monsoon climate (annual average temperature, 17.5 °C; average annual rainfall, 1350–1575 mm), which is conducive to the spread of fungal diseases. The first round of selection was performed in July 2018. According to the results of three tests of fungal resistance conducted in May (fruit shape stabilization stage), June (late fruit expansion stage), and July (end of fruitexpansion stage) in 2018 [31], only 239 genotypes showed intermediate to strong resistance to powdery mildew, leaf spot, and anthracnose. Only 29 of these 239 genotypes were saved following the second round of selection on texture characters during fruit ripening from early August to October in 2018. All cloned lines of the 29 genotypes were planted in a randomized complete block design (2 m × 3 m spacing) with three replicates, each of which had 10 individuals of each genotype.

2.2. Phenotypic Evaluation

Three ripe fruits from each individual and three individuals from each replicate were randomly selected. The mean of nine fruits represented the observed or measured value of a given genotype in a replicate, and the mean of three replicates was used to represent the observed or measured value of the phenotypic traits of a given genotype. Eleven phenotypic traits including ripening date (GP), fruit color (FC), fruit shape (FS), fruit weight (FW), peel weight (PW), seed weight (SW), pericarp thickness (PT), longitudinal diameter (LD), transverse diameter (TD), proportion of seeds (Pos), and edible proportion (EP) were assessed. FW, PW, and SW were weighed using an electronic balance with 0.01 g accuracy, and PT, LD, and TD were measured using digital calipers with 0.1 mm accuracy [32]. Formulas for Pos and EP were as follows: Pos = SW/FW × 100% and EP = (FW − PW − SW)/FW × 100%. The fruit developmental stage of each genotype was also recorded.

2.3. Analysis of Nutritional Components

The main nutritional components, including reducing sugar (RS), protein (Pro), vitamin C (VC), total flavonoids (TF), titratable acid (TA), total free amino acids (TFAAs), and total hydrolyzed amino acids (THAAs), in the fruit of 29 genotypes were measured to determine the nutritional value of A. trifoliata as a fruit crop. The RS and TA content in 2 g of A. trifoliata pulp was measured following previously described methods [33]. The classical protocol recommended by Lee et al. [34] and the distillation micro-Kjeldahl method described by Oyeleke [35] were used to determine the content of VC and Pro, respectively.

2.3.1. TF Content

A mixture of 2 g of pulp with 10 mL of 70% aqueous ethanol solution was sonicated for 30 min (20 kHz, KQ-300DE, ShuMei, Shanghai, China). The liquid was then placed into a 50 mL volumetric flask, and the process was repeated three times; ethanol solution was added until the total volume was 50 mL. Next, 10 mL of supernatant liquid was transferred into a 25 mL volumetric flask, and 2 mL of 5% NaNO2, 2 mL of 10% AlCl3, and 6 mL of 1 M NaOH were sequentially added at an interval of 6 min; 70% aqueous ethanol solution was added until the total volume was 25 mL. After 10 min, 2 mL of solution from the 25 mL volumetric flask was used to detect the absorbance at 510 nm using a spectrophotometer (UV-2401, Shimadzu Co., Tokyo, Japan); rutin was used as the standard to make the calibration curve.

2.3.2. TFAA Content

To determine the TFAA content, approximately 2 g of homogenized pulp was mixed with 1 mL of 15% salicylsulfonic acid and then left to stand for 1 h at room temperature. The TFAAs were separated using an amino acid analyzer (L-8900; Hitachi Co., Tokyo, Japan) equipped with a chromatographic column (855-4507; Hitachi Co., Japan) and operated with a pH-dependent lithium buffer gradient elution procedure at wavelengths of 570 and 440 nm for 148 min. To determine the THAA content, approximately 2 g of homogenized pulp was mixed with 10 mL of 6.0 mol L−1 HCl in a glass tube at 110 °C for 24 h for hydrolysis. After being cooled, the mixture was filtered, and deionized water was added until the total volume was 25 mL. Next, 1 mL of filtrate was evaporated to dryness, and then the dried filtrate was moistened with 1 mL of deionized water and filtered with a 0.45 µm Millipore filter with a pH-dependent sodium buffer gradient elution procedure at a wavelength of 550 nm for 100 min. Seventeen amino acids (MembraPure, Berlin, Germany) were used as standard samples.

2.4. Evaluation of SSR Markers

Genomic DNA was extracted from 0.2 g leaf samples from the parent plant using the modified cetyltrimethylammonium bromide method [36]. A total of 85 pairs of genome-specific SSR markers were developed based on the 150 bp sequences of the regions flanking the SSR loci using two PERL scripts ‘p3_in.pl’ and ‘p3_out.pl’ provided by the MISA package; these markers were then used for genotyping. Polymerase chain reaction (PCR) was carried out in a PTC-200 thermal cycler (MJ Research, Waltham, MA, USA) with the following program: 3 min at 95 °C; 34 cycles of 15 s at 95 °C, 15 s at the annealing temperature, and 2 min 30 s at 72 °C; and a final step of 5 min at 72 °C [37]. The PCR-amplified products were run on an 8% denaturing polyacrylamide gel with the Sequi-Gen GT System (Bio-Rad, Hercules, CA, USA) at constant power (110 V) for 1.5 h. Silver staining was conducted following a previously published protocol [38], and the 50 bp DNA ladder was used as the size standard (Promega, Madison, WI, USA).

2.5. Data Analysis

The means of the traits were calculated and used for correlation analyses and principal component analysis (PCA), which were conducted in SPSS software [39]. The minimum value, maximum value, standard deviation (SD), and coefficient of variation (CV; SD/mean × 100) were calculated for the measured traits. Shannon’s information index (I) was used as a variability index. A cluster analysis using Ward’s method was conducted in PAST statistics software [40] to characterize patterns of variation among genotypes; a Ward dendrogram based on all the variables measured indicated morphological similarities among genotypes. A scatter plot of principal component 1 (PC1) vs. PC2 was created using PAST statistics software. The polymorphic information content (PIC), number of observed alleles (Na), number of effective alleles (Ne), Shannon’s information index (I), observed heterozygosity (Ho), expected heterozygosity (He), and Nei’s genetic distance (NGD) were calculated using PopGene32 and GenALEx6.41 software [41,42].

3. Results

3.1. Diversity of Phenotypic Traits

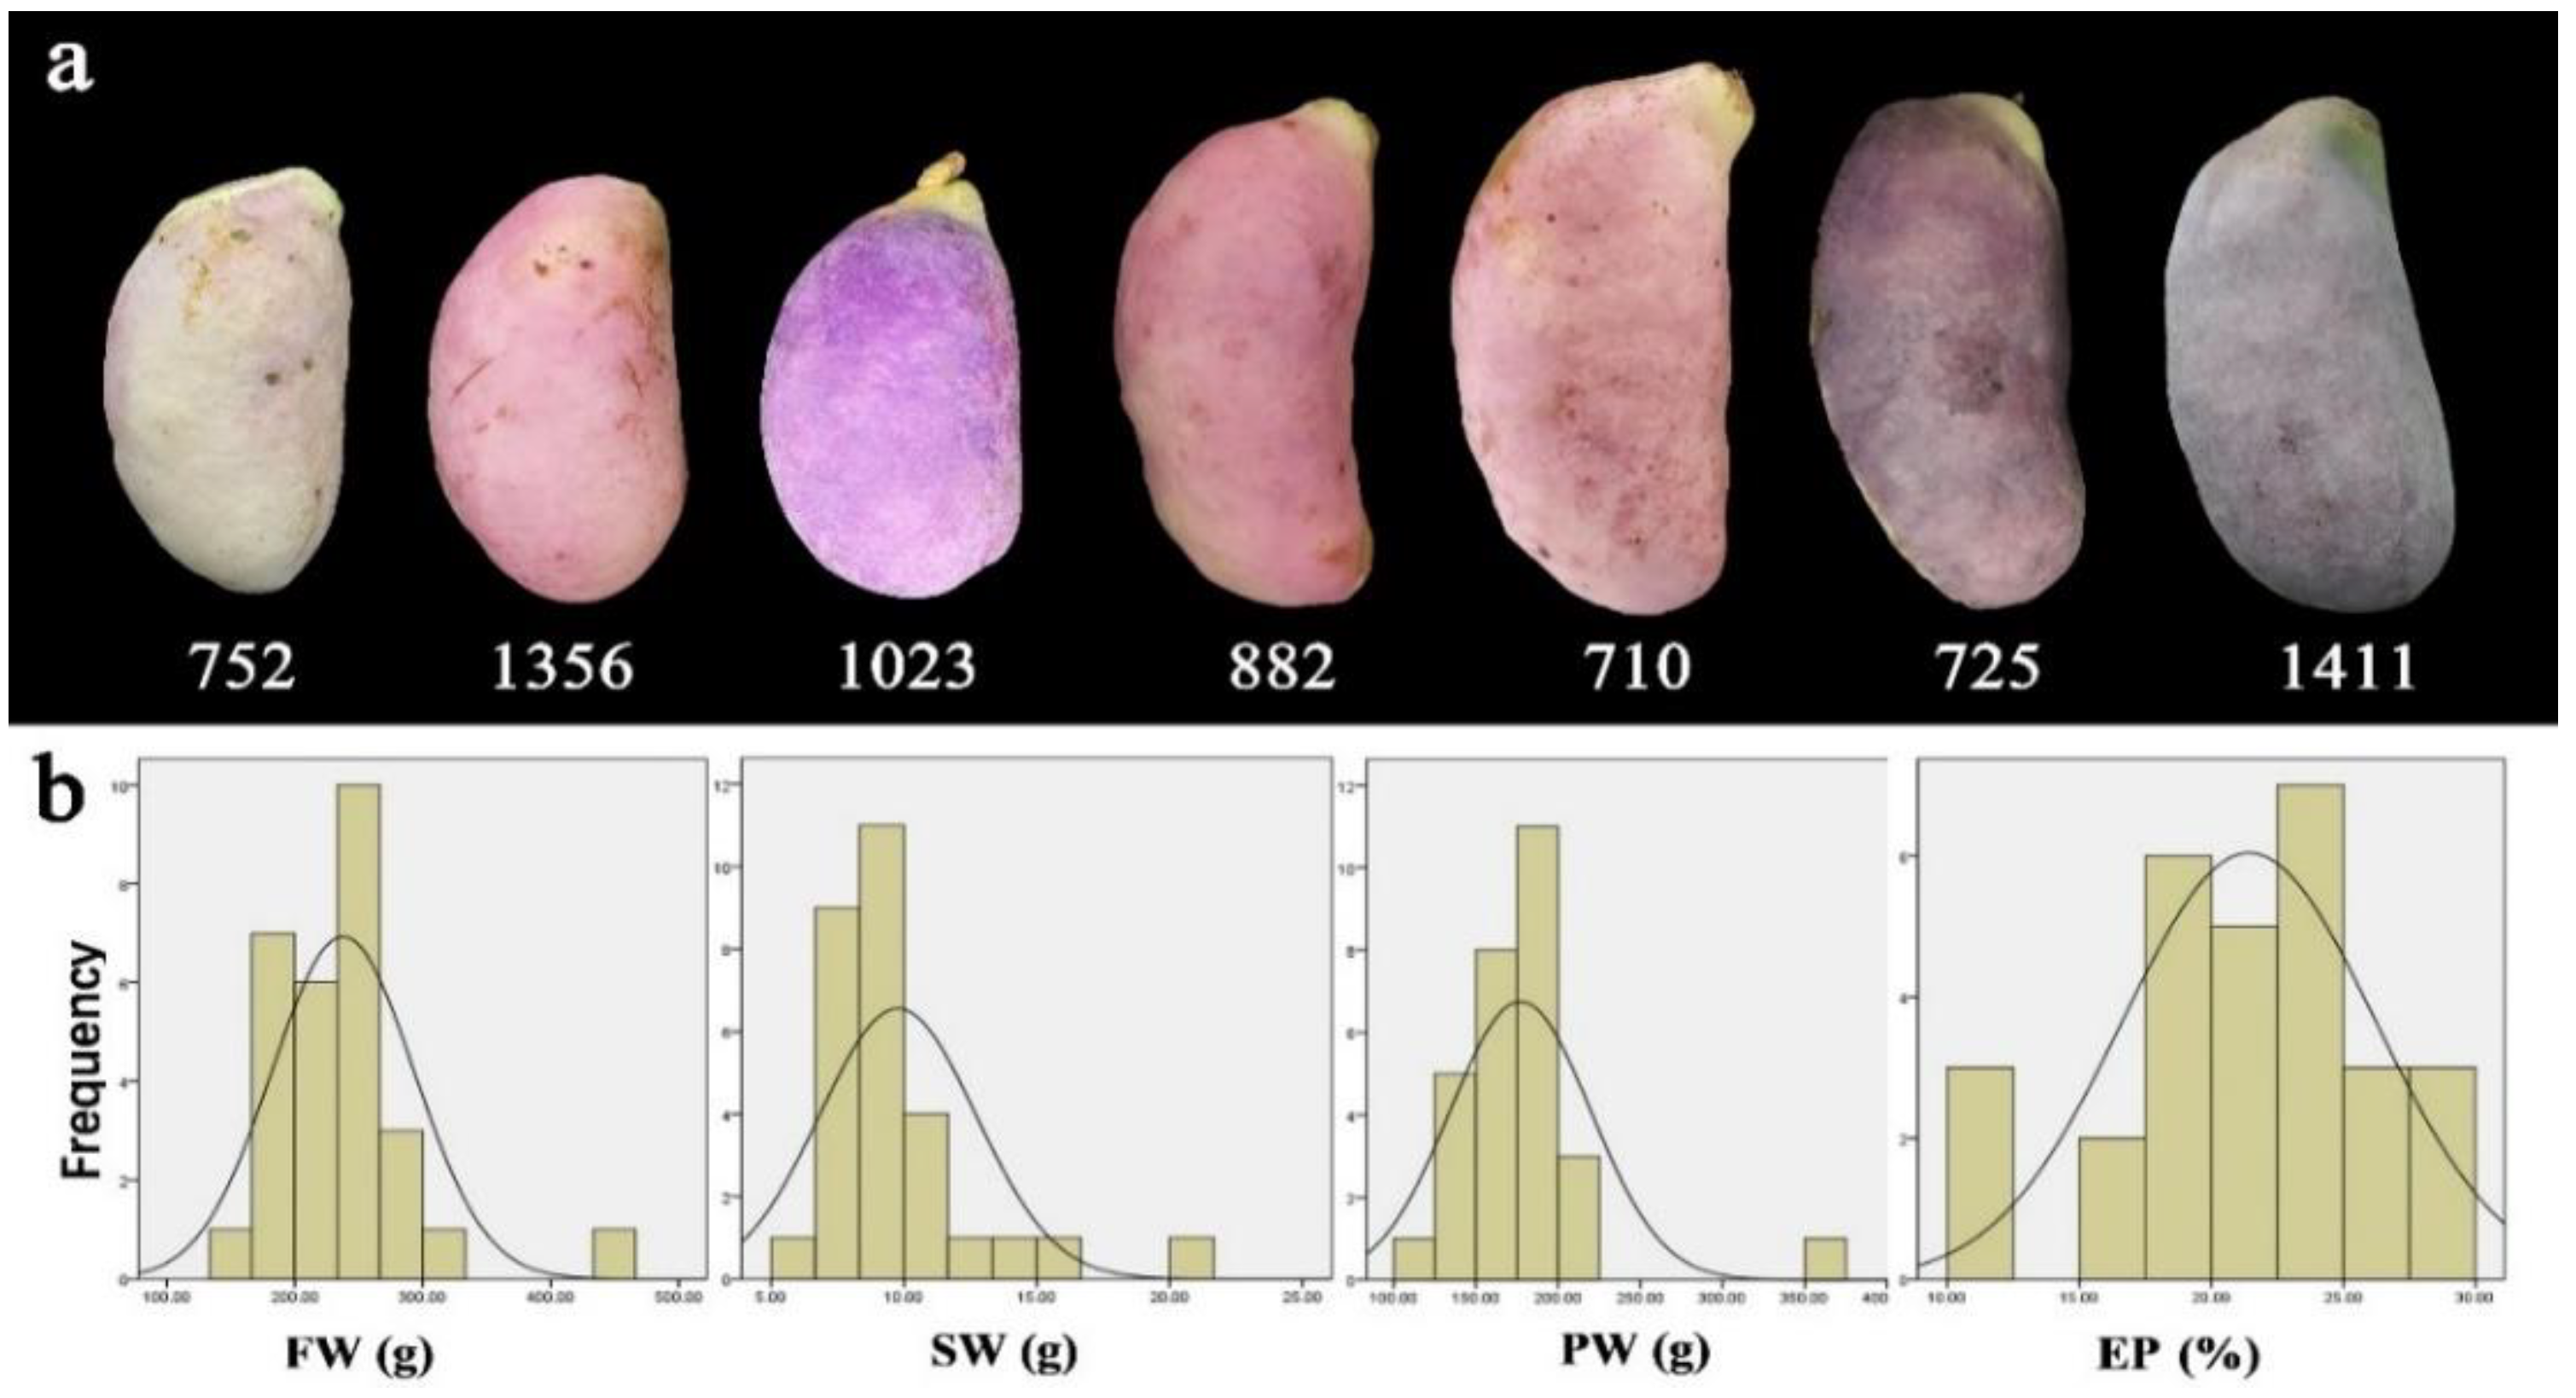
Images of A. trifoliata fruit show clear differences in FS, FC, and fruit size (Figure 2a). Descriptive statistics (Min, Max, mean, SD, CV, and I) of the phenotypic traits, including GP, FC, FS, FW, PW, SW, PT, LD, TD, Pos, and EP, are summarized in Table 1. There were pronounced differences in many traits among the 29 genotypes; I for 10 out of 12 phenotypic traits was greater than 2, although half of the corresponding CVs of these 10 traits were less than 20%. The other two traits (FC and FS) had CVs greater than 40%, but I of FC and FS was less than 2 (Table 1). The variation in FW, PW, SW, and EP was high because their values of I were greater than 2, and their CVs were also greater than 20%.
Analysis of the distributions of FW, PW, SW, and EP revealed that only the distribution of EP was normal (p = 0.202) (Figure 2b). Among the 29 genotypes, the mean FW was 237.7 g (CV = 23%, I = 2.54), and it ranged from 135.2 g to 446.9 g; the mean EP was 21.4 (CV = 22%, I = 2.73), and it ranged from 10.7% to 29.5%.

3.2. Diversity of Nutritional Components

All seven indexes indicated that there was large variation in nutritional components among the 29 genotypes (Table 1). I was greater than 2 for all components except TF. Phenotypic diversity for three important nutritional components—VC, RS, and TFAAs—of fruit was high based on the CVs greater than 20% and I values greater than 2. Specifically, the mean VC was 18.4 mg/100 g (CV = 60.3%, I = 2.13), and it ranged from 6.72 to 54.4 mg/100 g; the mean RS was 13 g/100 g (CV = 21.5%, I = 2.82), and it ranged from 8.71 to 18.2 g/100 g; the mean TFAA content was 706.4 ng/mg (CV = 40.7%, I = 2.57), and it ranged from 312.4 to 1443.1 ng/mg. Although the I for TF was less than 1, TF had the highest CV (151.6%), and it ranged from 1.0 to 29.1 mg/g, with a mean of 3.55 mg/g. The TA content was generally low in A. trifoliata fruits but varied greatly among the 29 genotypes (Table 1). Among these four important nutritional characters, only the distribution of the RS data was normal (p = 0.146) (Supplementary Figure S1).

3.3. Relationships among Morphological and Nutritional Traits

Out of a total of 120 correlations among 16 morphological and nutritional traits assessed, 16 correlations were significant (p < 0.001), and 14 of these correlations were positive (Table 2). There were 11, 1, and 4 significant coefficients for relationships between two morphological traits (36 total correlations), between two nutritional traits (21 total correlations), and between one morphological and one nutritional trait (63 total correlations), respectively. There were 11 significant coefficients among the nine morphological traits, which involved FW, PW, LD, TD, and SW. For example, FW was significantly positively correlated with PW (r = 0.96), LD (r = 0.92), TD (r = 0.76), and SW (r = 0.69). There was only one significant coefficient among the seven nutritional traits. There were four significant coefficients among the phenotypic and nutritional traits, which involved TD, LD, EP, VC, and TF. EP was significantly negatively correlated with both S/P (r = −0.79) and TFAAs (r = −0.57). VC were significantly positively correlated with LD (r = 0.64); TF were significantly positively correlated with TD (r = 0.61) and VC (r = 0.63); TFAAs were significantly positively correlated with S/p (r = 0.56). There were no significant correlations between TA and other traits as well as THAAs and other traits, except Pos.

3.4. Principal Component Analysis

According to the scree plot (Figure S2), there were five principal components (PCs) generated by the PCA, which explained 83.2% of the total variance (Table 3). PC1 explained 35.9% of the total variance, and FW, PW, LD, TD, and SD were the traits that loaded most heavily on PC1. PC2 explained 19.2% of the total variance, and EP, VC, RS, and TFAAs loaded most heavily on PC2. PC3 accounted for 11.9% of the total variance, and traits loading most heavily on PC3 included PT, Pro, S/P, and THAAs. PC4 and PC5 explained 8.70% and 7.43% of the total variance and correlated most strongly with TF and TA, respectively. The characteristics that loaded most heavily on the first three PCs showed the greatest variation among the 29 genotypes.
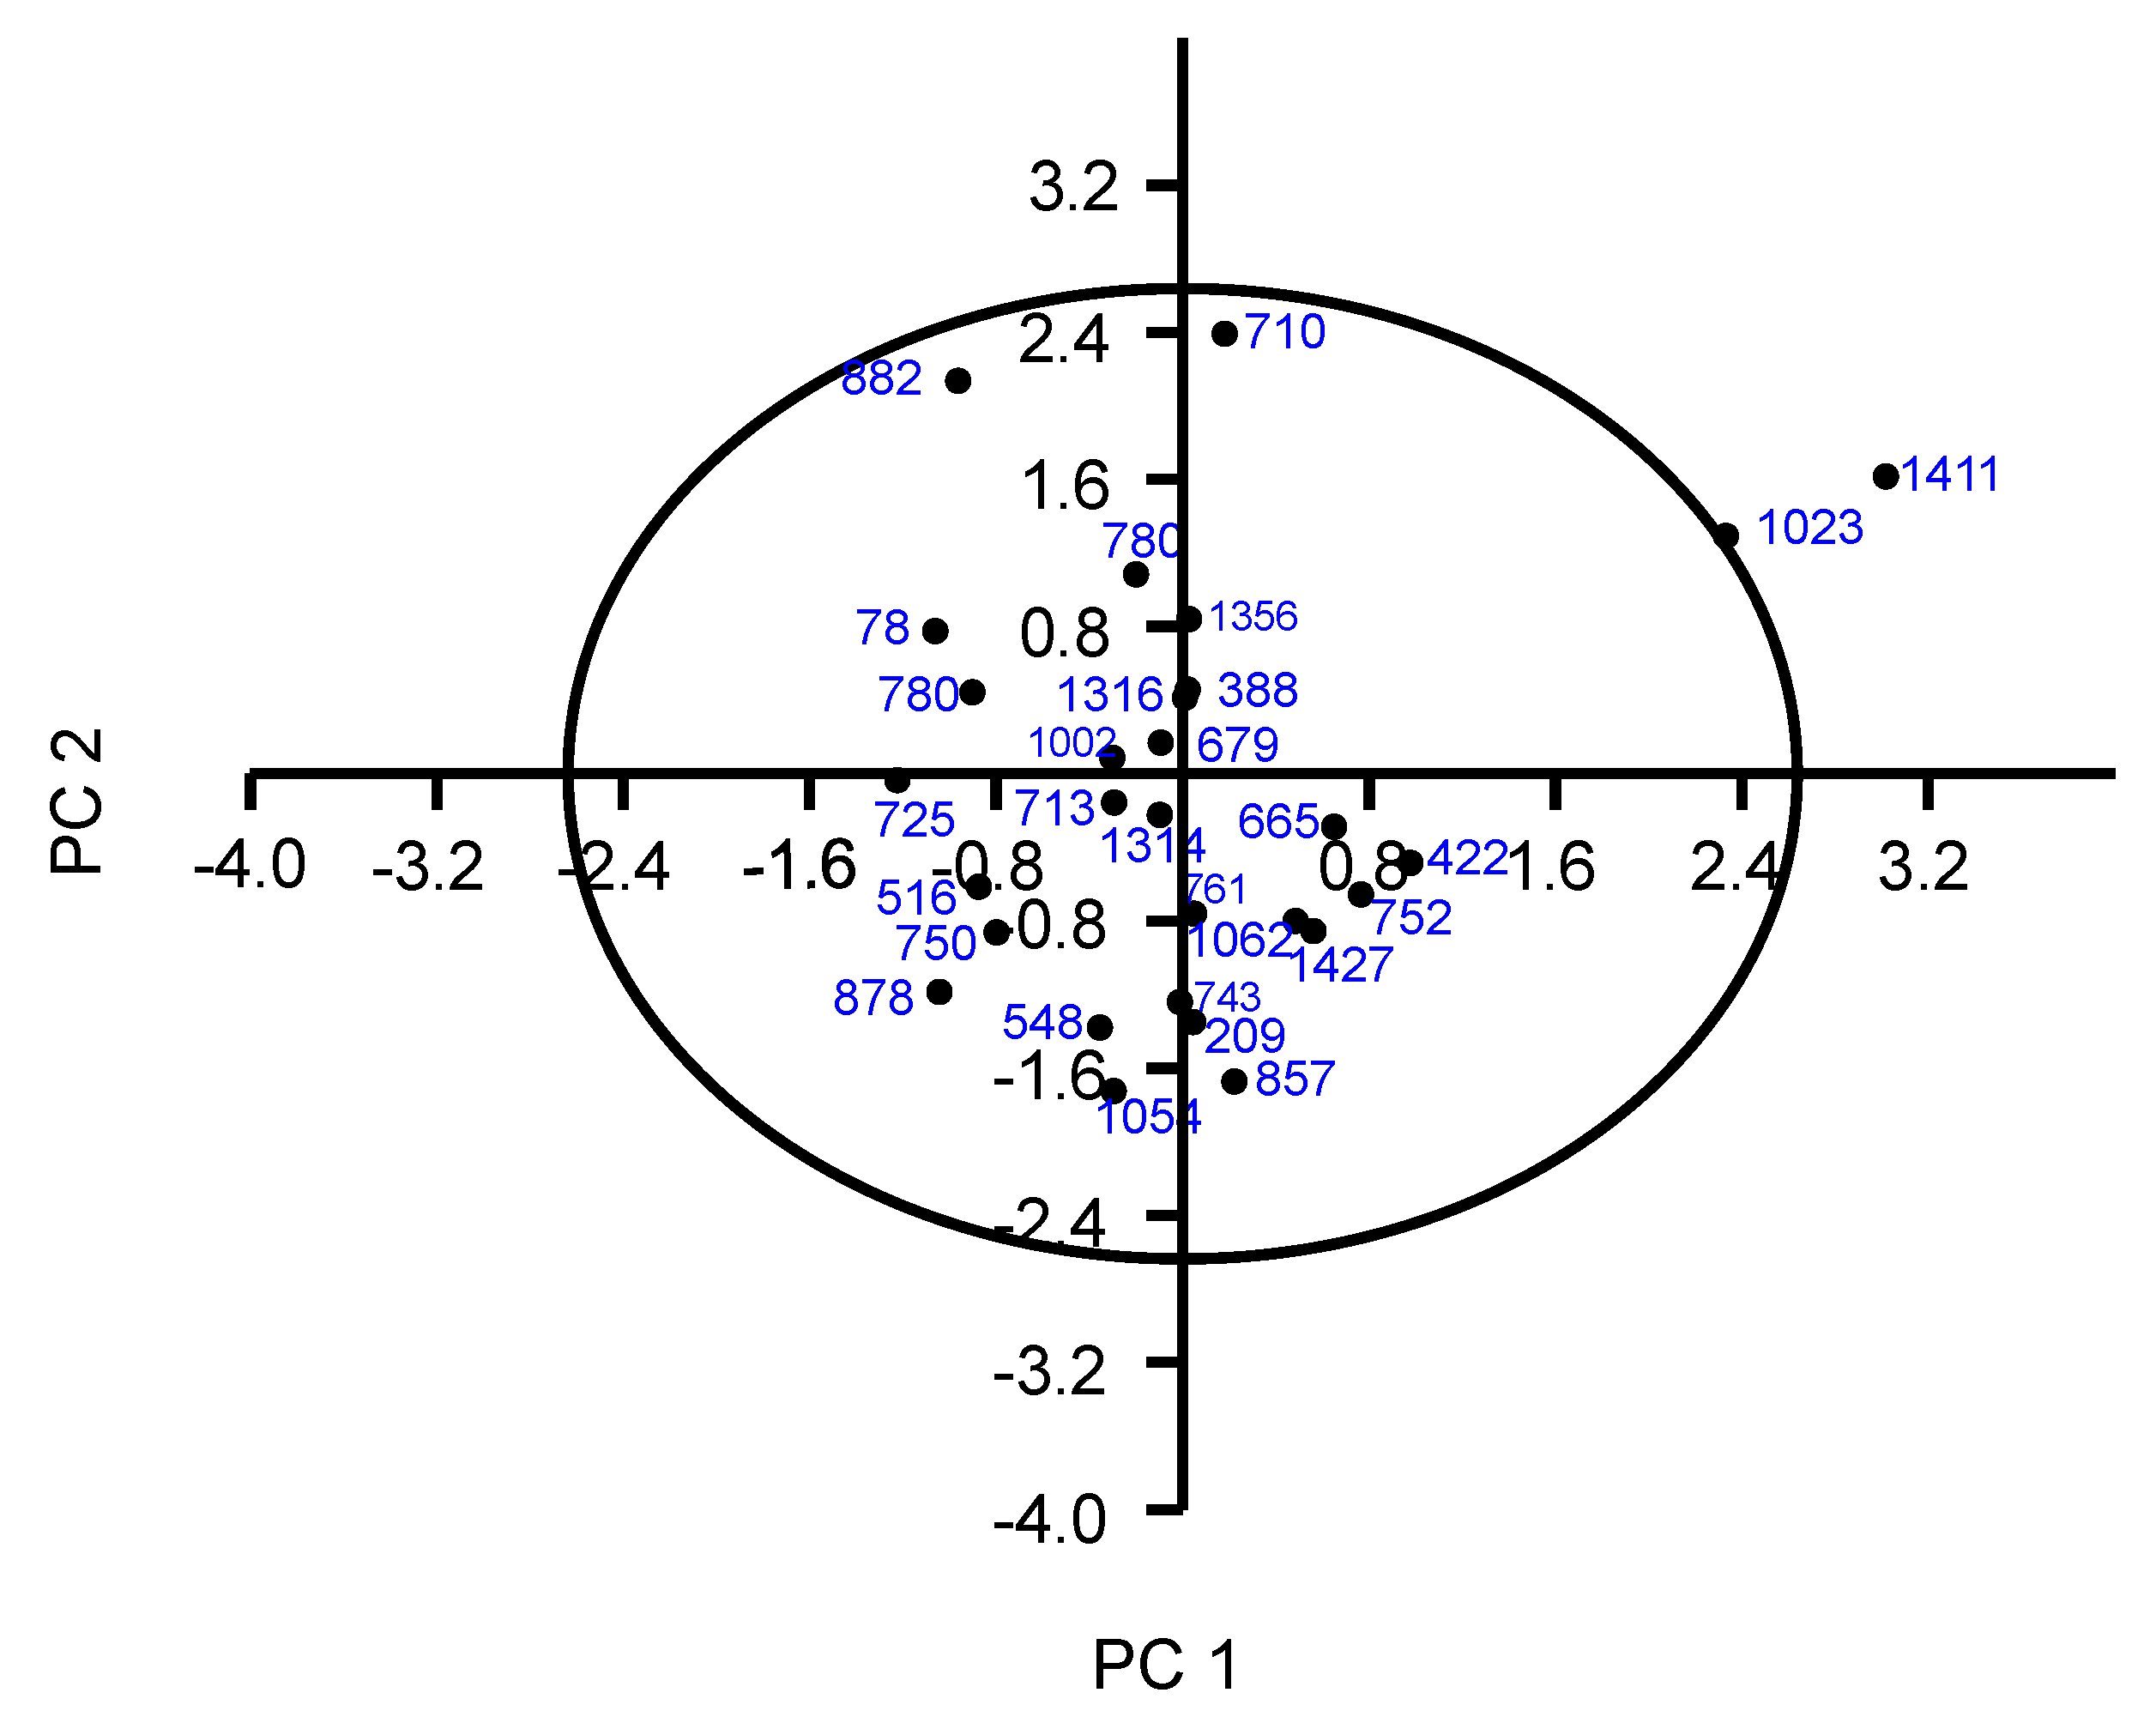
A two-dimensional scatter plot of PC1 vs. PC2 is shown in Figure 3. PC1 represented a size and shape axis, and PC2 revealed a contrast between nutritional quality and palatability (Table 3).

3.5. SSR Analysis

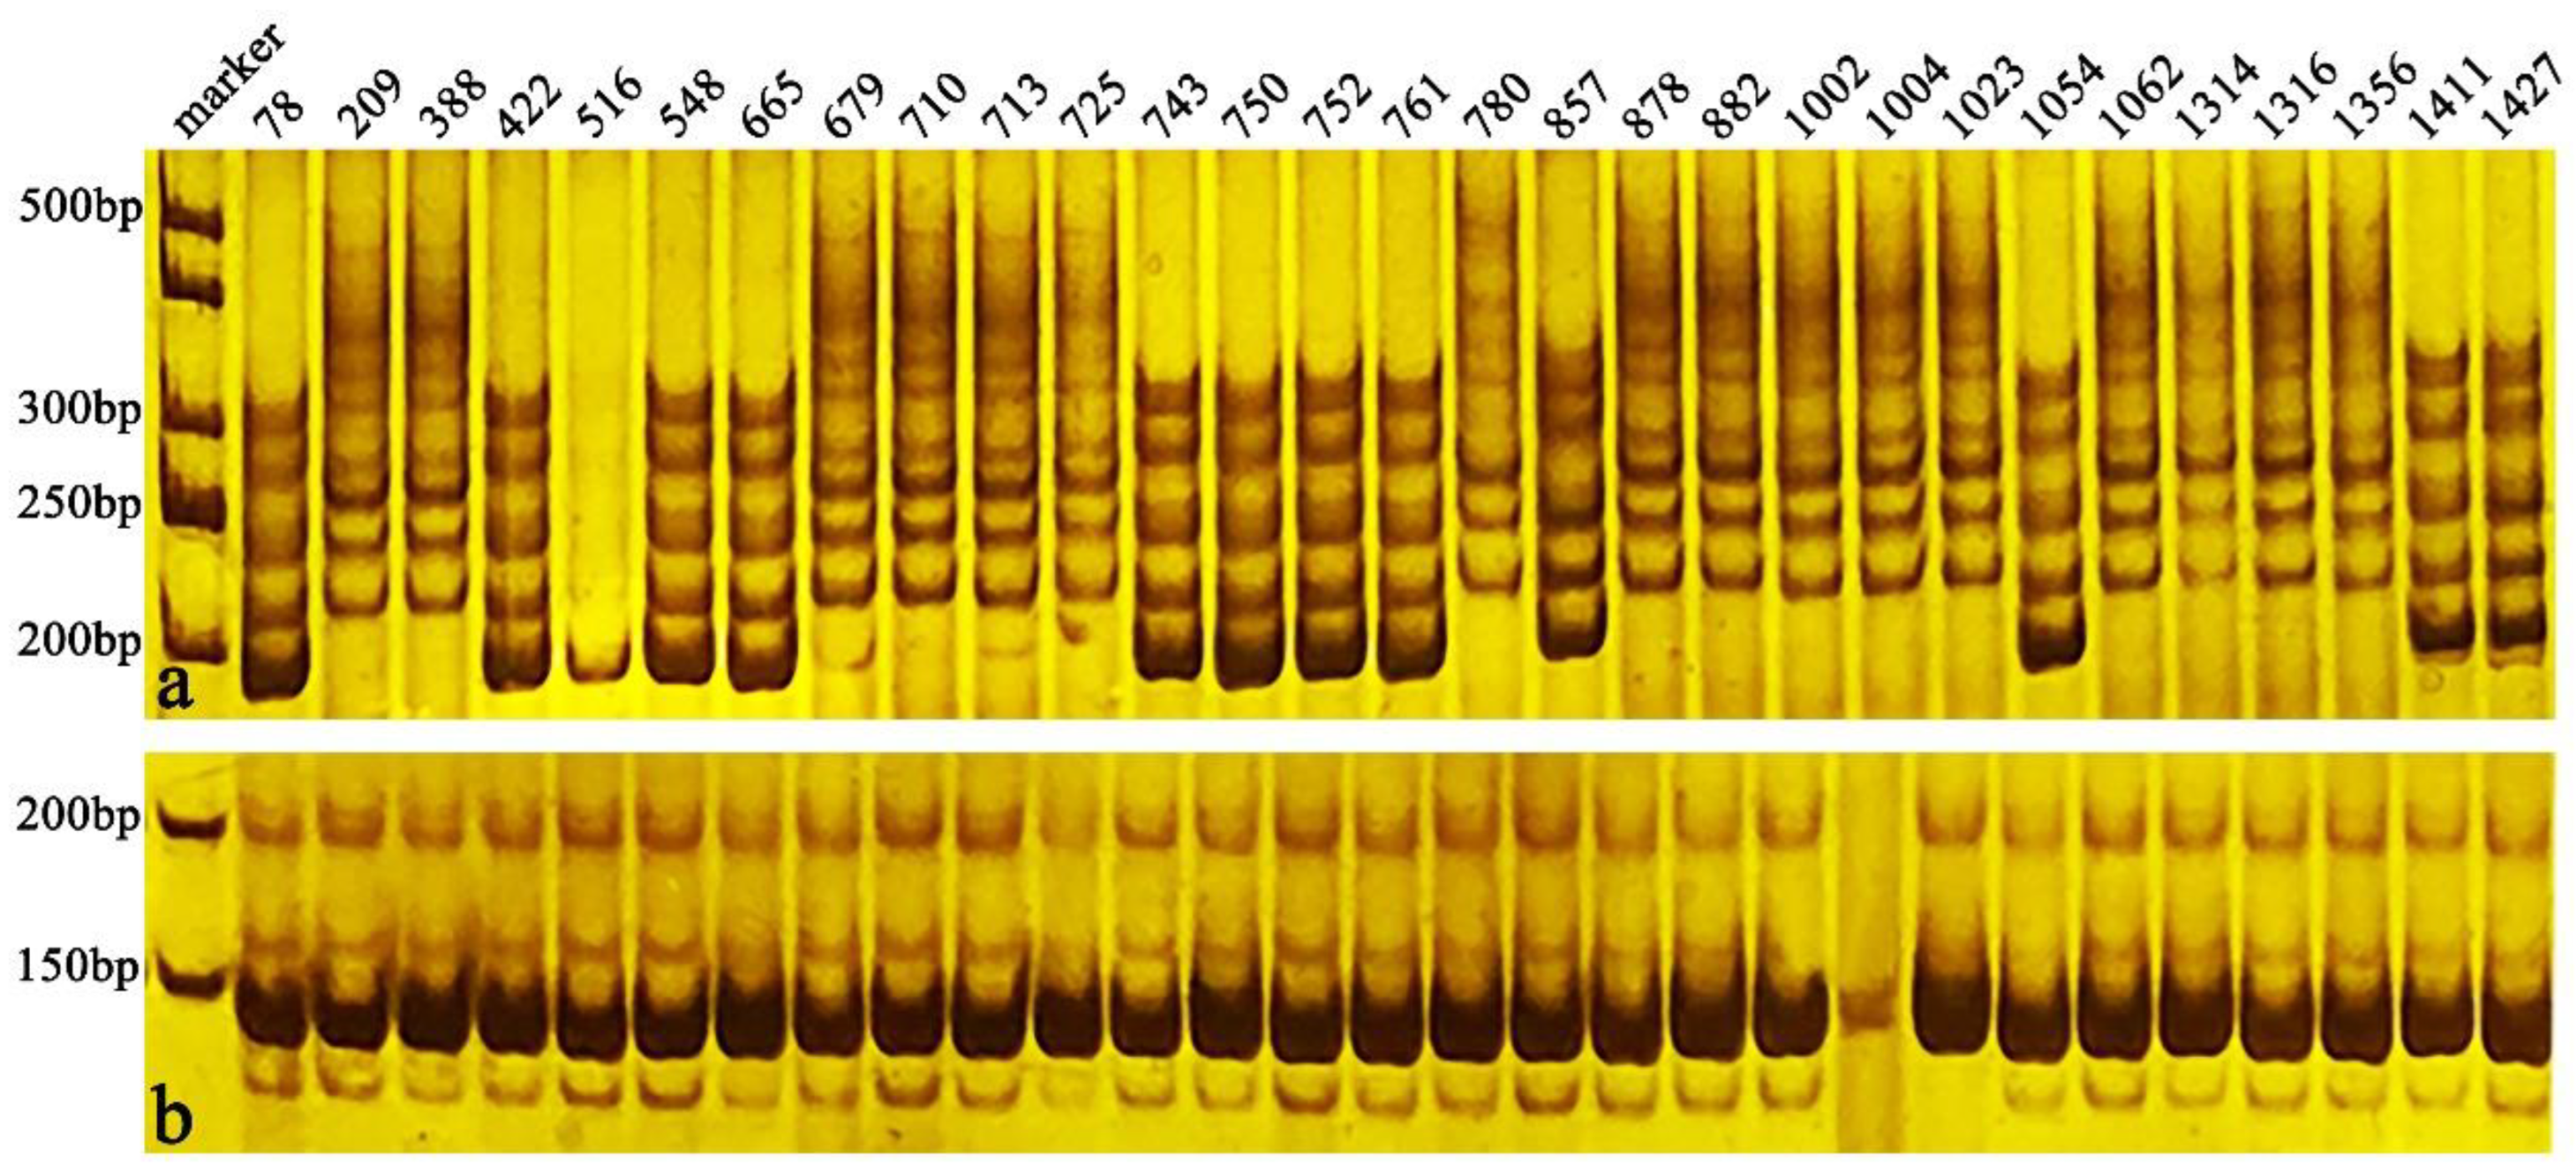
A total of 85 pairs of newly developed SSR primers based on the published A. trifoliata genome [43] (NCBI database under BioProject ID PRJNA671772) were used to determine the genetic diversity of the 29 genotypes. All 85 pairs of SSR primers produced clear bands in all samples; 82 of the 85 pairs were polymorphic and produced a total of 532 alleles among the 29 selected genotypes. AK18 had high Na and high PIC, whereas AK34 had low Na and low PIC (Figure 4, Table S1). The percentage of polymorphic loci was 96.5%. The mean Na was 6.488, and it ranged from 1 to 15 alleles. The mean Ne was 3.527, and it ranged from 1 to 8.327. The mean Ho was 0.121, and it ranged from 0 to 0.962. The mean He was 0.672, and it ranged from 0.043 to 0.901. The mean I was 1.328, and it ranged from 0.150 to 2.365.

3.6. Cluster Analysis Based on Phenotypic Traits and SSR Data

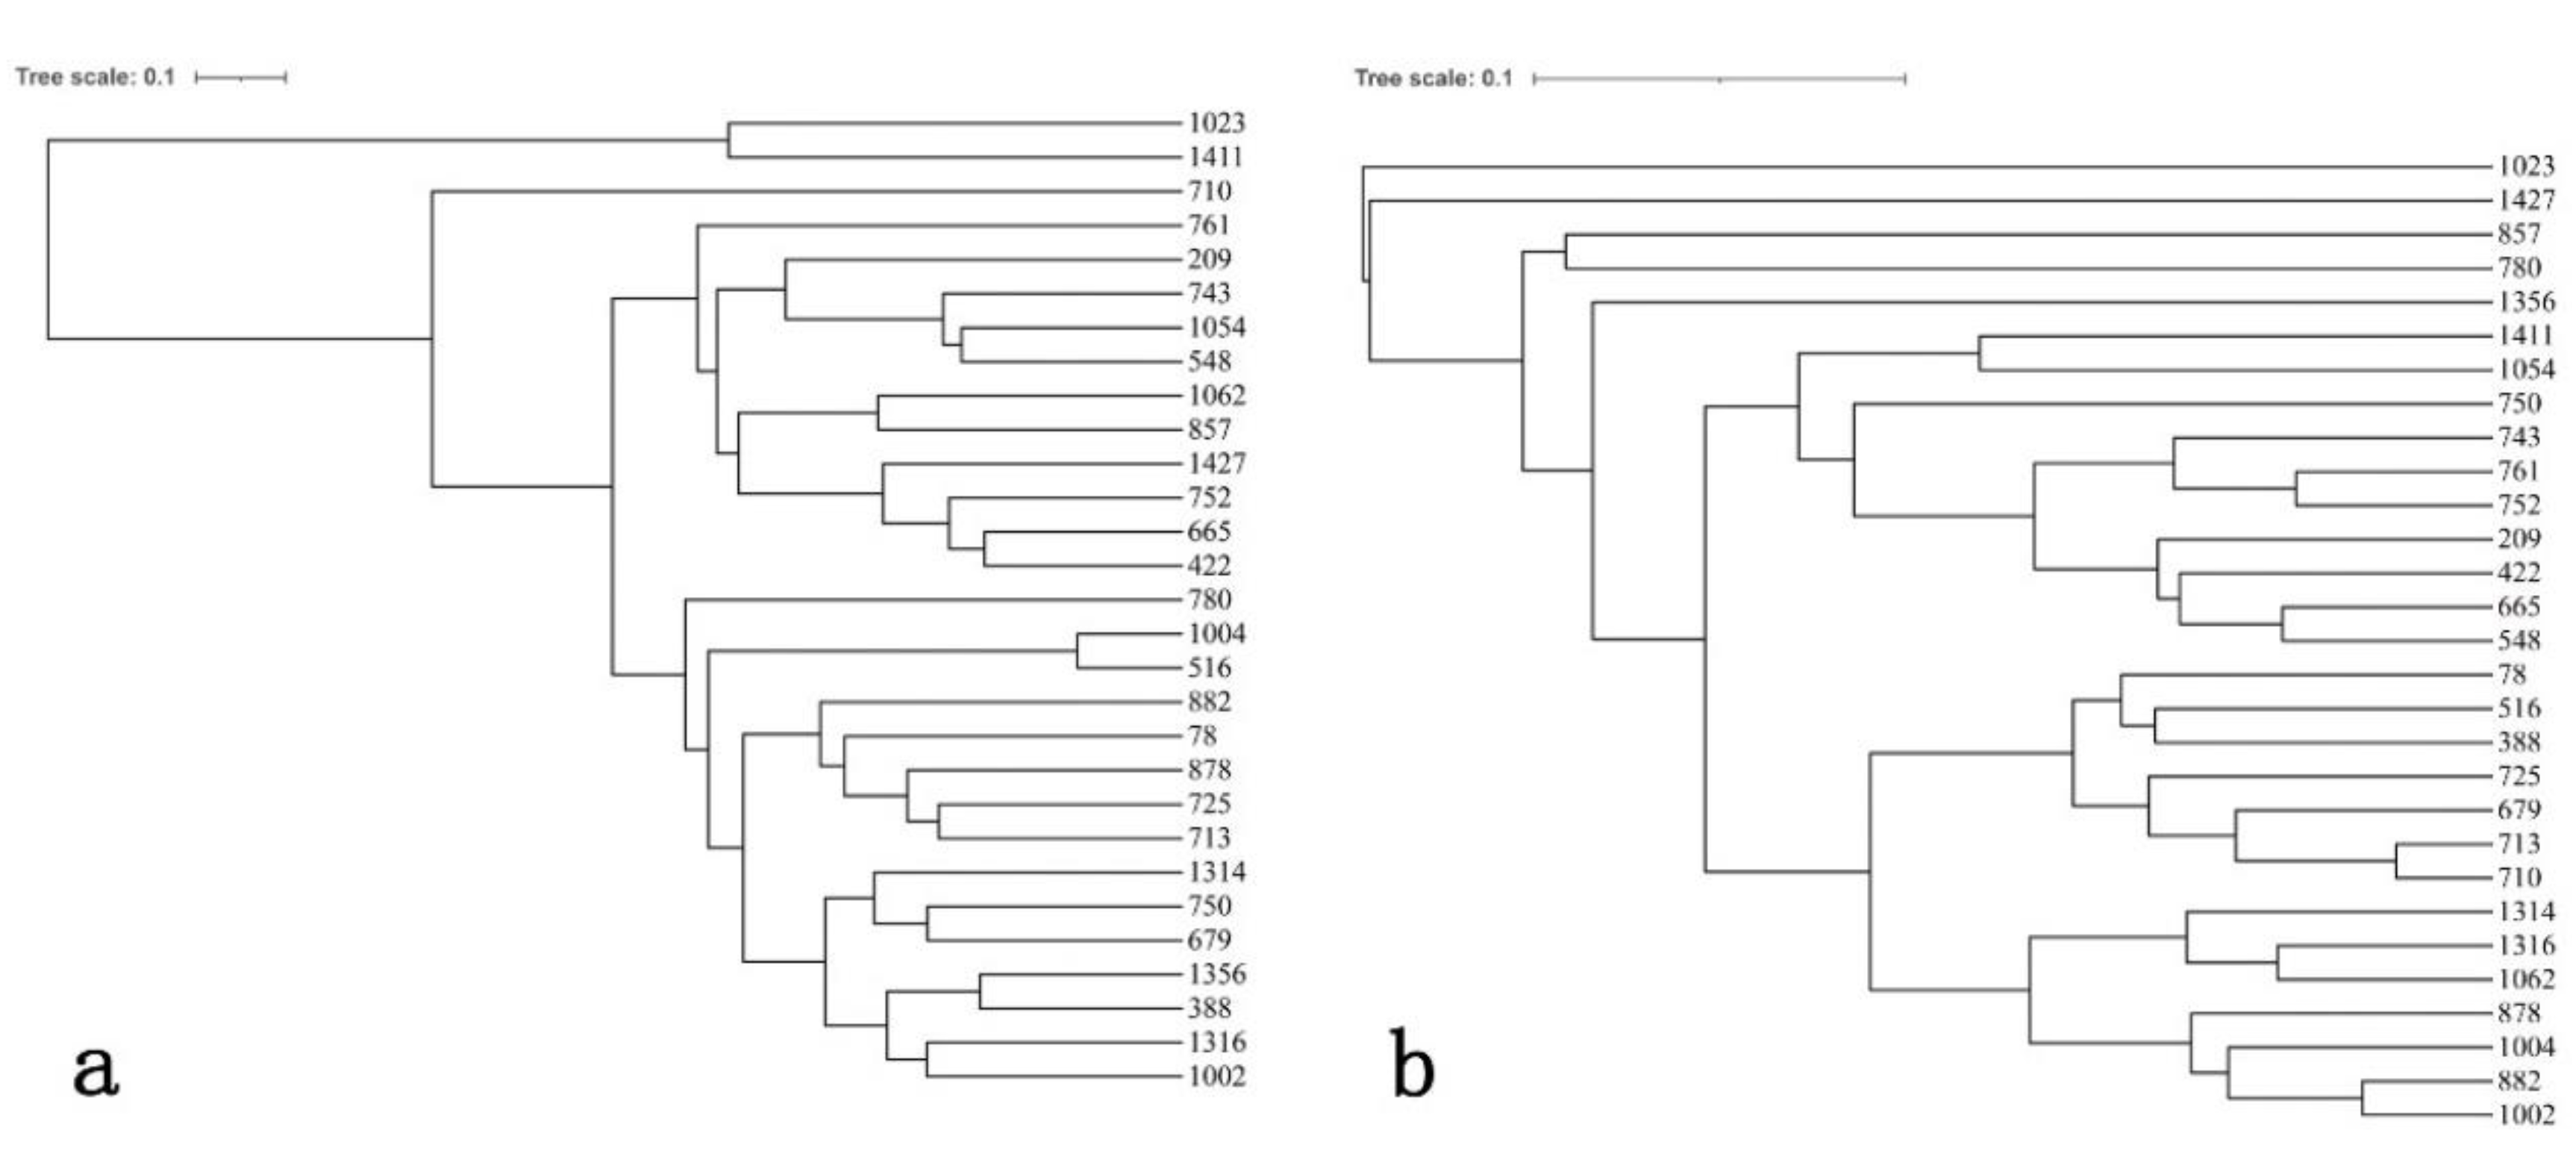
A Ward dendrogram based on the similarities between the phenotypic traits and nutritional components clustered the 29 genotypes into four groups (Figure 5a). The first group consisted of two genotypes (1023 and 1411), which were characterized by a thin peel, large fruit size, high EP, VC, and TF; and late-maturing (growth period = 170–180 d). The second group consisted of 11 genotypes, which were characterized by small fruit size, high RS, and mid–late maturing (growth period = 169–177 d). The third group consisted of 15 genotypes, which were characterized by high TFAAs, medium fruit size, and precocity (growth period = 157–165 d). The fourth group only included one genotype (710), which had the largest fruit size and took the shortest time to mature (growth period = 150 d).
An unweighted pair group method with arithmetic mean (UPGMA) dendrogram based on NGD was also produced (Figure 5b); the branch lengths indicate genetic distance. The 29 genotypes were divided into four groups with a genetic distance of 0.68; however, the topologies of the UPGMA dendrogram and Ward dendrogram differed. For example, 1023 was located in the most basal group in the two dendrograms, whereas 13 genotypes, including 78 and 516, were located in the same group.

3.7. Identification of Promising Genotypes

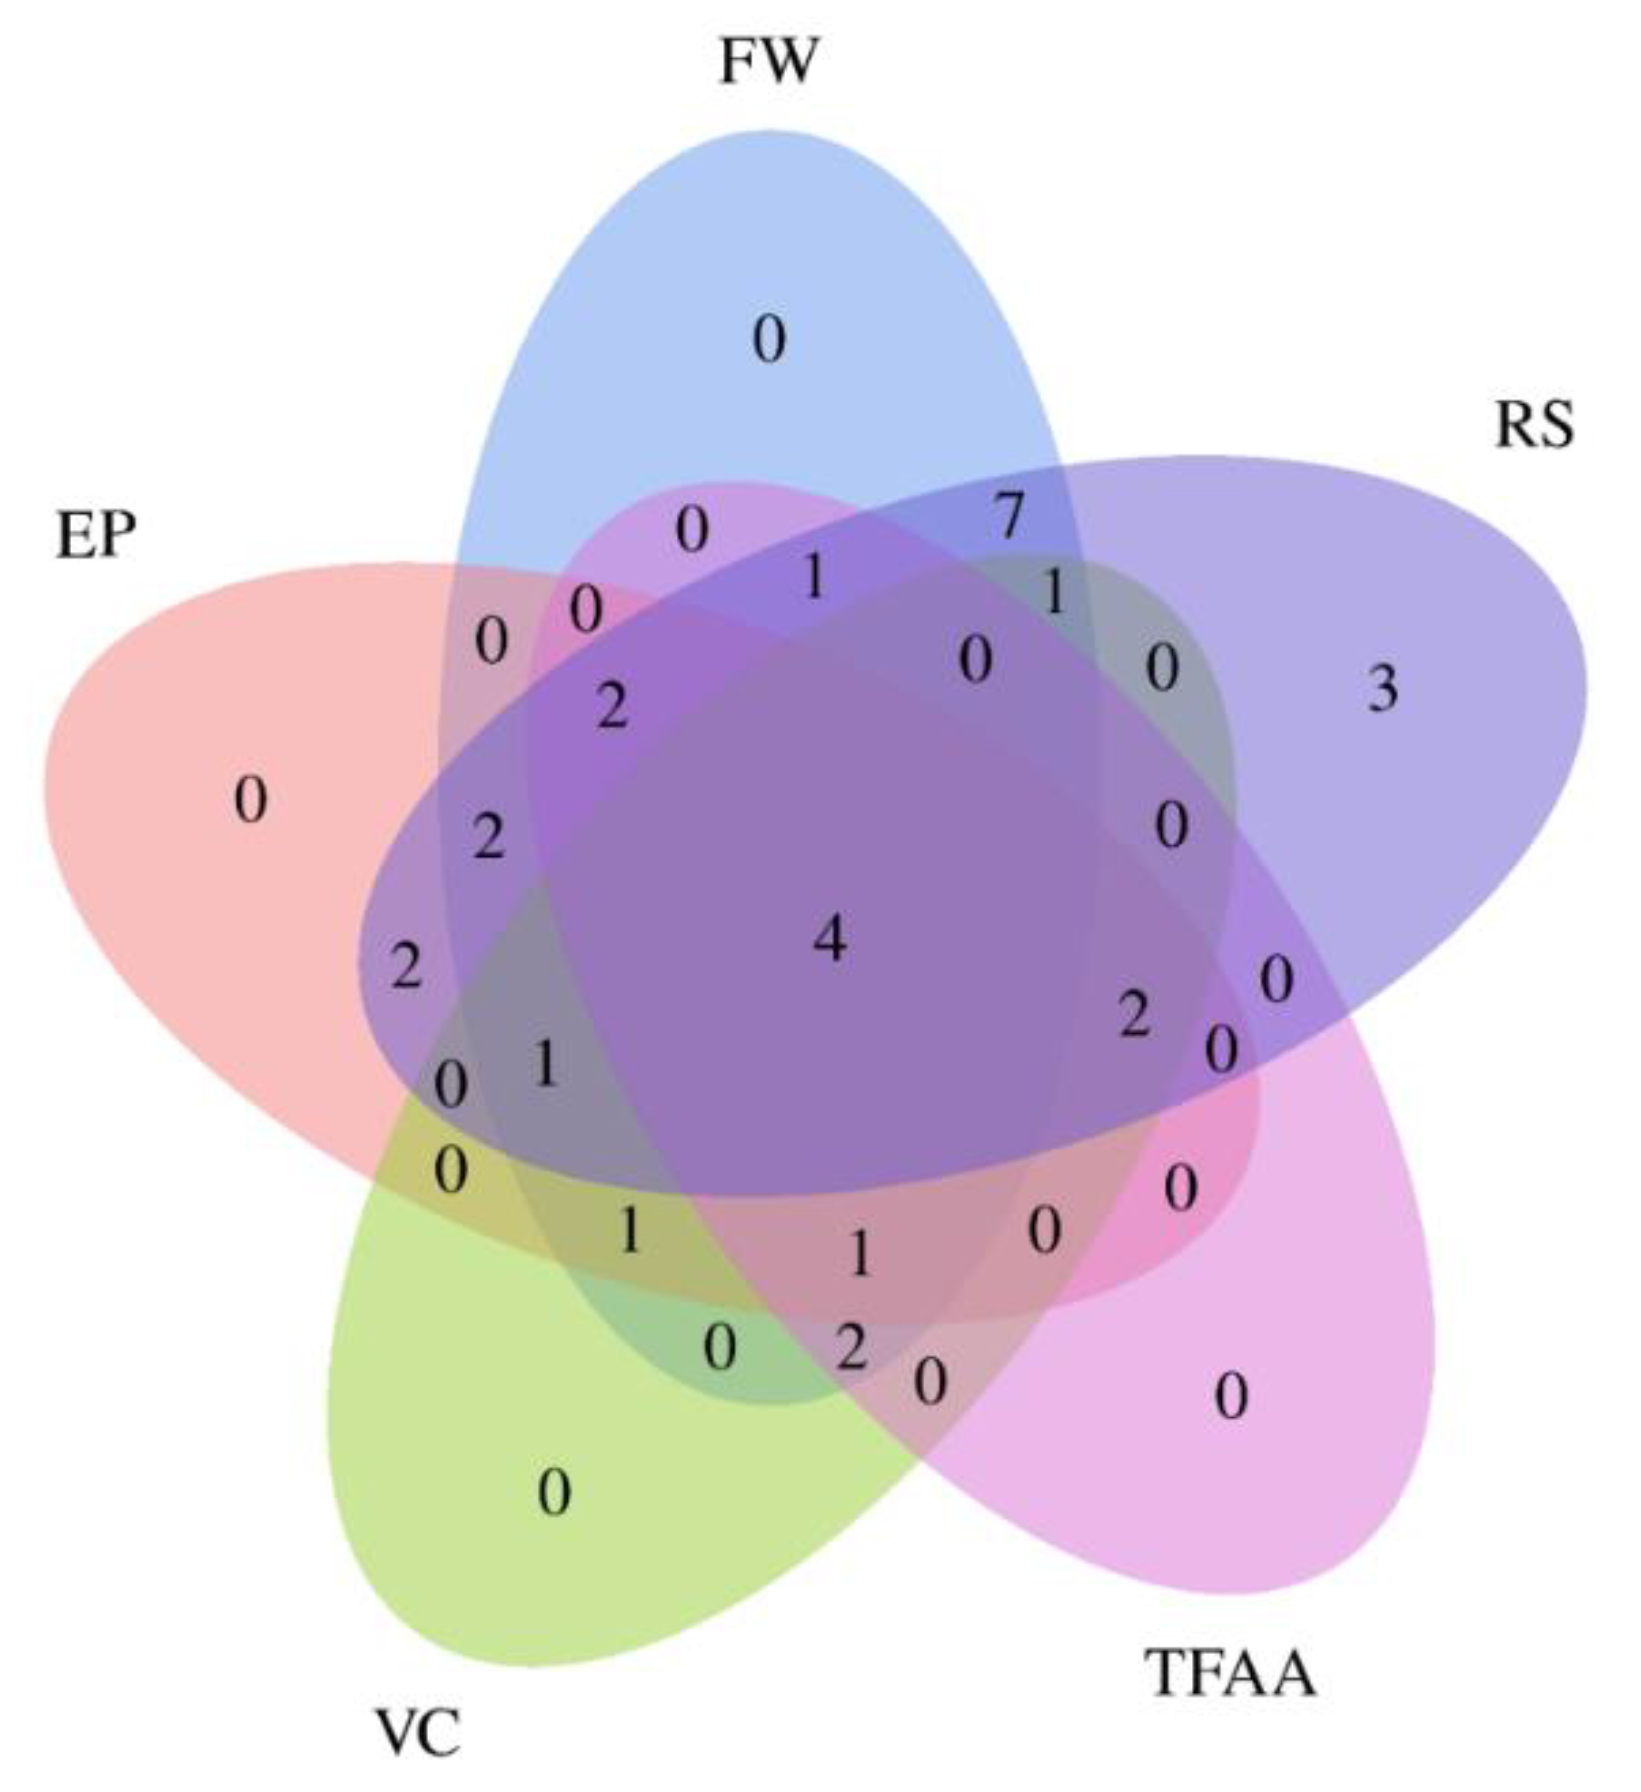
Based on previous studies of commercial fruits, the screening standards of the main phenotypic traits and nutritional components were FW ≥ 200 g, EP ≥ 21%, RS ≥ 13 g·100 g−1, VC ≥ 20 mg·100 g−1, and TFAAs ≥ 450 ng·mg−1. We identified the following four excellent genotypes: 422 (FW = 232.87 g, EP = 27.11%, RS = 14.40 g·100 g−1, VC = 24.84 mg·100 g−1, and TFAAs = 495.34 ng·mg−1); 548 (FW = 228.75 g, EP = 23.05%, RS = 16.28 g·100 g−1, VC = 25.48 mg·100 g−1, and TFAAs = 684.15 ng·mg−1); 761 (FW = 201.67 g, EP = 23.60%, RS = 18.22 g·100 g−1, VC = 22.38 mg·100 g−1, and TFAAs = 1205.73 ng·mg−1); and 1023 (FW = 331.44 g, EP = 25.99%, RS = 17.41 g·100 g−1, VC = 27.56 mg·100 g−1, and TFAAs = 455.47 ng·mg−1) (Table S2 and Figure 6).

4. Discussion

4.1. Importance of Genetic Diversity in A. trifoliata Breeding

Genetic diversity has a large influence on both the effectiveness and the reliability of selection in plant breeding programs. Characterizing the genetic divergence and the degree of relatedness among various traits is thus essential for ensuring that selection leads to crop improvement [44]. However, the domestication process consists of a series of stages and several rounds of selection. Evaluating the genetic diversity of the population after the first round of selection is particularly important for ensuring the efficacy of subsequent rounds of selection.
Although efforts to domesticate A. trifoliata were only recently initiated, priority traits during pre-breeding have included disease resistance, especially resistance to major diseases as well as physical features such as fruit texture. A total of 29 resistant genotypes with desirable textures were selected from a collection of 1447 wild-collected plants, and these genotypes were subjected to another round of selection to enhance phenotypic traits, such as fruit color (FC), fruit shapes (FS), and fruit size (FW ≥ 200 g), and increase the content of nutritional components, such as vitamin C (VC), reducing sugar (RS), and total free amino acids (TFAAs). Amounts of VC, RS, and TFAAs greater than 20 mg·100 g−1, 13 g·100 g−1, and 450 ng·mg−1, respectively, might be beneficial to human health and affect the purchasing decisions of consumers [45,46,47,48]. Large variation was observed in several phenotypic traits (Table 2); the CVs and I of FW, PW, SW, S/P, and EP were greater than 20% and 2.0, respectively. Large variation was also observed in several nutritional components, especially VC, RS, and TFAAs (Table 1). These findings suggest that the genetic diversity underlying phenotypic traits and nutritional characters was high and that these traits were possibly genetically independent of the traits targeted in the first round of selection, such as disease resistance and fruit texture traits. The Ward dendrogram also indicated that genetic diversity was high for several morphological traits (Figure 5a).
Previous studies have shown that the early selection of highly polymorphic species, especially natural populations of commercially unexploited plants, does not typically result in significant reductions in genetic variation [49,50]. SSR markers have been widely used for genetic mapping in crop species [51,52] as well as studies of genetic diversity [30] for their hypervariability, co-dominant inheritance, high reproducibility, high polymorphism with multiple alleles per locus, and high abundance and transferability between species. The Na and PIC values of the microsatellite markers for the 29 genotypes of A. trifoliata (Table S2) and the UPGMA dendrogram based on the NGD of the SSR data indicated high diversity among the 29 genotypes (Figure 5b). Although there were slight differences in the topology of the Ward dendrogram and the UPGMA dendrogram (Figure 5a,b), both dendrograms suggested that the genetic diversity of the population of 29 genotypes was high. Thus, further rounds of selection and evaluation of genotypes from this population would be effective for improving phenotypic traits and nutritional components. Such future studies will enhance our understanding of the dynamics of genetic diversity in crops under artificial selection.

4.2. Genetic Improvement of A. trifoliata

Plant breeding line selection must be based on multiple breeding objectives; however, accomplishing multiple breeding objectives can be difficult through a single selection strategy [53]. Knowledge of the associations among multiple objectives is important for enhancing the efficacy of selection because improvement in one trait can often lead to improvements in other traits through indirect selection [54]. Although correlations between fruit weight and fruit shape have been previously detected in A. trifoliata [18,19], correlations between morphological and nutritional traits have not been explored. In this study, LD was significantly positively correlated with VC (Table 2), which indicates that the improvement of LD by direct selection could lead to improvements in VC through indirect selection. Likewise, direct selection for the content of TF and S/P could lead to improvements in TD and TFAA, respectively, via indirect selection because of the significant correlations. However, direct selection for EP could lead to decreases in the content of TFAAs because of the significant, negative relationships of EP with TFAAs (Table 2). Overall, the new information provided in our study regarding the correlations between morphological and nutritional traits and the high genetic diversity will facilitate future efforts to genetically improve A. trifoliata.
PCA was used to reduce the complexity of our dataset, identify the traits underlying differences between genotypes, and determine the traits and trait axes explaining the most variation in the data [55]. The 15 traits assessed in this study were reduced to five PCs, which explained 83.2% of the total variance (Table 3), indicating that input variables were highly correlated (Table 2). All morphological indices except PT loaded on PC1, and all major nutritional indices, such as VC, RS, and TFAAs, loaded on PC2 (Table 3).
Cultivar development in plant breeding programs is a complex process involving a cyclical procedure over a long period. Thus, the selection of an appropriate breeding strategy is essential for the success of plant breeding programs, and ideal strategies should be simple, economically feasible, and capable of efficiently achieving breeding objectives [56]. The results of the correlation analyses and PCA indicate that FW and TFAAs would be important targets of selection for obtaining superior genotypes for the development of a new A. trifoliata fruit crop. PT and TF would be important targets of selection for the development of a new medicinal crop, and both SW and S/P would be important targets of selection for the development of A. trifoliata as an oil crop.

4.3. Progressive Improvement of A. trifoliata as a New Commercial Fruit through Successive Selection

Adaptation to cultivated environments and resistance to diseases in such environments are typically the first problems needing to be resolved in the domestication of wild plants so that they can be cultivated at commercial scales [57,58]. Phenotypic traits and nutritional components become the targets of selection only after adaptation and disease resistance have been achieved. Although it has long been used as a medicinal herb in East Asia, efforts to cultivate and domesticate A. trifoliata as a fruit crop are only in their infancy [13]. Ongoing breeding efforts are aimed at developing commercial cultivars with improved fruit quality such as larger fruit size, higher EP, and larger amounts of nutrients. VC has been reported to be 21.58 mg·100 g−1 in strawberry [59] and 2.6 mg·100 g−1 in plum [60], and RS has been reported to be 7.15 g·100 g −1 in pineapple [61] and 13 g·100 g−1 in litchi [62]. The TFAAs of fruit crops have generally received less attention in previous studies [63]. Compared with these fruits, four excellent genotypes were identified in this study: 422, 548, 761, and 1023; the values of FW, EP, RS, VC, and TFAAs of the fruit of these genotypes were greater than 200 g, 21%, 13 g·100 g−1, 20 mg·100 g−1, and 450 ng·mg−1, respectively. Although the EP of the fruits of these excellent genotypes was low in our study, which was similar to the EP of the fruits of genotypes in previous studies [18,19], the EP of the fruit of the genotypes from this study and previous studies is much higher compared with the ER of the fruit of wild plants (16.5%) [13]. Step-by-step breeding strategies according to the desirable order of objective traits are needed to further improve EP.

5. Conclusions

High genetic diversity was observed for the 29 genotypes based on the phenotypic traits, nutritional components and SSR data; thus, further selection of some of these traits from this population could prove effective. A stepwise selection strategy could be particularly useful for improving A. trifoliata as a fruit crop. Four genotypes (422, 548, 761, and 1023) with excellent properties (FW, RS, VC, and TFAAs) were identified with high potential to be developed as new commercial cultivars. The results of our study indicate that new fruit cultivars of A. trifoliata with excellent commercial characteristics and nutritional components could be developed with sufficient breeding efforts.

Supplementary Materials

The following supporting information can be downloaded at: https://www.mdpi.com/article/10.3390/horticulturae8020116/s1, Table S1: Statistical values of microsatellite markers on 29 genotypes of A. trifoliata; Table S2: The characterized of 29 genotypes in 19 phenotypic traits and nutritional components of A. trifoliata; Figure S1: Distributions of VC (vitamin C), TFAA (total free amino acid), RS (reducing sugar), and TF (total flavonoids); Figure S2: The scree plot of principal component analysis.

Author Contributions

P.L. and J.G. conceived the experiments; X.Y., J.G. and P.F. conducted the analysis of nutritional components; W.C. and H.Y. (Huai Yang). conducted the phenotypic analysis; S.Z., W.C. and H.Y. (Hao Yang). collected the study materials; P.L. and J.G. wrote the manuscript; C.C., X.W. and H.Y. (Hao Yang). provided valuable suggestions for the data analysis and assisted with revising the manuscript. All authors have read and agreed to the published version of the manuscript.

Funding

This research received no external funding.

Institutional Review Board Statement

Not applicable.

Informed Consent Statement

Not applicable.

Data Availability Statement

Publicly available datasets were analyzed in this study. This data can be found here: [NCBI database under BioProject ID PRJNA671772].

Acknowledgments

This work was supported by the Science and Technology Department of Sichuan Province under Seeding Project 2020YJ0331 and the Key Research and Development Project [2019YFN0032 and 2019YFS0020].

Conflicts of Interest

The authors declare that they have no conflict of interest.

References

  1. Kong, X.X. Delectis Florae Reipublicae Popularis Sinicae Agendae Academiae Sinicae Edita. Flora Reipublicae Popularis Sinicae. Tomus 29; Science Press: Beijing, China, 2001; pp. 1–11. [Google Scholar]
  2. Higuchi, R.; Kawasaki, T. Pericarp saponins of Akebia quinata Decne. II. Arjunolic and norarjunolic acids, and their glycosides. Chem. Pharm. Bull. 1976, 24, 1314–1323. [Google Scholar] [CrossRef] [Green Version]
  3. Higuchi, R.; Kawasaki, T. Pericarp saponins of Akebia quinata Decne. I. Glycosides of hederagenin and oleanolic acid. Chem. Pharm. Bull. 1976, 24, 1021–1032. [Google Scholar] [CrossRef] [Green Version]
  4. Li, J.G.; Li, J.R. Study on the biological characteristics and nutritional components of the fruit of Akebia trifoliata. Guihaia 1991, 11, 189–192. [Google Scholar]
  5. Du, Y.; Jiang, Y.; Zhu, X.; Hua, X.; Shi, S.; Hu, J.; Peng, H.; Qiang, Z.; Sun, W. Physicochemical and functional properties of the protein isolate and major fractions prepared from Akebia trifoliata var. Australia seed. Food Chem. 2012, 133, 923–929. [Google Scholar] [CrossRef]
  6. Guo, Y.Z.; Chen, X. Application of vertical greening as a new model of expanding urban green spaces. J. Landsc. Res. 2013, 3, 17–19. [Google Scholar]
  7. Chinese Pharmacopoeia Commission. The Pharmacopoeia of the People’s Pepublic of China; China Medicine Science and Technology Press: Beijing, China, 2005. [Google Scholar]
  8. Ministry of Health, Labour and Welfare. The Japanese Herbal Pharmacopoeia; Ministry of Health, Labour and Welfare: Tokyo, Japan, 2011. [Google Scholar]
  9. Korea Food and Drug Administration. The Korean Herbal Pharmacopoeia; Korea Food and Drug Administration: Seoul, Korea, 2012. [Google Scholar]
  10. Bai, C.K. Fatty acids analysis in decaisnea insignis and Akebia trifoliata seed oil by GC-MS. Acta Bot. Boreali-Occident. Sin. 2007, 5, 1035–1038. [Google Scholar]
  11. Zhao, S.Q.; Zhu, X.M.; Xiong, H.; Bai, C.Q. Optimized refining and fatty acid composition of Akebia trifoliata var. australis seed oil. Food Sci. 2013, 34, 54–58. [Google Scholar]
  12. Chen, B. Cultivation and application of Akebia trifoliata. China Flowers Hortic. 2016, 4, 43–47. [Google Scholar]
  13. Li, L.; Yao, X.; Zhong, C.; Chen, X.; Huang, H. Akebia: A potential new fruit crop in China. HortScience 2010, 45, 4–10. [Google Scholar] [CrossRef]
  14. Wang, J.; Ren, H.; Xu, Q.L.; Zhong, Y.Z.; Wu, P.; Wei, X.Y.; Cao, Y.; Chen, X. Antibacterial oleanane-type triterpenoids from pericarps of Akebia trifoliata. Food Chem. 2015, 168, 623–629. [Google Scholar] [CrossRef]
  15. Zhong, C.H.; Bu, F.W.; Wang, Z.Y. Fruit development and character performance of the offspring of Akebia trifoliata. Hunan Agric. Sci. 2006, 1, 27–29. [Google Scholar]
  16. Xiong, D.S.; Mu, Z.P.; Cao, Y. Development and utilization of Akebia trifoliata resources. Hunan For. Sci. Technol. 1993, 20, 38–48. [Google Scholar]
  17. Cao, Y.; Xiong, D.S.; Zhu, J.T. Study on respiratory physiology and fresh-keeping conditions of Akebia trifoliata. J. Fruit Sci. 2003, 20, 512–514. [Google Scholar]
  18. Zou, S.; Yao, X.; Zhong, C.; Zhao, T.; Huang, H. Genetic analysis of fruit traits and selection of superior clonal lines in Akebia trifoliata (Lardizabalaceae). Euphytica 2018, 214, 111. [Google Scholar] [CrossRef]
  19. Zou, S.; Yao, X.; Zhong, C.; Zhao, T.; Huang, H. Effectiveness of recurrent selection in Akebia trifoliata (Lardizabalaceae) breeding. Sci. Hortic. 2019, 246, 79–85. [Google Scholar] [CrossRef]
  20. Huang, H.; Liang, J.; Tan, Q.; Ou, L.; Song, S. Insights into triterpene synthesis and unsaturated fatty-acid accumulation provided by chromosomal-level genome analysis of Akebia trifoliata subsp. australis. Hortic. Res. 2021, 8, 33. [Google Scholar] [CrossRef]
  21. Zhang, Z.; Zhang, J.; Yang, Q.; Li, B.; Zhou, W.; Wang, Z. Genome survey sequencing and genetic diversity of cultivated Akebia trifoliata assessed via phenotypes and SSR markers. Mol. Biol. Rep. 2021, 48, 241–250. [Google Scholar] [CrossRef]
  22. Hong, X.; Chen, S.; Wang, L.; Liu, B.; Huang, S. First report of nigrospora sphaerica causing fruit dried-shrink disease in Akebia trifoliata from China. Plant Dis. 2021, 32, 247. [Google Scholar] [CrossRef]
  23. Cheng, S.; Ke, J.; Tan, L.T.; Medison, R.G.; Sun, Z. First report of leaf spot on Akebia trifoliata caused by phytophthora nicotianae in China. Plant Dis. 2020, 105, 489. [Google Scholar] [CrossRef]
  24. Pan, H.; Deng, L.; Feng, D.; Zhong, C.; Li, L. First report of anthracnose caused by colletotrichum gloeosporioides on Akebia trifoliata in China. Plant Dis. 2020, 105, 499. [Google Scholar] [CrossRef]
  25. Yu, X.J.; Zhong, S.F.; Yang, H.; Chen, C.; Chen, W.; Yang, H.; Guan, J.; Fu, P.; Tan, F.Q.; Ren, T.H.; et al. Identification and characterization of NBS resistance genes in Akebia trifoliate. Front. Plant Sci. 2021, 12, 2459. [Google Scholar] [CrossRef] [PubMed]
  26. Nambi, V.E.; Thangavel, K.; Rajeswari, K.A.; Manickavasagan, A.; Geetha, V. Texture and rheological changes of Indian mango cultivars during ripening. Postharvest Biol. Technol. 2016, 117, 152–160. [Google Scholar] [CrossRef]
  27. Li, Y.H.; Zhao, S.C.; Ma, J.X.; Dong, L.; Qiu, L.J. Molecular footprints of domestication and improvement in soybean revealed by whole genome re-sequencing. BMC Genom. 2013, 14, 579. [Google Scholar] [CrossRef] [PubMed] [Green Version]
  28. Cavanagh, C.R.; Chao, S.; Wang, S.; Huang, B.E.; Stephen, S.; Kiani, S.; Forrest, K.; Saintenac, C.; Brownguedira, G.L.; Akhunova, A. Genome-wide comparative diversity uncovers multiple targets of selection for improvement in hexaploid wheat landraces and cultivars. Proc. Natl. Acad. Sci. USA 2013, 110, 8057–8062. [Google Scholar] [CrossRef] [PubMed] [Green Version]
  29. Gepts, P. The contribution of genetic and genomic approaches to plant domestication studies. Curr. Opin. Plant Biol. 2014, 18, 51–59. [Google Scholar] [CrossRef] [Green Version]
  30. Niu, J.; Wang, Y.; Shi, Y.; Wang, X.; Chen, J. Development of SSR markers via de novo transcriptome assembly in Akebia trifoliata (Thunb.) Koidz. Genome 2019, 62, 817–831. [Google Scholar] [CrossRef] [Green Version]
  31. Yang, H.; Chen, W.; Fu, P.; Zhong, S.F.; Guan, J.; Luo, P.G. Developmental Stages of Akebia trifoliata fruit based on volume. Hortic. Sci. Technol. 2021, 39, 822–830. [Google Scholar]
  32. Farahani, M.; Salehi-Arjmand, H.; Khadivi, A.; Akramian, M. Phenotypic diversity among Morus alba var. nigra genotypes as revealed by multivariate analysis. Sci. Hortic. 2019, 248, 41–49. [Google Scholar]
  33. Villarreal, N.M.; Bustamante, C.A.; Civello, P.M.; Martínez, G. Effect of ethylene and 1-MCP treatments on strawberry fruit ripening. J. Sci. Food Agric. 2010, 90, 683–689. [Google Scholar] [CrossRef]
  34. Lees, R. Food Analysis: Analytical and Quality Control Methods for the Food Manufacturer and Buyer; Leonard Hill Books: London, UK, 1975. [Google Scholar]
  35. Oyeleke, O.A. Outlines of Food Analysis; Department of Biochemistry, University of Ilorin: Ilorin, Nigeria, 1984. [Google Scholar]
  36. Jiang, C.; Wang, X.; Chen, W.; Liu, T.; Luo, P.G. Resistance performance of wheat stripe rust resistance gene Yr41 and its effect on yield parameters in F2 populations under field conditions. Crop Prot. 2020, 134, 128. [Google Scholar] [CrossRef]
  37. Li, X.; Liu, T.G.; Chen, W.Q.; Zhong, S.F.; Zhang, H.Y. Wheat WCBP1 encodes a putative copper-binding protein involved in stripe rust resistance and inhibition of leaf senescence. BMC Plant Biol. 2015, 15, 239. [Google Scholar] [CrossRef] [PubMed] [Green Version]
  38. Li, X.; Xiang, Z.P.; Chen, W.Q.; Huang, Q.L.; Liu, T.G.; Li, Q.; Zhong, S.F.; Zhang, M.; Guo, J.W.; Lei, L. Reevaluation of two quantitative trait loci for type II resistance to fusarium head Blight in wheat germplasm PI 672538. Phytopathology 2017, 107, 92–99. [Google Scholar] [CrossRef] [PubMed] [Green Version]
  39. Norusis, M.J. Spss 11.0 guide to data analysis. Compr. Psychiatry 2000, 49, 397–400. [Google Scholar]
  40. Hammer, Y.; Harper, D. Past: Paleontological statistics software package for education and data analysis. Electronica 2001, 4, 1–9. [Google Scholar]
  41. Peakall, R.; Smouse, P.E. GENALEX 6: Genetic analysis in excel. Population genetic software for teaching and research. Mol. Ecol. Notes 2010, 6, 288–295. [Google Scholar]
  42. Yeh, F.; Boyle, T.; Yeh, F.C.; Boyle, T.J.B. Population genetic analysis of co-dominant and dominant markers and quantitative traits. Belg. J. Bot. 1996, 129, 157. [Google Scholar]
  43. Sichuan Agriculture University. A. trifoliata Genome Assembly Sequence and RNA-seq Data, NCBI. 2021. Available online: http://www.ncbi.nlm.nih.gov/bioproject/671772 (accessed on 11 June 2021).
  44. Costa, J.L.; Jesus, O.; Oliveira, G.A.F.; Oliveira, E. Effect of selection on genetic variability in yellow passion fruit. Crop Breed. Appl. Biotechnol. 2012, 12, 253–260. [Google Scholar] [CrossRef] [Green Version]
  45. Boubaya, A.; Salah, M.B.; Marzougui, N.; Ferchichi, A. Pomological characterization of the mulberry tree (Morus spp.) in the south of Tunisia. J. Arid. Land Stud. 2009, 19, 157–159. [Google Scholar]
  46. Maeda, H.; Akagi, T.; Tao, R. Quantitative characterization of fruit shape and its differentiation pattern in diverse persimmon (Diospyros kaki) cultivars. Sci. Hort 2018, 228, 41–48. [Google Scholar] [CrossRef]
  47. Badenes, M.L.; Byrne, D.H. Fruit Breeding; Springer: Now York, NY, USA, 2012. [Google Scholar]
  48. Khadivi-Khub, A.; Anjam, K. Morphological characterization of Prunus scoparia using multivariate analysis. Plant Syst. Evol. 2014, 300, 1361–1372. [Google Scholar] [CrossRef]
  49. Witcombe, J.R.; Joshi, A.; Joshi, K.D.; Sthapit, B.R. Farmer participatory crop improvement-varietal selection and breeding methods and their impact on biodiversity. Exp. Agric. 1996, 32, 445–460. [Google Scholar] [CrossRef]
  50. Purugganan, M.D.; Fuller, D.Q. The nature of selection during plant domestication. Nature 2009, 457, 843–848. [Google Scholar] [CrossRef] [PubMed]
  51. Luo, P.G.; Hu, X.Y.; Ren, Z.L.; Zhang, H.Y.; Shu, K.; Yang, Z.J. Allelic analysis of stripe rust resistance genes on wheat chromosome 2BS. Genome 2008, 51, 922–927. [Google Scholar] [CrossRef] [PubMed] [Green Version]
  52. Luo, P.G.; Luo, H.Y.; Chang, Z.J.; Zhang, H.Y.; Zhang, M.; Ren, Z.L. Characterization and chromosomal location of Pm40 in common wheat: A new gene for resistance to powdery mildew derived from elytrigia intermedium. Theor. Appl. Genet. 2009, 118, 1059–1064. [Google Scholar] [CrossRef] [PubMed]
  53. Yan, W.; Frégeau-Reid, J. Breeding line selection based on multiple traits. Cropence 2008, 48, 417–423. [Google Scholar] [CrossRef]
  54. Yucel, C.; Baloch, F.S.; Ozkan, H. Genetic analysis of some physical properties of bread wheat grain (Triticum aestivum L. em Thell). Turk. J. Agric. 2009, 33, 525–535. [Google Scholar]
  55. Matteo, A.D.; Russo, R.; Graziani, G.; Ritieni, A.; Vaio, C.D. Characterization of autochthonous sweet cherry cultivars (Prunus avium L.) of southern Italy for fruit quality, bioactive compounds and antioxidant activity. J. Sci. Food Agric. 2017, 97, 2782–2794. [Google Scholar]
  56. Mccouch, S. Diversifying selection in plant breeding. PLoS Biol. 2004, 2, 347. [Google Scholar] [CrossRef]
  57. John, F.D.; Brandon, S.G.; Bruce, D.S. The molecular genetics of crop domestication. Cell 2006, 127, 1309–1321. [Google Scholar]
  58. Fu, Y.B. Understanding crop genetic diversity under modern plant breeding. Theor. Appl. Genet. 2015, 128, 2131–2142. [Google Scholar] [CrossRef] [Green Version]
  59. Wimalasiri, P.; Wills, R.B.H. Simultaneous analysis of ascorbic acid and dehydroascorbic acid in fruit and vegetables by high-performance liquid chromatography. J. Chromatogr. A 1983, 256, 368–371. [Google Scholar] [CrossRef]
  60. Smanalieva, J.; Iskakova, J.; Oskonbaeva, Z.; Wichern, F.; Darr, D. Determination of physicochemical parameters, phenolic content, and antioxidant capacity of wild cherry plum (Prunus divaricata ledeb) from the walnut-fruit forests of kyrgyzstan. Eur. Food Res. Technol. 2019, 245, 2293–2301. [Google Scholar] [CrossRef]
  61. Bhore, N.S.; Surwade, S.A.; Swami, S.B.; Hakor, N.J. Studies on physico-chemical properties of pineapple fruit and development of pineapple peeler. Agric. Eng. Today 2017, 3, 8–15. [Google Scholar]
  62. Hajare, S.N.; Saxena, S.; Kumar, S.; Wadhawan, S.; Mishra, B.B.; Parte, M.N.; Gautam, S.; Sharma, A. Quality profile of litchi (Litchi chinensis) cultivars from India and effect of radiation processing. Radiat. Phys. Chem. 2010, 9, 994–1004. [Google Scholar] [CrossRef]
  63. Galili, G.; Amir, R.; Fernie, A.R. The regulation of essential amino acid synthesis and accumulation in plants. Annu. Rev. Plant Biol. 2016, 67, 153–178. [Google Scholar] [CrossRef] [PubMed]
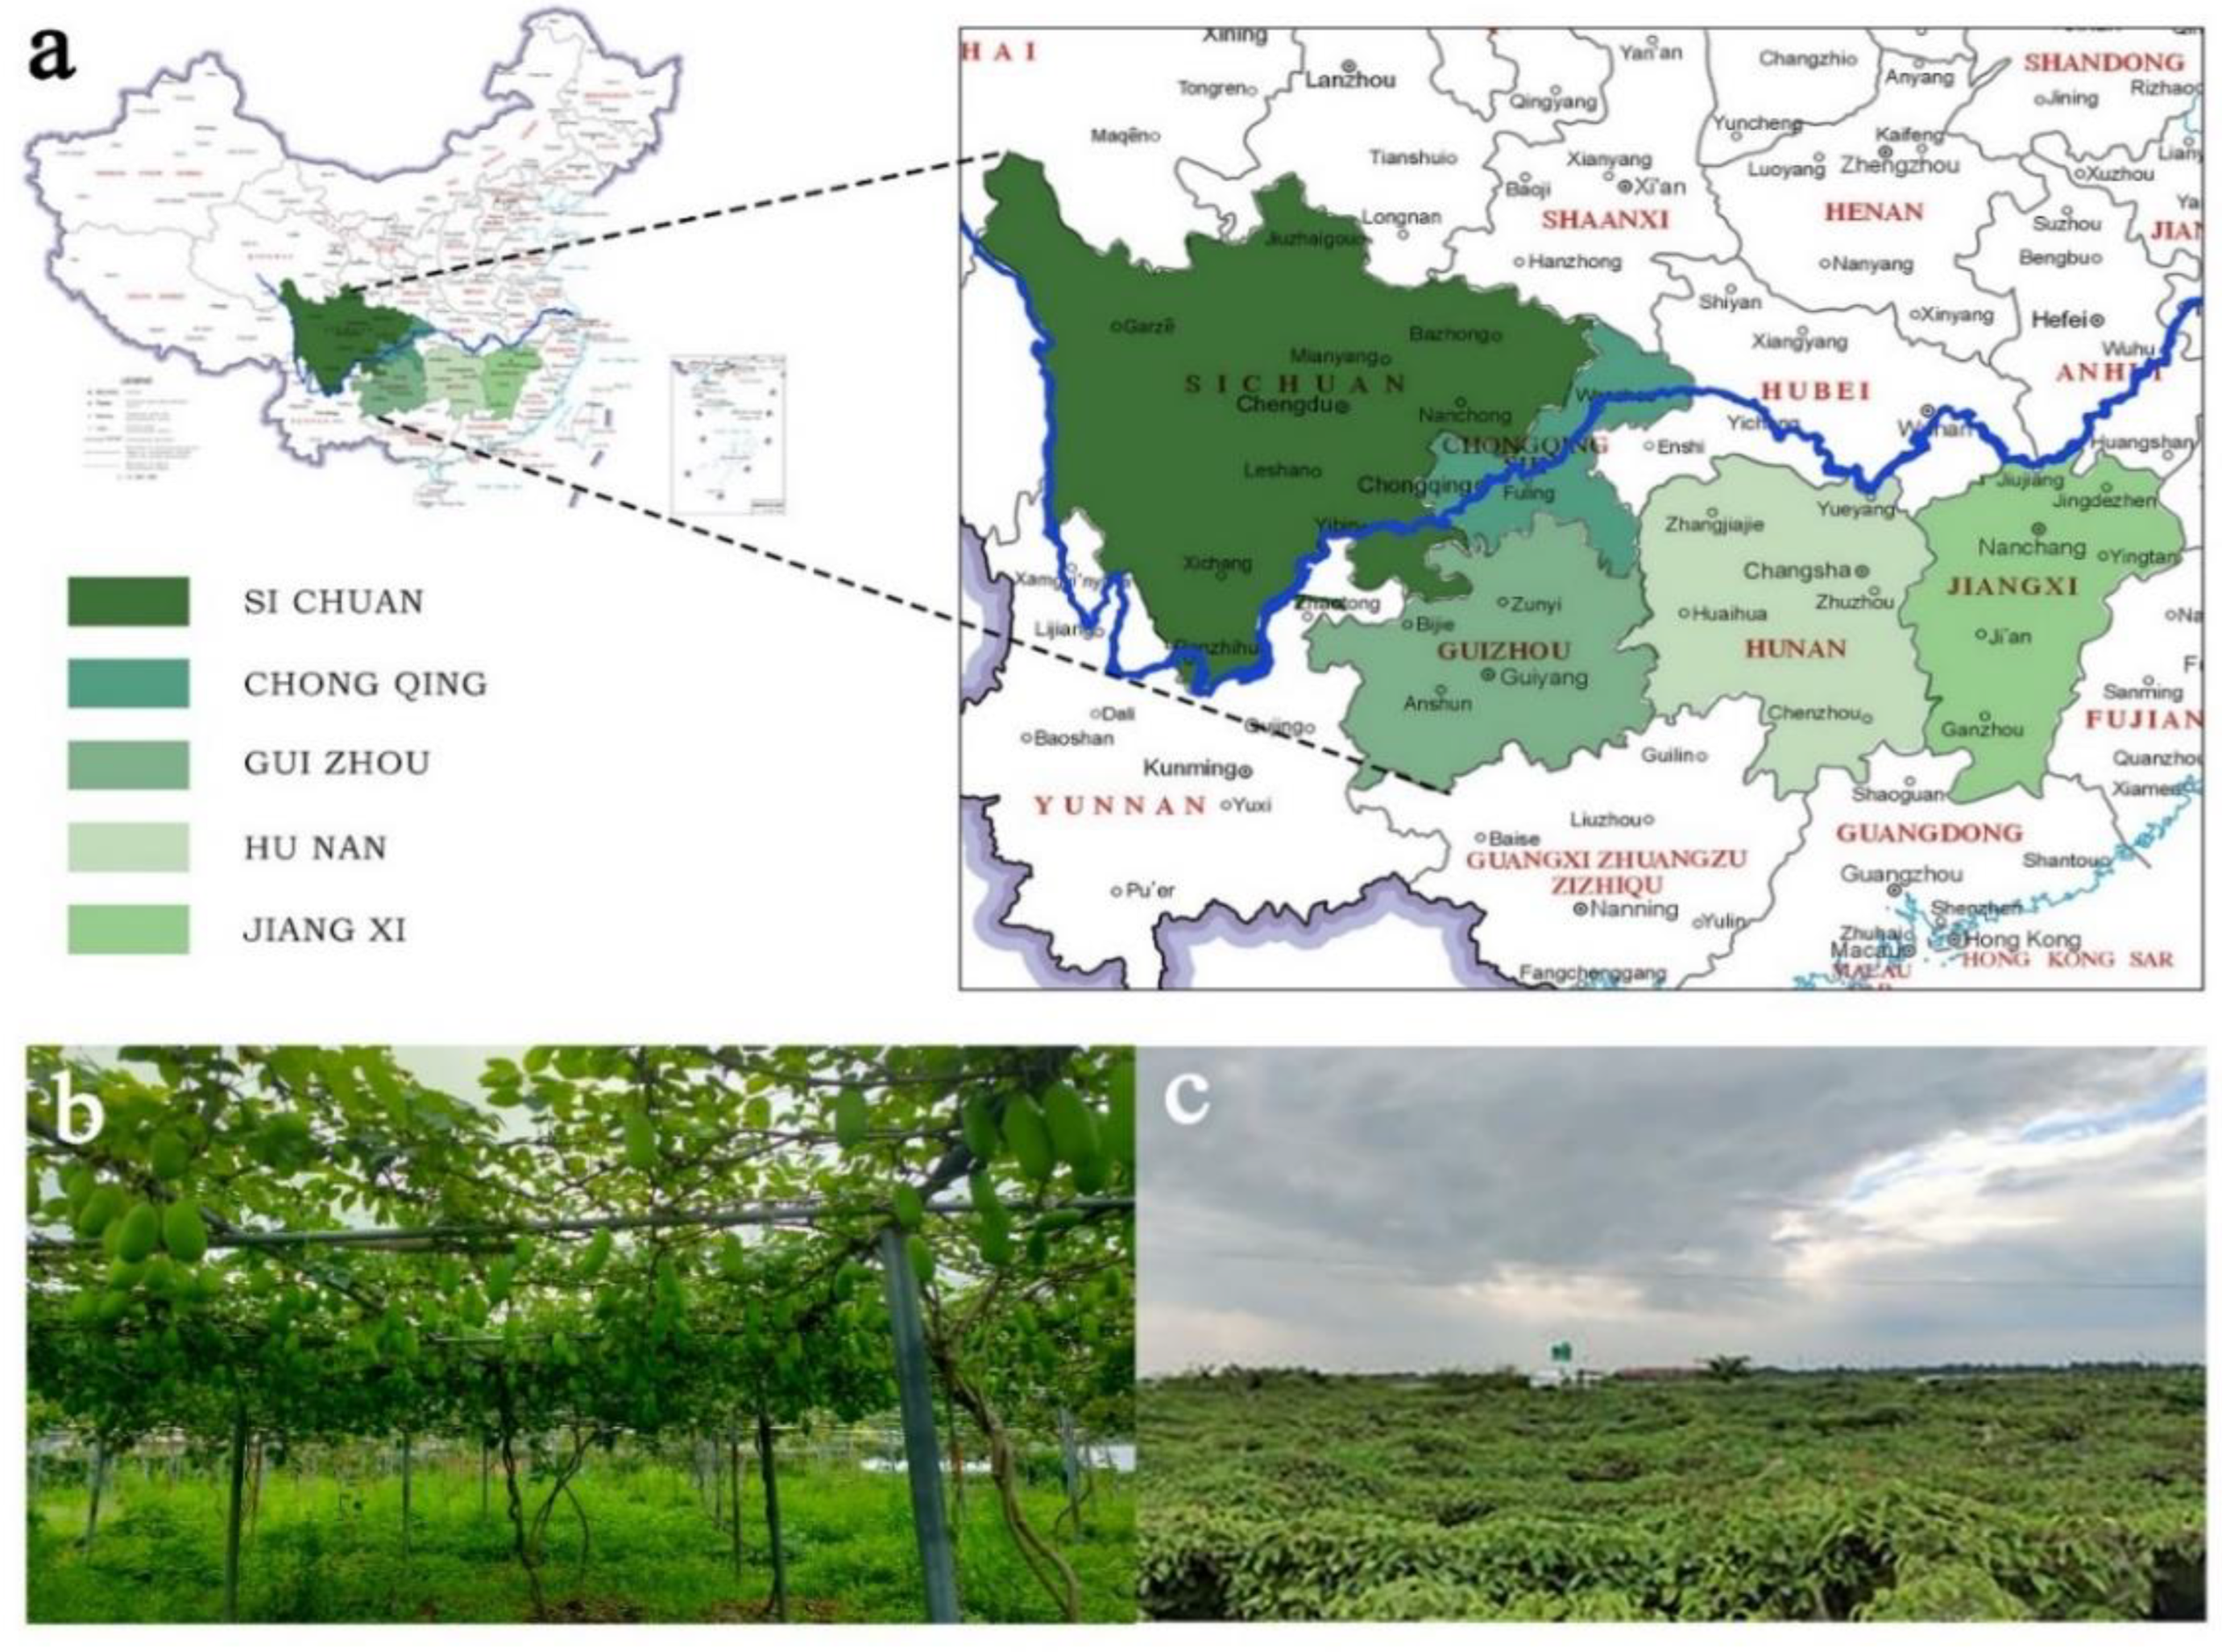
Figure 1. (a) Map showing the provinces from which wild genotypes of A. trifoliata were collected. (b,c) Images of the germplasm nursery of Sichuan Agricultural University where the wild genotypes of A. trifoliata were cultivated.
Horticulturae 08 00116 g001
Figure 2. (a) Images of selected A. trifoliata genotypes displaying variation in fruit color and shape. (b) Distributions of fruit weight (FW), peel weight (PW), seed weight (SW), and edible proportion (EP).
Horticulturae 08 00116 g002
Figure 3. Two − dimensional scatter plot of PC1 (fruit weight (FW), peel weight (PW), longitudinal diameter (LD), transverse diameter (TD), seed weight (SW)) vs. PC2 (edible proportion (EP), vitamin C (VC), reducing sugar (RS), total flavonoids (TF)) (explaining 35.9% and 19.2% of the total variance, respectively) based on the phenotypic traits of the 29 genotypes.
Horticulturae 08 00116 g003
Figure 4. Results of polypropylene gel electrophoresis for AK18 (a) and AK34 (b).
Horticulturae 08 00116 g004
Figure 5. (a) Ward dendrogram of 29 genotypes of A. trifoliata based on phenotypic traits. (b) UPGMA dendrogram based on the NGD of SSR data. Branch lengths indicate genetic distance.
Horticulturae 08 00116 g005
Figure 6. Venn diagram displaying the number of genotypes identified based on the following criteria: FW (fruit weight) ≥ 200 g, EP (edible proportion) ≥ 21%, RS (reducing sugar) ≥ 13 g·100 g−1, VC (vitamin C) ≥ 20 mg·100 g−1, and TFAA (total free amino acids) ≥ 450 ng·mg−1.
Horticulturae 08 00116 g006
Table 1. Descriptive statistics of the phenotypic traits of the 29 selected genotypes of Akebia trifoliata.
No.TraitAbbreviationType aUnitMinMaxMeanSDCV (%)I
1Fruit colorFCMCode193.761.7446.31.82
2Fruit shapeFSMCode172.064.7943.01.78
3Growth periodGPMDay150180167.16.844.102.72
4Fruit weightFWMg135.2446.9237.754.723.02.54
5Peel weightPWMg100.5354.4177.142.123.82.43
6Seed weightSWMg6.1520.29.82.8929.62.65
7Pericarp thicknessPTMcm0.691.311.090.1312.42.81
8Longitudinal diameterLDMcm10.116.312.91.219.392.68
9Transverse diameterTDMcm5.357.576.150.528.432.68
10Proportion of seedsPoSM%3.277.194.230.8319.72.71
11Seed/pulpS/pM%12.773.523.512.352.52.05
12Edible proportionEPM%10.729.521.44.7121.92.73
13Vitamin CVCNmg/100 g6.7254.418.010.960.32.13
14Reducing sugarRSNg/100 g8.7118.2212.92.7921.52.82
15ProteinProNg/100 g0.320.670.480.0714.62.64
16Total flavonoidsTFNmg/g1.0129.13.555.38151.60.79
17Titratable acidTANg/100 g0.0390.0820.060.0116.72.93
18Total free amino acidsTFAAsNng/mg312.41443.1706.4287.440.72.57
19Total hydrolyzed amino acidsTHAAsNng/mg1663.33940.03174.8534.316.82.50
a M stands for morphological, and N stands for nutritional components.
Table 2. Correlations among morphological and nutritional characteristics of the 29 selected genotypes of Akebia trifoliata.
TraitFWPWPTLDTDSWPosS/pEPV CRSProTFTATHAATFAA
FW1
PW0.961 **1
PT0.2410.3621
LD0.921 **0.823 **0.1701
TD0.759 **0.634 **−0.1090.824 **1
SW0.688 **0.617 **−0.1740.721 **0.755 **1
Pos−0.147−0.18−0.431−0.0280.1310.534 *1
S/p−0.219−0.053−0.024−0.325−0.210.0460.2911
EP0.193−0.066−0.2840.3510.3530.13−0.083−0.786 **1
VC0.482 *0.332−0.0920.642 **0.539 *0.446 *0.089−0.2960.542 *1
RS−0.018−0.163−0.2680.2180.3940.1120.053−0.4400.523 *0.3151
Pro0.4280.481 *−0.0190.2780.2550.241−0.0960.214−0.1670.195−0.0631
TF0.3150.151−0.4480.466 *0.612 **0.532 *0.3200.0110.3310.628 **0.1470.1511
TA−0.182−0.1450.096−0.284−0.323−0.228−0.1330.069−0.032−0.093−0.150−0.175−0.3151
TFAA−0.191−0.0490.098−0.378−0.251−0.198−0.0910.563 **−0.566 **−0.543 *−0.3230.270−0.2590.0151
THAA0.2460.2190.0040.2520.3160.100−0.1430.1410.0420.1710.0780.522 *0.212−0.0670.3141
For abbreviations of morphological characteristics, see Table 1; * p < 0.01, ** p < 0.001, values without asterisks are not significant.
Table 3. Eigenvectors of principal component axes from the PCA for the morphological characteristics.
TraitComponent
PC1PC2PC3PC4PC5
Fruit weight (FW)0.868 **0.398−0.225−0.0070.051
Peel weight (PW)0.726 **0.423−0.234−0.0410.012
Pericarp thickness (PT)−0.130.326−0.606 **0.3990.006
Longitudinal diameter (LD)0.941 **0.155−0.2380.06−0.02
Transverse diameter (TD)0.917 **0.0350.091−0.081−0.023
Seed/pulp (SP)−0.3750.5700.600 **−0.0820.040
Seed weight (SD)0.796 **0.140.011−0.4310.04
Edible proportion (EP)0.457−0.67 **−0.1480.2340.154
Vitamin C (VC)−0.4920.626 **−0.030.2640.11
Reducing sugar (RS)0.352−0.595 **0.0870.443−0.177
Protein (Pro)0.2770.4230.618 **0.2910.03
Total flavonoids (TF)0.512−0.270.517−0.587 **−0.071
Titratable acid (TA)−0.15−0.109−0.068−0.1280.955 **
Total free amino acids (TFAAs)−0.4460.64 **0.3340.020.036
Total hydrolyzed amino acids (THAAs)0.3060.310.583 **0.500.22
Total eigenvalues5.0372.6831.6741.2181.041
% of Variance35.919.211.98.6987.433
Cumulative %35.955.167.175.883.2
** p < 0.001, values without asterisks are not significant.
Publisher’s Note: MDPI stays neutral with regard to jurisdictional claims in published maps and institutional affiliations.