Article

QTL Mapping of Resistance to Bacterial Wilt in Pepper Plants (Capsicum annuum) Using Genotyping-by-Sequencing (GBS)

1
Pepper and Breeding Institute, K-Seed Valley, Gimje 54324, Korea
2
National Institute of Horticultural & Herbal Science, Rural Development Administration, Wanju 55365, Korea
*
Authors to whom correspondence should be addressed.
These authors contributed equally to this work.
Horticulturae 2022, 8(2), 115; https://doi.org/10.3390/horticulturae8020115
Submission received: 23 November 2021 / Revised: 11 January 2022 / Accepted: 25 January 2022 / Published: 27 January 2022

Abstract

:
Bacterial wilt (BW) disease, which is caused by Ralstonia solanacearum, is one globally prevalent plant disease leading to significant losses of crop production and yield with the involvement of a diverse variety of monocot and dicot host plants. In particular, the BW of the soil-borne disease seriously influences solanaceous crops, including peppers (sweet and chili peppers), paprika, tomatoes, potatoes, and eggplants. Recent studies have explored genetic regions that are associated with BW resistance for pepper crops. However, owing to the complexity of BW resistance, the identification of the genomic regions controlling BW resistance is poorly understood and still remains to be unraveled in the pepper cultivars. In this study, we performed the quantitative trait loci (QTL) analysis to identify genomic loci and alleles, which play a critical role in the resistance to BW in pepper plants. The disease symptoms and resistance levels for BW were assessed by inoculation with R. solanacearum. Genotyping-by-sequencing (GBS) was utilized in 94 F2 segregating populations originated from a cross between a resistant line, KC352, and a susceptible line, 14F6002-14. A total of 628,437 single-nucleotide polymorphism (SNP) was obtained, and a pepper genetic linkage map was constructed with putative 1550 SNP markers via the filtering criteria. The linkage map exhibited 16 linkage groups (LG) with a total linkage distance of 828.449 cM. Notably, QTL analysis with CIM (composite interval mapping) method uncovered pBWR-1 QTL underlying on chromosome 01 and explained 20.13 to 25.16% by R2 (proportion of explained phenotyphic variance by the QTL) values. These results will be valuable for developing SNP markers associated with BW-resistant QTLs as well as for developing elite BW-resistant cultivars in pepper breeding programs.

1. Introduction

Pepper plants (Capsicum spp.) derived from the regions of American tropics belong to the Capsicum genus and Solanaceae family, including peppers, paprika, tomatoes, eggplants, and potatoes. It is regarded as one of the most important vegetable crops worldwide owing to diverse positive aspects in field of cuisine, medicine and healthcare, and economy [1,2,3]. Pepper fruits are largely consumed as fresh and dried ingredients as well as processed foods and render a wide variety of essential bioactive elements, such as vitamins, minerals, phenolics, carotenoids, and capsaicinoids [4,5,6,7,8]. The consumption of pepper has been gradually increased for several decades, together with the cultivation area and production in agriculture (http://www.fao.org/faostat (accessed on 9 August 2021) [9]. On the basis of Food and Agriculture Organization (FAO) [9], the cultivation area has occupied around 4.5 million hectare, and pepper production has reached around 67 million tons, including fresh and dried peppers, in the world [10]. Moreover, in terms of the world trade value of crops, the amount of chili peppers has ranked with the second position after tomato plants among the Solanaceae family [11]. However, pepper production is naturally threatened by biotic factors, including bacteria, fungi, and viruses in the agronomic field [12]. In particular, bacterial wilt (BW) is one of most destructive diseases throughout the world and has been widely spread in pepper crops across all over the Asia [13,14,15]. In 2017, BW led to a significant reduction of pepper yields and productions ranging from over 20 to less than 50% at most in the world cultivation area [16].
BW disease is caused by a soil-borne bacterial pathogen, R. solanacearum, and it is one of the global plant diseases [17]. The BW is seriously harmful for a large amount of the solanaceous family, including the vegetable crops of chili and sweet peppers, paprika, tomatoes, potatoes, and eggplants, which cause a plant-wilting disease. It is recognized as a wide range of hosts by invading over 450 different plant species through the broad climate spectrums containing tropical, subtropical, and temperate regions [18,19,20]. The pathogen of R. solanacearum enters plants via the natural opening and the wounded layers at the emergence sites of secondary roots or at root tips, which immigrate and colonize the host root cortex [21,22]. Subsequently, the R. solanacearum infects the parenchyma of the plant vascular system. The success of the invasion into xylem causes plant pathogenicity, including high population of the increased bacterial cells, diverse enzymes, and viscous di-and poly-saccharides by R. solanacearum. As such, the xylem vessels in plant roots are filled and blocked by the pathogenicity [23,24]. Interestingly, several reports have studied that the resistant cultivars possess an ability to restore the xylem transport system directly after the bacterial attacks, whereas the susceptible cultivars are observed with the xylem blocked by the occlusion derived from bacteria [25,26], leading to the damage of the water flow system inside the plant’s xylem. The malfunction results from plant yellowing, wilting, and dying depending on the severity of the disease symptoms [25].
To date, multiple management methods to govern the BW disease have been developed and applied in agriculture. Indeed, the effects of combatting the devastating BW have been shown with agronomical, physical, chemical, and cultural methods, including the crop rotation of different types, utilization of bactericides, and plant breeding programs [26]. However, the management strategies have been reported with limited and insufficient effects on the BW disease regulation owing to the wide variety of host range, diverse genetic variations of the pathogen, and long-term survival in plants [26,27,28].
In general, it is considered that the most effective control method is to breed elite, resistant cultivars in the pepper crops against the BW [29]. Remarkably, a wide variety of BW resistant-pepper accessions have been determined. For example, the BW resistant-pepper accessions (Capsicum spp.) with LS2341, PI358812, Kerting, PI322726, PI322727, PI369998, PI377688, PI322728, Jatilaba, MC4, MC5, PBC 066, PBC 437, PBC 631, and PBC 1347 display high BW resistance against a wide array of BW pathogens [30,31,32,33]. In addition to this, some researches have studied that BW resistance is involved in a quantitative inheritance and is polygenically governed by multiple genes (≥2 genes) in the pepper cultivar Mie-Midori [29]. A pepper cultivar, PM687, has been determined to have additive effects, which are influenced by the involvement of 2 to 5 candidate genes to regulate the BW resistance [34]. Additionally, A pepper accession called LS2341 has been identified with polygenes and linkage to a major quantitative trait loci (QTL), Bw1, located on chromosome 08, which possesses putative 44 candidate-resistance genes against R. solanacearum [35]. A recent report has uncovered a marker ID10-194305124 on the major QTL qRRs-10.1 on chromosome 10, which consists of five candidate R genes containing putative leucine-rich repeat (LRR) receptor or NB-ARC proteins and three defense-associated genes in the resistance pepper cultivar BVRC1 [36].
QTL mapping is a basic and powerful tool for genetic investigation of quantitative traits and high-density linked markers. Although the conventional QTL mapping is a time-consuming, labor-intensive, and costly procedure [37], advances in next-generation sequencing (NGS) technologies reduce sequencing cost and contribute to the rapid identification of QTL and the assessment of genome-wide single nucleotide polymorphism (SNP) in pepper crop [38]. The utilization of NGS for SNP discovery is beneficial, as it generates a large amount of sequence data that can be used for genotype-phenotype association [37,39,40]. Genotyping-by-sequencing (GBS) technology is a simple and robust method that is practical as a high-throughput genotyping tool for a large number and huge amount of DNA as well as for complex genomes of crop species [41,42]. Furthermore, GBS is a cost-effective technique with the advantages of reduced sampling time, decreased sequencing cost, and no limited reference genome sequences [37,43]. Recent studies have reported that the GBS tool is successfully applied to the various crops, including chickpea, maize, wheat, onion, soybean, pepper, and rice, for QTL mapping, high-density genetic mapping, SNP discovery, GWAS, genomic selection (GS), and genotyping [44,45,46,47,48,49,50,51,52]. Since the GBS tool possesses a wide applicability of QTL identification in pepper (C. annuum), genetic analysis of quantitative traits and high-resolution-linked markers for BW would contribute to more accurate marker-assisted selection (MAS) in plant genetics and breeding via GBS.
In this study, we produced 94 F2 recombinant lines derived from a cross between a resistant source of C. annuum, KC352, and a susceptible source of C. annuum, 14F6002-14, for QTL mapping of BW resistance to R. solanacearum isolates. Next, we constructed a genetic map with 94 F2 recombinant offspring. High-resolution SNP markers associated with BW resistance revealed novel QTL regions on chromosome 01 via GBS. The result will be utilized for developing SNP markers involved in BW resistance and for selecting and breeding elite BW-resistant pepper plants.

2. Materials and Methods

2.1. Plant Materials and Growth Conditions

The parental lines of C. annuum KC352 and 14F6002-14 were provided by pepper and breeding institute (Gimje, Korea), respectively. A total of 94 F2 individual lines were derived from a cross between KC352 and 14F6002-14. The pepper plants used for the experiment were grown at National Institute of Horticultural and Herbal Science (NIHHS, Wanju, Korea, 35°83′ N, 127°03′ E) under glasshouse conditions where temperature was controlled to 26/18 °C (day/night), and relative humidity (RH) was within 60–70%. The soil in pots was prepared as previously described in [53]. In brief, the commercial media (Bio Sangto, Seoul, Korea) was composed of coco peat (47.2%), peat moss (35%), vermiculite (10.0%), zeolite (7%), dolomite (0.6%), humectant (0.006%), and fertilizers (0.194%, 270 mg kg−1 N, P, and K), respectively.

2.2. DNA Extraction

A total of 96 plant samples from 9–10 leaf stage of 4-week-old plants were ground with the TissueLyser II (Qiagen, Hilden, Germany), and genomic DNA (gDNA) from the samples was extracted using cetyl trimethyl ammonium bromide (CTAB) method as previously described in [54].

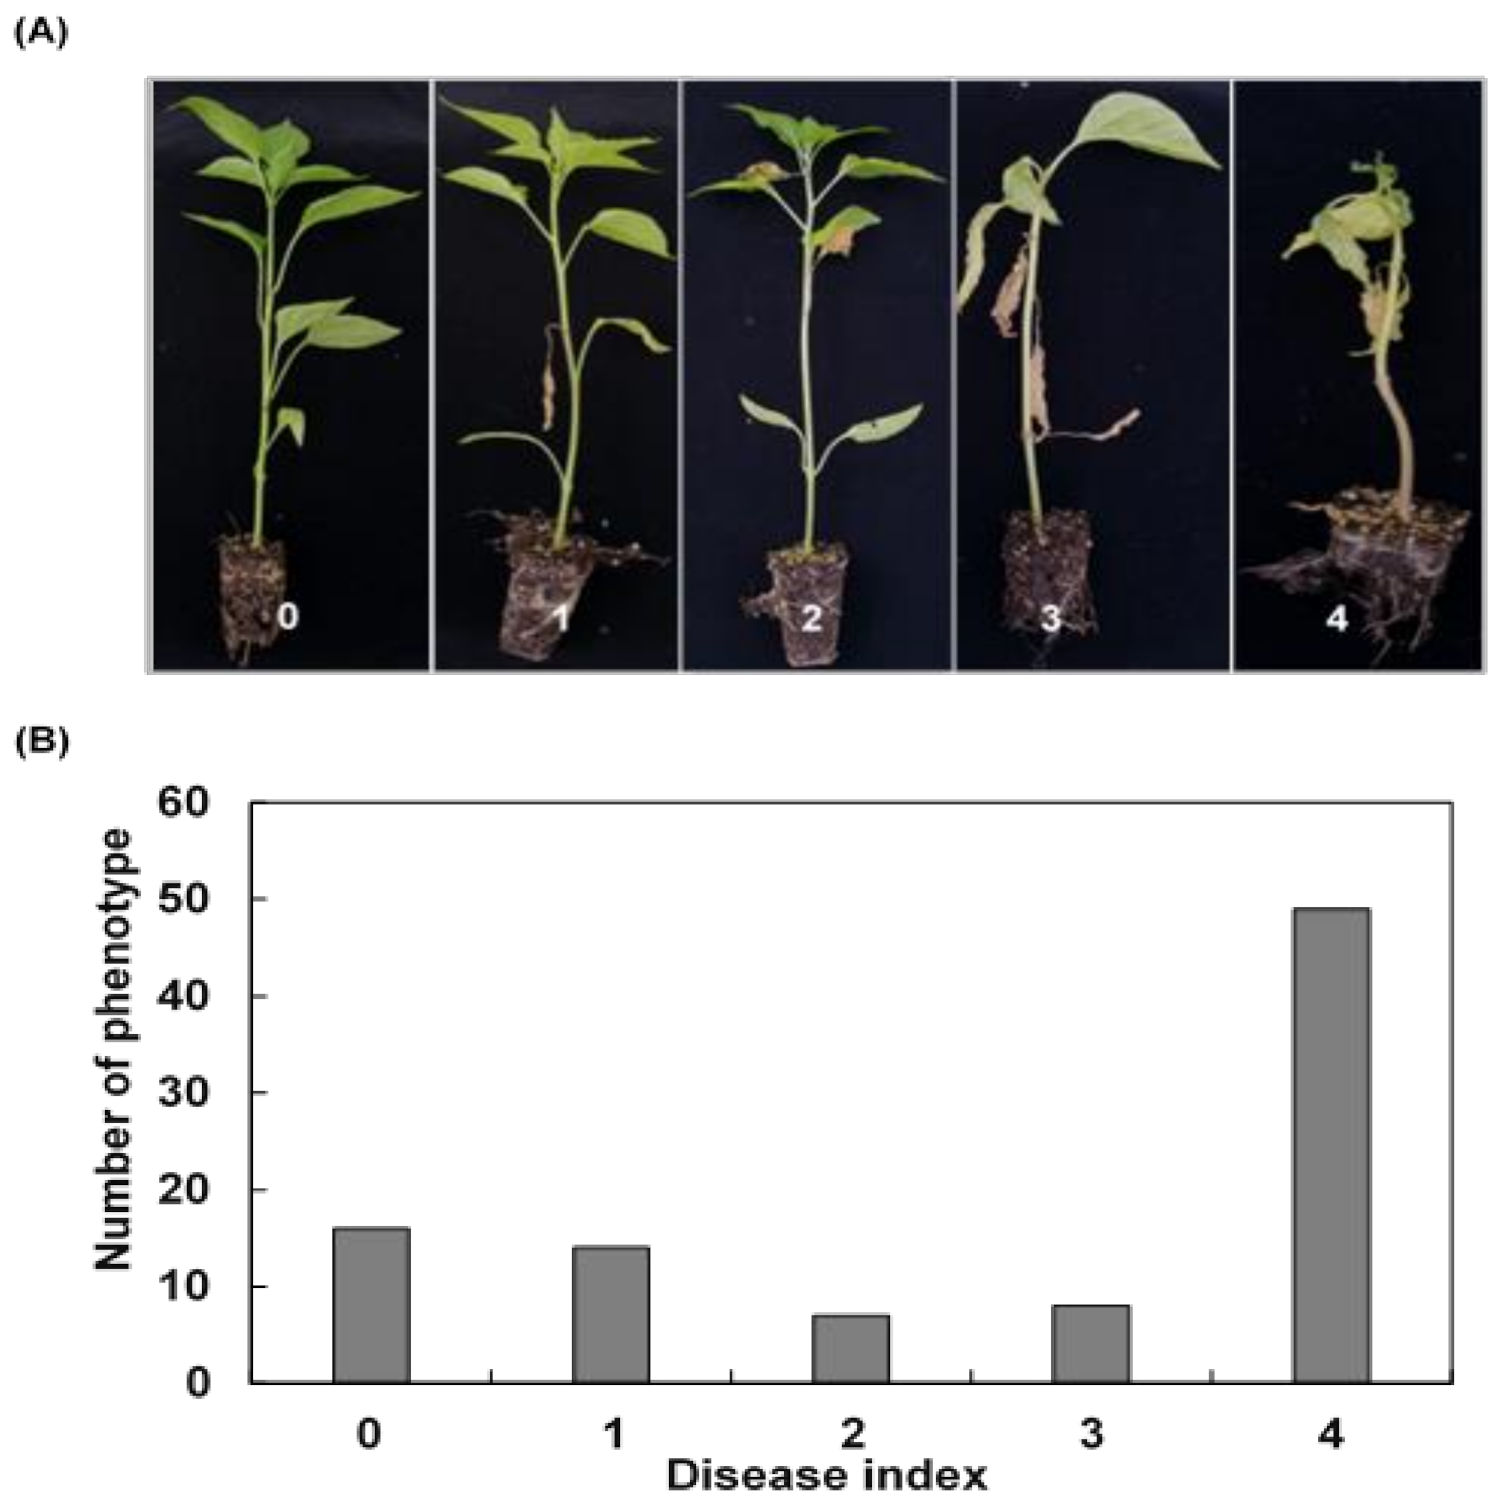
2.3. Disease Assay and Resistance Index Scoring

To evaluate resistance against R. solanacearum, resistance screening was conducted in 45–48 F2 offspring derived from a cross between parental lines of KC352 and 14F6002-14 with three independent replicates (Supplementary Figure S1). A total of 94 F2 lines were tested for the resistance screening and subsequent GBS analysis. To prepare the inoculum, the R. solanacearum of WR-1 strain isolates (race 1, biovar 3) were cultivated on NA medium and incubated at 28 °C for bacterial cell growth for 2–3 days. The plates were collected with distilled water to harvest the cells. The concentration was determined by measuring OD at 600 nm = 0.3, and the cell density was adjusted to approximately 107–108 cfu per mL before inoculation. Two parental lines and 94 F2 offspring were inoculated at the 6–7 leaf stage onto the plant roots with 5 mL of the bacterial suspension after wounding the plant roots by stabbing a scalpel along with two sides at a soil depth of 1–2 cm. The inoculated plants were kept under vinyl-protected conditions at 25 to 30 °C, and disease resistance was continuously observed and recorded after inoculation. C. annuum KC352 was utilized as the resistant control, whereas C. annuum 14F6002-14 was utilized as the susceptible control to compare the severity of disease symptoms in F2-segregating populations. The disease symptoms and disease resistance index were evaluated on the basis with disease scale of 0–4 as previously described in [25], where 0 = no visible symptoms, 1 = 1 to 25% of wilted leaves, 2 = 26 to 50% of wilted leaves, 3 = 51 to 75% of wilted leaves, and 4 = 76 to 100% of wilted leaves.

2.4. Preparation of Libraries for Genotype-by-Sequencing (GBS) Analysis

A total of 96 individuals were subjected to GBS analysis. The quantity and quality of extracted gDNAs were validated using 1% agarose gel electrophoresis before running next-generation sequencing (NGS). The preparation of GBS libraries was conducted as provided by SEEDERS sequencing company (Daejeon, Korea). To construct GBS libraries, gDNAs were digested with ApeKI (New England Biolabs, Ipswitch, MA, USA) [41] with a minor modification. In detail, oligonucleotides for the top and bottom strands of each barcode adapter and a common adapter were separately diluted in 50 µM TE buffer and annealed in thermocycler conditions followed with 95 °C, 2 min (ramp down to 25 °C by 0.1 °C/s; 25 °C, 30 min; 4 °C hold). Barcodes and common adapters were diluted in 10× adapter buffer, including 500 mM NaCl and 100 mM Tris-Cl to 10 µM, and 2.4 µL of the mixture was applied into a 96-well PCR plate. Then, 100 ng/µL of DNA samples were added to individual adapter-containing wells and digested for overnight at 75 °C with 3.6 U ApeKI (New England Biolabs, Ipswitch, MA, USA) in 20-µL volumes. Adapters were then ligated to sticky ends by adding 30 µL of a mixture containing 10× ligase buffer and 200 unit of T4 DNA ligase (MG Med, Seoul, Korea) to individual wells. The samples were incubated at 22 °C for 2 h and heated to 65 °C for 20 min to remove the activity of the T4 DNA ligase. The 96 digested DNA samples possessing a different barcode adapter were combined with each 5 µL and were purified using a purification kit (QIAquick PCR Purification Kit; Qiagen, Valencia, CA, USA) following the manufacturer’s instructions. Restriction fragments from each library were then amplified in 50-µL volumes containing 2 µL pooled DNA fragments, Herculase II Fusion DNA Polymerase (Agilent, Santa Clara, CA, USA), and 25 pmol with each of the primers in [41]. Polymerase chain reaction (PCR) was conducted with the following conditions: one cycle at 95 °C for 2 min, 16 cycles at 95 °C for 30 s, 62 °C for 30 s, 68 °C for 30 s, and stopped at 68 °C for 5 min. The amplified fragment size and library quality were assessed with Agilent Tape station with high-sensitivity DNA chip. Whole-genome sequences were conducted using Illumina Hiseq X ten platform (Illumina, San Diego, CA, USA).

2.5. Sequencing, Alignment, and SNP Genotyping

Raw reads were de-multiplexed, and the barcode sequences were trimmed using SEEDERS in-house python script as previously described in [49]. Reads were also trimmed using the Cutadapt (ver. 1.8.3) to eliminate the sequences of the common adapter. The de-multiplexed reads were processed by the SolexaQA package ver.1.13 [41]. Next, bad-quality bases with low Phred quality score (Q = 20 or 0.05 probability of error) were trimmed using DynamicTrim in the SolexaQA package, and the read lengths lower than 25 bp with poor-quality sequence were discarded, using Lengthsort program in the SolexaQA package [55]. The processed and cleaned reads were applied to align with C. annuum cv. CM334 reference genome (ver. 1.55, http://www.sgn.cornell.edu/ (accessed on 19 November 2019), and the read depth was counted by the number of aligned reads via the Burrows–Wheeler Aligner (BWA, 0.6.1-r104) program as described in [56]. The BWA was carried out with following default options: gap open penalty (−O) = 15, number of threads (−t) = 16, mismatch penalty (−M) = 6, maximum differences in the seed (−k) = 1, and gap extension penalty (−E) = 8, except for seed length (−l) = 30. The detection of raw SNPs and the consensus sequences were acquired from the resulting mapped reads with BAM format file using SAMtool (v.0.1.16) utilities [57]. For SNP calling, the varFilter command in the SAMtool was utilized with default options as previously described in [17,49]. Finally, on the basis of ratio of SNP/InDel reads in the mapped reads, variant types of SNP were grouped with three categories: homozygous SNP/InDel for read rate ≥90%, heterozygous SNP/InDel for read rate ≥40% and ≤60%, and the rest defined as “etc.” [49,58,59].

2.6. Linkage Map Construction

Genetic linkage maps of F2 segregating lines were illustrated using the JoinMap ver. 4.0 (Kyazma B.V., Wageningen, The Netherlands). A total of 1550 SNPs were grouped into 16 linkage groups (LGs) with a logarithm of the odds (LOD) threshold score ≥5.5, and a maximum distance of 30 centiMorgans (cM) were used. The genetic map distance of the SNP markers was converted to cM using the Kosambi’s mapping function [60]. To remove the skewed SNP and the segregation distortion, the chi-square test (p < 0.001) was applied, and the SNP markers were filtered with identical segregation or missing rate ≥30%. Final genetic linkage maps of KC352 and 14F6002-14 with the 1550 SNPs were drawn using MapChart ver. 2.3 software [61].

2.7. QTL Analysis and Candidate Genes Prediction

QTL analysis was performed with composite interval mapping (CIM) to map the QTLs involving pepper bacterial wilt resistance using the Windows QTL Cartographer v. 2.5 program [62]. The CIM was operated at a 1.0-cM walk speed using the model 6 parameters (standard model) and the forward and backward regression model. The LOD threshold level for significance of each QTL was determined as 1000 permutations of p < 0.05. To identify candidate genes, the positions of highly significant QTLs regions on the genetic map were compared with their physical positions on the C. annuum cv. CM334 reference genome (ver. 1.55, http://www.sgn.cornell.edu/ (accessed on 19 November 2019), and 1 Mb left and right sequences were mined for candidate genes from respective corresponding marker. Putative functions of the candidate genes were further annotated with an application of sequence alignment using CM334 reference genome (ver. 1.55, https://solgenomics.net/ (accessed on 21 December 2021), Kyoto Encyclopedia of Genes and Genomes (KEGG) (https://www.genome.jp/kegg/ (accessed on 21 December 2021), SwissProt (https://www.uniprot.org/ (accessed on 21 December 2021), Gene Ontology (GO) (https://www.geneontology.org/ (accessed on 23 December 2021), and the NCBI non-redundant protein (NR) (https://ncbi.nih.gov/blast/db/ (accessed on 23 December 2021) with default values.

2.8. Data Analysis

The Tukey’s HSD/Kramer test (p < 0.05) and the descriptive statistics of disease index were analyzed using SPSS program (IBM SPSS v27.0, Chicago, IL, USA). The Pearson’s correlation coefficients were calculated using the R statistical Software (ver. 4.0.1, https://www.r-project.org (accessed on 3 January 2022)).

3. Results

3.1. Phenotyping of the Resistance for Bacterial Wilt Disease

In order to evaluate bacterial wilt (BW) resistance, we observed phenotypes for 5–21 days after inoculation of R. solanacearum suspension into parental lines and 94 F2 lines. The degree of disease severity was evaluated as disease index (DI), with disease scale ranging from 0 (no symptoms) to 4 (76 to 100% wilted leaves) (Figure 1A). Among the 94 inoculated plants, 16 plants were observed with no visible symptoms (DI = 0), representing a resistant line to BW, whereas 49 plants were observed with 76–100% wilted leaves (DI = 4), representing a susceptible line to BW (Figure 1B). In addition to this, we observed 14 plants with 1 to 25% wilted leaves (DI = 1), 7 plants with 26 to 50% wilted leaves (DI = 2), and 8 plants with 51 to 75% wilted leaves (DI = 3) (Figure 1B). Overall, the average DI value of the F2 population was 2.638, and the wilt rate (%) was 68.085. The skewness and kurtosis value of the DI was −0.604 and −1.352, respectively, suggesting that the resistance level of the plants to R. solanacearum is susceptible, and the population might be a non-normal distribution rather than a normal distribution (Table 1).

3.2. GBS Analysis

Next, in order to conduct a genotyping-by-sequencing (GBS) analysis, all 96 plants were collected, and a construction of 96-plex GBS library was generated. As such, a total of approximately 108.0 Gbp of DNA sequences (715,257,004 reads) were obtained from single-lane sequencing using Illumina Hiseq X ten platform (Table S1). The GBS raw data ere de-multiplexed according to the 96 barcode sequences. The de-multiplexed sequences of the 96 samples were trimmed by eliminating the sequences of the barcode and adaptor and removing the low-quality information. Finally, the average number and total length of trimmed reads were 6,046,776 and 696 Mbp, respectively. In addition, the average length of trimmed reads (bp) and the total trimmed raw data were 119.99 bp and 94.45%, respectively (Table S1). The trimmed data were further mapped to the reference genome: Capsicum. annuum cv. CM334 ver. 1.55, sourced by Sol Genomics Network (http://www.sgn.cornell.edu/ (accessed on 19 November 2019). The average numbers of mapped reads and mapped regions were 5,216,671 and 125,718, respectively (Table S1). The average depth and length of the mapped regions were 14.75 and 233.34 bp, which covered 0.56% of the reference genome. To further mine SNPs from the sequence data, in-house GBS analysis pipeline was applied with filtering criteria. A total of 628,437 raw SNPs was identified in 94 F2 lines (Table S2). The SNPs were filtered to identify putative markers using the criteria of 30% missing values across the genotyped individual and MAF ≥ 25%, which yielded a total of 146,217 SNPs. Moreover, 11,020 SNPs were filtered using both missing <30% and MAF > 25% condition. Furthermore, 4387 homozygous SNPs in KC352 were selected (Table S2). After generating a map of the genotyping and SNP selections using 500 kb as the window size, 1643 SNP markers were identified, and a total of 1639 SNPs were produced with polymorphic SNP between KC352 and 14F6002-14 as the parents (Table S2).

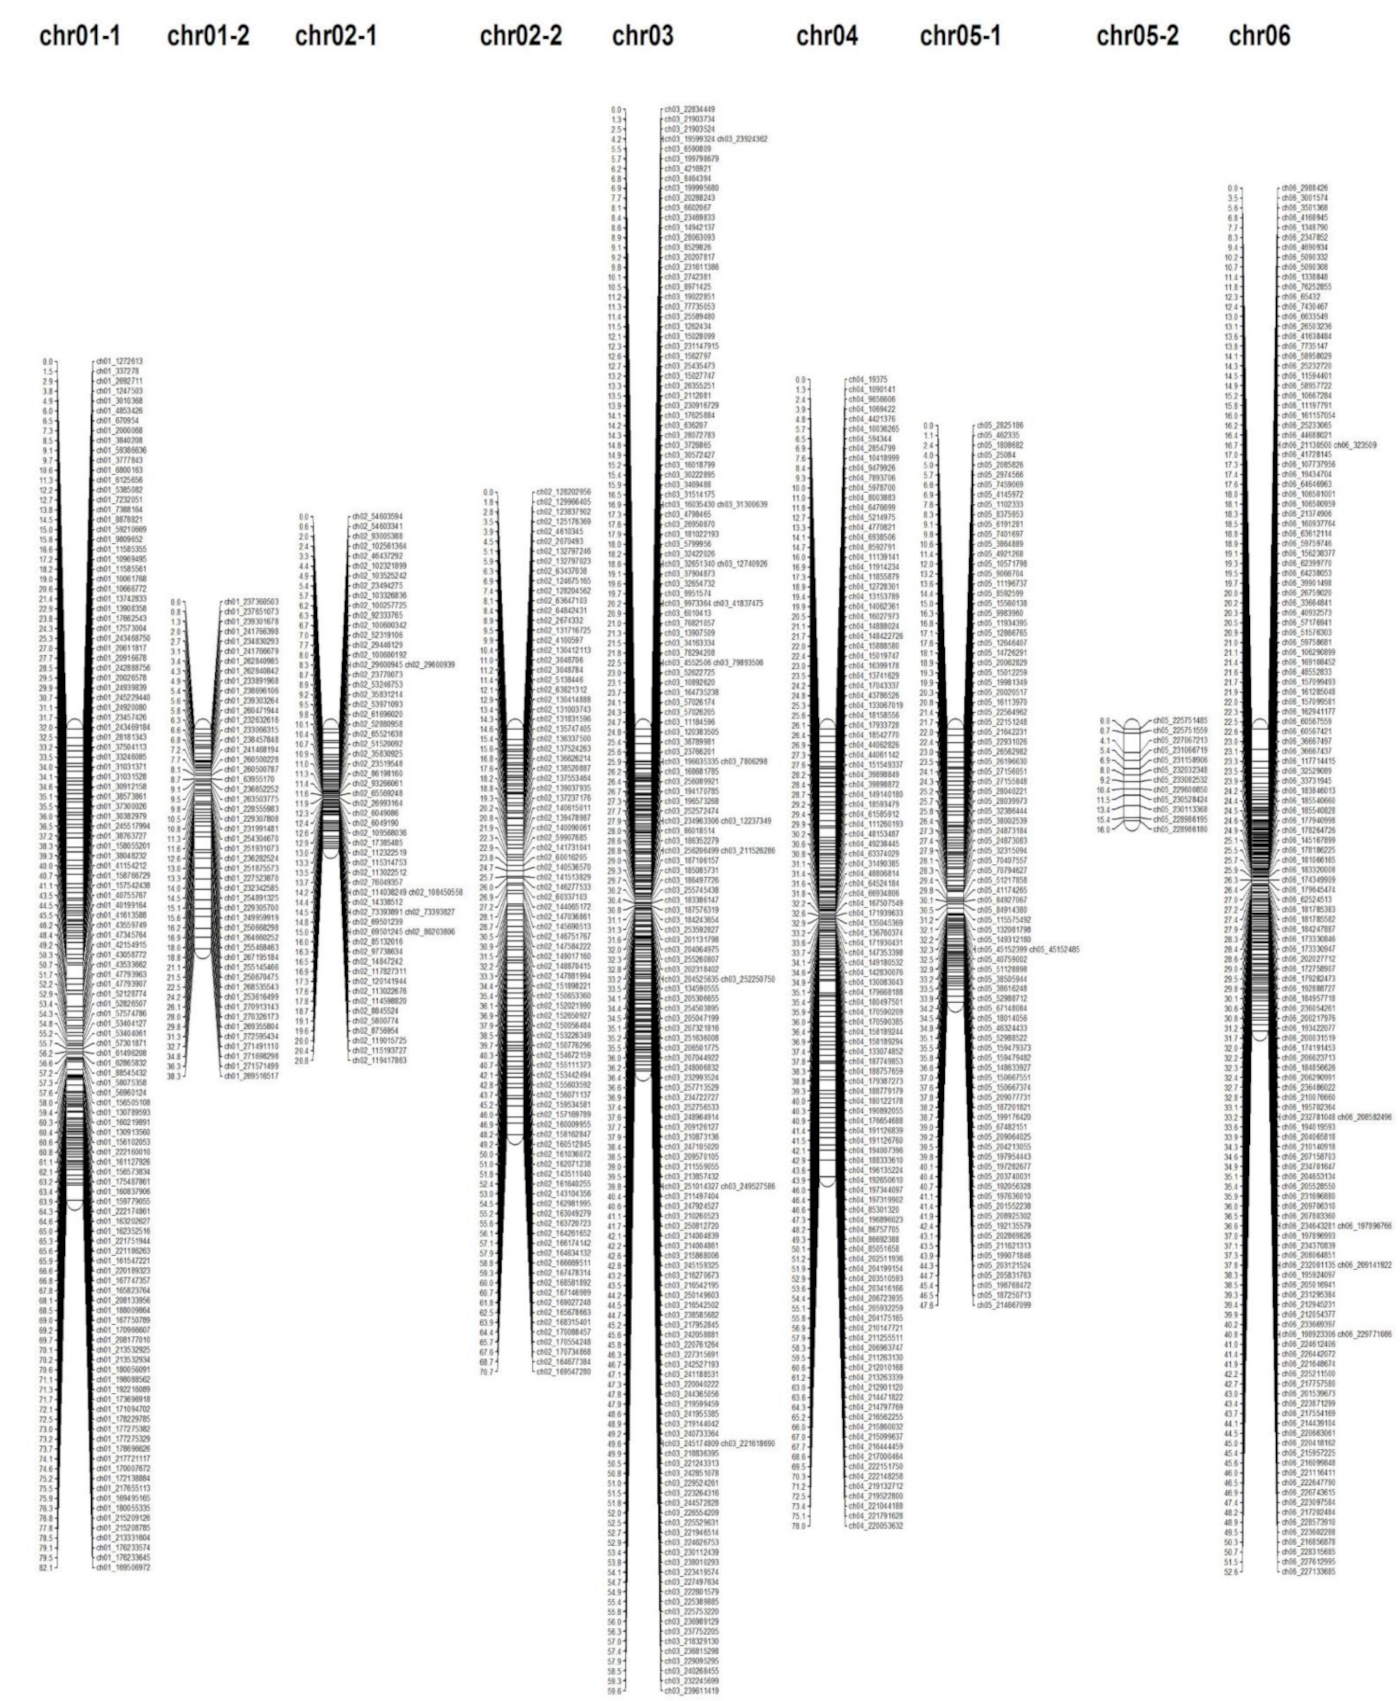
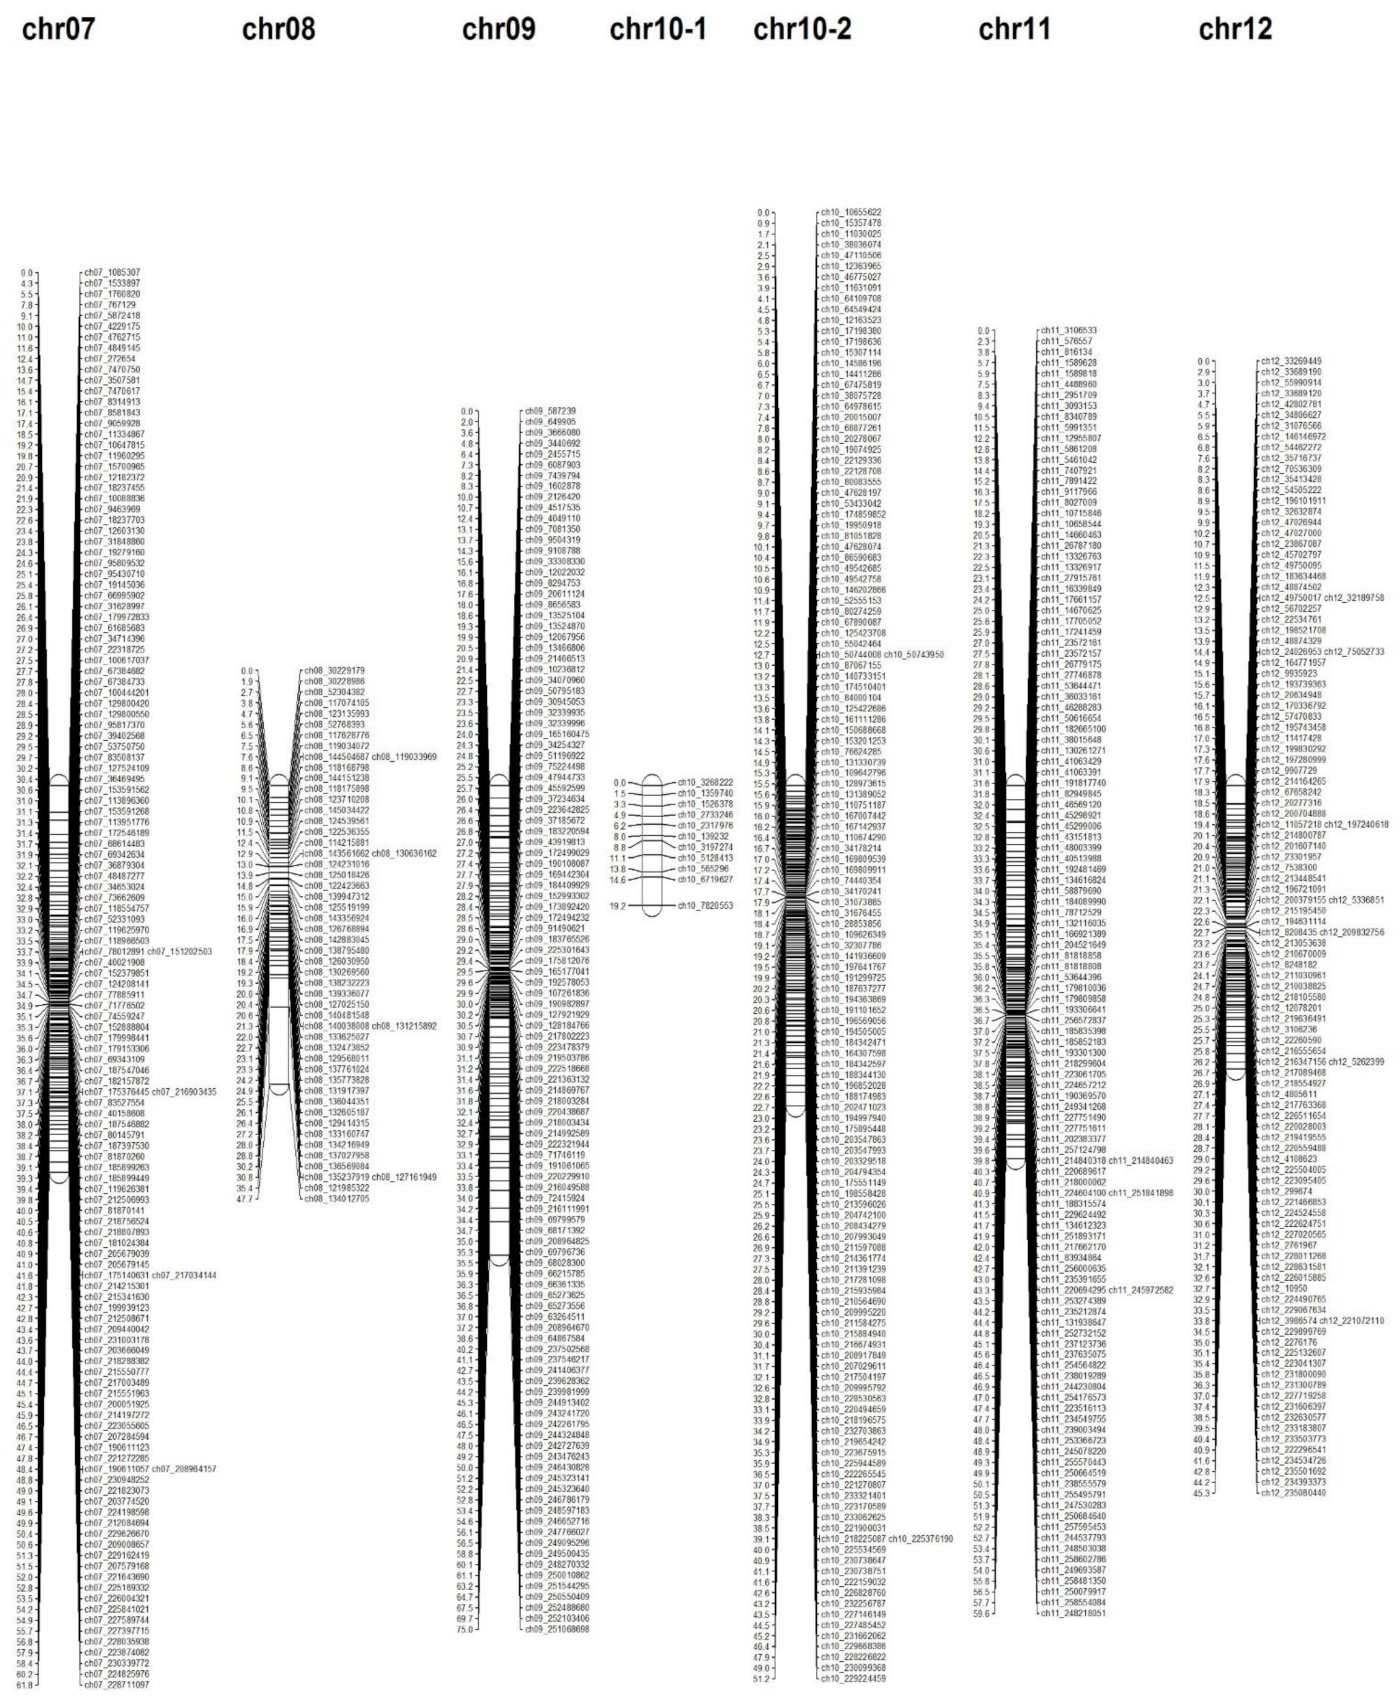
3.3. Construction of Linkage Mapping

In order to construct a pepper genetic linkage map, 1639 SNPs were utilized for linkage grouping using the SNP matrix from GBS analysis. As such, the linkage map consisted of 1550 SNP markers on 16 linkage groups (LG) (Table 2 and Figure 2). The linkage map covered a total length of 828.449 cM with an average distance of 0.676 cM between adjacent markers (Table 2 and Figure 2). Next, LG_04 showed the maximum lengths, which were 78.045 cM (chromosome 04) in the largest LG, whereas LG_05-2 showed the minimum lengths, which were 15.952 cM (chromosome 05) in the smallest LG (Table 2). The number of mapped SNPs per chromosome ranged from the minimum 11 in chromosome 10 to the maximum 172 in chromosome 03, with an average number of 96.875 SNP markers per LG (Table 2 and Figure 2). Moreover, the correlation coefficient between genetic and physical maps was estimated among the 16 linkage groups. Chr.07 exhibited the highest correlation coefficient of 0.876, and the average correlation coefficient was 0.670.

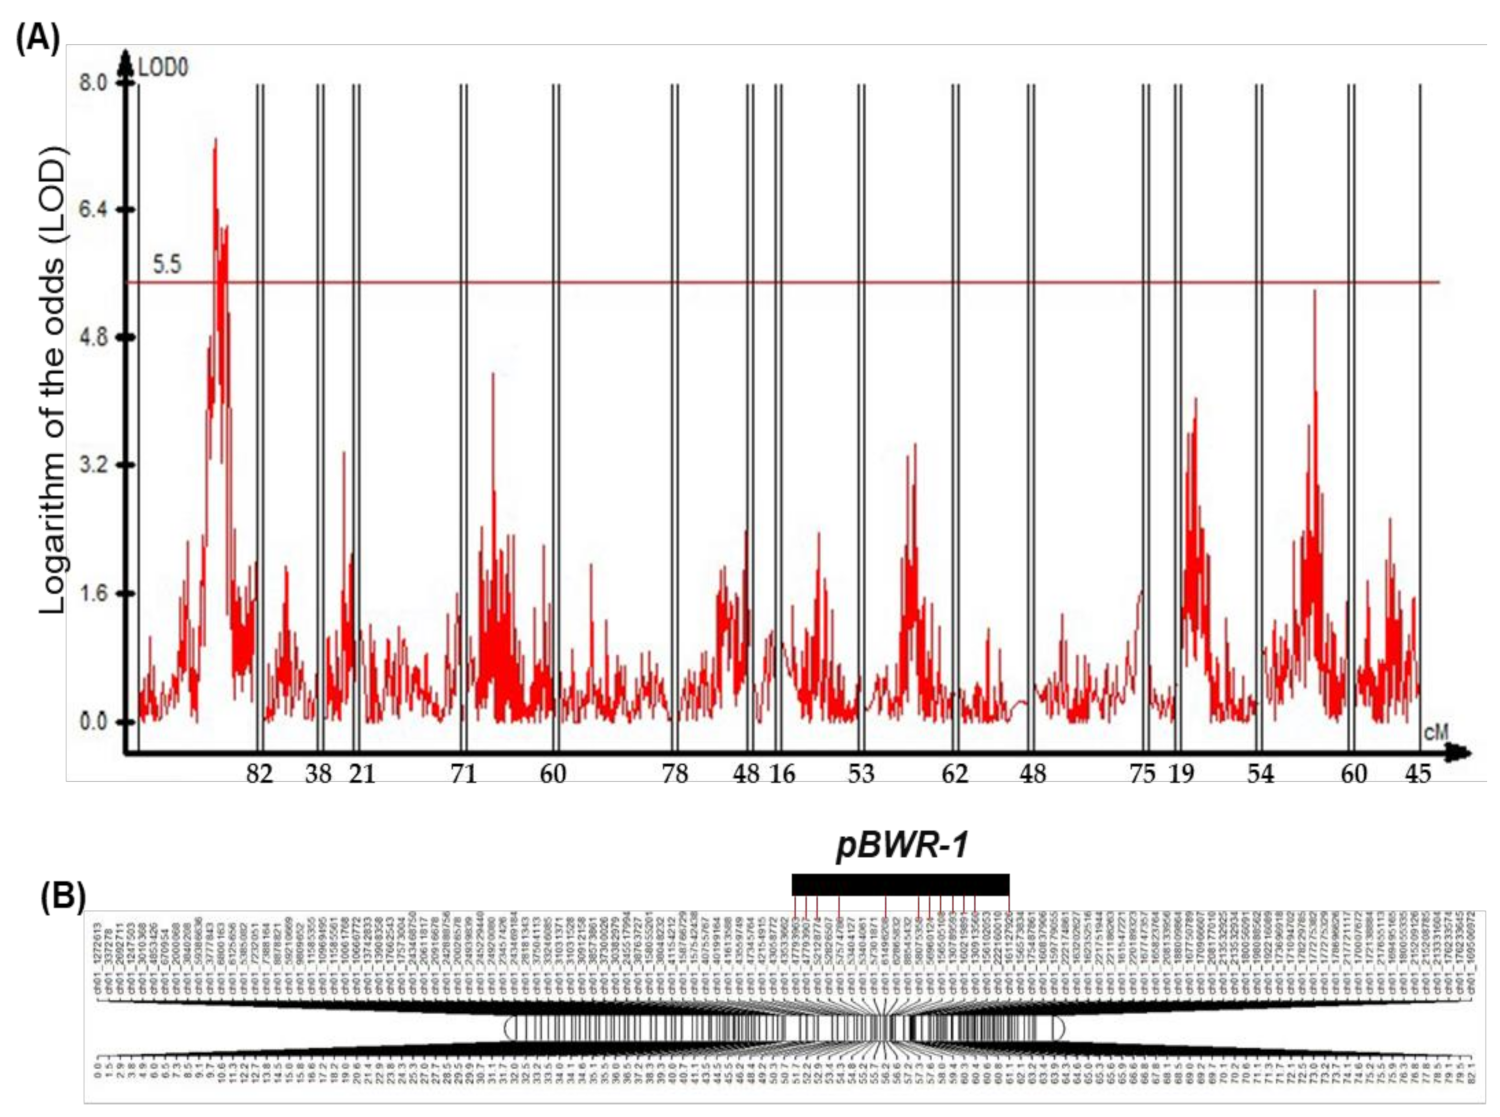
3.4. QTL Analysis for Bacterial Wilt (BW) Resistance

In order to analyze significant quantitative trait loci (QTL) regions, the 1000 permutation was tested at p < 0.05, and the LOD threshold was calculated as 5.5 by QTL cartographer. Notably, the LOD values ranged from 5.69 to 7.06, which was detected in chromosome 01 via CIM (Figure 3A). On the basis of the threshold levels, we designed one QTL, pBWR-1, named the pepper Bacterial Wilt Resistance-1 on chromosomes 01 (Figure 3B). In addition, the significant LOD ≥ 5.5 regions identified at the pBWR-1 QTL region were within LG_01-1 on chromosome 01. The pBWR-1 QTL was located between the ch01_47793963 and ch01_161127926 markers on chromosome 01 with twelve markers (Figure 3B and Table 3). The explained phenotypic variance of the QTL was ranged from 20.13 to 25.16% (Table 3).

3.5. Prediction and Annotation of Candidate Genes

In order to identify candidate genes within the major QTL region, the number of genes was selected with the 1 Mb to the left and right of the corresponding markers, and a total of 31 candidate genes were annotated on the basis of CM334 reference genome, Swiss-Prot, and the NCBI non-redundant protein (NR) databases (Table 4). In addition, functional classification of 31 predicted genes was further analyzed along with the Kyoto Encyclopedia of Genes Genomes (KEGG) pathway and Gene Ontology (GO) term (Table 4). As such, the analysis of GO term enrichment identified one gene (CA01g20110) annotated with “defense response” (GO: 0006952), and the KEGG analysis identified one gene (CA01g20130) with “plant–pathogen interaction” (KO: 13457). Overall, four of the 31 candidate genes were assigned to defense-associated genes; CA01g18650 in ch01_156505108 marker and CA01g20130 (putative disease resistance protein RPM1), CA01g20110 (Thaumatin-like protein), and CA01g20140 (NB-ARC domain-containing protein) in ch01_161127926 marker were predicted as disease-resistance proteins. Taken together, the annotated four disease-resistance/defense-associated genes would be crucial candidate genes for pBWR-1 QTL in the present study.

4. Discussion

BW is one of the most destructive pepper diseases worldwide, leading to the reduction of yield and production in pepper cultivation [16,63]. It is difficult to manage BW disease owing to a wide array of plant host range, a huge number of diverse BW isolates, and its long survivability in pepper plants [18,19,20]. Thus, it is indispensable to breed resistant pepper cultivars against BW. Although molecular marker-assisted selection (MAS) for BW resistance can contribute to a rapid selection of BW-resistant breeding in pepper crops, a few studies have determined QTL regions [17,36,62]. In this study, we performed QTL analysis to develop molecular markers that are associated with BW resistance in pepper (Capsicum annuum) by evaluating the 94 F2 recombinant lines obtained by a cross between a resistant and a susceptible parental line. We first constructed a genetic linkage map using GBS approach and identified significant QTL regions on chromosome 01 associated with BW resistance.

4.1. Construction of Pepper Genetic Map

GBS is a genome-wide genotyping, powerful, and straightforward approach that takes advantage of enzyme-based genome analysis, thereby conferring a rapid and cost-effective analysis of the huge and complex genome in organisms. The GBS tool has been widely utilized in genotyping segregated plants via the combination of a high-throughput next-generation sequencing (NGS) technology to generate multiplexed libraries using barcoded adapters [64,65]. With the application of GBS analyses, it has been reported that a large amount of barely SNPs are produced, and ≥34,000 SNPs are mapped onto its reference genome sequences, and ≥20,000 wheat SNPs are constructed onto its reference map [65]. Moreover, the method has identified 9998 SNPs and 64,754 SNPs located on the peach and pea genomes, respectively [66,67]. Notably, recent studies have explored and evaluated 1,399,567 SNP in onion using a GBS library [50], and a total of 91,132 raw SNPs were uncovered via a QTL study involved in flowering time in perilla [49]. In addition to this, current applications of GBS analysis have exhibited a total of 22,446 SNPs for QTL mapping of the resistance against the cucumber mosaic virus in a cucumber crop as well as a total of 66,405 SNPs for Phytophthora capsici resistance in a pepper crop [48,59]. In the present study, a total of 628,437 raw SNPs were identified and successfully genotyped with 94 F2 offspring using GBS. Around 108 Gbp of raw data (Tables S1 and S2) and a total 1639 SNPs were finally produced, and the SNP markers were shown with genome-wide distribution, covering the whole pepper genome (Figure 2). A total of 1550 SNP markers were ultimately constructed on a genetic linkage map, which comprised 16 LGs, including one linkage group on chromosome 03, 04, 06, 07, 08, 09, 11, and 12 as well as two linkage groups on chromosome 01, 02, 05, and 10, respectively (Figure 2 and Table 2). In general, SNP markers used for genetic mapping are based on the polymorphic markers of the parent. When the polymorphism of the parent is absent in a large region within the middle of the genome, separating two linkage groups on one chromosome can often be produced although the genetic map is physically one chromosome. In particular, the phenomena often occur when working with breeding lines. Indeed, previous reports have shown that Yellow lupin (Lupinus luteus L.) possesses 26 chromosomes, but 40 linkage groups were constructed for QTL mapping via NGS approaches [68], and a linkage group of LG01 was divided into two LGs on chromosome 01 in perilla via GBS [49]. Recently, it has been determined that linkage map is constructed with the resistance trait of powdery mildew from F5 pepper population via GBS. The LG07 is separated into two linkage groups on chromosome 07 [69].

4.2. Genetic Inheritance of pBWR-1 QTL on Chromosome 01

As mentioned above, it has been reported that the genetic analysis and identification of resistance genes play a crucial role in the field of crop breeding against BW [24,30,31,34,35,36,38,63]. Nonetheless, the genetic inheritance is poorly understood in the involvement of BW resistance in pepper crops, and the mechanism of genetic inheritance is still unclear since different pepper sources result in different values of BW resistance. In our results, we evaluated 49 F2 offspring as the DI value 4 (the most severe symptoms, 76 to 100% wilted leaves), whereas 14 plants were evaluated as DI value 1 (no visible symptoms) with the comparison of the parental lines after BW inoculation (Figure 1). We observed susceptible plants 3.5 times more than resistant plants in the F2 population, implying that BW resistance might be a partially recessive trait in the pepper lines used for our experiment. In similar line with our result, the genetic inheritance of BW resistance has been unraveled, and the resistance homozygous recessive (rr) allele was identified using F2 populations derived from a cross between resistant Anugraha and susceptible Pusa Jwala of near-isogenic lines (NILs) in pepper crops [70]. On the contrary, it has been determined that the inheritance action of BW resistance is involved in an incomplete dominance with more than two BW-resistance genes using the progeny derived from a cross between the capsicum Mie-Midori (resistant line) and the capsicum AC2258 (susceptible line) [29]. It has been also studied that the BW resistance is governed by two to five genes using the progeny derived from a cross between the PM687 (resistant line) and the Yolo (susceptible line) [34]. In addition to this, researches have demonstrated that the disease severity in F1 hybrids is close to or lower than the generation-means of mid-parent values [29,49], and the progeny derived from BVRC 1 (resistant line) and BVRC25 (susceptible line) [36] as well as from MC4 (resistant line) and Subicho (susceptible line) exhibited the association of more than two resistance genes against R. solanacearum, indicating that the BW resistance would be involved in a partial dominance effect [71]. Although the complex mechanism still needs to be elucidated, the contradictory findings might result from diverse factors, including the different pepper sources of breeding lines, the different inoculation methods, the bacterial isolates, the different criteria using DI calculation, and the different environmental growth factors. It is, therefore, of our interest to further study the complex action of genetic inheritance in the pepper source used for the experiment with the comparison of other BW-resistant lines.

4.3. Detection of Major QTL Controlling Resistance to R. solanacearum

Multiple management strategies have been actively developed and applied to control the BW disease. However, the effects have been limited and insufficient for the control of destructive BW disease owing to the different pepper sources, the bacterial isolates, and different inoculation methods as mentioned above [26,27,28,63]. Besides, high disease-resistance phenotype is not always associated with a good performance of horticultural traits, such as good fruit shape, fruit size, fruit yield, and fruit quality [71]. Thus, it is crucial to understand the genetic basis for resistance to BW disease to utilize pepper breeding programs using MAS, thereby ultimately integrating BW resistance with desirable traits during a breeding process [47,48,71]. In previous studies, the pepper accessions of LS2341 and BVRC1 have been determined with a Bw1 QTL and a major qRRs-10.1 QTL underlying on chromosome 08 and 10, respectively [35,36]. Initially, Mimura et al. (2009) reported that the CAMS451 marker of Bw1 QTL in linkage group 11 (LG11) was located on chromosome 01 with the comparison of a LG01 on chromosome 01 of SNU3 map, which was integrated by a genetic linkage map of an interspecific cross between C. annuum and C. chinense [35]. However, the group reported the linkage group was shifted to chromosome 08 from 01 again [72]. The current studies suggest that the LG 11 is possessed by chromosome 08 rather than 01 in C. annuum. Mathew (2020) recently reported that the pepper CAMS451 marker of Bw1 QTL lies on chromosome 08 (position: 122704651-124710667) and has annotated 44 defense-associated genes from 1 Mb upstream and downstream of the marker [73]. In addition to this, another research on the BW resistance against R. solanacearum demonstrated that a major qRRs-10.1 QTL region is located on chromosome 10 (position: 56910000-69110000, 111090000-183670000) in C. annuum. Interestingly, 54 genes were annotated, and five putative R genes lie on the regions of 193.4–196.3 Mb, which are nearly closed to the markers of ID10-194305124 and ID10-196208712 [36]. In contrast, in the present study, we identified the major pBWR-1 QTL region on chromosome 01 via a CIM method using the GBS analysis on the basis of the threshold levels (Figure 3), which exhibited the remarkable LODs from 5.69 to 7.06 in LG_01-1 (Table 3). Importantly, our finding shows that the major pBWR-1 QTL region underlies on chromosome 01 (position: 47793907–61496208, 130789593–161127926) with 12 markers, which encode 31 candidate genes in the region (Table 3 and Table 4). These discrepancies of previous and our current result on the genome loci would result from a variety of materials and methods as aforementioned reasons.

4.4. pBWR-1 Candidate Genes for Resistance to R. solanacearum

We annotated the 31 candidate genes on the basis of sequence alignment using CM334 reference genome, KEGG, Swiss-Prot, GO, and NR databases (Table 4). Among them, four candidate genes were annotated as defense-associated genes: one gene, CA01g18650 (putative disease-resistance protein RPM1), in ch01_156505108 marker and three genes, such as nearly tandem-arrayed genes CA01g20110 (GO: 0006952, Thaumatin-like protein), CA01g20130 (putative disease-resistance protein RPM1, KO: 13457), and CA01g20140 (NB-ARC domain-containing protein), in ch01_161127926 marker. In comparison with previous publications, the identified candidate genes might not be similar to Mathew’s (2020) results on chromosome 08, whereas the genes encoding LRR proteins and NB-ARC domain-containing protein on chromosome 10 in Du et al. (2019) are shared with our results, implying that these genes are possibly indispensable for BW resistance.
Previous studies have reported that pathogen defense-associated R genes are tandemly located in chromosomes [74,75,76]. For example, eight genes encoding an amino terminal coiled-coil domain (CC), a central nucleotide binding (NB) site, leucine-rich repeat (LRR) domain are tandemly arrayed in the Pvr4 locus of CM334 genome in C. annuum. Fourteen genes encoding NB-LRR tandemly lie on the Tsw locus of PI159236 genome in C. chinense. Moreover, among of three tandem-arrayed R genes within the qRRS-10.1 QTL, two genes, including CA10g13010 and CA10g13020, were annotated as Bs2, which is classified into the NB-LRR family, suggesting that NB-LRR proteins play a crucial role in disease resistance against pathogens [75]. It has been studied that elongation factor tu receptor (EFR) from Arabidopsis and Bs2 from pepper are expressed in tomato plant for controlling BW and bacterial spot (BS), respectively [77]. Intriguingly, the EFR was determined as a critical component in plant defense of PAMP-triggered immunity (PTI) via the interaction between conserved PAMPs and bacterial pathogens [78]. Furthermore, Du et al. (2019) reported that CA10g12520 within the qRRS-10.1 QTL encodes PR-1 gene, indicating the participation in the interaction of plant and pathogen via PTI. In similar line with previous results, we identified CA01g18650 and CA01g20130 encoding putative disease-resistance protein RPM1. The bacterial resistance to Pseudomonas syringae pv. maculicola 1 (RPM1) encodes a CC-NB-LRR family protein, which is a peripheral plasma membrane protein [79,80]. The RPM1 recognizes the effector proteins of avrB or avrRpm1 of Pseudomonas syringae in Arabidopsis, resulting in the rapid generation of a hypersensitive response (HR) [79,80,81]. Moreover, identified CA01g20140 harbors NB-ARC domain-containing protein. It has been shown that effector-triggered immunity (ETI) is associated with nucleotide-binding leucine-rich repeat (NLR) proteins [82]. A variety of plant NLRs possess an NB-ARC domain (nucleotide-binding adaptor shared by Apaf-1, R proteins, and CED4), which is able to interact with NLR domain-containing proteins, indicating that an NB-ARC domain is important for pathogen defense [83,84]. Importantly, we also identified CA01g20110 encoding Thaumatin-like protein (GO: 0006952). Previous researches have reported that Thaumatin-like proteins (TLPs) are classified into PR (pathogenesis-related protein)-5 class protein, and TLP genes are upregulated in peanut (Arachis hypogaea L) with the treatment of the leaf spot pathogen, Phaeoisariopsis personata [85], as well as in wheat (Triticum aestivum) by leaf rust fungus, Puccinia triticina [86]. In addition, constitutive expression of Arabidopsis Thaumatin-like protein 1 (ATLP1) in potato are observed with reduced lesions and percent reductions in response to Alternaria solani and Phytophthora infestans [87], implying that TLPs are essential in diverse biotic response. Although we cannot completely rule out the effect of differential expression of other candidate genes in the list (Table 4) and minor QTL effects that were not detected on the BW resistance in the current study, it is our endeavor for future research to focus on the understanding of genetic mechanisms, such as inheritance factors, as well as on functional analysis of the identified candidate genes in the resistance to R. solanacearum.

5. Conclusions

In the present study, the disease symptoms and resistance for BW were evaluated by the inoculation with R. solanacearum using 94 F2-segregating populations. Using GBS, 628,437 SNPs were identified, and the filtered 1550 SNP were subsequently constructed into the genetic linkage map displaying 16 LG. QTL analysis revealed that pBWR-1 QTL was located on chromosome 01, and the number of 31 candidate genes were identified in the significant QTL regions. Importantly, the identified four genes encode defense resistance-associated proteins, such as CC-NB-LRR family protein, NB-ARC domain-containing protein, and Thaumatin-like proteins. Our finding will contribute to deep insights into the information for developing SNP markers associated with BW-resistant QTL as well as for developing BW-resistant cultivars in pepper breeding programs.

Supplementary Materials

The following are available online at https://www.mdpi.com/article/10.3390/horticulturae8020115/s1, Supplementary Figure S1: Distribution of the disease index after inoculation with Ralstonia solanacearum; Table S1: Genotyping-by-sequencing (GBS) statistics for 96 samples; Table S2: Single-nucleotide polymorphism (SNP) filtering criteria.

Author Contributions

Conceptualization, J.-B.Y.; methodology, S.-Y.C., J.-W.D., S.-C.H. and K.-H.L.; investigation, S.-Y.C., J.-W.D., S.-C.H. and K.-H.L.; writing—original draft preparation, S.-Y.C. and K.L.; writing—review and editing, K.L., M.-C.C. and E.-Y.Y.; visualization, K.L. and E.-Y.Y.; supervision, M.-C.C. and J.-B.Y. All authors have read and agreed to the published version of the manuscript.

Funding

This study was supported by a grant from Golden Seed Project (Project No.: 213006-05-05-SB630 “Development of molecular markers for Bacterial wilt resistance and high-pungency in chili pepper”).

Institutional Review Board Statement

Not applicable.

Informed Consent Statement

Not applicable.

Data Availability Statement

The datasets presented in this study are available upon request to the corresponding author.

Acknowledgments

The authors thank Sung-Hwan Jo at SEEDERS Inc., Republic of Korea, for assistance via intellectual discussions.

Conflicts of Interest

The authors declare no conflict of interest.

References

  1. Bhutia, K.; Khanna, V.; Meetei, T.; Bhutia, N. Effects of climate change on growth and development of chilli. Agrotechnology 2018, 7, 2. [Google Scholar] [CrossRef]
  2. Prohens, J.; Nuez, F. Handbook of Plant Breeding. Vegetables II: Fabaceae, Liliaceae, Solanaceae and Umbelliferae; Springer: New York, NY, USA, 2008; Volume 3, pp. 30–40. [Google Scholar]
  3. Fraenkel, L.; Bogardus, S.T.; Concato, J.; Wittink, D.R. Treatment options in knee osteoarthritis: The patient’s perspective. Arch. Intern. Med. 2004, 164, 1299–1304. [Google Scholar] [CrossRef] [PubMed]
  4. Sun, T.; Xu, Z.; Wu, C.T.; Janes, M.; Prinyawiwatkul, W.; No, H. Antioxidant activities of different colored sweet bell peppers (Capsicum annuum L.). J. Food Sci. 2007, 72, S98–S102. [Google Scholar] [CrossRef] [PubMed]
  5. Blum, E.; Mazourek, M.; O’connell, M.; Curry, J.; Thorup, T.; Liu, K.; Jahn, M.; Paran, I. Molecular mapping of capsaicinoid biosynthesis genes and quantitative trait loci analysis for capsaicinoid content in Capsicum. Theor. Appl. Genet. 2003, 108, 79–86. [Google Scholar] [CrossRef] [PubMed]
  6. Stewart Jr, C.; Mazourek, M.; Stellari, G.M.; O’Connell, M.; Jahn, M. Genetic control of pungency in C. chinense via the Pun1 locus. J. Exp. Bot. 2007, 58, 979–991. [Google Scholar] [CrossRef]
  7. Aza-González, C.; Núñez-Palenius, H.G.; Ochoa-Alejo, N. Molecular biology of capsaicinoid biosynthesis in chili pepper (Capsicum spp.). Plant Cell Rep. 2011, 30, 695–706. [Google Scholar] [CrossRef]
  8. Luo, X.-J.; Peng, J.; Li, Y.-J. Recent advances in the study on capsaicinoids and capsinoids. Eur. J. Pharmacol. 2011, 650, 1–7. [Google Scholar] [CrossRef]
  9. Faostat. 2021. Available online: http://www.fao.org (accessed on 9 August 2021).
  10. Rajametov, S.N.; Lee, K.; Jeong, H.-B.; Cho, M.-C.; Nam, C.-W.; Yang, E.-Y. The Effect of Night Low Temperature on Agronomical Traits of Thirty-Nine Pepper Accessions (Capsicum annuum L.). Agronomy 2021, 11, 1986. [Google Scholar] [CrossRef]
  11. Comtrade UN. UN Comtrade Database. Available online: http://comtrade.un.org (accessed on 15 October 2020).
  12. APS. Common Names of Plant Disease. Available online: https://www.apsnet.org/edcenter/resources/commonnames/Pages/default.aspx (accessed on 24 October 2020).
  13. Jeong, Y.; Kim, J.; Kang, Y.; Lee, S.; Hwang, I. Genetic diversity and distribution of Korean isolates of Ralstonia solanacearum. Plant Dis. 2007, 91, 1277–1287. [Google Scholar] [CrossRef] [Green Version]
  14. Lee, Y.K.; Kang, H.W. Physiological, biochemical and genetic characteristics of Ralstonia solanacearum strains isolated from pepper plants in Korea. Res. Plant Dis. 2013, 19, 265–272. [Google Scholar] [CrossRef] [Green Version]
  15. Jiang, G.; Peyraud, R.; Remigi, P.; Guidot, A.; Ding, W.; Genin, S.; Peeters, N. Modeling and experimental determination of infection bottleneck and within-host dynamics of a soil-borne bacterial plant pathogen. bioRxiv 2016, 061408. [Google Scholar] [CrossRef]
  16. Jiang, G.; Wei, Z.; Xu, J.; Chen, H.; Zhang, Y.; She, X.; Macho, A.P.; Ding, W.; Liao, B. Bacterial wilt in China: History, current status, and future perspectives. Front. Plant Sci. 2017, 8, 1549. [Google Scholar] [CrossRef]
  17. Kang, Y.J.; Ahn, Y.-K.; Kim, K.-T.; Jun, T.-H. Resequencing of Capsicum annuum parental lines (YCM334 and Taean) for the genetic analysis of bacterial wilt resistance. BMC Plant Biol. 2016, 16, 235. [Google Scholar] [CrossRef] [Green Version]
  18. Hayward, A. Biology and epidemiology of bacterial wilt caused by Pseudomonas solanacearum. Annu. Rev. Phytopathol. 1991, 29, 65–87. [Google Scholar] [CrossRef]
  19. Denny, T. Plant pathogenic Ralstonia species. In Plant-Associated Bacteria; Springer: Berlin/Heidelberg, Germany, 2007; pp. 573–644. [Google Scholar]
  20. Hayward, A. The hosts of Pseudomonas solanacearum. In Bacterial Wilt: The Disease and Its Causative Agent, Pseudomonas solanacearum; CAB International Press: Wallingford, UK, 1994; pp. 9–24. [Google Scholar]
  21. Denny, T.P. Ralstonia solanacearum—A plant pathogen in touch with its host. Trends Microbiol. 2000, 8, 486–489. [Google Scholar] [CrossRef]
  22. Vasse, J.; Frey, P.; Trigalet, A. Microscopic studies of intercellular infection and protoxylem invasion of tomato roots by Pseudomonas solanacearum. Mol. Plant Microbe Interact. 1995, 8, 241–251. [Google Scholar] [CrossRef]
  23. Rahman, M.; Abdullah, H.; Vanhaecke, M. Histopathology of susceptible and resistant Capsicum annuum cultivars infected with Ralstonia solanacearum. J. Phytopathol. 1999, 147, 129–140. [Google Scholar] [CrossRef]
  24. Wang, J.-F.; Olivier, J.; Thoquet, P.; Mangin, B.; Sauviac, L.; Grimsley, N.H. Resistance of tomato line Hawaii7996 to Ralstonia solanacearum Pss4 in Taiwan is controlled mainly by a major strain-specific locus. Mol. Plant Microbe Interact. 2000, 13, 6–13. [Google Scholar] [CrossRef] [Green Version]
  25. Winstead, N. Inoculation techniques for evluating resistance to Pseudomonas solanacearum. Phytopathology 1952, 42, 623–634. [Google Scholar]
  26. Mamphogoro, T.; Babalola, O.; Aiyegoro, O. Sustainable management strategies for bacterial wilt of sweet peppers (Capsicum annuum) and other Solanaceous crops. J. Appl. Microbiol. 2020, 129, 496–508. [Google Scholar] [CrossRef]
  27. Buddenhagen, I. Bacterial wilt of certain seed-bearing Musa spp. caused by tomato strain of Pseudomonas solanacearum. Phytopathology 1962, 52, 286. [Google Scholar]
  28. Hayward, A. Characteristics of Pseudomonas solanacearum. J. Appl. Bacteriol. 1964, 27, 265–277. [Google Scholar] [CrossRef]
  29. Matsunaga, H.; Sato, T.; Monma, S. In Inheritance of bacterial wilt resistance in the sweet pepper cv. Mie-Midori. In Proceedings of the 10th Eucarpia Meeting on Genetics and Breeding of Capsicum and Eggplant, Avignon, France, 7–11 September 1998; p. 172. [Google Scholar]
  30. Lopes, C.A.; Boiteux, L.S. Biovar-specific and broad-spectrum sources of resistance to bacterial wilt (Ralstonia solanacearum) in Capsicum. Embrapa Hortaliças-Artig. Periódico Indexado (ALICE) 2004, 4, 350–355. [Google Scholar] [CrossRef] [Green Version]
  31. Mimura, Y.; Yoshikawa, M.; Hirai, M. Pepper accession LS2341 is highly resistant to Ralstonia solanacearum strains from Japan. HortScience 2009, 44, 2038–2040. [Google Scholar] [CrossRef] [Green Version]
  32. Kim, B.; Cheung, J.; Cha, Y.; Hwang, H. Resistance to bacterial wilt of introduced peppers. Korean J. Plant Pathol. 1998, 14, 217–219. [Google Scholar]
  33. Tung, P.X.; Rasco, E.T.; Vander Zaag, P.; Schmiediche, P. Resistance to Pseudomonas solanacearum in the potato: I. Effects of sources of resistance and adaptation. Euphytica 1990, 45, 203–210. [Google Scholar] [CrossRef]
  34. Lafortune, D.; Béramis, M.; Daubèze, A.-M.; Boissot, N.; Palloix, A. Partial resistance of pepper to bacterial wilt is oligogenic and stable under tropical conditions. Plant Dis. 2005, 89, 501–506. [Google Scholar] [CrossRef] [Green Version]
  35. Mimura, Y.; Kageyama, T.; Minamiyama, Y.; Hirai, M. QTL analysis for resistance to Ralstonia solanacearum in Capsicum accession ‘LS2341’. J. Jpn. Soc. Hortic. Sci. 2009, 78, 307–313. [Google Scholar] [CrossRef] [Green Version]
  36. Du, H.; Wen, C.; Zhang, X.; Xu, X.; Yang, J.; Chen, B.; Geng, S. Identification of a major QTL (qRRs-10.1) that confers resistance to Ralstonia solanacearum in pepper (Capsicum annuum) using SLAF-BSA and QTL mapping. Int. J. Mol. Sci. 2019, 20, 5887. [Google Scholar] [CrossRef] [Green Version]
  37. Sonah, H.; Bastien, M.; Iquira, E.; Tardivel, A.; Légaré, G.; Boyle, B.; Normandeau, É.; Laroche, J.; Larose, S.; Jean, M. An improved genotyping by sequencing (GBS) approach offering increased versatility and efficiency of SNP discovery and genotyping. PLoS ONE 2013, 8, e54603. [Google Scholar] [CrossRef] [Green Version]
  38. Takagi, H.; Abe, A.; Yoshida, K.; Kosugi, S.; Natsume, S.; Mitsuoka, C.; Uemura, A.; Utsushi, H.; Tamiru, M.; Takuno, S. QTL-seq: Rapid mapping of quantitative trait loci in rice by whole genome resequencing of DNA from two bulked populations. Plant J. 2013, 74, 174–183. [Google Scholar] [CrossRef]
  39. Varshney, R.K.; Nayak, S.N.; May, G.D.; Jackson, S.A. Next-generation sequencing technologies and their implications for crop genetics and breeding. Trends Biotecnol. 2009, 27, 522–530. [Google Scholar] [CrossRef] [Green Version]
  40. Hayward, A.; Mason, A.; Dalton-Morgan, J.; Zander, M.; Edwards, D.; Batley, J. SNP discovery and applications in Brassica napus. J. Plant Biotechnol. 2012, 39, 49–61. [Google Scholar] [CrossRef] [Green Version]
  41. Elshire, R.; Glaubitz, J.; Sun, Q.; Poland, J.A.; Kawamoto, K.; Buckler, E.S.; Mitchell, S.E. A robust, simple genotyping-by-sequencing (GBS) approach for high diversity species. PLoS ONE 2011, 6, e19379. [Google Scholar] [CrossRef] [Green Version]
  42. Baldwin, S.; Pither-Joyce, M.; Wright, K.; Chen, L.; McCallum, J. Development of robust genomic simple sequence repeat markers for estimation of genetic diversity within and among bulb onion (Allium cepa L.) populations. Mol. Breed. 2012, 30, 1401–1411. [Google Scholar] [CrossRef]
  43. Davey, J.W.; Hohenlohe, P.A.; Etter, P.D.; Boone, J.Q.; Catchen, J.M.; Blaxter, M.L. Genome-wide genetic marker discovery and genotyping using next-generation sequencing. Nat. Rev. Genet. 2011, 12, 499–510. [Google Scholar] [CrossRef]
  44. Romay, M.C.; Millard, M.J.; Glaubitz, J.C.; Peiffer, J.A.; Swarts, K.L.; Casstevens, T.M.; Elshire, R.J.; Acharya, C.B.; Mitchell, S.E.; Flint-Garcia, S.A. Comprehensive genotyping of the USA national maize inbred seed bank. Genome Biol. 2013, 14, R55. [Google Scholar] [CrossRef] [Green Version]
  45. Li, H.; Vikram, P.; Singh, R.P.; Kilian, A.; Carling, J.; Song, J.; Burgueno-Ferreira, J.A.; Bhavani, S.; Huerta-Espino, J.; Payne, T. A high density GBS map of bread wheat and its application for dissecting complex disease resistance traits. BMC Genom. 2015, 16, 216. [Google Scholar] [CrossRef] [Green Version]
  46. Iquira, E.; Humira, S.; François, B. Association mapping of QTLs for sclerotinia stem rot resistance in a collection of soybean plant introductions using a genotyping by sequencing (GBS) approach. BMC Plant Biol. 2015, 15, 5. [Google Scholar] [CrossRef] [Green Version]
  47. Jaganathan, D.; Thudi, M.; Kale, S.; Azam, S.; Roorkiwal, M.; Gaur, P.M.; Kishor, P.K.; Nguyen, H.; Sutton, T.; Varshney, R.K. Genotyping-by-sequencing based intra-specific genetic map refines a ‘‘QTL-hotspot” region for drought tolerance in chickpea. Mol. Genet. Genom. 2015, 290, 559–571. [Google Scholar] [CrossRef]
  48. Siddique, M.I.; Lee, H.-Y.; Ro, N.-Y.; Han, K.; Venkatesh, J.; Solomon, A.M.; Patil, A.S.; Changkwian, A.; Kwon, J.-K.; Kang, B.-C. Identifying candidate genes for Phytophthora capsici resistance in pepper (Capsicum annuum) via genotyping-by-sequencing-based QTL mapping and genome-wide association study. Sci. Rep. 2019, 9, 9962. [Google Scholar] [CrossRef]
  49. Kang, Y.-J.; Lee, B.-M.; Nam, M.; Oh, K.-W.; Lee, M.-H.; Kim, T.-H.; Jo, S.-H.; Lee, J.-H. Identification of quantitative trait loci associated with flowering time in perilla using genotyping-by-sequencing. Mol. Biol. Rep. 2019, 46, 4397–4407. [Google Scholar] [CrossRef]
  50. Jo, J.; Purushotham, P.M.; Han, K.; Lee, H.-R.; Nah, G.; Kang, B.-C. Development of a genetic map for onion (Allium cepa L.) using reference-free genotyping-by-sequencing and SNP assays. Front. Plant Sci. 2017, 8, 1606. [Google Scholar] [CrossRef]
  51. Reyes, V.P.; Angeles-Shim, R.B.; Mendioro, M.S.; Manuel, M.; Carmina, C.; Lapis, R.S.; Shim, J.; Sunohara, H.; Nishiuchi, S.; Kikuta, M. Marker-Assisted Introgression and Stacking of Major QTLs Controlling Grain Number (Gn1a) and Number of Primary Branching (WFP) to NERICA Cultivars. Plants 2021, 10, 844. [Google Scholar] [CrossRef]
  52. Kitony, J.K.; Sunohara, H.; Tasaki, M.; Mori, J.-I.; Shimazu, A.; Reyes, V.P.; Yasui, H.; Yamagata, Y.; Yoshimura, A.; Yamasaki, M. Development of an Aus-Derived Nested Association Mapping (Aus-NAM) Population in Rice. Plants 2021, 10, 1255. [Google Scholar] [CrossRef]
  53. Rajametov, S.N.; Lee, K.; Jeong, H.B.; Cho, M.C.; Nam, C.W.; Yang, E.Y. Physiological Traits of Thirty-Five Tomato Accessions (Solanum lycopersicum L.) in Response to Low Temperature. Agriculture 2021, 11, 792. [Google Scholar] [CrossRef]
  54. Allen, G.; Flores-Vergara, M.; Krasynanski, S.; Kumar, S.; Thompson, W. A modified protocol for rapid DNA isolation from plant tissues using cetyltrimethylammonium bromide. Nat. Protoc. 2006, 1, 2320–2325. [Google Scholar] [CrossRef]
  55. Cox, M.P.; Peterson, D.A.; Biggs, P.J. SolexaQA: At-a-glance quality assessment of Illumina second-generation sequencing data. BMC Bioinform. 2010, 11, 485. [Google Scholar] [CrossRef] [Green Version]
  56. Li, H.; Durbin, R. Fast and accurate short read alignment with Burrows–Wheeler transform. Bioinformatics 2009, 25, 1754–1760. [Google Scholar] [CrossRef] [Green Version]
  57. Li, H.; Handsaker, B.; Wysoker, A.; Fennell, T.; Ruan, J.; Homer, N.; Marth, G.; Abecasis, G.; Durbin, R. The sequence alignment/map format and SAMtools. Bioinformatics 2009, 25, 2078–2079. [Google Scholar] [CrossRef] [Green Version]
  58. Kim, J.-E.; Oh, S.-K.; Lee, J.-H.; Lee, B.-M.; Jo, S.-H. Genome-wide SNP calling using next generation sequencing data in tomato. Mol. Cells 2014, 37, 36. [Google Scholar] [CrossRef]
  59. Eun, M.H.; Han, J.-H.; Yoon, J.B.; Lee, J. QTL mapping of resistance to the Cucumber mosaic virus P1 strain in pepper using a genotyping-by-sequencing analysis. Hortic. Environ. Biotechnol. 2016, 57, 589–597. [Google Scholar] [CrossRef]
  60. Kosambi, D. The estimation of map distance. Ann. Eugen. 1944, 12, 505–525. [Google Scholar]
  61. Voorrips, R. MapChart: Software for the graphical presentation of linkage maps and QTLs. J. Hered. 2002, 93, 77–78. [Google Scholar] [CrossRef] [Green Version]
  62. Wang, S.; Basten, C.; Zeng, Z. Windows QTL Cartographer; Bioinformatics Research Center, North Carolina State University: Raleigh, NC, USA, 2007. [Google Scholar]
  63. Tran, N.H.; Kim, B.S. Sources of resistance to bacterial wilt found in Vietnam collections of pepper (Capsicum annuum) and their nuclear fertility restorer genotypes for cytoplasmic male sterility. Plant. Pathol. J. 2012, 28, 418–422. [Google Scholar] [CrossRef] [Green Version]
  64. Deschamps, S.; Llaca, V.; May, G.D. Genotyping-by-sequencing in plants. Biology 2012, 1, 460–483. [Google Scholar] [CrossRef] [Green Version]
  65. Poland, J.A.; Rife, T.W. Genotyping-by-sequencing for plant breeding and genetics. Plant Genome 2012, 5. [Google Scholar] [CrossRef] [Green Version]
  66. Bielenberg, D.G.; Rauh, B.; Fan, S.; Gasic, K.; Abbott, A.G.; Reighard, G.L.; Okie, W.R.; Wells, C.E. Genotyping by sequencing for SNP-based linkage map construction and QTL analysis of chilling requirement and bloom date in peach [Prunus persica (L.) Batsch]. PLoS ONE 2015, 10, e0139406. [Google Scholar]
  67. Boutet, G.; Carvalho, S.A.; Falque, M.; Peterlongo, P.; Lhuillier, E.; Bouchez, O.; Lavaud, C.; Pilet-Nayel, M.-L.; Rivière, N.; Baranger, A. SNP discovery and genetic mapping using genotyping by sequencing of whole genome genomic DNA from a pea RIL population. BMC Genom. 2016, 17, 121. [Google Scholar] [CrossRef] [Green Version]
  68. Iqbal, M.M.; Huynh, M.; Udall, J.A.; Kilian, A.; Adhikari, K.N.; Berger, J.D.; Erskine, W.; Nelson, M.N. The first genetic map for yellow lupin enables genetic dissection of adaptation traits in an orphan grain legume crop. BMC Genet. 2019, 20, 68. [Google Scholar] [CrossRef] [Green Version]
  69. Manivannan, A.; Choi, S.; Jun, T.-H.; Yang, E.-Y.; Kim, J.-H.; Lee, E.-S.; Lee, H.-E.; Kim, D.-S.; Ahn, Y.-K. Genotyping by Sequencing-Based Discovery of SNP Markers and Construction of Linkage Map from F5 Population of Pepper with Contrasting Powdery Mildew Resistance Trait. BioMed Res. Int. 2021, 2021, 6673010. [Google Scholar] [CrossRef]
  70. Thakur, P.P.; Mathew, D.; Nazeem, P.; Abida, P.; Indira, P.; Girija, D.; Shylaja, M.; Valsala, P. Identification of allele specific AFLP markers linked with bacterial wilt [Ralstonia solanacearum (Smith) Yabuuchi et al.] resistance in hot peppers (Capsicum annuum L.). Physiol. Mol. Plant Pathol. 2014, 87, 19–24. [Google Scholar] [CrossRef]
  71. Kwon, J.-S.; Nam, J.-Y.; Yeom, S.-I.; Kang, W.-H. Leaf-to-whole plant spread bioassay for pepper and Ralstonia solanacearum interaction determines inheritance of resistance to bacterial wilt for further breeding. Int. J. Mol. Sci. 2021, 22, 2279. [Google Scholar] [CrossRef]
  72. Mimura, Y.; Inoue, T.; Minamiyama, Y.; Kubo, N. An SSR-based genetic map of pepper (Capsicum annuum L.) serves as an anchor for the alignment of major pepper maps. Breed. Sci. 2012, 62, 93–98. [Google Scholar] [CrossRef] [Green Version]
  73. Mathew, D. Analysis of QTL Bw1 and marker CAMS451 associated with the bacterial wilt resistance in hot pepper (Capsicum annuum L.). Plant Gene 2020, 24, 100260. [Google Scholar] [CrossRef]
  74. Kim, S.B.; Kang, W.H.; Huy, H.N.; Yeom, S.I.; An, J.T.; Kim, S.; Kang, M.Y.; Kim, H.J.; Jo, Y.D.; Ha, Y. Divergent evolution of multiple virus-resistance genes from a progenitor in Capsicum spp. New Phytol. 2017, 213, 886–899. [Google Scholar] [CrossRef]
  75. Tai, T.H.; Dahlbeck, D.; Clark, E.T.; Gajiwala, P.; Pasion, R.; Whalen, M.C.; Stall, R.E.; Staskawicz, B.J. Expression of the Bs2 pepper gene confers resistance to bacterial spot disease in tomato. Proc. Natl. Acad. Sci. USA 1999, 96, 14153–14158. [Google Scholar] [CrossRef] [Green Version]
  76. Kearney, B.; Staskawicz, B.J. Widespread distribution and fitness contribution of Xanthomonas campestris avirulence gene avrBs2. Nature 1990, 346, 385–386. [Google Scholar] [CrossRef]
  77. Kunwar, S.; Iriarte, F.; Fan, Q.; Evaristo da Silva, E.; Ritchie, L.; Nguyen, N.S.; Freeman, J.H.; Stall, R.E.; Jones, J.B.; Minsavage, G.V. Transgenic expression of EFR and Bs2 genes for field management of bacterial wilt and bacterial spot of tomato. Phytopathology 2018, 108, 1402–1411. [Google Scholar] [CrossRef] [Green Version]
  78. Boutrot, F.; Zipfel, C. Function, discovery, and exploitation of plant pattern recognition receptors for broad-spectrum disease resistance. Annu. Rev. Phytopathol. 2017, 55, 257–286. [Google Scholar] [CrossRef]
  79. Grant, M.R.; Godiard, L.; Straube, E.; Ashfield, T.; Lewald, J.; Sattler, A.; Innes, R.W.; Dangl, J.L. Structure of the Arabidopsis RPM1 gene enabling dual specificity disease resistance. Science 1995, 269, 843–846. [Google Scholar] [CrossRef]
  80. Boyes, D.C.; Nam, J.; Dangl, J.L. The Arabidopsis thaliana RPM1 disease resistance gene product is a peripheral plasma membrane protein that is degraded coincident with the hypersensitive response. Proc. Natl. Acad. Sci. USA 1998, 95, 15849–15854. [Google Scholar] [CrossRef] [Green Version]
  81. Al-Daoude, A.; de Torres Zabala, M.; Ko, J.-H.; Grant, M. RIN13 is a positive regulator of the plant disease resistance protein RPM1. Plant Cell 2005, 17, 1016–1028. [Google Scholar] [CrossRef] [Green Version]
  82. Van Ooijen, G.; Mayr, G.; Kasiem, M.M.; Albrecht, M.; Cornelissen, B.J.; Takken, F.L. Structure–function analysis of the NB-ARC domain of plant disease resistance proteins. J. Exp. Bot. 2008, 59, 1383–1397. [Google Scholar] [CrossRef] [Green Version]
  83. Qi, D.; Innes, R.W. Recent advances in plant NLR structure, function, localization, and signaling. Front. Immunol. 2013, 4, 348. [Google Scholar] [CrossRef] [Green Version]
  84. de Araújo, A.C.; Fonseca, F.C.D.A.; Cotta, M.G.; Alves, G.S.C.; Miller, R.N.G. Plant NLR receptor proteins and their potential in the development of durable genetic resistance to biotic stresses. Biotechnol. Res. Innov. 2019, 3, 80–94. [Google Scholar] [CrossRef]
  85. Singh, N.K.; Kumar, K.R.R.; Kumar, D.; Shukla, P.; Kirti, P. Characterization of a pathogen induced thaumatin-like protein gene AdTLP from Arachis diogoi, a wild peanut. PLoS ONE 2013, 8, e83963. [Google Scholar] [CrossRef]
  86. Zhang, J.; Wang, F.; Liang, F.; Zhang, Y.; Ma, L.; Wang, H.; Liu, D. Functional analysis of a pathogenesis-related thaumatin-like protein gene TaLr35PR5 from wheat induced by leaf rust fungus. BMC Plant Biol. 2018, 18, 76. [Google Scholar] [CrossRef] [Green Version]
  87. Ali, G.S.; Hu, X.; Reddy, A. Overexpression of the Arabidopsis thaumatin-like protein 1 in transgenic potato plants enhances resistance against early and late blights. BioRxiv 2019, 621649. [Google Scholar] [CrossRef]
Figure 1. Distribution of the disease index after inoculation with R. solanacearum. (A) disease index was classified into disease scales of 0–4, where 0 = no visible symptoms, 1 = 1 to 25% wilted leaves, 2 = 26 to 50% wilted leaves, 3 = 51 to 75% wilted leaves, and 4 = 76 to 100% wilted leaves, and (B) disease index (DI) was recorded in F2-segregating populations, including 94 genotypes from the cross between a resistant parent (KC352) and a susceptible parent (14F6002-14).
Horticulturae 08 00115 g001
Figure 2. Distribution of single-nucleotide polymorphism (SNP) markers on 16 linkage groups of F2 pepper population. The pepper genetic linkage map consisted of 1550 SNP markers derived from genotyping-by-sequencing (GBS) analysis. SNP names were shown on the right side of the linkage map and genetic distances (cM) between SNPs on the left.
Horticulturae 08 00115 g002aHorticulturae 08 00115 g002b
Figure 3. (A) Quantitative trait loci (QTL) plot. QTL associated with bacterial wilt (BW) disease resistance in the F2 population derived from the parental lines of KC352 and 14F6002-14 in the linkage groups obtained via CIM. The LOD threshold is indicated by the red-colored horizontal line. (B) Physical map of chromosome 01 with SNP markers used for the mapping of BW resistance locus as shown in Figure 2. The QTL positions (LOD ≥ 5.5) and SNP markers of BW resistance are indicated with a black bar combined with red-colored vertical lines above the linkage map.
Horticulturae 08 00115 g003
Table 1. Descriptive statistics of disease index.
TraitF2 Population (n = 94)
MaxMinRangeWilt Rate (%) aAverage bStandard ErrorVariationSkewnessKurtosis
Disease
index
400–468.0852.6380.1672.620−0.604−1.352
a Wilting rate was defined as DI that was more than 2. b Average was calculated on the basis of 0–4 rating scale as follows: DI = ∑(disease score x the number of plants corresponding to each disease score)/total number of plants.
Table 2. Summary of the pepper genetic linkage map constructed using SNP markers derived from genotyping-by-sequencing (GBS) analysis for bacterial wilt (BW) disease resistance. The higher Pearson’s correlation coefficient indicates the closer correlation.
ChromosomeLinkage GroupNumber of
SNP Marker
Genetic
Distance (cM)
Correlation
Coefficient
Chr.01LG_01-112382.1340.755
LG_01-24938.2540.385
Chr.02LG_02-16020.7990.096
LG_02-29070.7040.644
Chr.03LG_0317259.5610.790
Chr.04LG_0411778.0450.867
Chr.05LG_05-19147.5820.840
LG_05-21215.9520.437
Chr.06LG_0614652.6350.867
Chr.07LG_0713661.8090.876
Chr.08LG_085447.6810.513
Chr.09LG_0911474.9820.786
Chr.10LG_10-11119.2470.603
LG_10-213954.2240.857
Chr.11LG_1112359.5790.867
Chr.12LG_1211345.2610.541
Total161550828.449-
Average-96.87551.7780.670
Table 3. Summary of significant QTLs (LOD ≥ 5.5) regions with composite interval mapping (CIM) analysis.
Chr.Marker
(Chr_pos)
QTL Position
(cM)
LODAdditive Dominanta R2
(%)
b |d/a|c |d/a|
Value
d Number of Gene
Chr.
01-1
ch01_4779396351.737.065493−0.858110.70120823.9114D0.821
ch01_4779390752.217.323219−0.883070.69064725.1692PD0.781
ch01_5212877452.946.962209−0.883830.60333924.0817PD0.685
ch01_5757478654.326.440147−0.856450.65162123.1222PD0.760
ch01_6149620856.256.180448−0.896930.49673224.5181PD0.552
ch01_5807535857.315.682495−0.799760.70064720.9856D0.880
ch01_5696012457.655.983697−0.937760.39906423.0298PD0.430
ch01_15650510858.986.161348−0.887050.63175624.0344PD0.7111
ch01_13078959359.465.602784−0.815630.5653920.171PD0.690
ch01_16021989160.275.506165−0.952010.16234122.5886A0.172
ch01_13091356060.366.216155−0.928240.28332822.2838PD0.310
ch01_16112792661.15.692397−0.856910.39469120.1396PD0.4610
a R2, proportion of phenotypic variance explained by a major QTL; b |d/a|, estimation of gene action; A, (additive effect) 0–0.20; PD, (partial dominance) 0.21–0.80; c D, (dominance) 0.81–1.20; OD, (overdominance) >1.20. d Number of gene was selected with the 1 Mb to the left and right of the corresponding marker.
Table 4. The candidate genes within the significant QTL regions.
Gene NameGene StartGene EndCM334(v.1.55)KEGG/GOSwissProtNR
CA01g120804786217747863580Putative amino acid transporter-Putative polyamine transporterPutative polyamine transporter
CA01g124505203594152041393Calcium-dependent protein kinase 17K13412 (calcium-dependent protein kinase)Calcium-dependent protein kinase 17Calcium-dependent protein kinase 17-like
CA01g124605211343252115689Rho GTPase-activating protein-Rho GTPase-activating protein 7rho GTPase-activating protein 7
CA01g124705211976752121954Putative rho GTPase activator-Rho GTPase-activating protein 7PREDICTED: rho GTPase-activating protein 7-like
CA01g124805212830352129214Rho GTPase-activating protein 7-like isoform X2 (Solanum tuberosum)-Rho GTPase-activating protein 7PREDICTED: rho GTPase-activating protein 7-like
CA01g124905214717252148002Phospholipase A22-Uncharacterized proteinPutative rho GTPase-activating protein 7-like isoform X1
CA01g133706143890761440480Arsenite-resistance protein, putative-Serrate RNA effector moleculeSerrate RNA effector molecule
CA01g133806144648661447578Arsenite-resistance protein, putative-Serrate RNA effector moleculeSerrate RNA effector molecule
CA01g18610156433050156436475Detected protein of unknown function-O-fucosyltransferase family proteinPutative siroheme synthase-like
CA01g18620156438428156442076AT5g40850/MHK7_8K02303 (uroporphyrin-III C-methyltransferase)Siroheme synthasePREDICTED: siroheme synthase
CA01g18630156454093156456205Putative glutathione S-transferase T1K00799 (glutathione S-transferase)Putative glutathione S-transferasePREDICTED: probable glutathione S-transferase
CA01g18640156457355156460628Cohesin subunit rad21, putativeK06670 (RAD21; cohesin complex subunit SCC1)Uncharacterized proteinPREDICTED: sister chromatid cohesion 1 protein 3
CA01g18650156487695156490046Anthranilate phosphoribosyltransferase-like protein-Uncharacterized proteinPutative disease-resistance protein RPM1-like
CA01g18660156497587156514448DNA-directed RNA polymerase-DNA-directed RNA polymerase subunit betaPREDICTED: DNA-directed RNA polymerase I subunit 2
CA01g18670156515197156518484Putative synaptotagmin-Protein QUIRKYProtein QUIRKY
CA01g18680156539078156540145Detected protein of unknown functionK22733 (NIPA, SLC57A2S, magnesium transporter)Magnesium transporterPutative magnesium transporter NIPA8
CA01g18690156550800156555986DnaJ-like proteinK03686 (DnaJ, molecular chaperone DnaJ)Uncharacterized proteinHypothetical protein T459_02496
CA01g18700156563245156580138Eukaryotic translation initiation factor 3 subunit, putativeK03255 (TIF31, CLU1, protein TIF31)Clustered mitochondria proteinClustered mitochondria protein
CA01g18710156602485156602895Detected protein of unknown functionK11253 (Histone H3)Histone H3PREDICTED: histone H3.2-like
CA01g19920160217017160229898Ankyrin repeat family protein (Populus trichocarpa)K24810 (IBTK, inhibitor of Bruton tyrosine kinase)Ankyrin repeat domain-containing proteinHypothetical protein FXO37_07210
CA01g19930160315849160316316Polypeptide with a gag-like domain-LRRNT-2 domain-containing proteinUncharacterized protein
CA01g20080161050160161051870Transcription factor bHLH130-like isoform X1 (Citrus sinensis)-Transcription factor bHLH130PREDICTED: transcription factor bHLH130-like
CA01g20090161051871161052295DNA binding protein, putative-Transcription factor bHLH130PREDICTED: transcription factor bHLH130-like
CA01g20100161113518161117641Ras-related protein RGP1-like (Solanum tuberosum)K07904 (RAB11A, Ras-related protein Rab-11A)Ras-related protein RABA4cRas-related protein RABA4c
CA01g20110161118723161120113Thaumatin-like protein SE39b-/GO (0006952): defense responseUncharacterized proteinPREDICTED: thaumatin-like protein 1b isoform X1
CA01g20120161154079161154489Histone H3 family protein (Populus trichocarpa)K11253 (H3, histone H3)Histone H3PREDICTED: histone H3.2-like
CA01g20130161161494161162582Disease resistance protein RPM1-like (Fragaria vesca) subsp. vescaK13457 (RPM1, RPS3; disease-resistance protein RPM1)Uncharacterized proteinHypothetical protein T459_01449
CA01g20140161184987161187221Detected protein of unknown function-NB-ARC domain-containing proteinPREDICTED: putative late blight-resistance protein homolog R1B-23
CA01g20150161212363161212704Detected protein of unknown function-Uncharacterized proteinPutative cellulose synthase A catalytic subunit 3 (UDP-forming)-like
CA01g20160161215973161218180Detected protein of unknown function-Uncharacterized proteinUncharacterized protein LOC107839230 isoform X2
CA01g20170161221263161222494Detected protein of unknown function-Uncharacterized proteinUncharacterized protein LOC107839213
Publisher’s Note: MDPI stays neutral with regard to jurisdictional claims in published maps and institutional affiliations.

