Article

Continuous Third Phase Fruit Monitoring in Olive with Regulated Deficit Irrigation to Set a Quantitative Index of Water Stress

1
Department of Agricultural, Food and Environmental Sciences, Marche Polytechnic University, 60131 Ancona, Italy
2
Department of Information Engineering, Marche Polytechnic University, 60131 Ancona, Italy
*
Author to whom correspondence should be addressed.
Horticulturae 2022, 8(12), 1221; https://doi.org/10.3390/horticulturae8121221
Submission received: 21 September 2022 / Revised: 14 December 2022 / Accepted: 15 December 2022 / Published: 19 December 2022

Abstract

:
The transversal fruit diameter (FD) was monitored continuously by automatic extensimeters (fruit gauges) in order to monitor fruit growth dynamics under deficit irrigation treatments. The daily diameter fluctuation (ΔD, mm), the daily growth (ΔG, mm), the cumulative fruit growth (CFG, mm), and the fruit relative growth rate (RGR, mm mm−1 h−1) of four olive cultivars (Ascolana dura, Piantone di Falerone, Arbequina, and Lea) were studied during the third phase of fruit growth. Two regulated deficit irrigation treatments DI-20 (20% of ETc) and DI-10 (10% of ETc) were applied. The daily hysteretic pattern of FD versus the environmental variable of vapor pressure deficit (VPD) was evaluated using the data of a local weather station. The assessment of fruit growth parameters showed cultivar-specific response to water stress. For instance, after performing deficit irrigation, minimum RGR in different cultivars downsized with various slopes which suggested a very different response of the cultivars to dehydration. On the other hand, the daily hysteretic pattern of FD versus VPD was detected in all the studied cultivars, and a quantitative index (height of hysteresis curves) used for explanation of hysteresis magnitude’s changed according to the deficit irrigation treatments. The results showed a significant reduction of height of hysteresis curves by irrigation treatments which were not cultivar-specific. The quantitative index for hysteresis curve magnitude’s change in the four olive cultivars of Ascolana dura, Piantone di Falerone, Arbequina and Lea can efficiently estimate the plant water response to irrigation treatment in olive orchards. However, further investigation needs to be done to implement precise irrigation systems.

1. Introduction

The importance of olive (Olea europaea L.) as essential for human diet and landscape management is undeniable in areas with Mediterranean climate. Olive production has been affected by increasing global demand (table olive and olive oil), which has imposed a greater need for agricultural inputs as we address resource scarcity and climate change [1,2,3]. One of the key inputs of olive production is water. Around 70% of the world surface of olive groves is irrigated [4], therefore, the development of appropriate methods and strategies of sustainable water use in olive groves is fundamental [5]. The most common technique for optimizing water efficiency is Regulated Deficit Irrigation (RDI), in which water deficits are imposed during phenological periods when the tree is most insensitive to water stress [6,7,8], and complementary irrigation [9,10]. Furthermore, the results of Goldhamer [11] and Gómez-del Campo [12] showed that RDI strategies resulted in a saving of about 20% of the total amount of water applied without reducing the yield, fruit and oil content. Moreover, numerous studies show that deficit irrigation avoids or minimizes the negative impact of irrigation on erosion, in particular by reducing surface runoff and contributing less to the infiltration of pollutants (herbicides and pesticides) into groundwater [13]. In the classical method, the calculation of irrigation amount is based on multiplying reference evapotranspiration (ET0) by grass-reference-based crop-specific coefficients (Kc). Nevertheless, the traditional method of estimation of Kc for olive orchards could be inaccurate. Kc is affected by some aspects such as canopy architecture, ground cover, and the interactions of climatic conditions, soil type, cultivars, and irrigation management practices [6].
To achieve precise irrigation results, some recent research suggested continuous assessment of plant water status indices [14,15,16,17]. In fact, in Soil Plant Atmosphere Continuum (SPAC), plant plays an interface role between soil and the environment, and its physiological response is a combination of results [14,18,19]. Furthermore, the continuous measurement of plant water status indices would provide a solid base for precision irrigation management, by real time response to water stress. However, the olive species (Olea europaea) has a very wide genetic pool, which can respond to drought using different leaf and fruit physiological and morphological mechanisms [14,20]. It includes genotypes that can respond to drought using different tolerances to leaf dehydration and morphological and structural adaptations of the leaves [14]. Lo Bianco and Scalisi [20] found a different leaf stomatal regulation among the olive cultivars. Due to this difficulty, the correct choice of the water status index of the plant is essential. The most common suggested indices are midday stem water potential (ᴪstem), trunk diameter variation (TDV), sap flow (SF), leaf turgor pressure (LTP), as well as fruit diameter (FD), which can be used alone or in combination. A combination of indices (sensors) could provide robust data, however, increased the complexity. Moreover, considering the difficulty of replicating continuous measurements on a large number of trees, the need to obtain an accurate index has become more essential. The midday stem water potential (ᴪstem) is accurate and reliable, however, not only it is a destructive method, but also not suitable for continuous measurement [14,21,22]. The stem/trunk diameter variation (by trunk dendrometer) is another useful index. However, the trunk diameter fluctuations are affected by plant age and size, crop load, environmental variables, and growth patterns [19]. The sap flow (SF) methods are particularly demanding in terms of installation; most of the SF methods suitable for fruit trees are invasive, such that sensors must be installed within the trunk of the trees [5]. Moreover, the sap flow rate demonstrates transpiration dynamics that depend on stomatal activity and environmental variables [22]. The leaf turgor pressure (LTP) measurement method is carried out by probe which is a cheap and handy method but does not allow for continuous measurement [23]. The advanced LTP measurement method employed leaf patch clamp pressure (LPCP) probes is able to continuously monitor the pressure, but the different initial condition of the leaf related to age (especially in evergreen species) and exposure to light inside the canopy leads to obtaining partial information from LPCP [15,22]. In addition, findings by Jones [24] suggested that LTP in the isohydric species is not very useful in the early detection of plant water deficiency. The other innovative plant water status index is fruit diameter (FD). The daily fruit growth dynamics can be expounded as changes in flows of water into and out of the fruit, rather than carbon gains; thus, the daily fruit diameter variation responds to water deficit [15,25,26,27]. Fruits represent the actual goal of production but fruit growth is the result of several genetic, metabolic, hormonal, and environmental interactions [28], therefore, optimal fruit growth can be determined only by the efficient physiological manipulation of the condition tree [23]. In the olive tree, the root response to localized application systems of organic residues, nutrients, and water reveal an enormous plasticity of the root system [29,30,31] which can compensate for local stress. Although olive tree root systems are highly capable and could supply a constant water flow, fruit daily growth trend is described by periods of shrinkage and then after expansion, which usually lead to increase in fruit size at the end of the day [23,27]. Due to the research of Fernandes et al. [26] and Marino et al. [15], the daily variations in fruit transversal diameters can be expounded as changes in flows of water into and out of the fruit hence, these can be connected to vapor pressure deficit (VPD) and tree water status. Furthermore, Scalisi et al. [14] explained that fruit growth (measured by FD) is strictly related to soil water availability and plant water status, it is also influenced by environmental variables, crop load, genetic factors, and phenology. Consequently, fruit growth monitoring (by FD) could represent a sensitive indicator of plant water and physiological status of the trees, especially during cell expansion phase, when fruit growth rate is constant and truly decisive for productive performances [23,32]. FD monitoring has been investigated in several studies by researchers to measure daily fluctuation in the volume of selected fruits, including pears [33], sweet cherry [34,35,36], mango [37], apple [23], nectarine [22], orange [38], and olive [14,15,26,27]. The continuous FD monitoring provides robust data but water management protocols based on FD measurements need further study to develop field applicable models [15,23,27]. A common challenge with tree-based sensors is to adjust their output to physiologically meaningful parameters in a consistent manner [19,27,36].
In order to translate outputs of plant-based sensors, the phenomenon of hysteresis should be further considered. Explaining the causes of hysteretic phenomenon appears fraught with complex interactions between exogenous and endogenous factors to the plant system [39]. The root of the word hysteresis is Greek and means to “lag behind” [27,40]. Hysteresis is non-linear loop-like behavior that has been known in plant systems for a long time [40,41]. In hysteresis, when the time argument of an input function is stretched or compressed, the corresponding output function is not stretched in the same way, so the hysteresis does not show affine similarity with respect to time [40,42,43]. For example, a diurnal hysteresis between evapotranspiration (ET) (or transpiration) and vapor pressure deficit (VPD) has been studied [40]; hysteresis as a relationship between environmental factor (e.g., meteorological factors) and sap flow [40,44,45]; hysteresis was found also in the relationship between canopy conductance and temperature [46]; hysteresis between fruit diameter and leaf pressure on two different olive cultivars [14]. Furthermore, in the cherry fruit growth relationship with VPD, complete hysteresis was found only during the maturation phase while during fruit extension phase the hysteresis was null or partial [36]. Recently Khosravi et al. [27] examined the “Frantoio” olive cultivar and explained the different hysteresis curves of the diameter versus the VPD during the second, third, and fourth phases of olive fruit development. According to this research, monitoring hysteretic loops and detecting the magnitude change could be used as a method for detecting the growth phases. In this research, the form, magnitude, and rotational pattern of hysteresis curve (loop) of transversal diameter versus VPD were investigated. It has been shown that VPD is especially important in woody plants, where it is the main variable affecting their diurnal evolution of transpiration [47].
The aim of this work was to describe third phase of olive fruit development by continuous monitoring with extensimeter under regulated deficit irrigation regimes. Furthermore, we hypothesized the presence of hysteresis curves by examining the olive fruit diameter (FD) compared to VPD. We intended to provide some indexes for smart irrigation in relation to the regulated deficit irrigation in a key phenological stage of the fruit.

2. Materials and Methods

2.1. Site Description and Phenology

The experiment was carried out in 2021 at the experimental farm of the Polytechnic University of Marche, located in Agugliano (Marche, Italy) (latitude 43°54′ N, longitude 13°36′ E, altitude 85 m), in a high-density olive orchard in four self-rooted olive (Olea europaea L.) cultivars of Ascolana dura, Piantone di Falerone, Arbequina and Lea. The trees were planted 4 × 2 m (1250 tree ha−1) in May 2012, about 9 years old at the time of experiment. Each cultivar was displayed in a separate row. The olive trees were initially trained as a central leader, the tree canopy was afterwards flattened according to a hedgerow, removing long branches toward the interrow [48]. Integrated agricultural methods were adopted for the agricultural operations, pest control, and fertilization practices according to regional guidelines [49]. The irrigation was localized and used to perform different irrigation treatments during experiment (see Section 2.2. Irrigation). The soil was managed with permanent grass cover in the inter-row alley, with mowing 3–4 times during the growing season and with tillage along the row [27].

2.2. Irrigation

The olive trees were irrigated by a drip irrigation system with a flow of 8 (L h−1) per tree. Two deficit irrigation levels were performed and the higher dose (DI-20) was supplied to big fruit varieties while the lower dose (DI-10) was supplied to medium-small fruit varieties. DI-20 had 20% of the amount of ETc and was supplied to Ascolana dura and Piantone di Falerone trees, while DI-10 had 10% of the amount of ETc and was supplied to Lea and Arbequina trees. The crop evapotranspiration ETc was estimated according to FAO56 equation which is:
(ETc = ET0 × Kc)
where the evapotranspiration (ET0) was calculated by the local weather station automatically via FAO Penman–Monteith equation and Kc was the crop coefficient [6]. Moreover, effective rainfall (R) was calculated as:
R = (Pp − 5) × 0.75
where Pp = rainfall obtained from the local weather station [6]. The irrigation treatment was performed according to the randomized block with three replications, and each block consisted of at least five adjacent trees on the same row. The irrigation was done three times during the experiment period, 17th August (Day of the Year, DOY, 229), 19th August (DOY 231), and 16th September (DOY 259). The DI-20 irrigated cultivars received 62 mm of water during all fruit growth phases which 17.5 mm was during the third growth phase. For the DI-10 irrigated cultivars the amount of received water during all fruit growth phases and third growth phase were 31 and 8.75 mm, respectively. For big fruit varieties of Ascolana dura and Piantone di Falerone, the no irrigated fruit (DI-0) was considered as a reference point for detecting the effect of the deficit irrigation treatment on fruit growth. The rationale behind using DI-0 against fully irrigated treatment comes from the idea of analyzing the effect of deficit irrigation on fruit growth (daily and periodical growth) which should be discovered in comparison with normal growth conditions (without irrigation). The changes in the daily olive fruit growth pattern by irrigation has been explained by some research previously [14,15].

2.3. Fruit Maturation Monitoring

From 19th September (DOY 262) to 26th October (DOY 299) the fruits, which were placed inside the extensimeter, were photographed by Canon EOS 1100D Camera (Canon Inc., Tokyo, Japan) weekly. In the case of adverse weather conditions, taking images was postponed to the next possible day. The ripening status of each olive fruit was assessed according to the first five (0–4) classes of Jaen index [50] (Table 1). Up to DOY 276, fruits inside the extensimeter were in the third phase of fruit development, and maturity index ranged from 0 to 2. Consequently, DOY 276 was considered the ending day of the third phase of fruit development.

2.4. Fruit Measurement and Experimental Design

The fruit transversal diameter (synonym to equatorial diameter) of ten fruits were monitored by automatic extensimeters (synonym to fruit gauge) from 12th August (DOY 224) to 3rd October (DOY 276) in 2021. We used two kinds of extensimeters; one model was Winet (Winet s.r.l. Cesena, Italy) and another model was DEX20 (Dynamax Inc., Houston, TX, USA). The Winet experimental extensimeter consisted of a variable linear resistance transducer sensor (model MM(R)10-12) (Megatron Elektronik GmbH & Co., Munich, Germany) supported by a stainless steel frame. The extensimeters were connected to the wireless data-logger system (Winet s.r.l. Cesena, Italy) which collected data at 10 min intervals. Data has been sent through the wireless nodes to a central network node, which transmits information via general packet radio service (GPRS) modem to the server. Second model of extensimeter (DEX20) was a caliper style device with a full bridge strain gage attached to a flexible arm; data were recorded by CR1000X data logger (Campbell scientific, Inc., Logan, UT, USA) every hour and sent to our own cloud service based on Amazon Web Service (AWS) twice per day. Both models of extensimeters were examined and showed accurate functionality [27,51].
The full bloom day occurred for Arbequina and Ascolana dura on the 24th and 28th of May, and for Piantone di Falerone and Lea on the 31st of May. So, the experiment started almost 11 weeks after full bloom (WAFB). Moreover, the BBCH scale was employed to obtain a phenological phase. In this scale, the end of the second phase of fruit development (pit-hardening) was determined when it was no longer possible to cut the fruit [6]. For each cultivar, 15 fruits were sampled randomly. Sampling was repeated every 10 days and pit resistance to cutting were examined by blade. The ending day of the second phase of fruit development was observed on the 13th of August (DOY 225). Consequently, our experiment period started from the third phase (cell expansion) of fruit development.
Eight fruits were mounted on Wi-net extensimeter which consisted of three fruits of Ascolana dura (two with DI-20 and one DI-0 (without irrigation) that from here called Asc1 (DI-20), Asc2 (DI-20) and Asc3 (DI-0), three fruits of Piantone di Falerone (two with DI-20 and one DI-0 (without irrigation) that from here called Fal1 (DI-20), Fal2 (DI-20) and Fal3 (DI-0) and two fruits of Lea with DI-10 irrigation level that from here called Lea1 (DI-10) and Lea2 (DI-10). In the middle of the experiment the fruit of Fal3 (DI-0) felt down and was substituted with Fal4 (DI-0). Two fruits of Arbequina with DI-10 irrigation level were mounted on DEX20 extensimeter (Arb1 (DI-10) and Arb2 (DI-10)). The representative trees according to irrigation level were selected in the center of the experimental block to avoid border effect. Moreover, all extensimeters of the same cultivar-irrigation level were installed together on one representative tree.
According to the importance and physiological effect of daylight on fruit growth and its role in photosynthesis, the graphic representation of daily fruit growth and its fluctuations were reported from the time of sunrise [14,27]. In fact, the day started from sunrise and continued for 24 h. Based on data from our weather station, sunrise time from 12th of August to 5th of September (DOY 224 to 248) was estimated at 6 AM, from 6th of September to 3rd of October (DOY 249 to 276) was estimated at 7 AM.

2.5. Fruit Growth Parameters

In correspondence with the days in which irrigation treatment (DI-20 and DI-10) were performed (DOYs 229, 231 and 259), 6 day intervals were selected for assessment of deficit irrigation effect on fruit growth. The mentioned window (6 days) consisted of the 2 days before irrigation up to 3 days after irrigation day. The parameters calculated for each intervals were: (1) daily diameter fluctuation (ΔD, mm) which was calculated as the maximum diameter minus the minimum diameter of same day, (2) daily growth (ΔG, mm) which was calculated as the diameter of ending point of day minus the diameter of starting point of same day, (3) cumulative fruit growth (CFG, mm) as the maximum daily diameter of the fruit subtracted from maximum diameter of the previous day [26], (4) fruit relative growth rate (RGR, mm mm−1 h−1) was calculated using the following equation:
RGR = [(ln D2 − ln D1)/(t2 − t1)]
where D1 and D2 are fruit diameters at times t1 and t2, respectively [14,15]. And the daily range of RGR (RGRrange, mm mm−1 h−1) was calculated as the difference between the minimum value and the maximum value of RGR in one day.
In addition, unitless (standardized) data have been used to allow comparisons among fruits with different initial diameter when extensimeters were installed. The data of sensors was standardized for each day by using:
x′ = x/x0
where x′ is the standardized value, x is the value of the existing data, and x0 is the initial values of the data at starting point of same day.

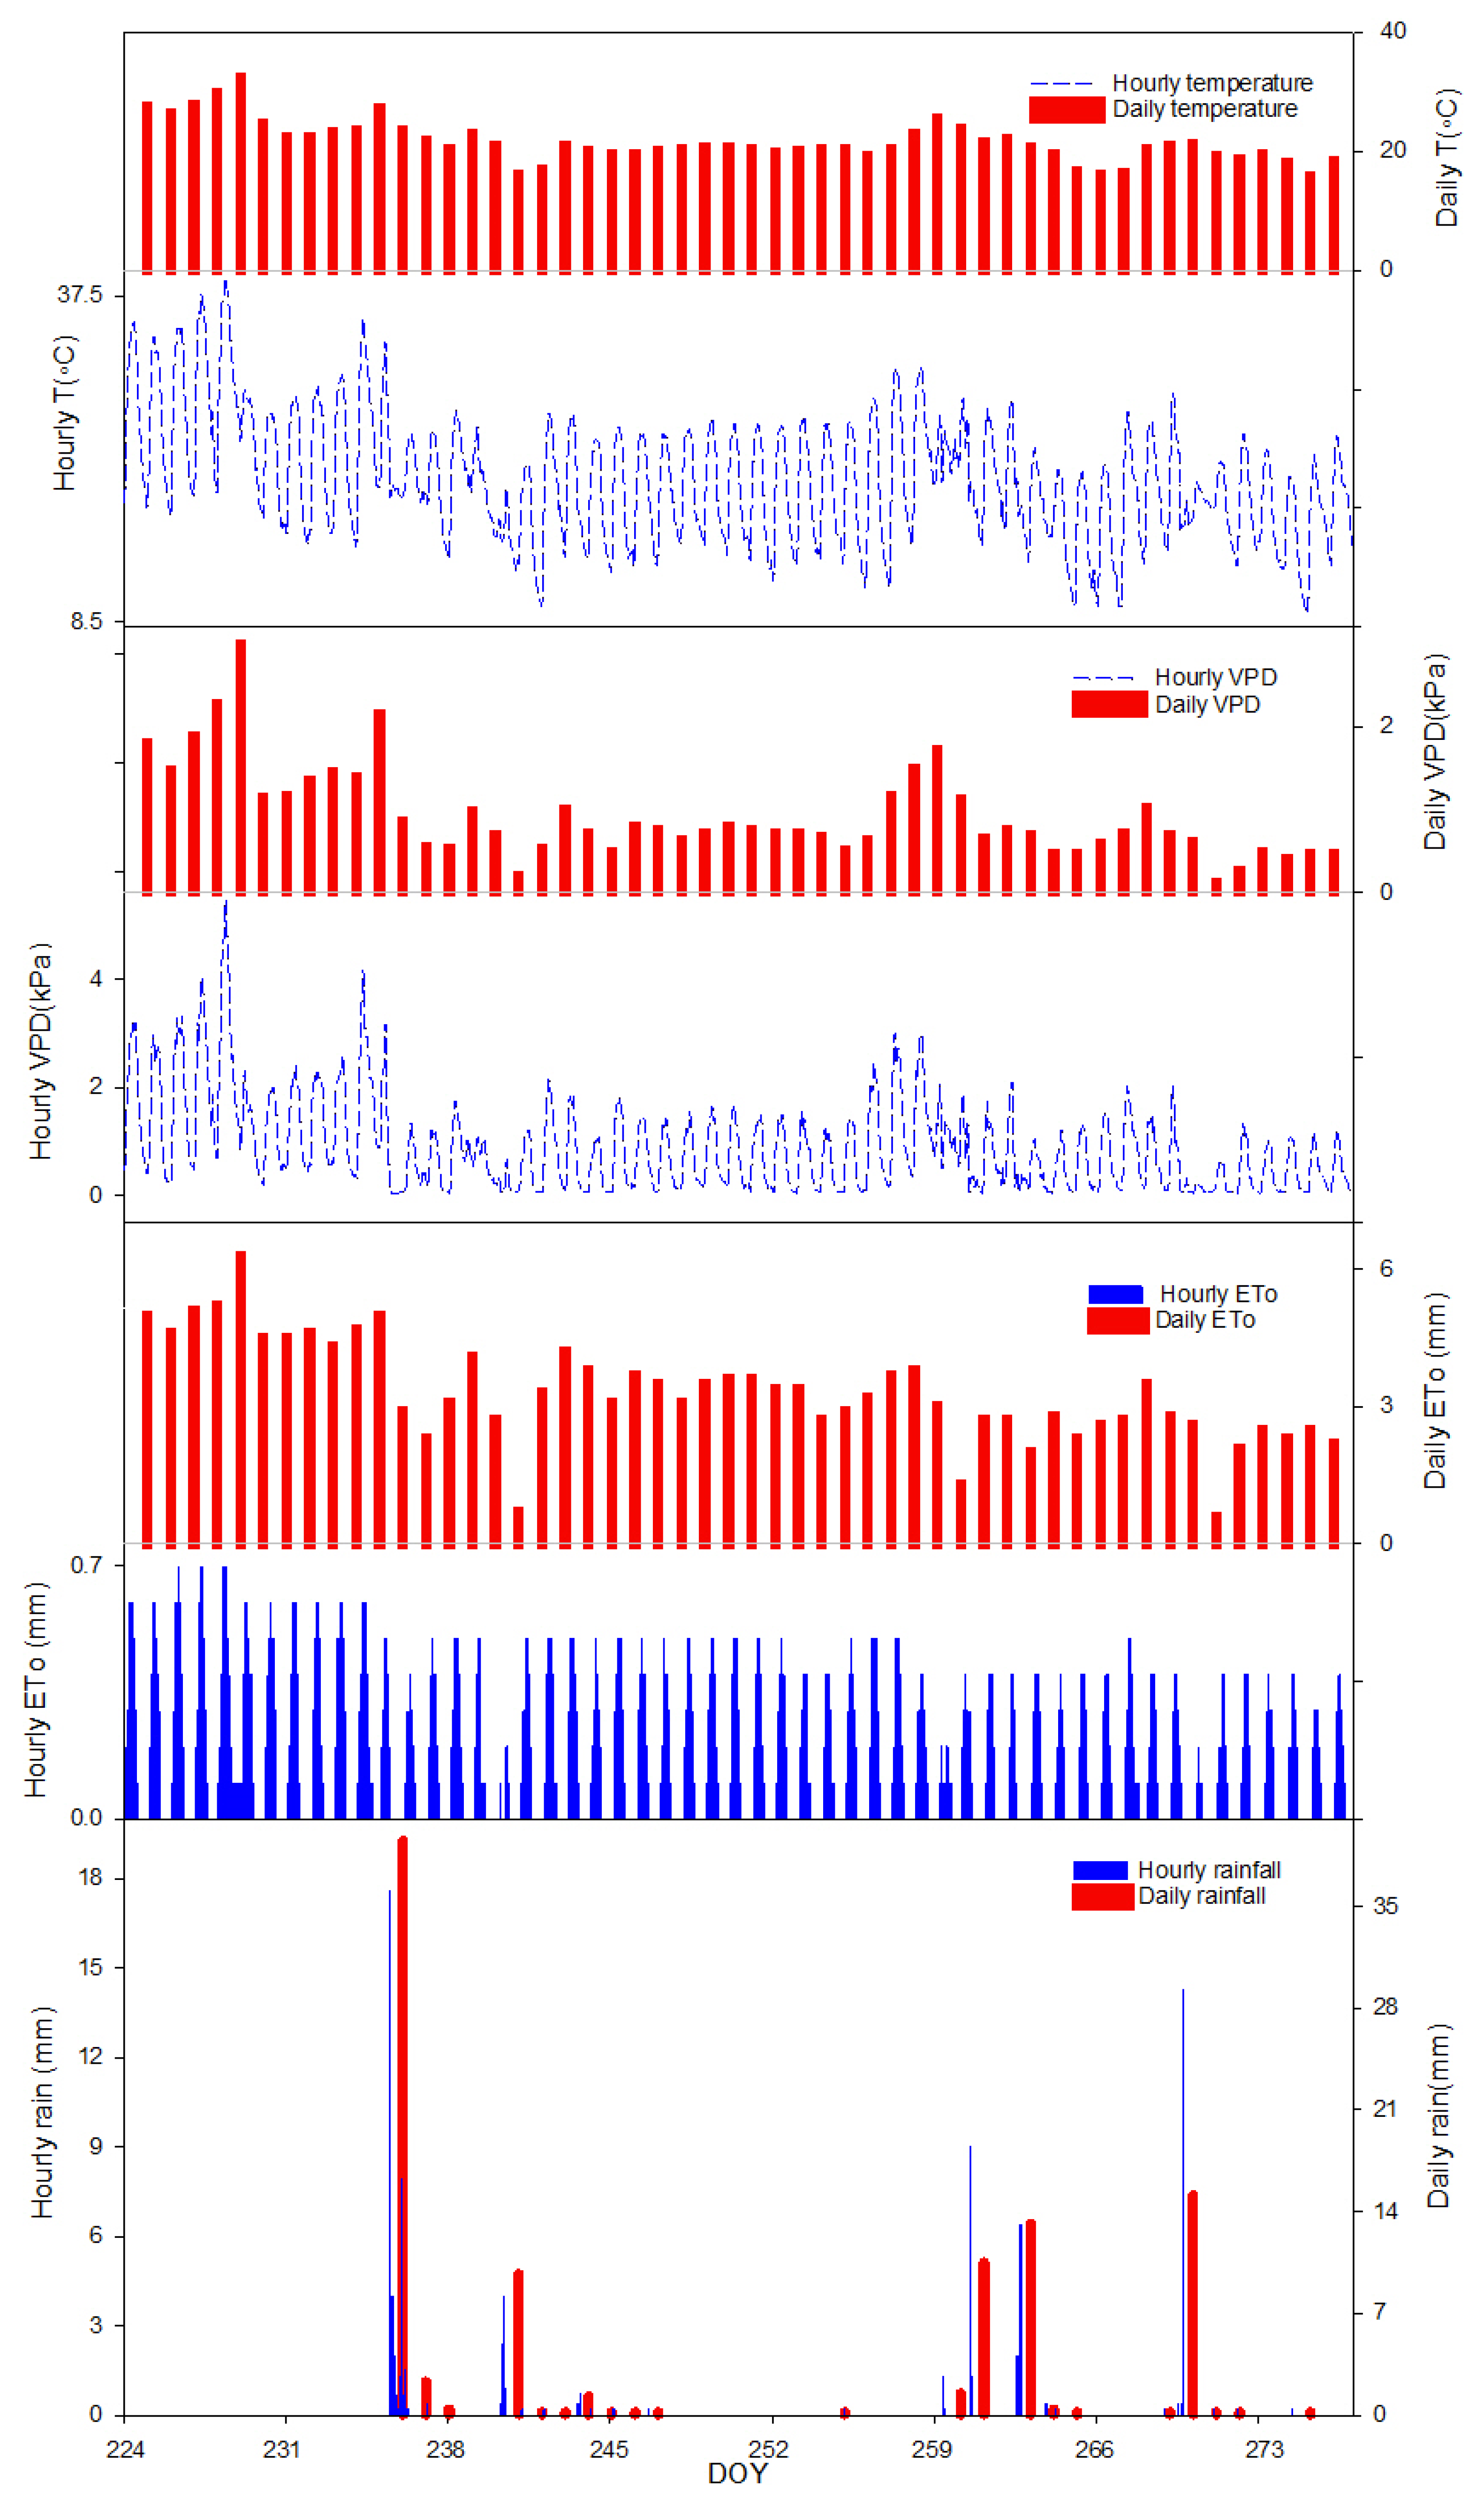
2.6. Meteorological Data

According to Köppen–Geiger climate classification, Agugliano is classified in the Cfa category and this is characterized by warm temperature, highly humid and warm summer [52] but in recent years the classification is moving toward Csa (hot summer Mediterranean). Meteorological data were recorded with a MeteoSense 4.0 weather station (Netsense S.r.l Florence, Italy) located in the olive orchard. For the calculation of vapor pressure deficit (VPD), air temperature (T), and relative humidity (RH) data were collected from our weather station. Vapor pressure deficit was calculated as:
VPD = (1 − (RH/100)) × SVP and SVP (Pascals) = 610.7 × 10(7.5T/(237.3 + T))
The VPD formula was recommended by Monteith and Unsworth [53]; where RH is the relative humidity, SVP is saturated vapor pressure, and T is temperature (°C). Our instrument was set to legal Rome time.

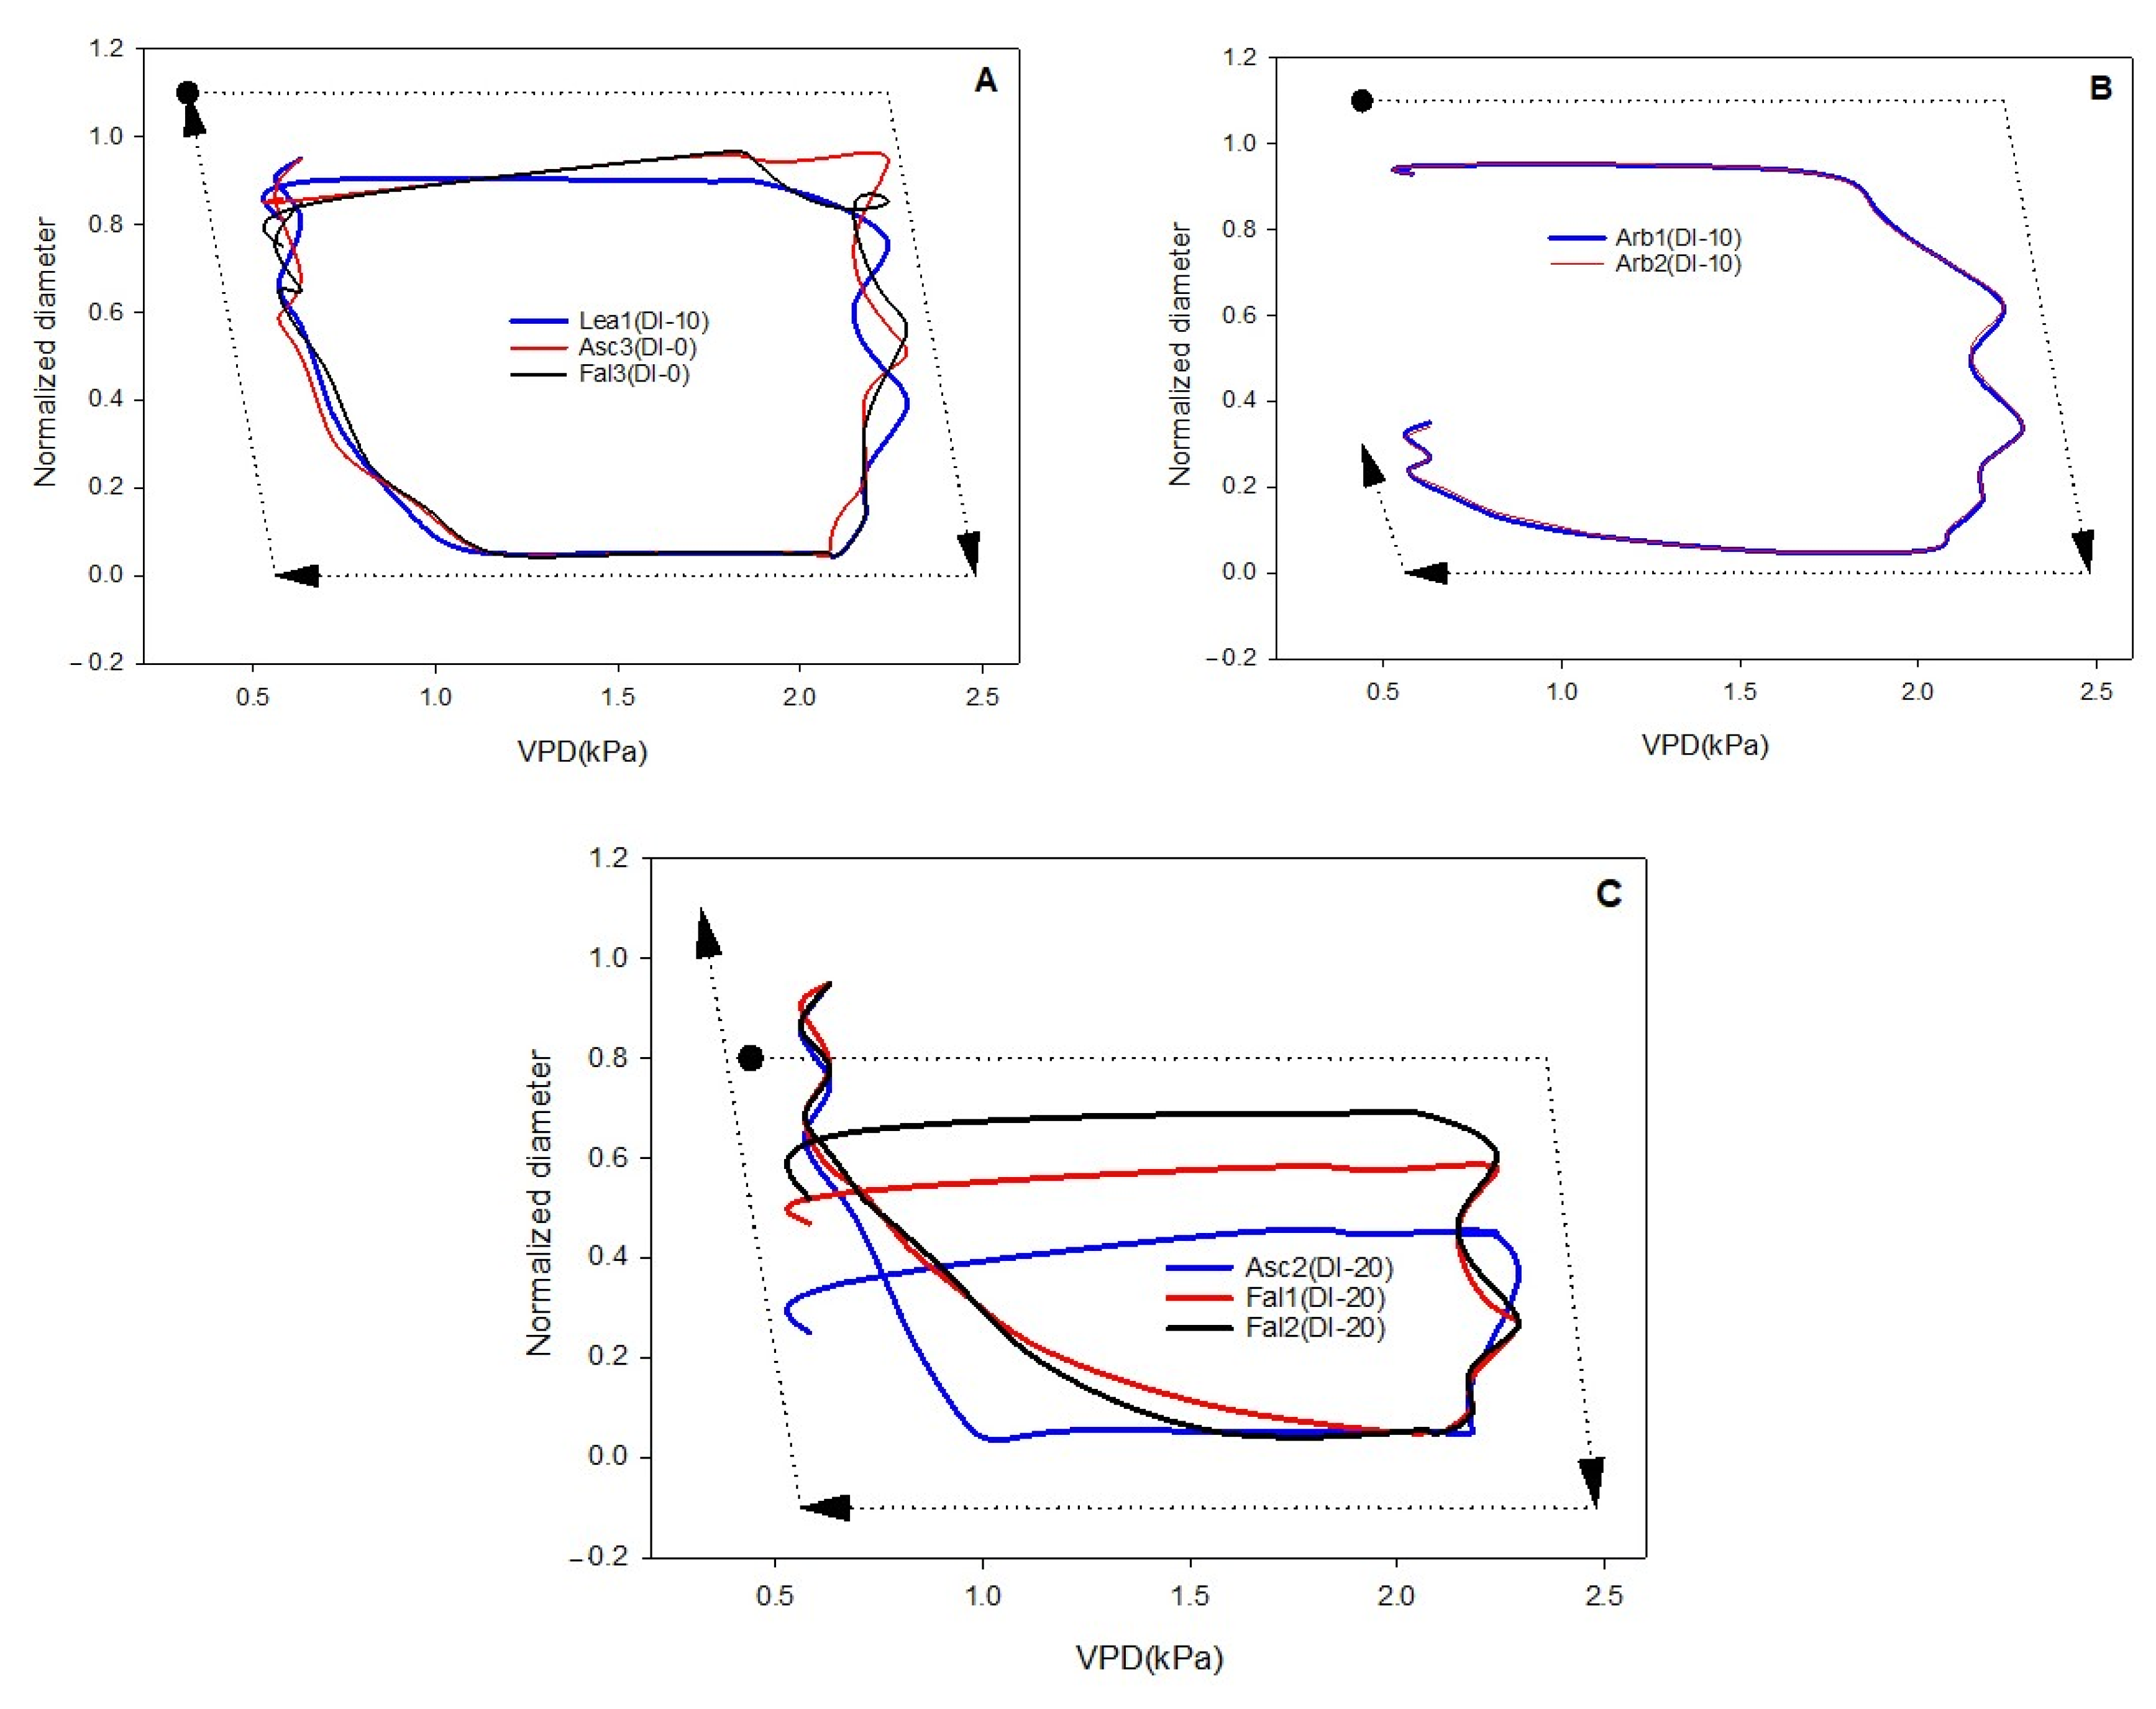
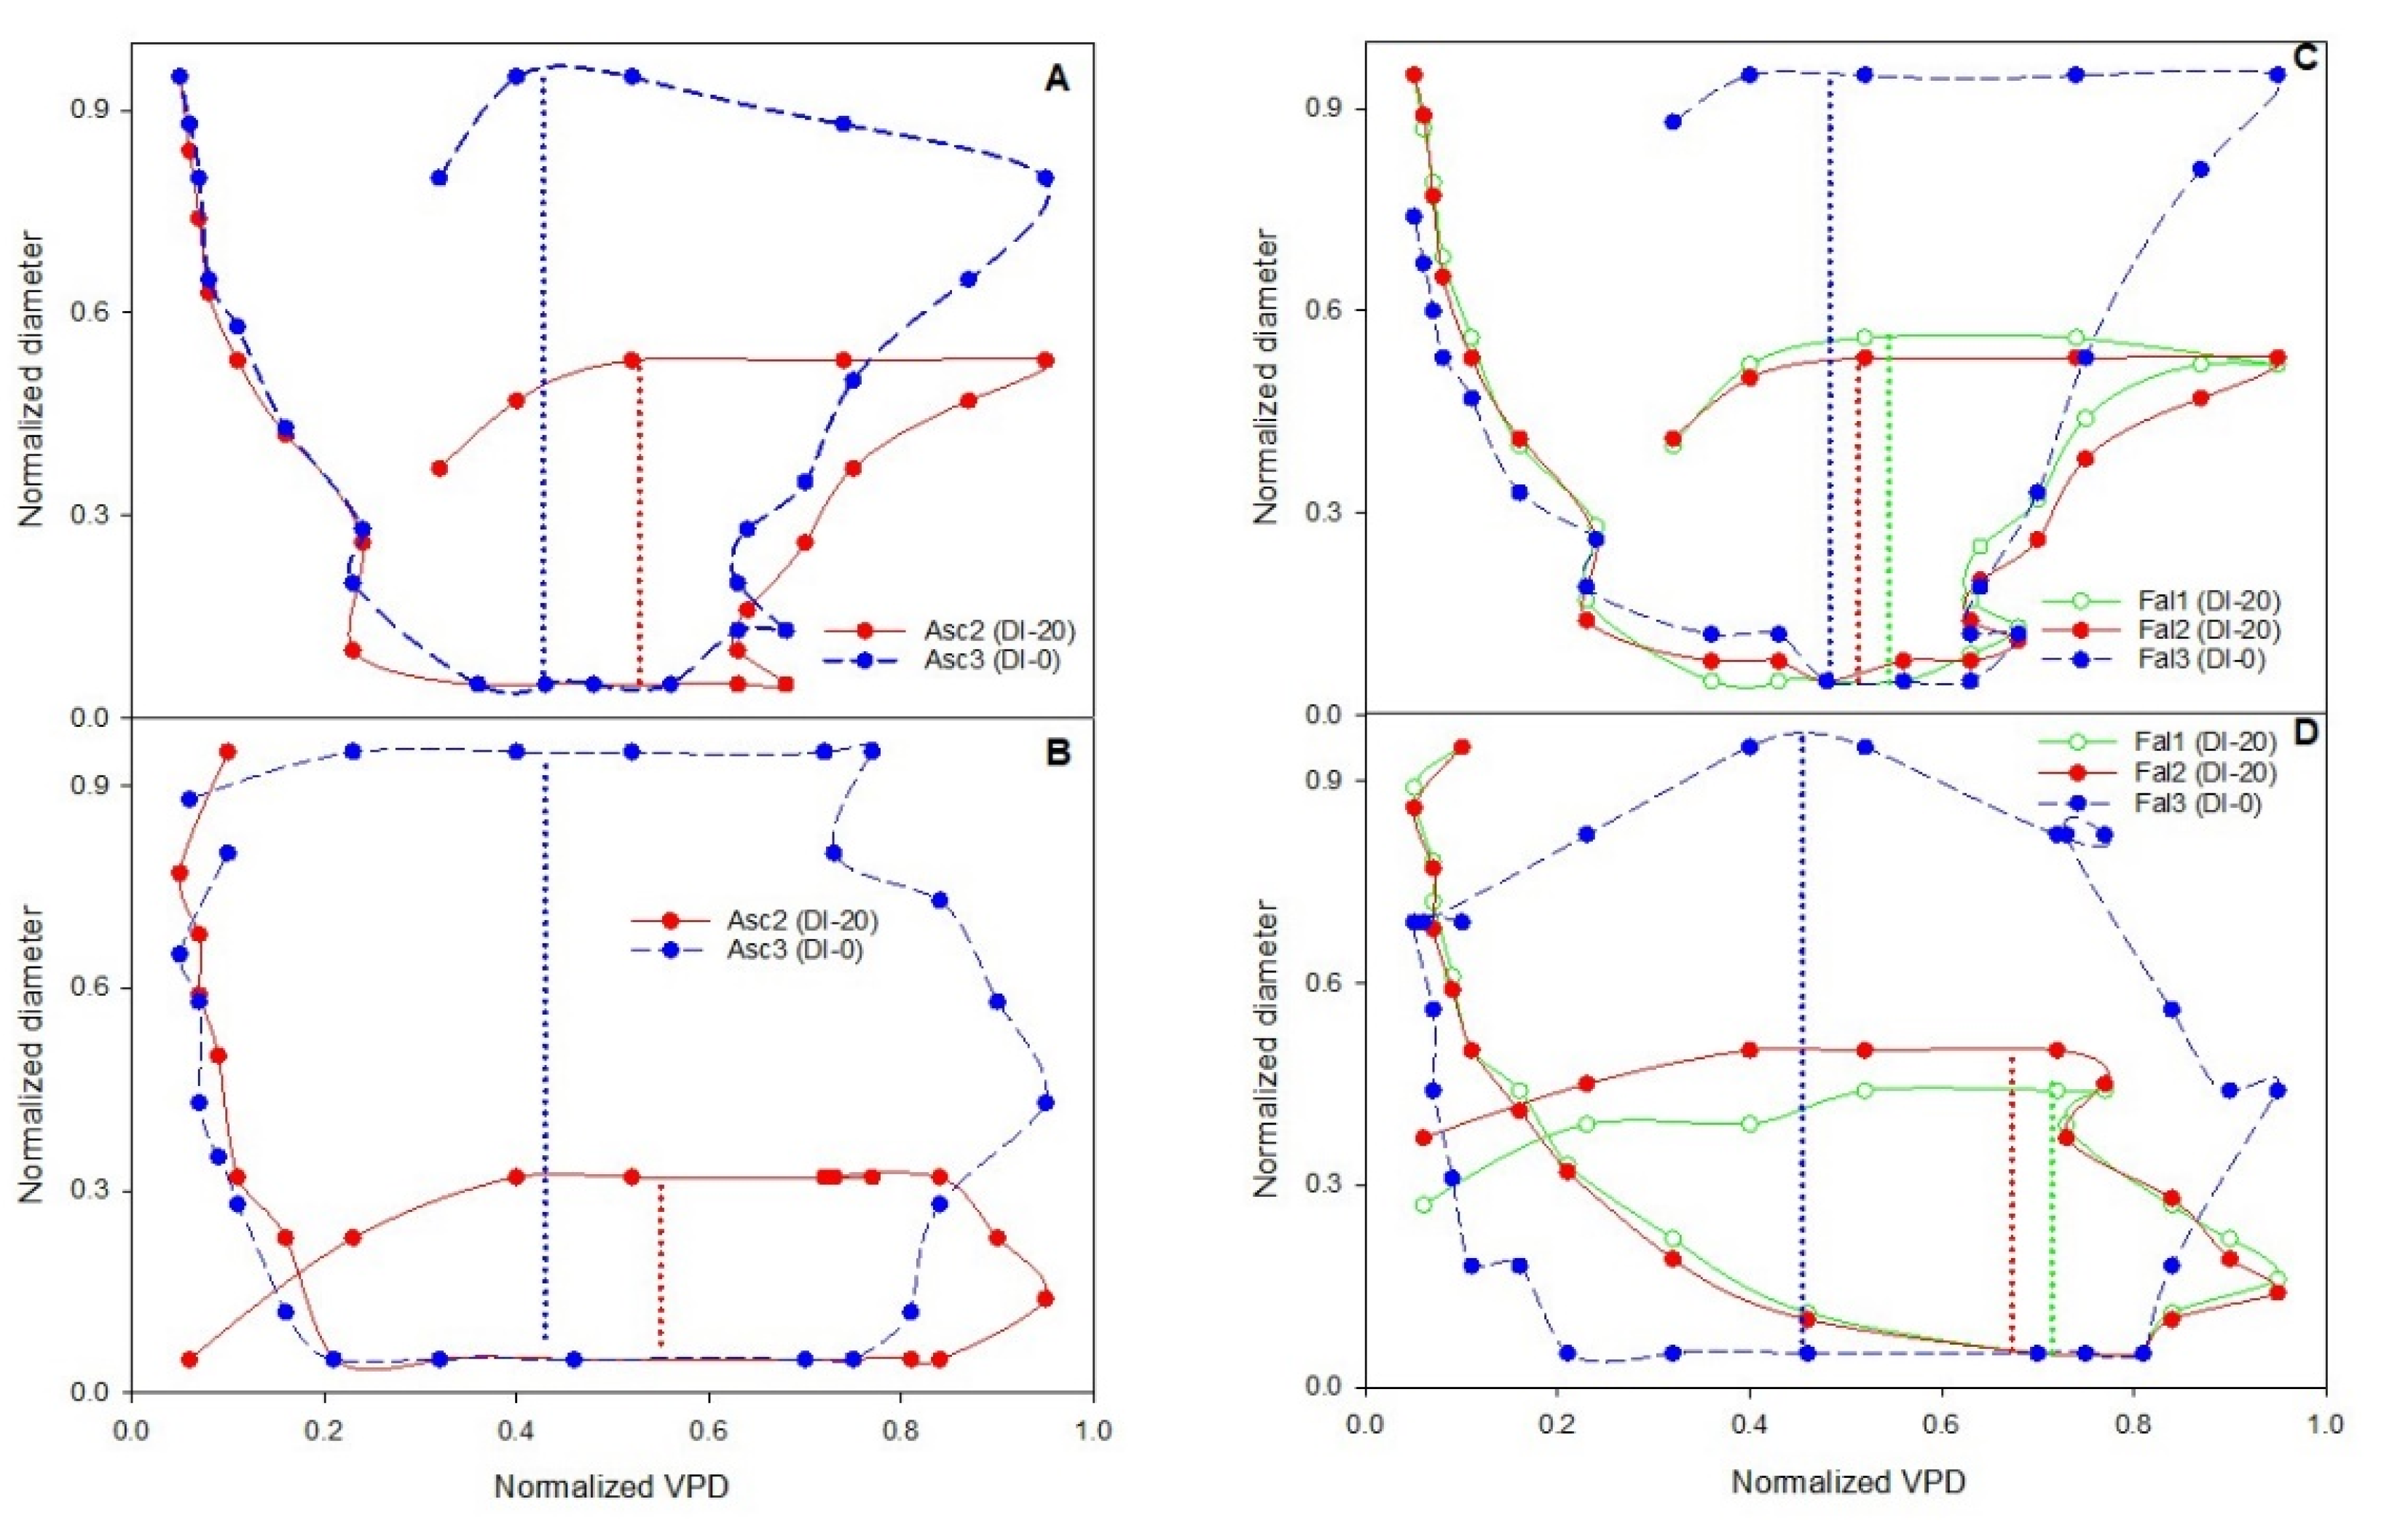
2.7. Hysteresis Curves

To explore the circadian pattern of hysteresis curve (loop), hourly collected data of transversal fruit diameter (FD) versus VPD were considered. For description of the hysteresis rotational pattern, the terms of clockwise and anticlockwise curve were employed. Furthermore, for characterization of hysteresis form, three concepts of partial, incomplete, and complete were used. When the hysteresis curve appeared in some part of the day and was not representative of the whole day, it was called partial. When the ending point of the hysteresis loop reached the same level of the starting point of the loop, it was defined as complete. Lastly, when the ending point of the hysteresis loop did not reach the same level of the starting point of the loop, so the loop was not completely closed, it was called incomplete hysteresis curve. For detection of incomplete clockwise hysteresis, normalized data of diameter were employed. Hysteresis loops were considered incomplete when the loop “opening” was more than 0.05 units. In the case of loop opening, less than 0.05 is considered as complete [27].
The measured daily data were normalized by Min-Max method through the equation:
x′ = 0.9 × ((x − xmin)/xmax − xmin) + 0.05
where x′ is the normalized value, x is the value of the existing data, and xmin and xmax are the minimum and maximum values of the data, respectively [27,36].

2.8. Data Analysis and Presentation

One-way repeated measures analysis of variance (ANOVA) was performed for assessing significant differences. The significant differences among the treatments were assessed using Student–Newman–Keuls’s test (p < 0.05). All data analyses and graph design were performed using Sigmaplot 14.5 (Systat Software, Inc., San Jose, CA, USA).

3. Results

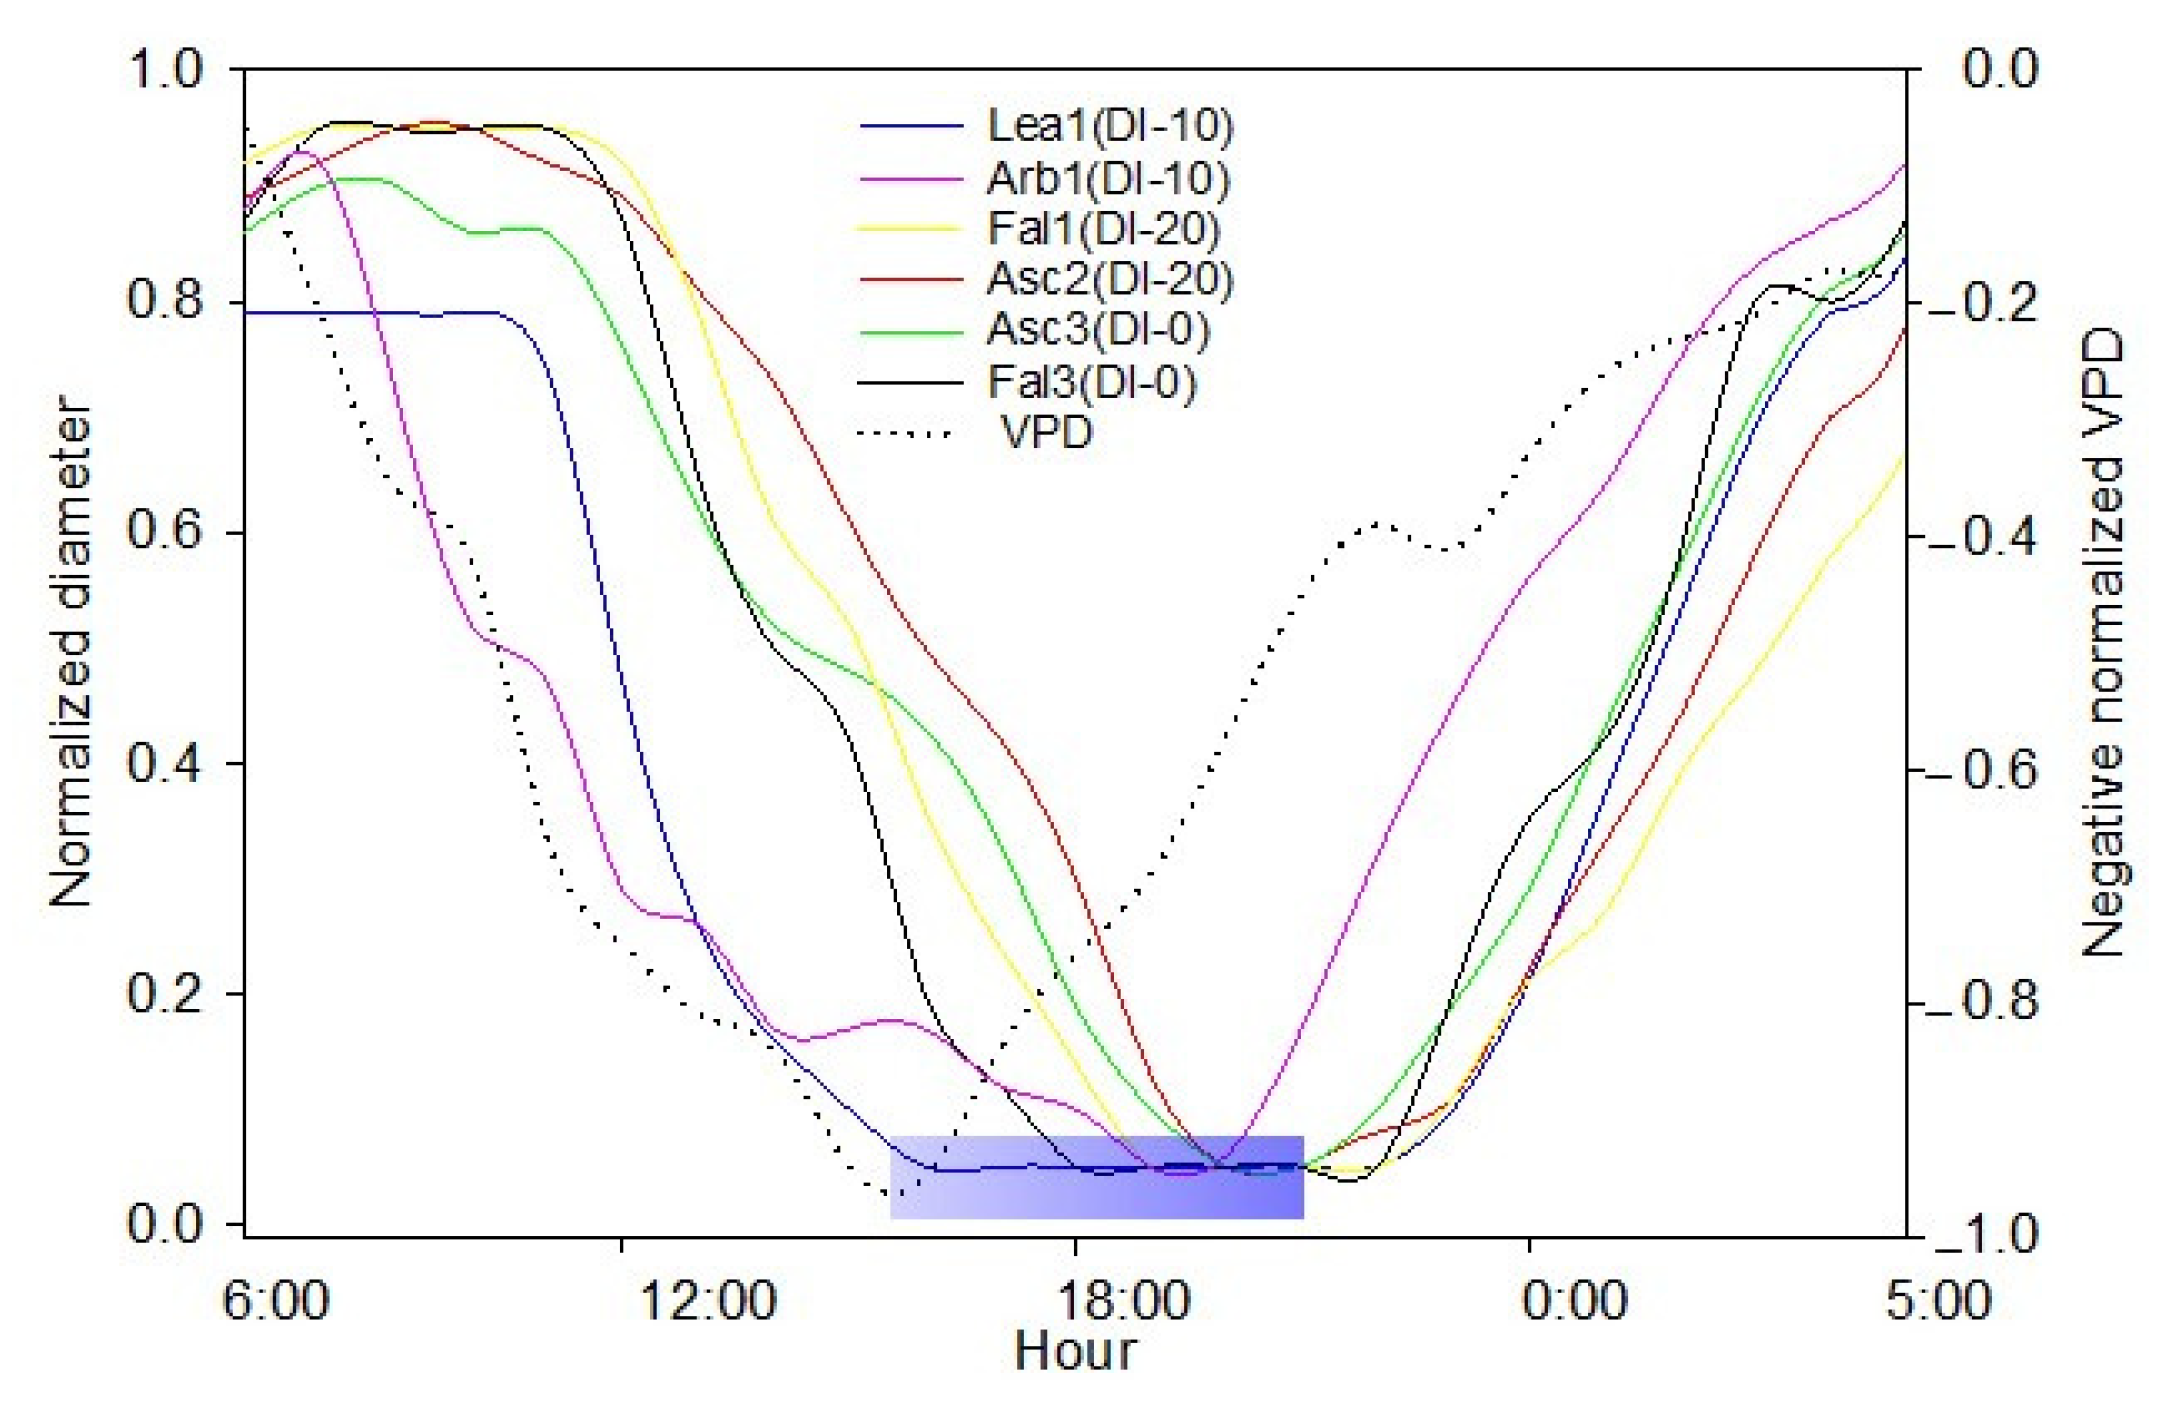
3.1. Environmental Data Analysis and VPD Evolution
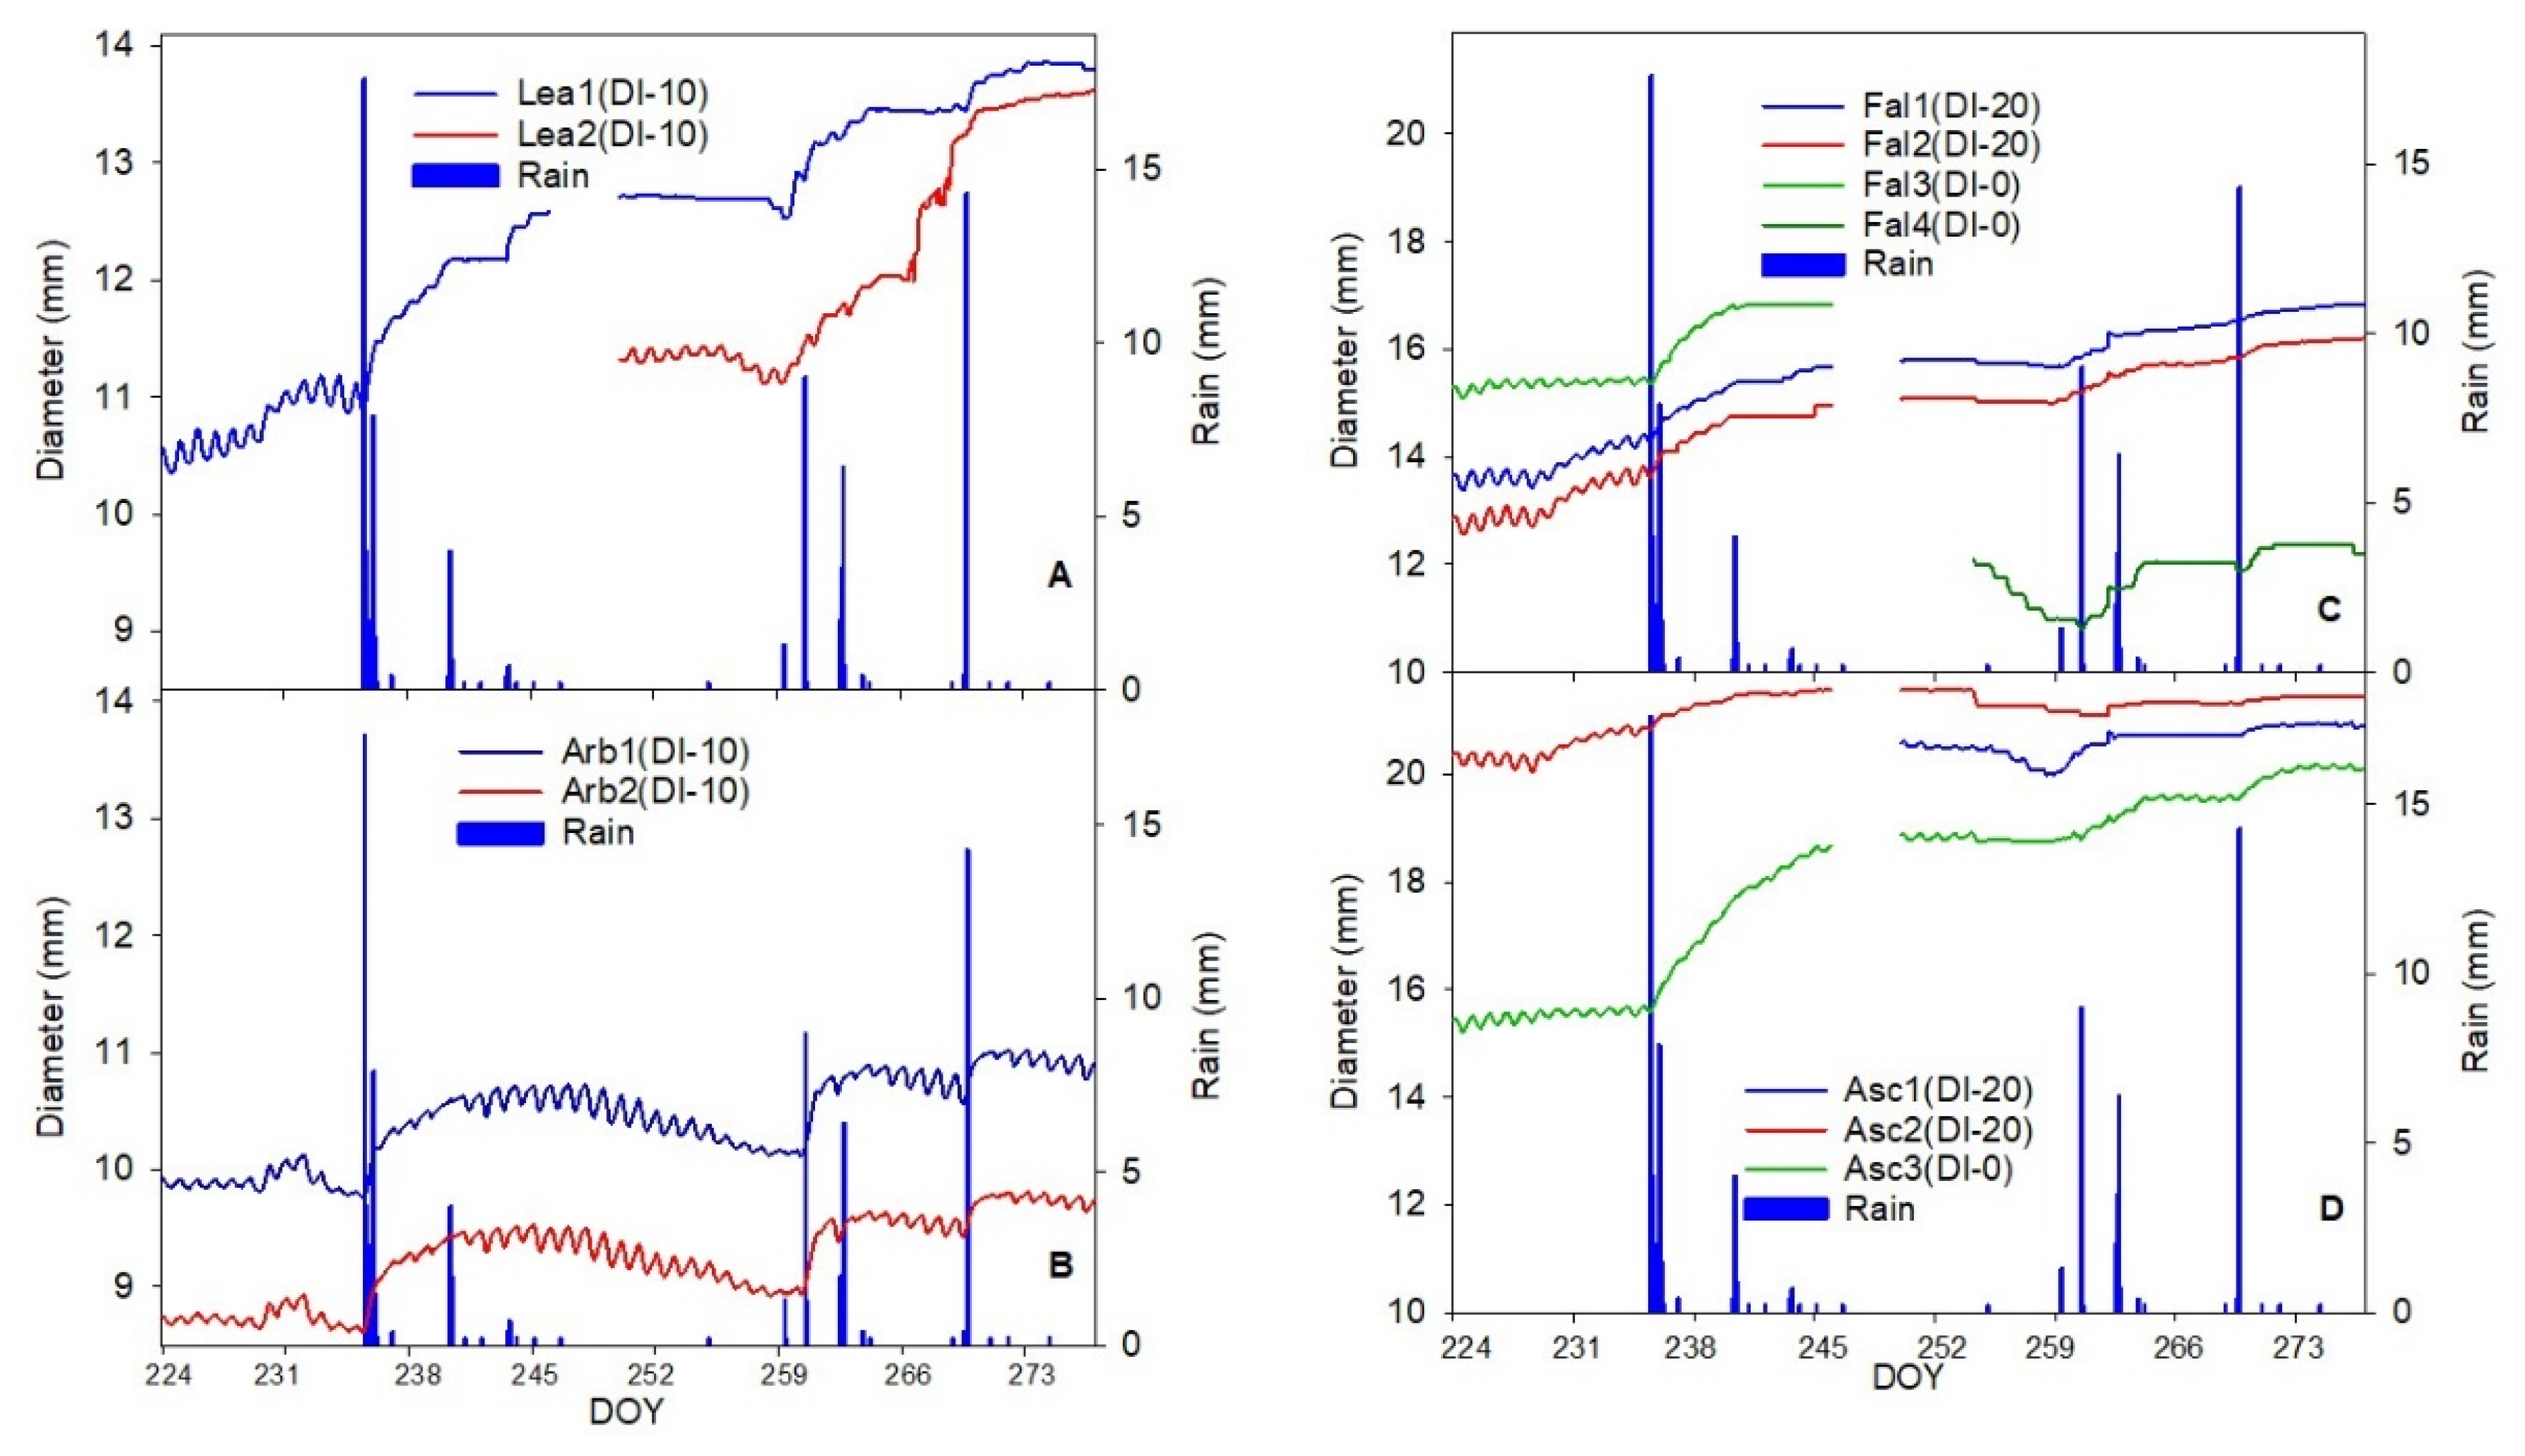
Figure 1 shows the data of VPD, temperature (T), ET0, and rainfall during the experiment (DOY 224 to DOY 276). The highest measured hourly VPD was 5.4 (kPa) on 16th of August (DOY 228) and the lowest was 0.05 (kPa) on 23rd and 24th of August (DOYs 235 and 236). The highest daily average of VPD was 3.0 (kPa) on the 16th of August (DOY 228) and the lowest was 0.12 (kPa) on the 27th of September (DOY 270). The daily mean of VPD during the experiment was 0.91 ± 0.56 (kPa). The daily mean of temperature during experiment was 21.30 ± 3.43 (°C), with a minimum daily temperature of 15.76 (°C) on the 1st of October (DOY 274) and maximum daily temperature of 32.26 (°C) reached on 17th of August (DOY 229). The maximum and minimum hourly temperatures were 39.0 and 9.5 (°C) which reached on 16th of August (DOY 228) and 1st of October (DOY 274), respectively. The total reference ET0 was 173.9 (mm) for the experiment period. The maximum and minimum daily ET0 was 6.3 (mm day−1) on 16th of August (DOY 228) and 0.6 (mm day−1) on 27th of September (DOY 270), respectively. The maximum hourly ET0 was 0.7 (mm hour−1) which reached on 14th, 15th, 16th of August (DOYs 226, 227, and 228). During the experiment period, the accumulated rainfall was 96.1 (mm), with maximum hourly and daily of 17.6 (mm hour−1) and 39.5 (mm day−1) reached on 23rd of August (DOY 235).

3.2. Fruit Growth

Figure 2 reports the hourly transversal diameter of fruits for the four different cultivars from DOY 224 to DOY 276. The typical third phase of the fruit growth was observable in all four cultivars (Lea, Figure 2A; Arbequina, Figure 2B; Piantone di Falerone, Figure 2C; Ascolana dura Figure 2D); however, with dissimilar growth slope among different cultivars and a final relentless toward maturation (4th phase). The fruit growth showed a diameter increase with diurnal fluctuation. The diurnal fluctuation of olive fruit was detected as a shrinkage of fruit diameter from mid-morning to early afternoon followed by expansion of fruit diameter from late afternoon to early morning (Figure S1A). At the end of the day, the fruits reached a size larger than the initial point of the same day. In fact, Arbequina (DI-10) in 60.4% of cases (64 out of 106), Lea (DI-10) in 82.89% of cases (63 out of 76), Ascolana dura (DI-0) in 77.5% of cases (38 out of 49), Ascolana dura (DI-20) in 72.4% of cases (55 out of 76), Piantone di Falerone (DI-0) in 82.5% of cases (32 out of 39) and Piantone di Falerone (DI-20) in 87.7% of cases (86 out of 98) reached a size similar or larger than the initial point of same day.
The duration, from beginning to finishing daily fruit shrinkage and expansion, did not show similarity among cultivar-irrigation level (Table S1). In addition, there were some exceptional days which showed different growth patterns (Figure S1B). There was no unique pattern for explanation of diameter (fruit growth) fluctuation of these days.

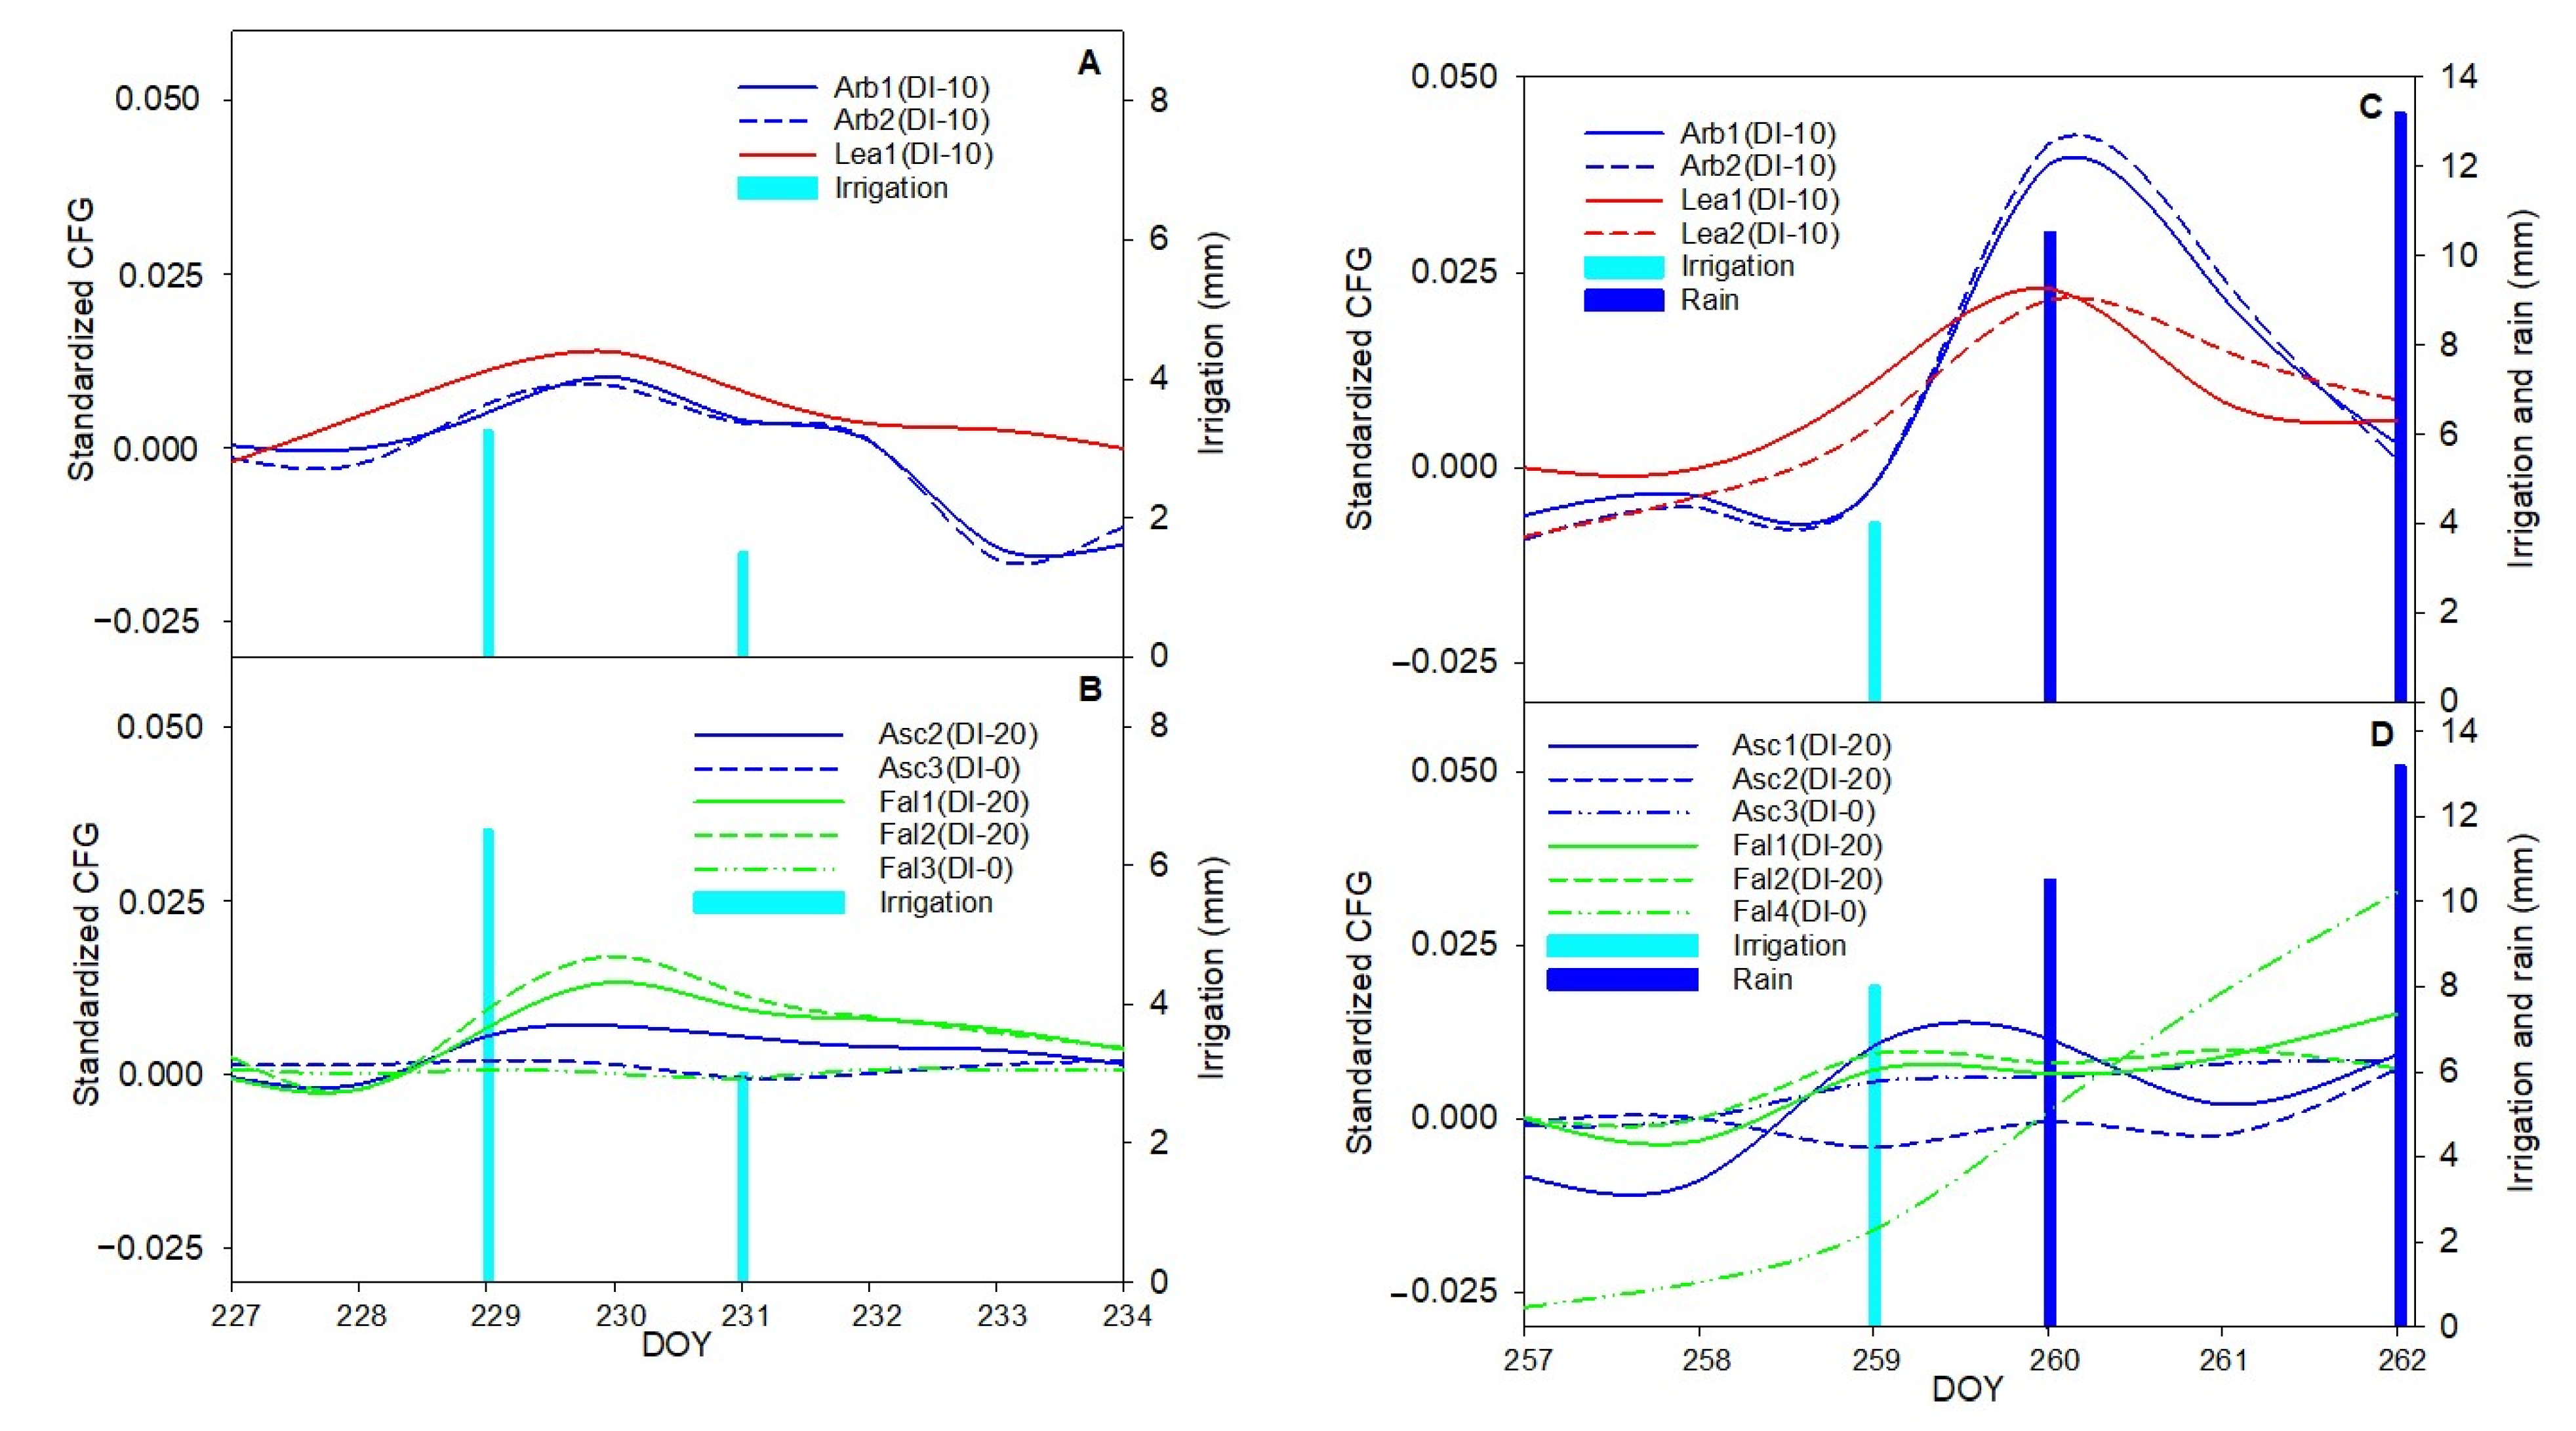
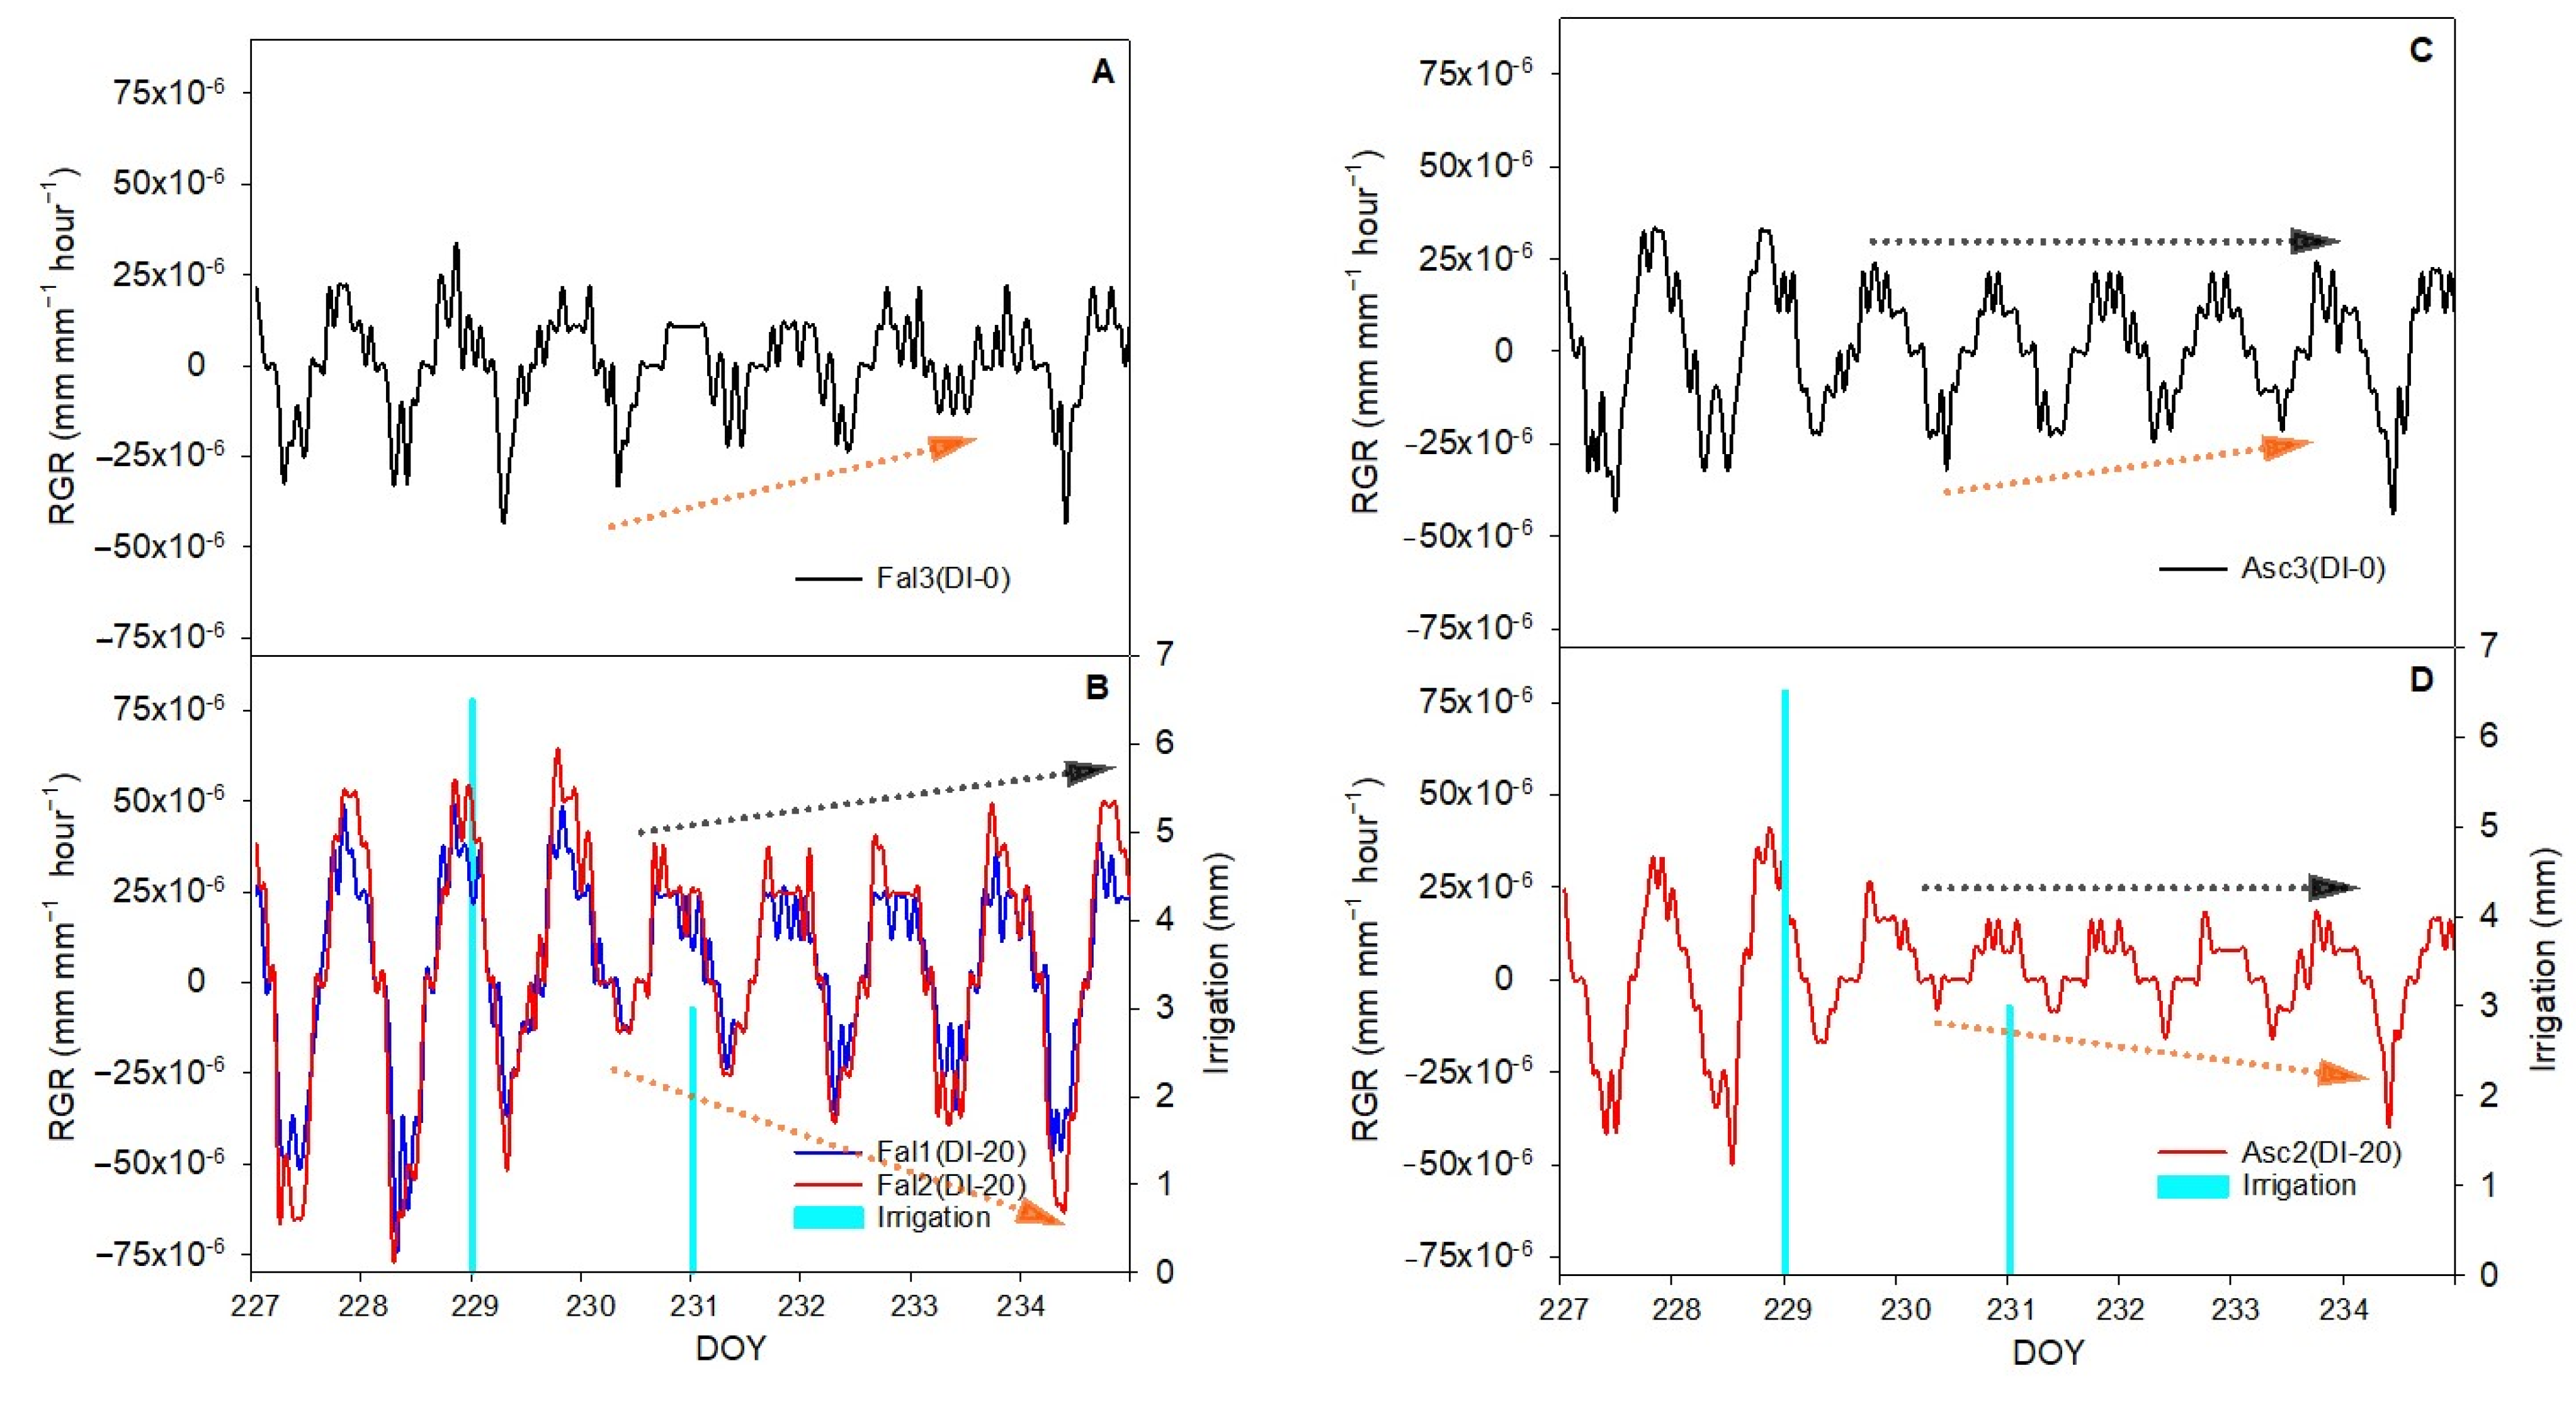
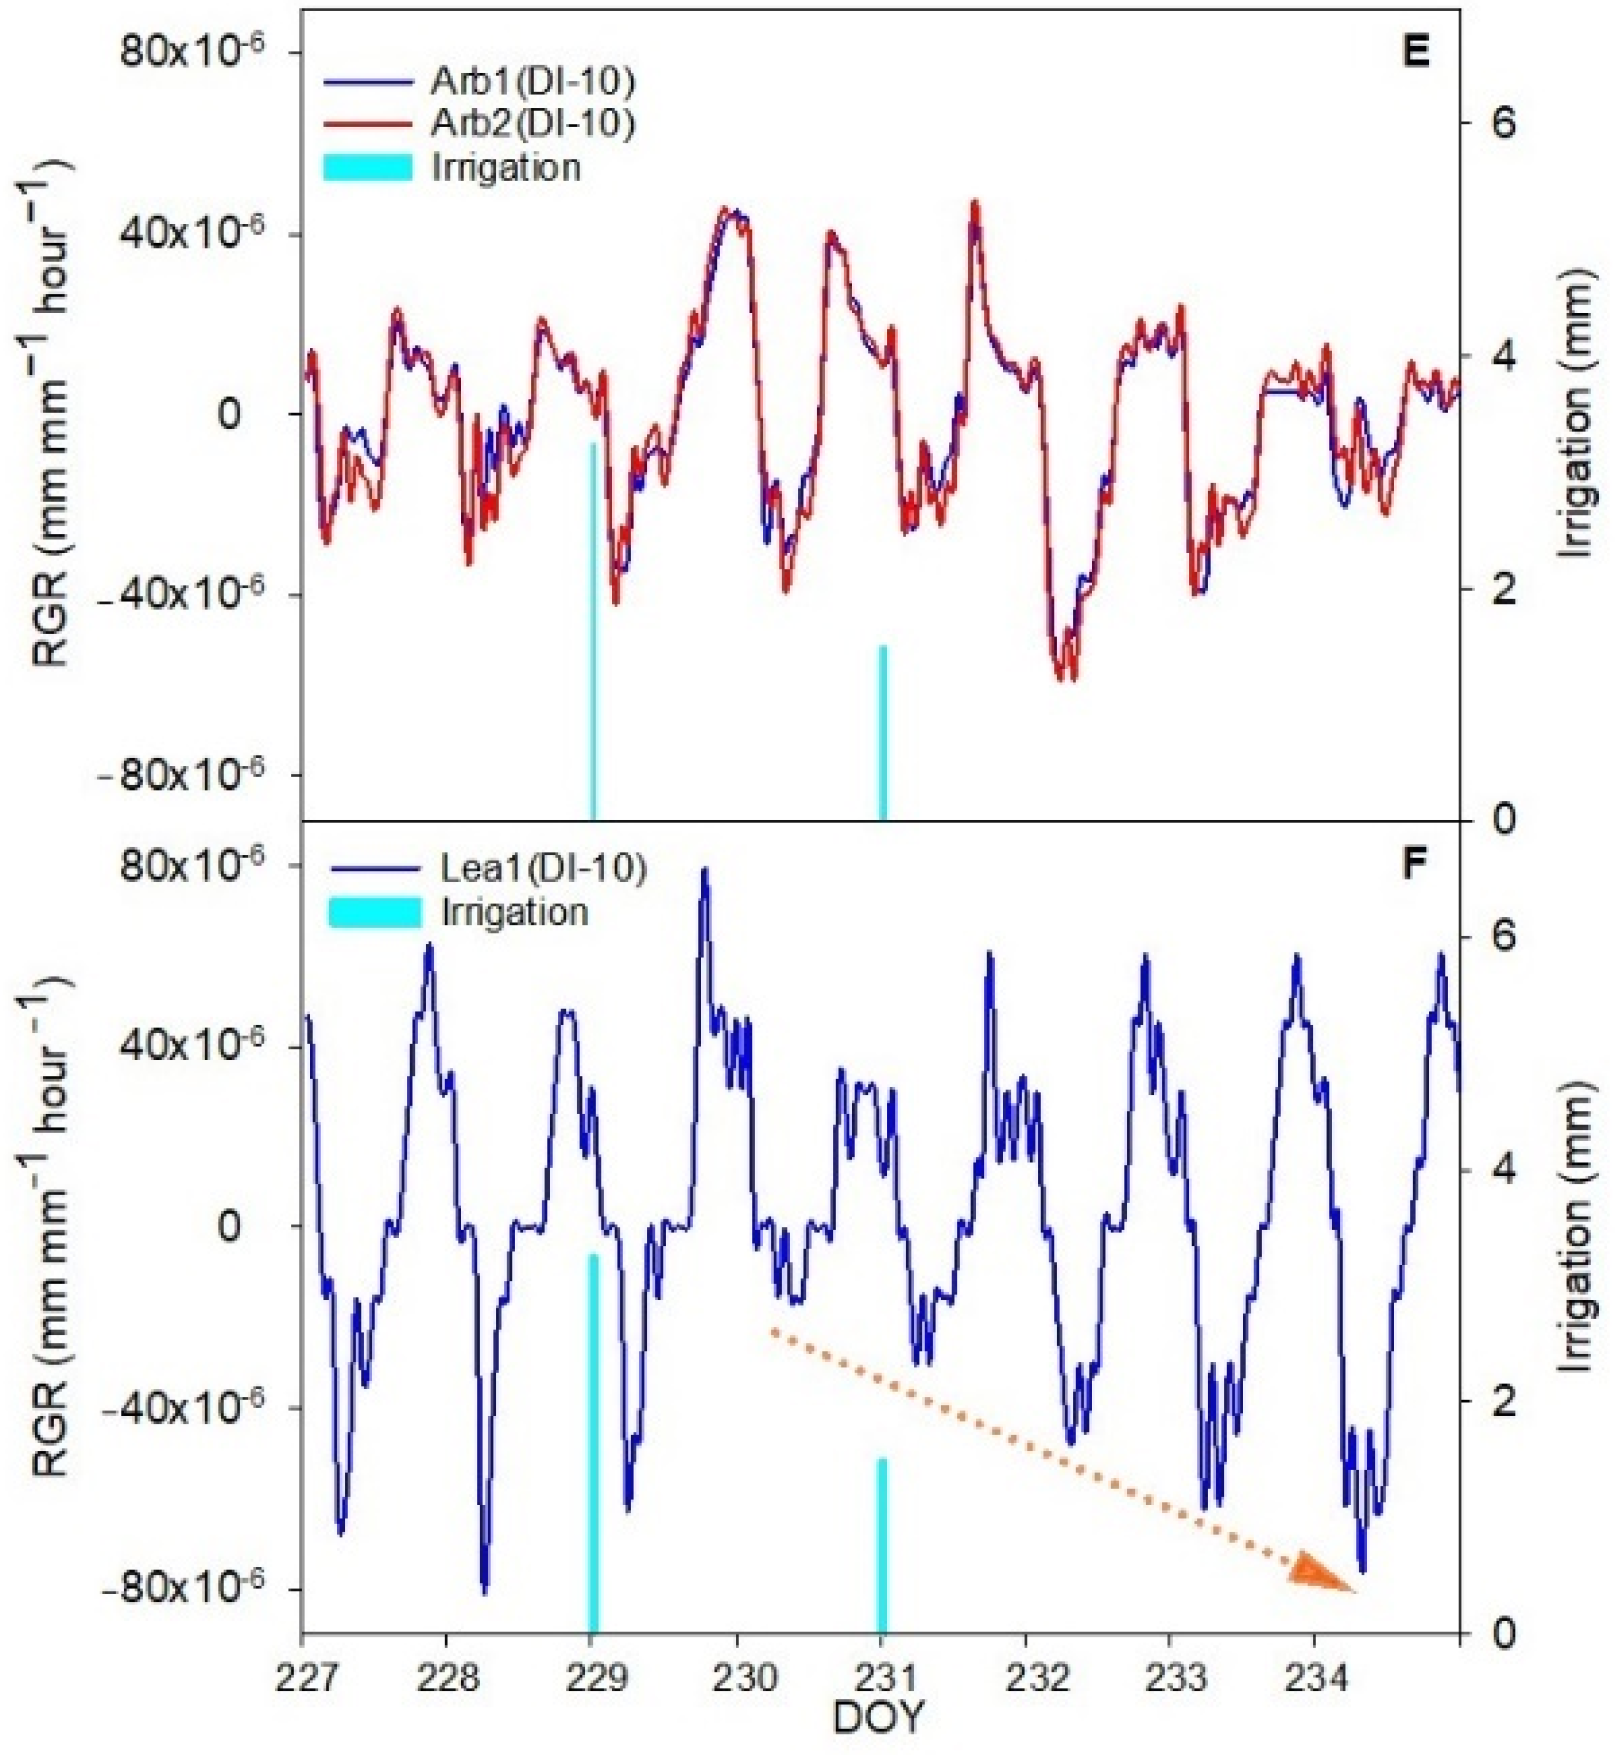
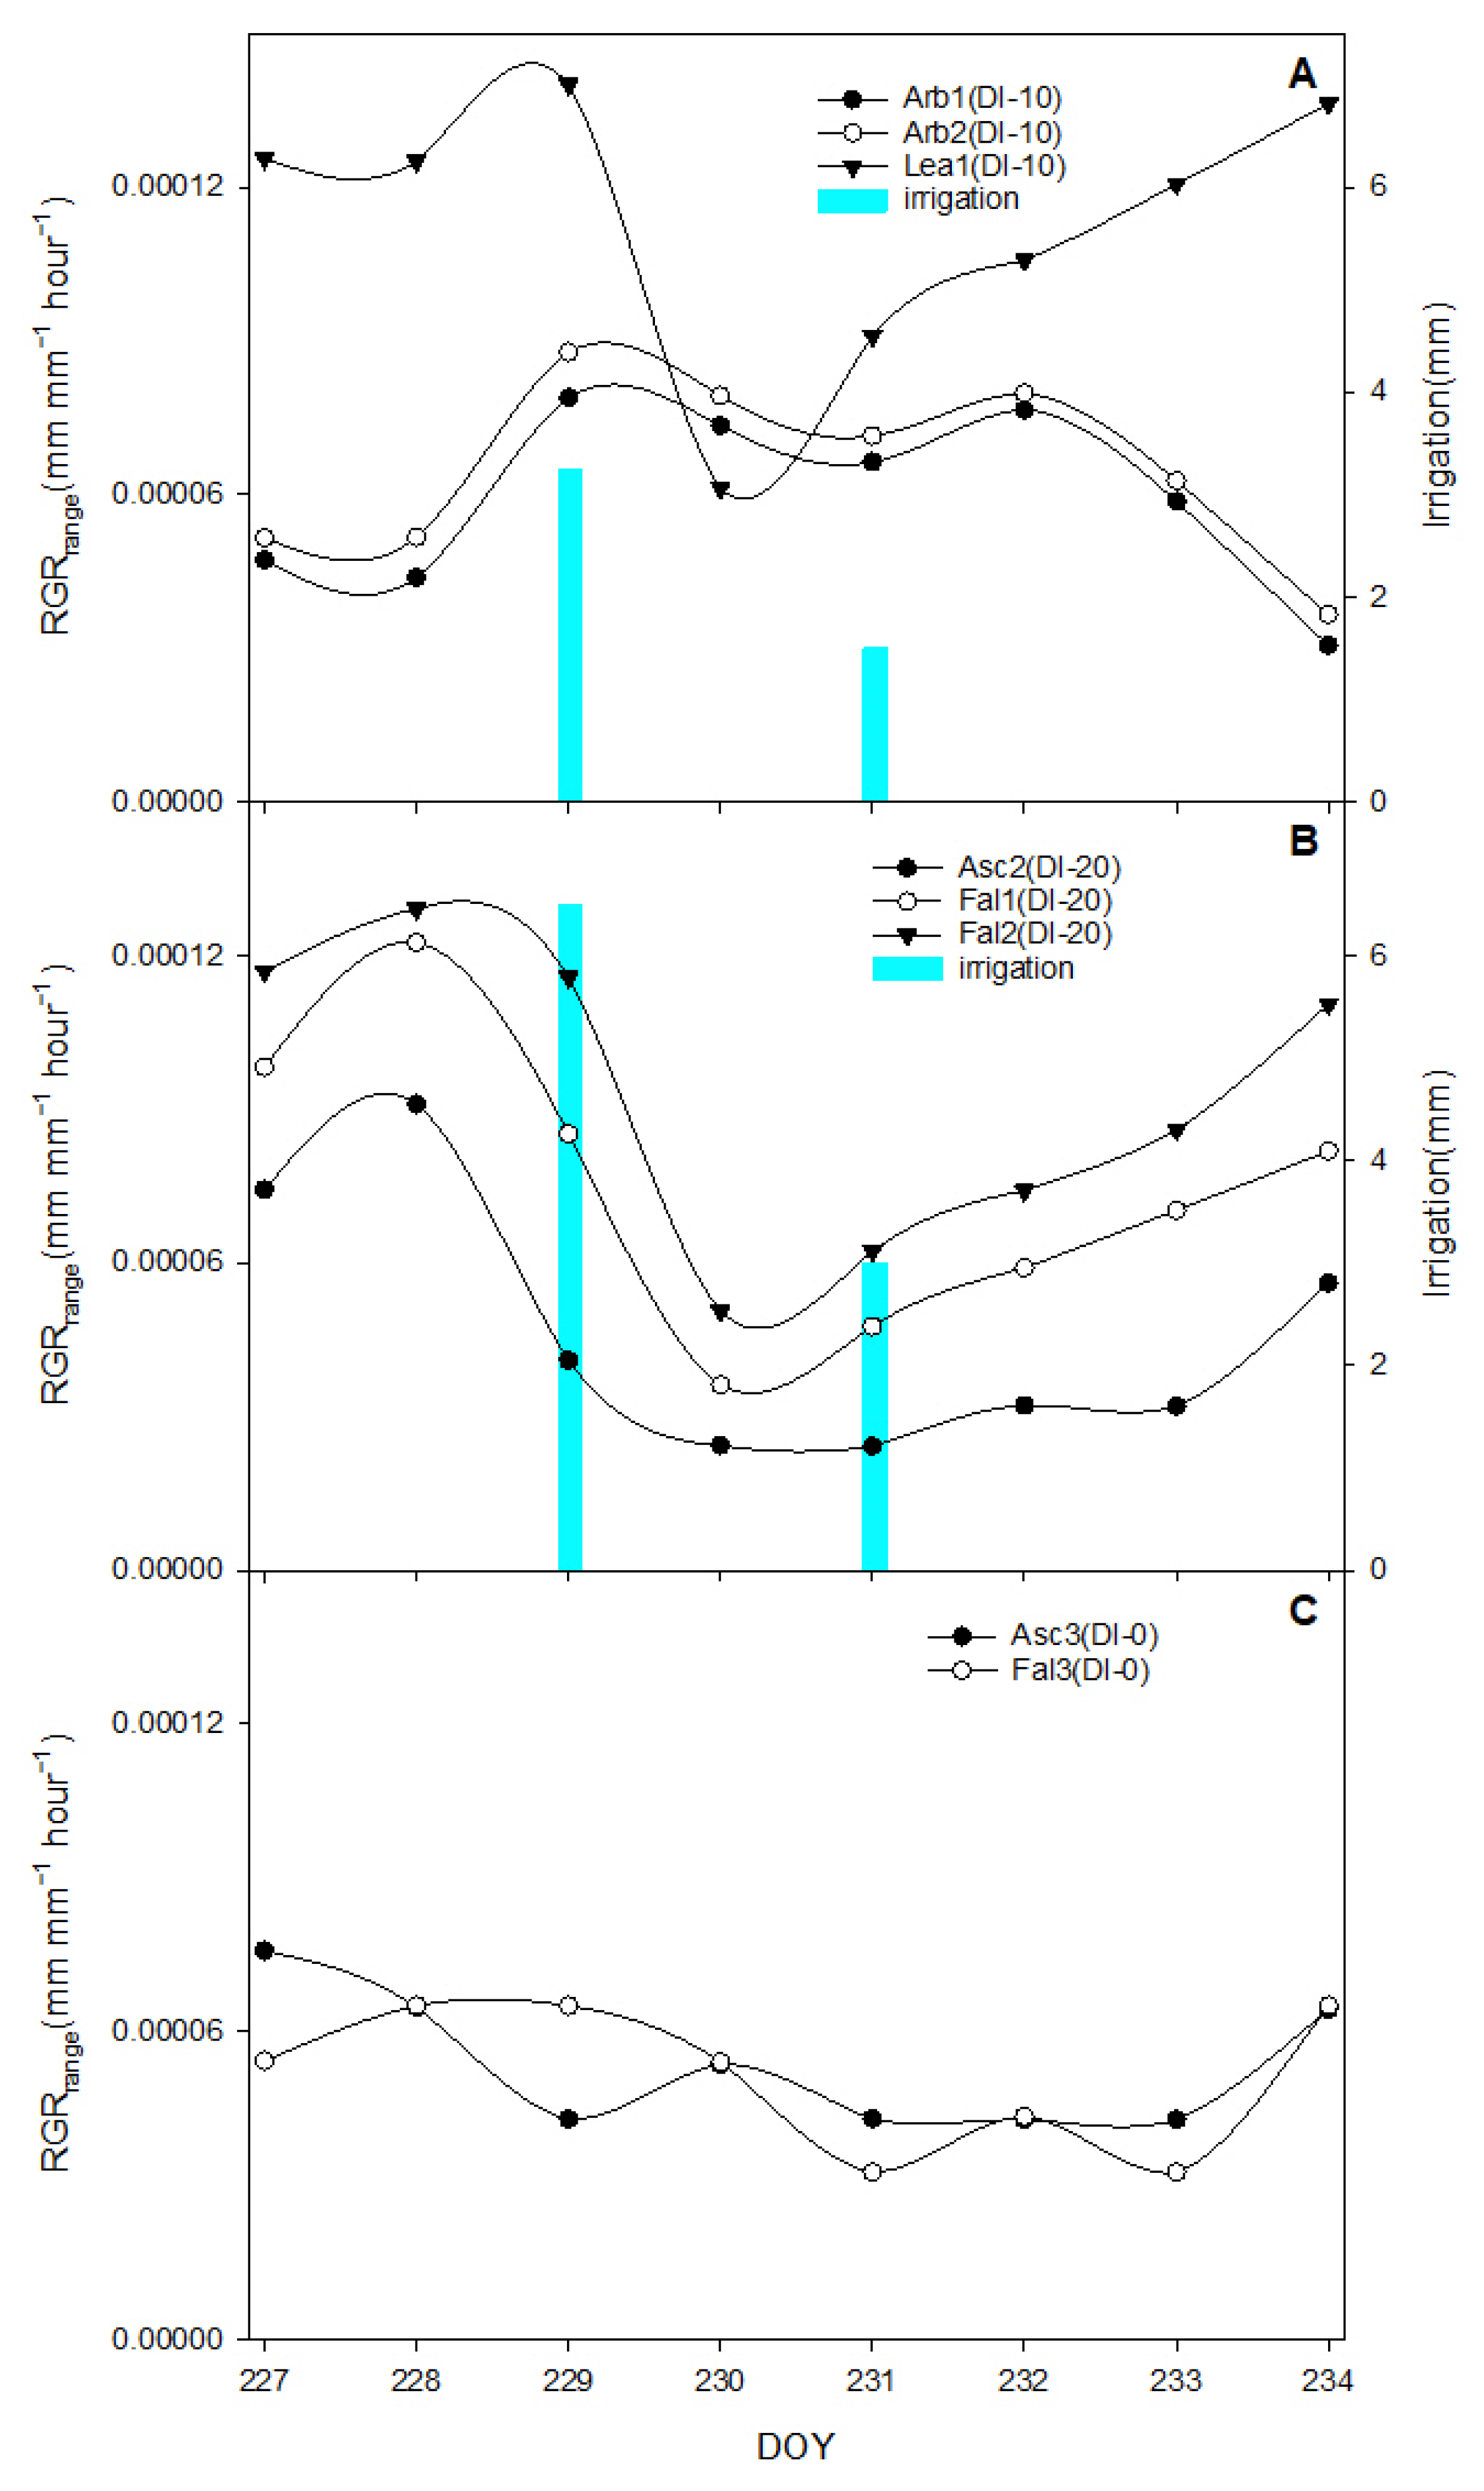
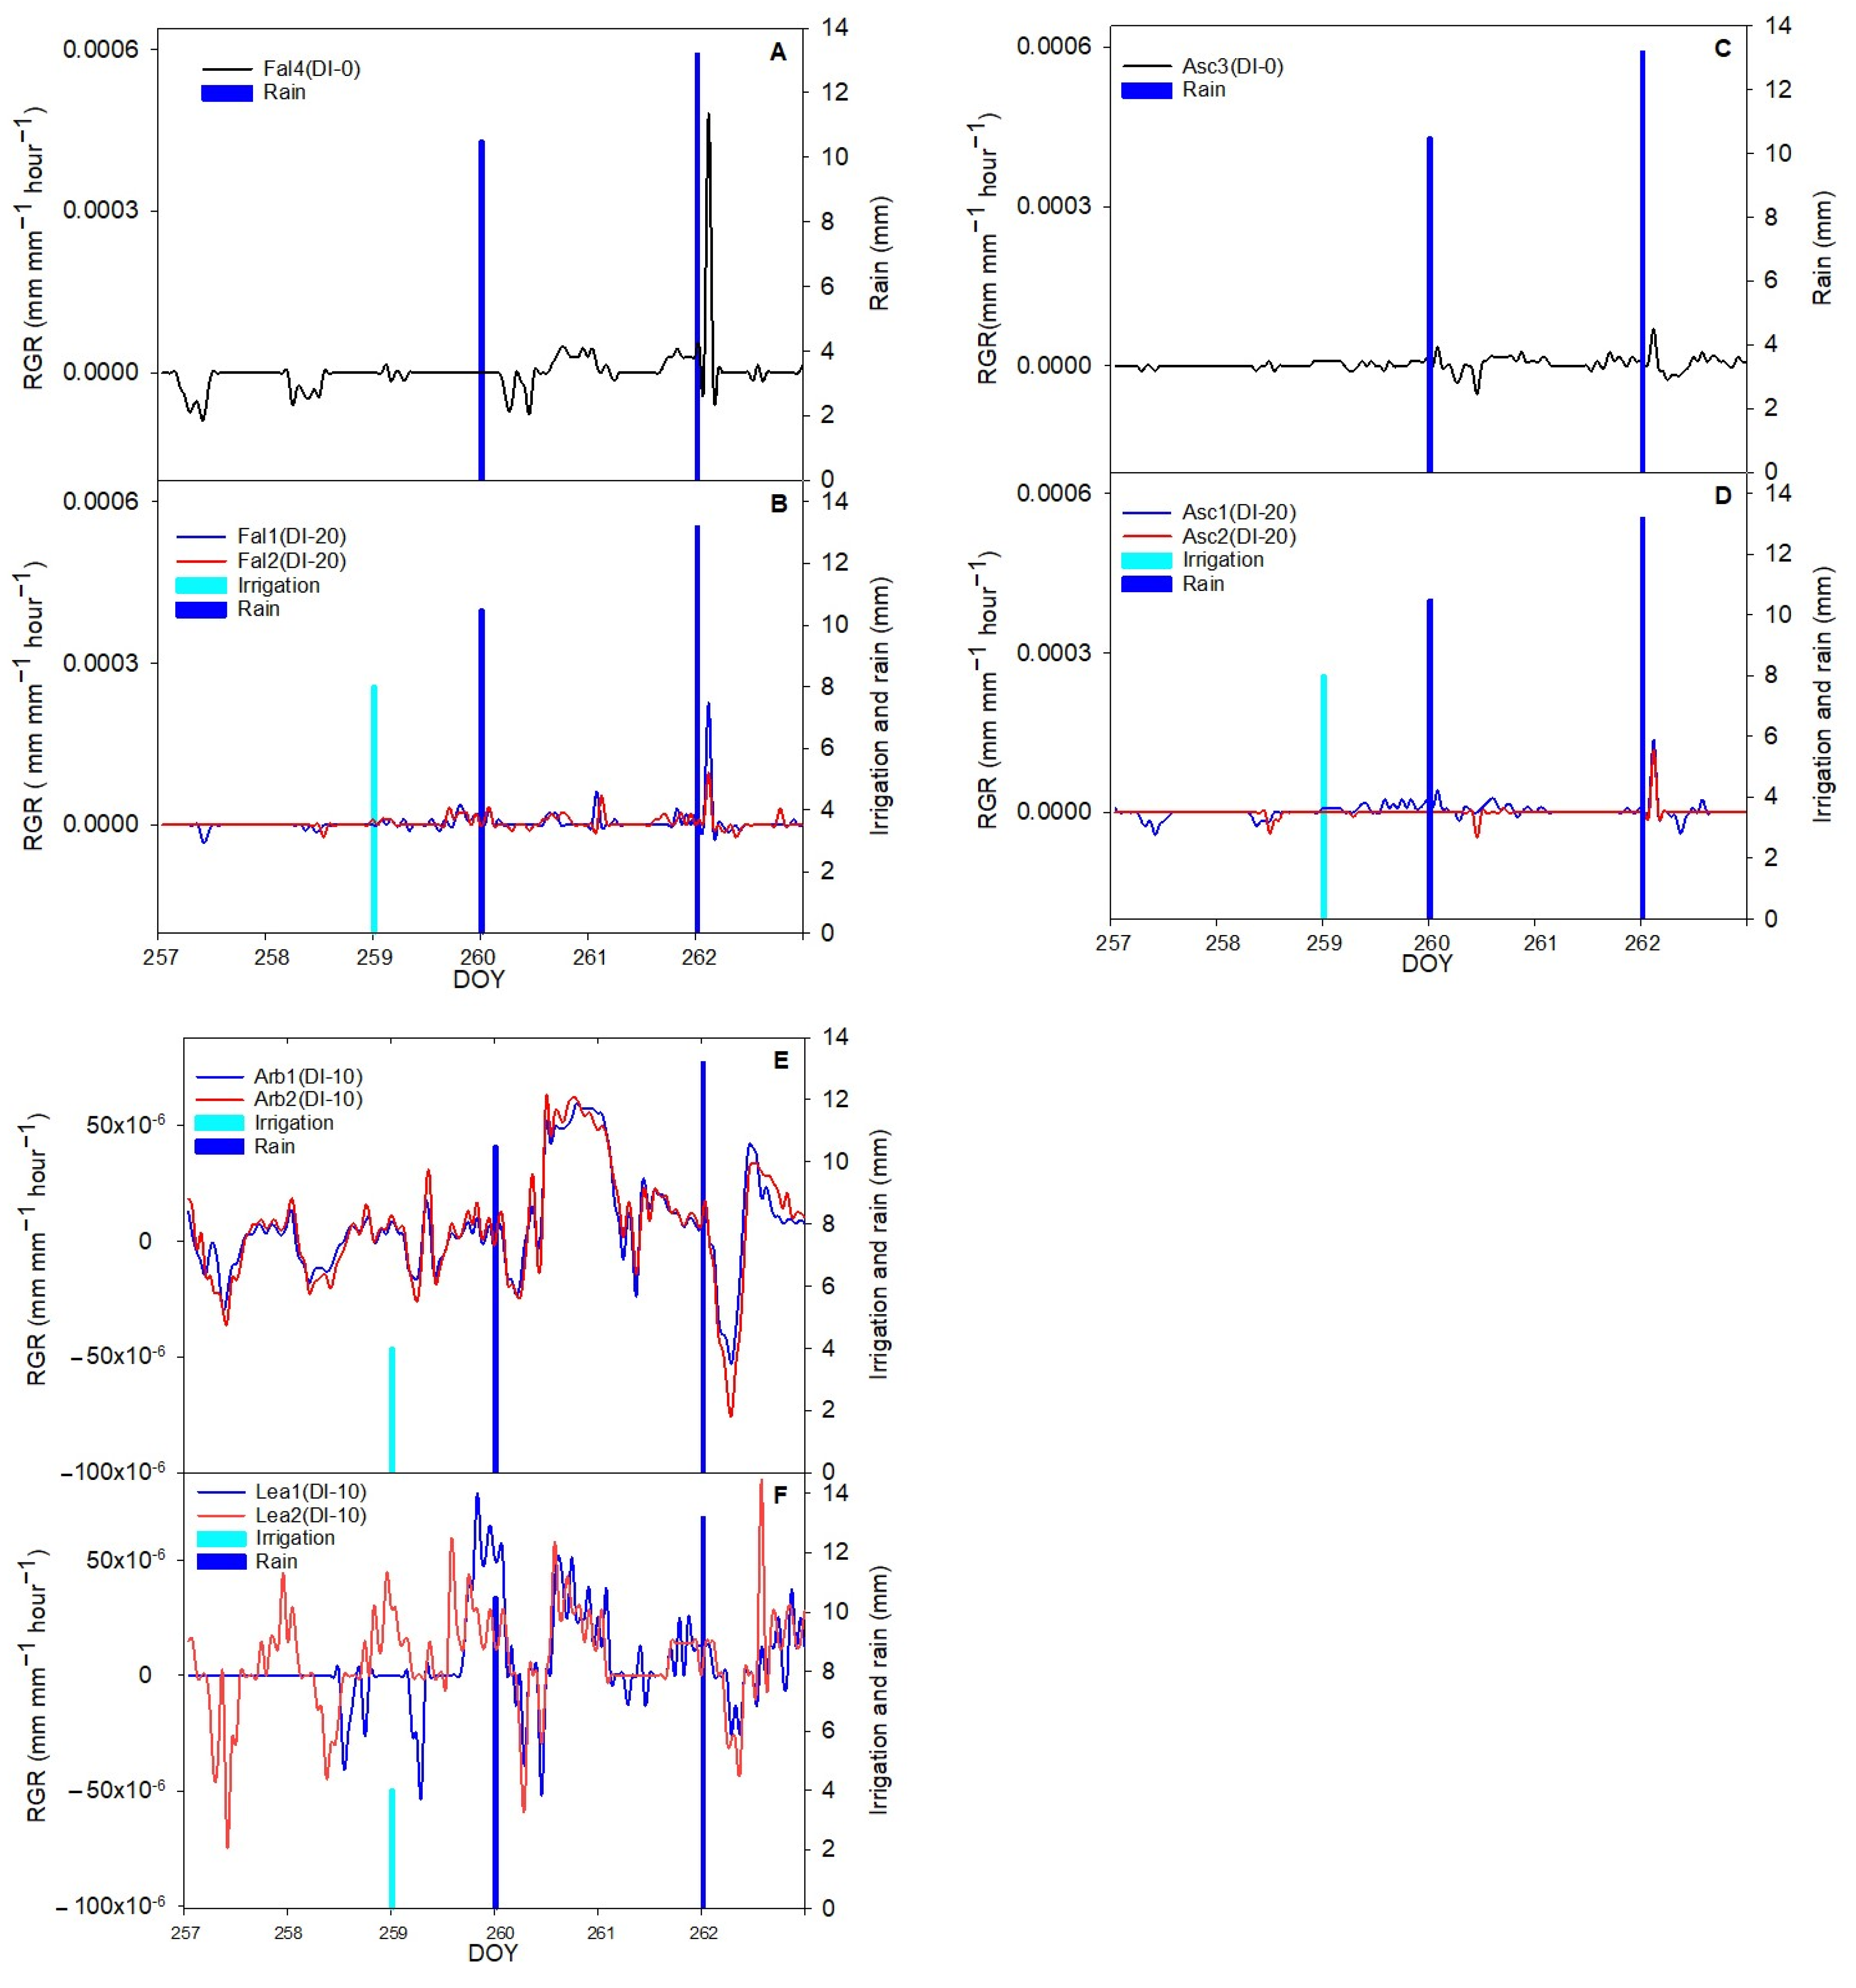
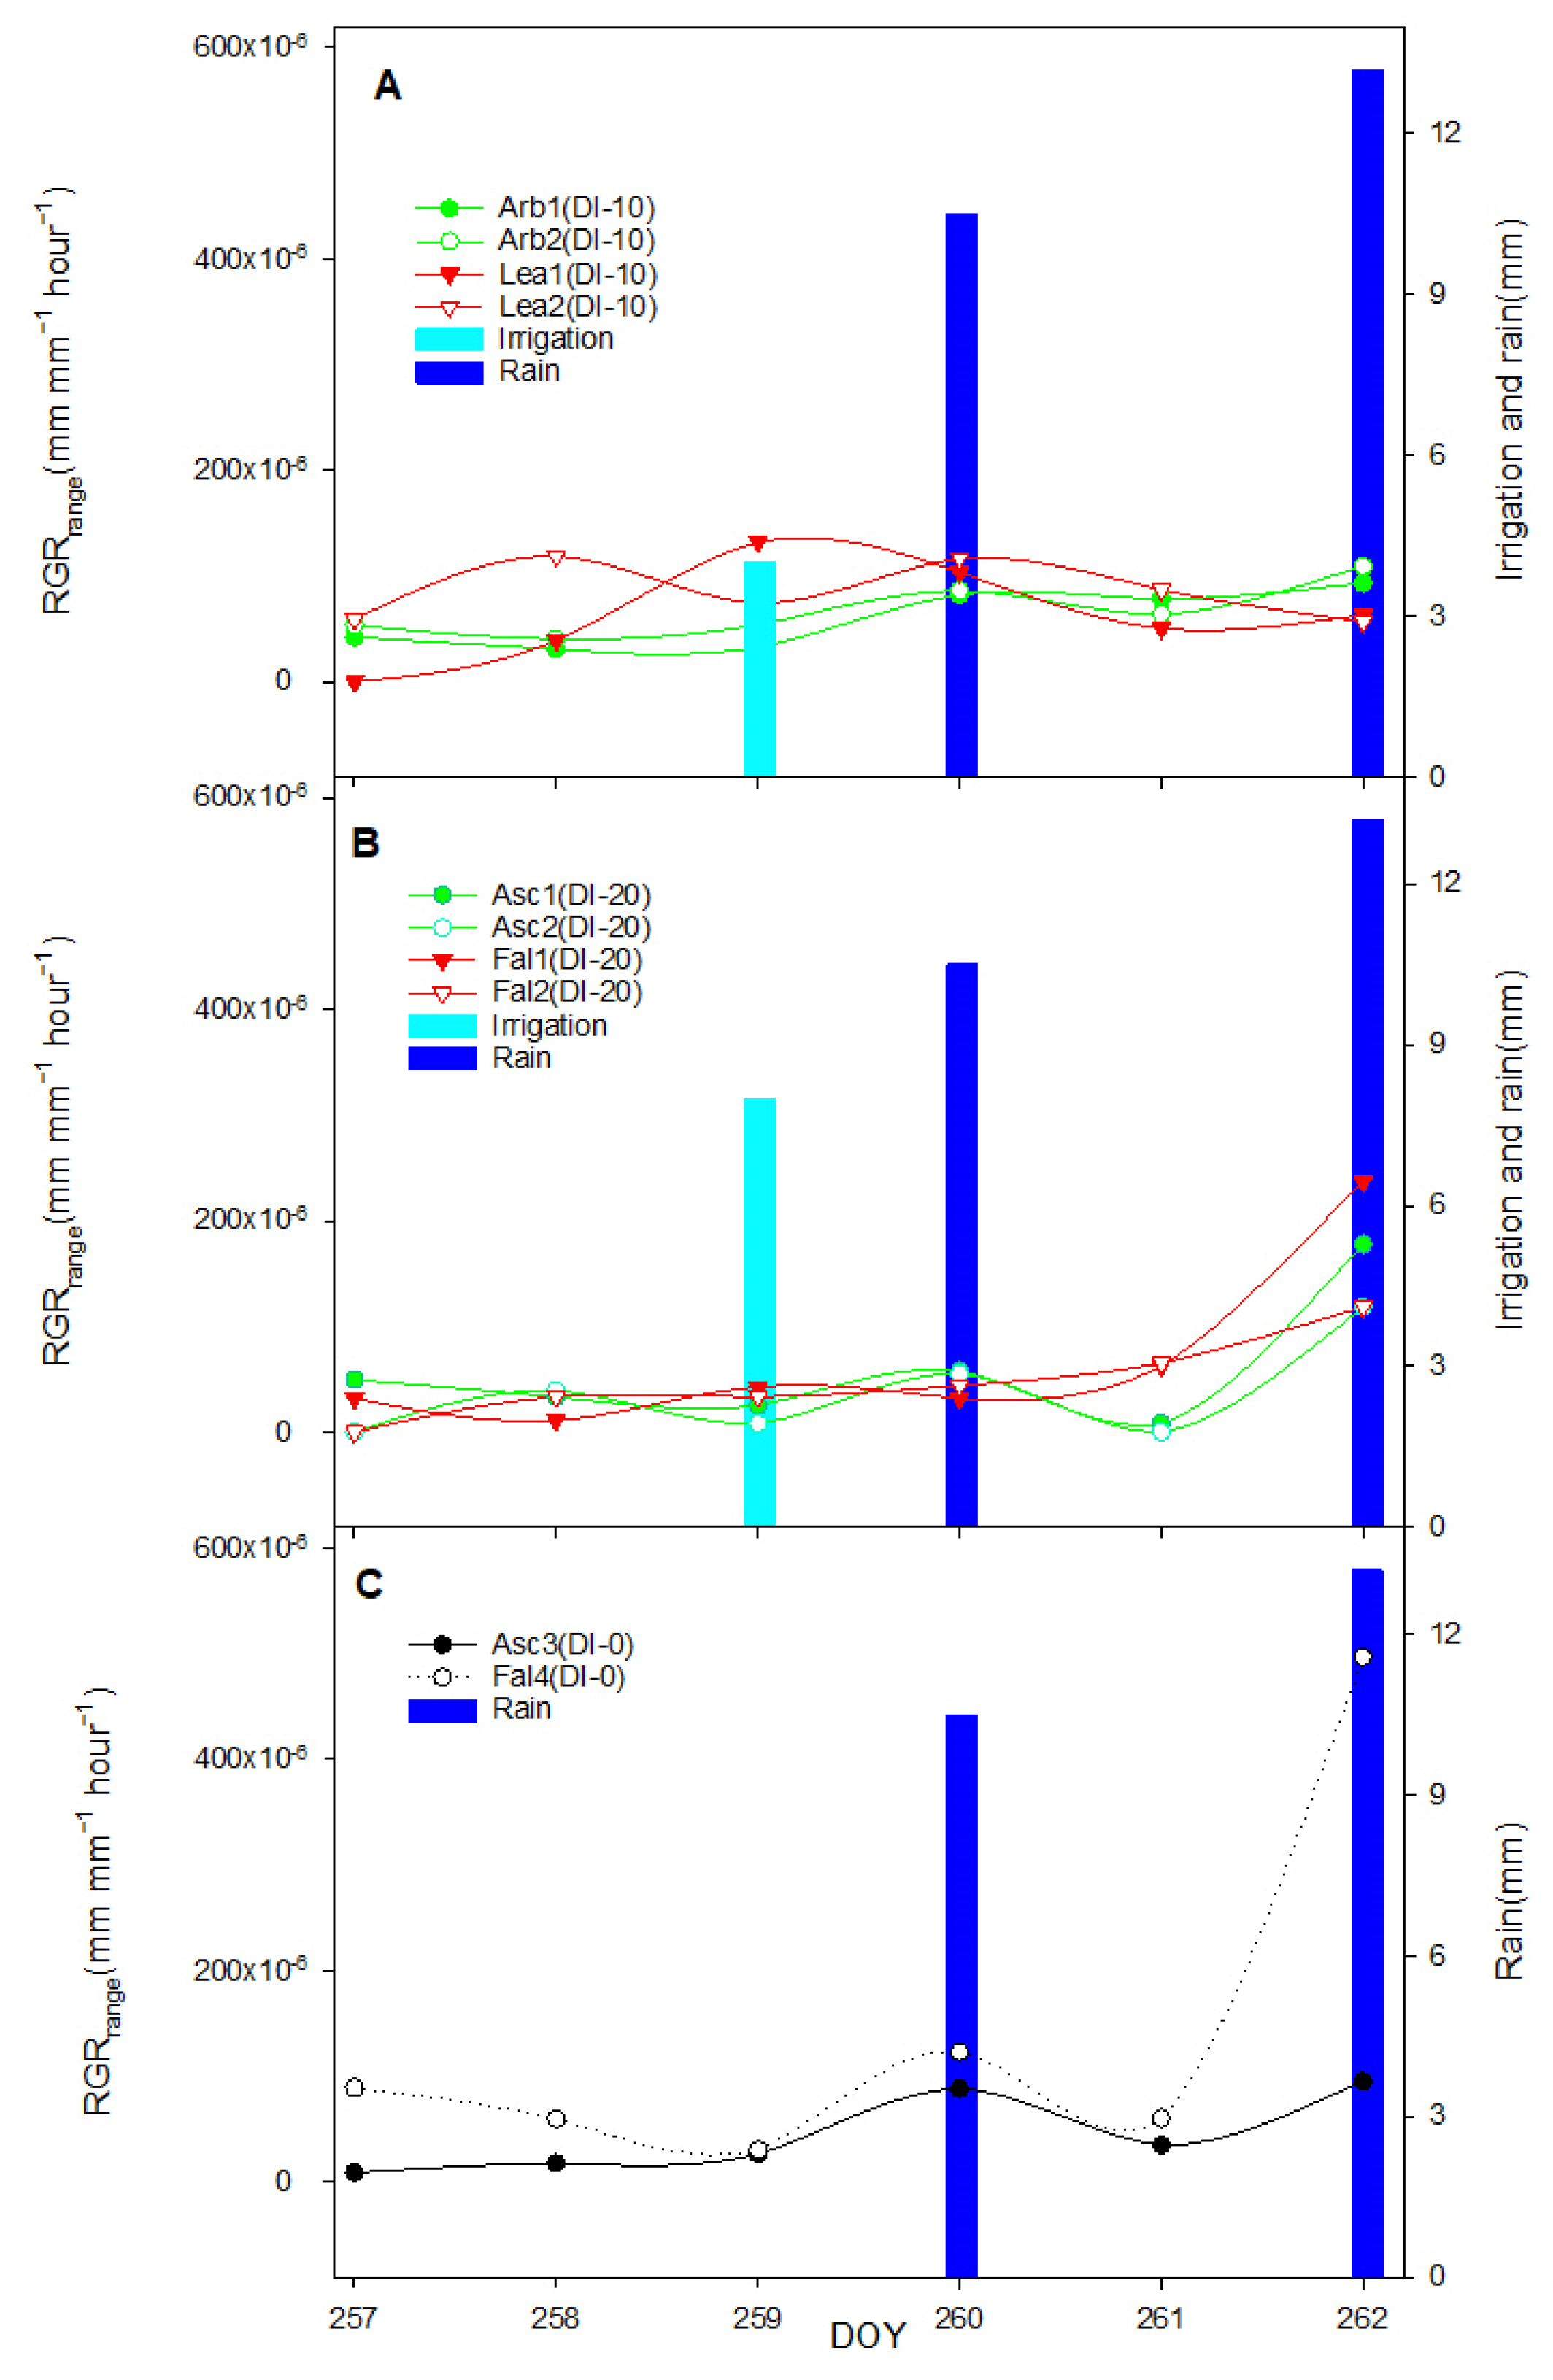
3.3. Irrigation Response

Monitoring the daily variation of fruit diameter at 6 days’ window (from DOY 227 to 234) in correspondence with first and second irrigation days showed that diameter of Arb1 (DI-10) downsized from 9.91 mm to 9.81 mm, whereas for Arb2 (DI-10) downsized from 8.76 mm to 8.65 mm, but for Lea1 (DI-10) started from 10.7 mm and increased to 11.1 mm. At the same period, diameter of Asc2 (DI-20) started from 20.4 mm up to 20.9 mm, Fal1 (DI-20) started from 13.7 mm up to 14.4 mm, and Fal2 (DI-20) started from 13.0 mm and reached 13.8 mm, whereas transversal diameter of Asc3 (DI-0) and Fal3 (DI-0) started from 15.6 mm and 15.4 mm up to 15.7 mm and 15.4 mm, respectively (Figure S2A–D). It showed diameter increase for both cultivar with and without irrigation treatment, nevertheless, standardized diameter (Table 2) showed different ratio of diameter growth. For irrigated Ascolana dura and Piantone di Falerone, the ratio of diameter growth was higher than non-irrigated treatment.
In correspondence with the third irrigation day (from DOY 257 to 262), diameter of Arb1 (DI-10) started at 10.2 mm reached 10.8 mm, and for Arb2 (DI-10) started from 9.0 mm up to 9.6 mm. Diameter of Lea1 (DI-10) started from 12.7 mm and reached to 13.3 mm, and for Lea2 (DI-10) started from 11.3 mm up to 11.7 mm. About Asc1 (DI-20) diameter started from 20.3 mm and reached 20.7 mm and for Asc2 (DI-20) started from 21.3 mm and remained the same size. About Fal1 (DI-20), diameter started from 15.7 mm and reached 16.3, and Fal2 (DI-20) started from 15.0 mm and reached 15.5 mm. In the non-irrigated fruits, the diameter of Asc3 and Fal4 started from 18.77 mm and 11.4 mm up to 19.3 mm and 11.6 mm, respectively (Figure S2E–H). Data showed diameter increase for all the four cultivars with different irrigation levels and for two cultivars (Ascolana dura and Piantone di Falerone) without irrigation treatment. Data of standardized diameter explained that diameter growth ratio in irrigated Ascolana dura was lower than non-irrigated and for irrigated Piantone di Falerone was higher than non-irrigated (Table 2).
The daily growth (ΔG) (Table 3) provided more information related to diameter change in correspondence with irrigation days. On the first irrigation day (DOY 229), for both cultivars with DI-20, not only ΔG was positive, but it was higher than ΔG of the previous day. At the same time, ΔG for non-irrigated fruits did not show any growth in comparison with the previous day. In fact, ΔG of Ascolana dura (DI-0) was positive and the same as the previous day and for Piantone di Falerone (DI-0) was negative and lower than previous day. About cultivars with DI-10, ΔG was higher than the previous day but for Lea it was positive and for Arbequina it was negative. In all four irrigated cultivars (with DI-10 or DI-20), in the day after irrigation ΔG increased in comparison with the day before. The trend of ΔG in the non-irrigated fruits at the day after Irrigation for Ascolana dura was downward, and for Piantone di Falerone did not show any changes.
On the second irrigation day (DOY 231), ΔG for both cultivars with DI-20 was positive, however, it was lower than ΔG of the previous day. Concurrently, ΔG of non-irrigated fruits was higher than the previous day. Although, ΔG of Ascolana dura (DI-0) was negative and for Piantone di Falerone (DI-0) was zero. About cultivars with DI-10, for Arbequina ΔG was greater than the previous day and with a negative amount and for Lea it was lower than the previous day with a positive amount. In both irrigated cultivars with DI-20, in the day after irrigation, ΔG decreased in comparison with the day before, whereas ΔG of non-irrigated fruits for both cultivars increased. About cultivars with DI-10, in the day after irrigation, for Arbequina ΔG increased and for Lea ΔG decreased in comparison with the previous day.
On the third irrigation day (DOY 259), ΔG for both cultivars of Ascolana dura and Piantone di Falerone (irrigated (DI-20) and non-irrigated (DI-0)) was higher than the previous day. About cultivars with DI-10, ΔG of Arbequina was lower than the previous day but for Lea was higher. On the day after irrigation, ΔG for both cultivars with DI-20 was lower than the irrigation day, whereas ΔG of non-irrigated (DI-0) cultivars was higher than the irrigation day. About cultivars with DI-10, in the day after irrigation, for Arbequina ΔG reduced and for Lea ΔG enlarged in comparison with the previous day (Table 3).
The daily diameter fluctuation (ΔD) in the first irrigation day was reduced in both cultivars with DI-20 and reduction continued until the day after irrigation, whereas in both cultivars with DI-10, ΔD increased and the day after decreased. In the second irrigation day, ΔD in both cultivars with DI-20 was almost the same as the previous day, and in the day after irrigation, followed by slight increase for cultivar Piantone di Falerone and stability for Ascolana dura. In the second irrigation day, ΔD for cultivar with DI-10 followed the opposite trend, which was a reduction for Arbequina and an increase for Lea; however, in the day after irrigation ΔD for both DI-10 cultivars increased. In the third irrigation day, ΔD for Piantone di Falerone DI-20 increased and in the day after decreased. For the Ascolana dura DI-20, one fruit showed decreasing of ΔD followed by increasing in the day after, and other fruit showed increasing of ΔD followed by decreasing in the day after. About cultivar with DI-10, ΔD showed a different trend. Indeed, for Arbequina ΔD decreased and in the day after irrigation increased, but for Lea ΔD increased and in the day after irrigation one fruit showed ΔD reduction and other one showed ΔD increase (Figure S3A–D).
The cumulative fruit growth (CFG), for all irrigated cultivars (DI-20 and DI-10), in correspondence with the first irrigation day increased and the upward trend has continued in the day after irrigation (Figure 3A,B). In non-irrigated cultivars, a small growth of CFG was observed which was followed by a reduction in the day after irrigation (Figure 3B). In the second irrigation day, CFG for all irrigated cultivars (DI-20 and DI-10) decreased, the downward trend continued in the day after irrigation but with a slight slope (Figure 3A,B). In the same time, CFG of DI-0 treatments decreased but in the day after irrigation it increased (Figure 3B). On the third irrigation day, CFG for all irrigated(DI-20 and DI-10) and non-irrigated cultivars increased (Figure 3C,D). The only exception was one fruit of Ascolana dura (Asc2 (DI-20)) which CFG decreased (Figure 3D). On the day after irrigation, CFG of both cultivars with DI-20 was the same as irrigation day and did not show any change (Figure 3D), nevertheless CFG of both cultivars with DI-10 increased (Figure 3C). CFG for Ascolana dura (DI-0) was the same as the previous day and did not change, whereas, CFG of Piantone di Falerone (DI-0) increased (Figure 3D).
After the first and second irrigation day, daily fruit relative growth rate (RGR) changed significantly (Figure 4B–F). After the first irrigation day the minimum amount of RGR was near zero and then decreased continuously (dashed orange line). The minimum of RGR downsized with dissimilar slopes in different irrigation levels. Moreover, the trend of minimum RGR reduction in different cultivars with the same irrigation level was diverse too. The maximum amount of RGR for both cultivars with DI-20 increased slightly (dashed black line in Figure 4B,D), whereas cultivars with DI-10 did not show any consistent decreasing or increasing of maximum RGR (Figure 4E,F). At the same time, minimum RGR of Piantone di Falerone (DI-0) and Ascolana dura (DI-0) showed consistent decrease (dashed orange line in Figure 4A,C). The maximum RGR for Piantone di Falerone (DI-0) did not show any specific patterns, however, for Ascolana dura (DI-0) was stable (dashed black line in Figure 4C).
After irrigation withholding, RGRrange amount of two cultivars (Ascolana dura and Piantone di Falerone) with DI-20 irrigation treatment increased (Figure 5B). The RGRrange enlargement has been reported by other research as a water stress signal in olive [14,15,26]. However, there is no defined threshold for RGRrange as a water stress index. The trend of RGRrange in the cultivars with DI-10 irrigation treatment was not same as each other. Indeed, the trend for cultivar Lea was more similar to DI-20 irrigation treated cultivars (Figure 5A), whereas, the trend of Arbequina up to the day after first irrigation treatment was close to Lea and then after followed dissimilar trend (Figure 5A). The trend of Asc3 (DI-0) was mismatched with Fal3 (DI-0), besides, both of them (DI-0s) showed diverse pattern in comparison with related irrigated cultivar (Figure 5C).
After third irrigation treatment, fruit RGR dynamics did not show similarity to first and second irrigation treatment (Figure 6A–F). Moreover, the pattern of the fruit with the same cultivar-irrigation level was diverse too. For instance, minimum RGR of Piantone di Falerone (DI-20) for one fruit (Fal1) was stable and almost zero, but for other fruit (Fal2) followed oscillation and was negative, whereas maximum RGR for both Piantone di Falerone (DI-20) had same trend but without any progressive decrease or increase (Figure 6B). Maximum RGR for Ascolana dura (DI-20) in one fruit (Asc1) showed consistent reduction but for the other one was almost stable and near zero (Figure 6D).
After irrigation withholding up to first rainy day (DOY 260), RGRrange amount of Ascolana dura with DI-20 irrigation treatment increased (Figure 7B), whereas, in the Piantone di Falerone with DI-20 irrigation treatment, RGRrange amount in the one fruit increased and in other one decreased (Figure 7B). In addition, on the day after first rain the RGRrange amount of Ascolana dura with DI-20 irrigation treatment decreased and for Piantone di Falerone increased (Figure 7B). Finally, the increase of RGRrange in Ascolana dura and Piantone di Falerone (Figure 7B) in 2 rainy days (DOYs 260 and 262) was in contrast with our expectation. Nevertheless, it resulted from the time of rainfall. Data showed that rainfall in DOY 260 and 262 started at 16:00 and 15:00, respectively. Consequently, the fruit experienced water stress before rain fall, and RGRrange increased. RGRrange of Asc3 (DI-0) and Fal4 (DI-0) in correspondence with two rainy days showed the same results of DI-20 treated and confirmed the effect of time of rainfall happening (Figure 7C).
The RGRrange in the cultivars with DI-10 irrigation treatment did not show similarity to each other (Figure 7A). On the irrigation day, the RGRrange of Arbequina increased but for Lea in Lea1 increased and in Lea2 decreased (Figure 7A). From irrigation day up to the end of 6 days window (DOY 262), the RGRrange trend of Arbequina (DI-10) was similar to Ascolana dura (DI-20) (including pattern in 2 rainy days (DOYs 260 and 262)). Whereas, Lea showed dissimilar trend in comparison with Arbequina. In addition, RGRrange trend of Lea1 and Lea2 was diverse too (Figure 7A).

3.4. Hysteresis Curves of Fruit Growth versus VPD

The hysteresis phenomenon is an indirect response of vegetation to diurnal changes in the external environment and the time lag is a major characteristic of hysteresis [54]. In our case hysteresis is formed by the time lag between VPD and fruit growth. To better capture the time lag between daily diameter and VPD, the normalized data of diameter and VPD have been used. The blue box showed a time lag between some example fruits diameter and VPD (Figure 8).
In most periods of experiment, the daily growth of fruit transversal diameter versus VPD formed clockwise curves. The mentioned curves, according to their shape, were explainable as complete hysteresis (Figure 9A), incomplete hysteresis (Figure 9B), or partial hysteresis (Figure 9C). Although, different kinds of hysteresis curves have appeared by dissimilar frequency, shape, and magnitude in each cultivar-irrigation level (Table 4).
The trend of hysteresis curves in correspondence with irrigation days has been shown in Table 5. In the first and second irrigation day, in all irrigated cultivars (with DI-10 and DI-20), a partial clockwise hysteresis curve has appeared. Nevertheless, on the third irrigation day, it did not form any hysteresis pattern.
In the past decade, several researchers have developed indices to quantify the shape, size, and direction of hysteresis curves [55]. In all indices or metrics, three main characteristics of hysteresis relation which are shape, direction, and the extent of loop should be considered [55]. About hysteresis direction, according to our results all hysteresis curves were clockwise. In addition, all shapes of hysteresis were circular (i.e., eight-shaped or linear form has not been formed). Therefore, for detecting extent change, the loop’s height was employed (blue, red, and green dotted lines in Figure 10). Loop’s height was calculated as the maximum normalized diameter minus the minimum normalized diameter inside the loop. In addition, according to the employment of normalized diameter for calculation of loop’s height, it is a normalized unitless parameter.
In the first and second irrigation days, for the cultivar of Ascolana dura deficit irrigation treatment reduced height of hysteresis curve (red dotted line in Figure 10A,B) in comparison with non-irrigated treatment (blue dotted line in Figure 10A,B). In the same time, Piantone di Falerone (deficit irrigated) experienced the same magnitude change as Ascolana dura (Figure 10C,D).
The hysteresis height was tested by the repeated measures ANOVA test and the test revealed significant differences (p = 0.005 for Piantone di Falerone and p = 0.019 for Ascolana dura) among irrigated cultivars with their non-irrigated (Table 6). Indeed, multiple comparison tests of Student–Newman–Keuls showed significant differences between Fal1 (DI-20) and Fal3 (DI-0), Fal2 (DI-20), and Fal3 (DI-0) as well as Asc2 (DI-20) and Asc3 (DI-0).
On the third irrigation day, the hysteresis curve did not appear (Table 5). As VPD were the input of hysteresis curve, appearance and characteristic of the hysteresis curve were affected by VPD, so disappearance of hysteresis curve can be related to different circadian cycles (daily pattern) of VPD. In the normal circadian cycle, VPD tended to peak in the early afternoon, but on the third irrigation day from 11 AM up to 1 PM the VPD decreased. Mentioned reduction of VPD suppressed formation of hysteresis curves. Fruit development is also a significant parameter which influences daily growth patterns and therefore the formation and characteristic of the hysteresis curve [27]. Recent research explained disappearance of hysteresis curve in “Frantoio” olive cultivar during fruit maturation, and finding by Scalisi et al. [22] suggested hysteresis magnitude changes or disappearance of it in nectarine during different stages of fruit development. However, Table 1 did not show any fruit maturation during our experiment.

4. Discussion

The daily olive fruit growth patterns were detected through the continuous monitoring of FD. The FD increased with diurnal variations as it was observed in peach (Prunus persica (L.) Batsch) [56], sweet cherry (Prunus avium L.) [34,36], apple (Malus domestica cv. Imperial Gala) [23], kiwi (Actinidia deliciosa cv. Summerkiwi 4605) [57], and olive (Olea europaea L.) [26,27]. Indeed, during the hottest hours (mid-morning to early afternoon) due to low xylem flow (low water potential) or/and xylem backflow and maximum transpiration rate, fruit faces with size reduction and shrinks, while from the late afternoon to early morning, xylem water potential restored and fruit gradually expands and usually reaches size larger than the initial point of same day [37,38].
On the other hand, there are some exceptional days with different growth patterns (Figure S1B). Khosravi et al. [27] already showed that for olive (Olea europaea (L.) cv “Frantoio” there were some days with different daily growth patterns related to the change in the daily VPD pattern.

4.1. Response of Fruit Growth to Deficit Irrigation and Rain

During the third phase of olive fruit development, the growth would be mainly driven by cell expansion with cell division processes becoming much less important [58]. Therefore, the third phase of olive fruit development (fruit expansion) requires an adequate flow of water to the fruit and sufficient turgor to drive in cell enlargement [6]. Our results in first and second irrigation days (DOYs 229 and 231) were in line with what we would expect from increasing flow of water. Indeed, ΔG and CFG increased, but with dissimilar slope and amount in diverse cultivars (Table 3 and Figure 3A,B). With first and second irrigation days (DOYs 229 and 231), Ascolana dura and Piantone di Falerone, which are categorized as a table olive and treated with same irrigation regimes (DI-20), had the same CFG trend (Figure 3B), while Arbequina and Lea, which are categorized as oil varieties and treated with same irrigation regimes (DI-10), had the different CFG trend (Figure 3A). Dissimilarity in CFG trend is resulted by different irrigation treatments (DI-10 and DI-20), crop load, genetic factors, and phenology [14]. In the 6 days in correspondence with first and second irrigation days, data of the standardized diameter (Table 2) showed that the ratio of diameter increase for both cultivars with DI-20 irrigation treatment is higher than non-irrigated, which confirmed the positive effect of irrigation.
On the other hand, the decreasing minimum of RGR after the first and second irrigation event (orange dashed line in Figure 4B,D–F) confirmed the positive effect of water flow too. Minimum RGR in different cultivars downsized with various slopes which suggested a very different response of cultivars to dehydration. Similar results were previously explained for two Sicilian olive cultivars of Nocellara del Belice and Olivo di Mandanici [15]. On the contrary, minimum RGR for Ascolana dura (DI-0) and Piantone di Falerone (DI-0) increased (orange dashed line in Figure 4A,C). It could be hypothesized that with positive changes in the environmental condition (here was significant reduction of daily average of VPD from 3 (kPa) in DOY 228 to 1.14, 1.17, 1.34, 1.44 and 1.38 (kPa) in the days after, respectively), the minimum RGR increased.
In the 6 days in correspondence with the third irrigation day (DOY 259), flow of water to the fruit has been affected not only by irrigation, but also by rain. Therefore, diameter of both DI-20 irrigated and non-irrigated treatments increased, but with dissimilar ratios (Table 2), the only exception was Asc2 (DI-20) which did not show any changes in diameter. In addition, the CFG amount in both DI-20 irrigated and non-irrigated treatments increased too, the only exception was Asc2 (DI-20) which did not show any changes in irrigation day (Figure 3C,D). However, the effect of rain on CFG was not the same in different cultivars. For instance, in the first rainy day (DOY 260), CFG for Asc2 (DI-20), Asc3 (DI-0), and Fal4 (DI-0) increased, for Fal2 (DI-20) decreased, and for Asc1 (DI-20) and Fal1 (DI-20) was constant. This dissimilarity of the CFG trend between cultivars and among different fruits of the same cultivar was detectable also in the second rainy day (DOY 262). The dissimilarity of CFG trend between cultivars could be resulted by crop load, genetic factors and phenology [14], and different cultivar specific drought resistance mechanisms and still unrevealed role that fruits have as water storage compartments in drought resistance mechanisms of olive [15].
Although, in the same time, RGR graphs show some similarity between cultivars of Ascolana dura and Piantone di Falerone, including pronounced maximum amount after second rainy day for both irrigated and non-irrigated treatments (Figure 6A–D), or sudden decreasing of minimum RGR for cultivars of Arbequina and Lea after the second rainy day; but RGR pattern did not show any sameness to the trend of first and second irrigation events (Figure 6A–F).
At the same time, RGRrange showed diverse patterns in different cultivars. Moreover, in some cases the pattern was different among fruits of the same cultivar (Figure 7A–C).
Overall, due to different responses of diverse cultivars to deficit irrigation, the use of common fruit development indices (i.e., RGRrange) as an indicator of water status should be cultivar-specific. Indeed, cultivar-specific thresholds should be adopted. In addition, fruit growth is affected by parameters such as fluctuation in environmental conditions, phenological stage, and crop load [15,59], therefore, the effects should be considered in threshold definition.

4.2. Hysteresis Curves Variations

VPD (input) and FD (output) time series (blue box in the Figure 8) formed FD-VPD loops, which are examples of hysteresis curves (Figure 9). The magnitude and characterization of hysteresis curves differed from day to day. Magnitude change of hysteresis curves was reported by other researchers as well [22,27,40].
Interestingly, in our research, magnitude change of hysteresis curves versus VPD is not cultivar-specific (Figure 10), accordingly, acquired indices are not cultivar-specific. Zhang et al. [40] suggested that the relation between the hysteresis magnitude and plant water potential provides a possible way to detect plant water stress. However, other factors are also involved since it has been shown that formation of hysteresis curves resulted from complex interactions between exogenous and endogenous factors [40]. Moreover, according to research by Zuecco et al. [55], hysteresis can be thought of as the dependence of a response variable not only on the value of a driving variable but also on its past history. Here, height reduction of hysteresis curves (magnitude change) by irrigation treatment (reduction of water stress) (Figure 10), could be employed as an index for estimation of water status of plants.
With normal circadian pattern of VPD, the hysteresis height’s change is influenced by fruit diameter change (daily fruit growth dynamics). In the third stage of the fruit development (cell expansion stage) the daily fruit growth dynamics can be explained as changes in flows of water into and out of the fruit, rather than carbon gains; thus, fruit diameter variation responds to water deficit [15,23,25,26,27,32]. Consequently, hysteresis magnitude change is closely related to water status of fruit. Indeed, in the day with normal circadian pattern of VPD, with increasing water flow into the fruit (by irrigation), the hysteresis height’s decreases. Therefore, increasing hysteresis height’s is the sign of reduction of water flow into fruit and could be used for water stress detection (Figure 10A–D and Figure S4).
Overall, results highlight the magnitude change of hysteresis curves (height of loop) as a non-cultivar-specific quantitative index in two cultivars of Ascolana dura and Piantone di Falerone which can be taken in order to estimate the water status. However, development of quantitative assessment of hysteresis curves using an index approach is vital in this regard.

5. Conclusions

The paper presents some physiological basis to better monitor deficit irrigation in olive in different varieties. In the four olive cultivars (Ascolana dura, Piantone di Falerone, Arbequina and Lea), fruit growth parameters including CFG and RGR showed different response to irrigation treatment which resulted by cultivar specific drought response mechanisms and suggest cultivar-specific water stress detection strategy. Moreover, during the third phase of olive fruit development, the hysteresis pattern between FD and VPD were explained and for the first time the quantitative differences of hysteresis curves for two deficit irrigated cultivars of Ascolana dura and Piantone di Falerone were demonstrated and discussed. In addition, the height of the hysteresis curve was significantly affected by irrigation. In general, height of hysteresis curves is reduced by deficit irrigation treatment for all four olive cultivars. Hysteresis magnitude’s change resulted in a non-cultivar-specific parameter that could enable it to monitor plant water status and perform better tuned irrigation treatment in olive orchards. However, further studies should be performed to develop this continuous fruit-based parameter. In particular, various percentage of deficit irrigation treatments on different cultivars and in the diverse environmental conditions should be examined to enhance non-cultivar-specific index derived from hysteresis magnitude’s change. Moreover, fruit growth-related factors (i.e., crop load, previously experienced stress, and phenological stage) should be considered to establish an efficient index [15]. These results can be useful for setting up more robust and precise indicators to detect water stress in olive orchards and improve precision irrigation methods.

Supplementary Materials

The following supporting information can be downloaded at: https://www.mdpi.com/article/10.3390/horticulturae8121221/s1, Table S1. Data for starting and finishing time of shrinkage and expansion for different cultivar-irrigation levels in 3 consecutive example days (from 228 to 230 day of the years (DOY)). The ending time of Expansion is on the next day. Arb(DI-10) represents average data of two fruits of ‘Arbequina’ at 10% deficit irrigation. Lea(DI-10) represents average data of two fruits of ‘Lea’ at 10% deficit irrigation. Asc(DI-20) represents average data of two fruits of ‘Ascolana dura’ at 20% deficit irrigation. Asc(DI-0) represents data of one non-irrigated fruit of ‘Ascolana dura’. Fal(DI-20) represents average data of two fruits of ‘Piantone di Falerone’ at 20% deficit irrigation. Fal(DI-0) represents data of one non-irrigated fruit of ‘Piantone di Falerone’; Figure S1. Continuous measurements of diameter of olive fruit in two example days of the experiment: (A) fruits with normal growth pattern in day of the year (DOY) 225; (B) fruit with exceptional growth pattern during rainy day (rainfall at beginning hours of the day) in day of the year (DOY) 236, in addition, it was the day after heavy rainfall. Arb1(DI-10) and Arb2(DI-10) represent fruit 1 and 2 of ‘Arbequina’ at 10% deficit irrigation, respectively. Lea1(DI-10) represents fruit 1 of ‘Lea’ at 10% deficit irrigation. Asc2(DI-20) represents fruit 2 of ‘Ascolana dura’ at 20% deficit irrigation. Asc3(DI-0) represents fruit 3 of non-irrigated ‘Ascolana dura’. Fal1(DI-20) and Fal2(DI-20) represent fruit 1 and 2 of ‘Piantone di Falerone’ at 20% deficit irrigation, respectively. Fal3(DI-0) represents fruit 3 of non-irrigated ‘Piantone di Falerone’; Figure S2. Daily variation of fruit diameter from 227 to 234 day of the year (DOY) and from 257 to 262 day of the year (DOY). (A) cultivar of Arbequina in the first and the second irrigation days; (B) cultivar of Lea in the first and the second irrigation days; (C) cultivar of Ascolana dura in the first and the second irrigation days; (D) cultivar of Piantone di Falerone in the first and the second irrigation days; (E) cultivar of Arbequina in the third irrigation day; (F) cultivar of Lea in the third irrigation day; (G) cultivar of Ascolana dura in the third irrigation day; (H) cultivar of Piantone di Falerone in the third irrigation day. Arb1(DI-10) and Arb2(DI-10) represent fruit 1 and 2 of ‘Arbequina’ at 10% deficit irrigation, respectively. Lea1(DI-10) and Lea2(DI-10) represent fruit 1 and 2 of ‘Lea’ at 10% deficit irrigation, respectively. Asc1(DI-20) and Asc2(DI-20) represent fruit 1 and 2 of ‘Ascolana dura’ at 20% deficit irrigation, respectively. Asc3(DI-0) represents fruit 3 of non-irrigated ‘Ascolana dura’. Fal1(DI-20) and Fal2(DI-20) represent fruit 1 and 2 of ‘Piantone di Falerone’ at 20% deficit irrigation, respectively. Fal3(DI-0) and Fal4(DI-0) represent fruit 3 and 4 of non-irrigated ‘Piantone di Falerone’, respectively; Figure S3. Standardized Fruit daily diameter fluctuation (ΔD). From 227 to 234 day of the year (DOY) (in correspondence with first and second irrigation days) for the olive cultivar Arbequina and Lea (A) and for the olive cultivars Ascolana dura and Piantone di Falerone (B); From 257 to 262 day of the year (DOY) (in correspondence with third irrigation day) for the olive cultivar Arbequina and Lea (C) and for the olive cultivars Ascolana dura and Piantone di Falerone (D). Arb1(DI-10) and Arb2(DI-10) represent fruit 1 and 2 of ‘Arbequina’ at 10% deficit irrigation, respectively. Lea1(DI-10) and Lea2(DI-10) represent fruit 1 and 2 of ‘Lea’ at 10% deficit irrigation, respectively. Asc1(DI-20) and Asc2(DI-20) represent fruit 1 and 2 of ‘Ascolana dura’ at 20% deficit irrigation, respectively. Asc3(DI-0) represents fruit 3 of non-irrigated ‘Ascolana dura’. Fal1(DI-20) and Fal2(DI-20) represent fruit 1 and 2 of ‘Piantone di Falerone’ at 20% deficit irrigation, respectively. Fal3(DI-0) and Fal4(DI-0) represent fruit 3 and 4 of non-irrigated ‘Piantone di Falerone’, respectively; Figure S4. Height of hysteresis curves from 227 to 234 day of the year (DOY) (in correspondence with first and second irrigation days). (A) fruit 1 and 2 of ‘Arbequina’ at 10% deficit irrigation (Arb1(DI-10) and Arb2(DI-10), respectively) and fruit 1 of ‘Lea’ at 10% deficit irrigation (Lea1(DI-10)); (B) fruit 1 and 2 of ‘Piantone di Falerone’ at 20% deficit irrigation (Fal1(DI-20) and Fal2(DI-20), respectively) and fruit 2 of ‘Ascolana dura’ at 20% deficit irrigation (Asc2(DI-20)); (C) fruit 3 of non-irrigated ‘Ascolana dura’ (Asc3(DI-0)) and fruit 3 of non-irrigated ‘Piantone di Falerone’ (Fal3(DI-0)).

Author Contributions

Conceptualization, D.N., A.K. and M.Z.; methodology, A.K. and M.Z.; software, A.M.; investigation, D.N.; data curation, A.M. and A.K.; writing—original draft preparation, A.K.; writing—review and editing, D.N., A.K. and M.Z.; visualization, A.K.; supervision, D.N.; project administration, D.N.; funding acquisition, D.N. and A.M. All authors have read and agreed to the published version of the manuscript.

Funding

This research was funded by the Polytechnic University of Marche through “The network of the Botanical Gardens of Ancona PSA 2017-18” and by POR Marche FSE 2014/2020 Progetto “Dottorato Innovativo”-Borse di studio per dottorato di ricerca per l’innovazione del sistema regionale, Edizione Anno 2020.

Data Availability Statement

All data are available with an email request to the authors.

Acknowledgments

The authors acknowledge PhD program of “Sustainable management of local olive production by using precision farming systems and development of territory” and experimental farm of “P.Rosati” of Marche Polytechnic University.

Conflicts of Interest

The authors declare no conflict of interest.

References

  1. Seifi, E.; Guerin, J.; Kaiser, B.; Sedgley, M. Flowering and fruit set in olive: A review. Iran. J. Plant Physiol. 2015, 5, 1263–1272. [Google Scholar]
  2. Rodrigues, N.; Casal, S.; Peres, A.M.; Baptista, P.; Bento, A.; Martín, H.; Manzanera, M.C.A.S.; Pereira, J.A. Effect of olive trees density on the quality and composition of olive oil from cv. Arbequina. Sci. Hortic. 2018, 238, 222–233. [Google Scholar] [CrossRef] [Green Version]
  3. Fraga, H.; Pinto, J.G.; Viola, F.; Santos, J.A. Climate change projections for olive yields in the Mediterranean Basin. Int. J. Climatol. 2020, 40, 769–781. [Google Scholar] [CrossRef] [Green Version]
  4. Romero-Trigueros, C.; Vivaldi, G.A.; Nicolás, E.N.; Paduano, A.; Salcedo, F.P.; Camposeo, S. Ripening indices, olive yield and oil quality in response to irrigation with saline reclaimed water and deficit strategies. Front. Plant Sci. 2019, 10, 1243. [Google Scholar] [CrossRef] [PubMed]
  5. Fernández, J.E. Plant-based sensing to monitor water stress: Applicability to commercial orchards. Agric. Water Manag. 2014, 142, 99–109. [Google Scholar] [CrossRef] [Green Version]
  6. Ahumada-Orellana, L.E.; Ortega-Farías, S.; Searles, P.S.; Retamales, J.B. Yield and water productivity responses to irrigation cut-off strategies after fruit set using stem water potential thresholds in a super-high density olive orchard. Front. Plant Sci. 2017, 8, 1280. [Google Scholar] [CrossRef] [Green Version]
  7. Romero-Trigueros, C.; Parra, M.; Bayona Gambín, J.M.; Nortes Tortosa, P.; Alarcon Cabañero, J.J.; Nicolás, E. Effect of deficit irrigation and reclaimed water on yield and quality of grapefruits at harvest and postharvest. LWT—Food Sci. Technol. 2017, 85, 405–411. [Google Scholar] [CrossRef] [Green Version]
  8. Lodolini, E.M.; Morini, F.; Polverigiani, S.; Neri, D. Olive fruit and root growth on different irrigation regimes in central Italy. Acta Hortic. 2011, 924, 63–68. [Google Scholar] [CrossRef]
  9. Lodolini, E.M.; Ali, S.; Mutawea, M.; Qutub, M.; Arabasi, T.; Pierini, F.; Neri, D. Complementary irrigation for sustainable production in olive groves in Palestine. Agric. Water Manag. 2014, 134, 104–109. [Google Scholar] [CrossRef]
  10. Lodolini, E.M.; Polverigiani, S.; Ali, S.; Mutawea, M.; Qutub, M.; Pierini, F.; Neri, D. Effect of complementary irrigation on yield components and alternate bearing of a traditional olive orchard in semi-arid conditions. Spanish J. Agric. Res. 2016, 14, e1203. [Google Scholar] [CrossRef] [Green Version]
  11. Goldhamer, D.A. Regulated deficit irrigation for California canning olives. Acta Hortic. 1999, 474, 369–372. [Google Scholar] [CrossRef]
  12. Gómez-del-Campo, M. Summer deficit irrigation in a hedgerow olive orchard cv. Arbequina: Relationship between soil and tree water status, and growth and yield components. Spanish J. Agric. Res. 2013, 11, 547–557. [Google Scholar] [CrossRef] [Green Version]
  13. Rodríguez Sousa, A.A.; Barandica, J.M.; Rescia, A.J. Estimation of soil loss tolerance in olive groves as an indicator of sustainability: The case of the Estepa Region (Andalusia, Spain). Agronomy 2019, 9, 785. [Google Scholar] [CrossRef] [Green Version]
  14. Scalisi, A.; Marino, G.; Marra, F.P.; Caruso, T.; Lo Bianco, R. A Cultivar-Sensitive Approach for the Continuous Monitoring of Olive (Olea europaea L.) Tree Water Status by Fruit and Leaf Sensing. Front. Plant Sci. 2020, 11, 340. [Google Scholar] [CrossRef]
  15. Marino, G.; Scalisi, A.; Guzmán-Delgado, P.; Caruso, T.; Marra, F.P.; Lo Bianco, R. Detecting Mild Water Stress in Olive with Multiple Plant-Based Continuous Sensors. Plants 2021, 10, 131. [Google Scholar] [CrossRef]
  16. Caruso, G.; Palai, G.; Gucci, R.; Priori, S. Remote and Proximal Sensing Techniques for Site-Specific Irrigation Management in the Olive Orchard. Appl. Sci. 2022, 12, 1309. [Google Scholar] [CrossRef]
  17. Caruso, G.; Palai, G.; Gucci, R.; D’Onofrio, C. The effect of regulated deficit irrigation on growth, yield, and berry quality of grapevines (cv. Sangiovese) grafted on rootstocks with different resistance to water deficit. Irrig. Sci. 2022, 40, 1–15. [Google Scholar] [CrossRef]
  18. Measham, P.F.; Wilson, S.J.; Gracie, A.J.; Bound, S.A. Tree water relations: Flow and fruit. Agric. Water Manag. 2014, 137, 59–67. [Google Scholar] [CrossRef]
  19. Fernández, J.E. Plant-based methods for irrigation scheduling of woody crops. Horticulturae 2017, 3, 35. [Google Scholar] [CrossRef] [Green Version]
  20. Lo Bianco, R.; Scalisi, A. Water relations and carbohydrate partitioning of four greenhouse-grown olive genotypes under long-term drought. Trees 2017, 31, 717–727. [Google Scholar] [CrossRef]
  21. Marino, G.; Caruso, T.; Ferguson, L.; Marra, F.P. Gas exchanges and stem water potential define stress thresholds for efficient irrigation management in olive (Olea europea L.). Water 2018, 10, 342. [Google Scholar] [CrossRef]
  22. Scalisi, A.; O’Connell, M.G.; Stefanelli, D.; Lo Bianco, R. Fruit and Leaf Sensing for Continuous Detection of Nectarine Water Status. Front. Plant Sci. 2019, 10, 805. [Google Scholar] [CrossRef] [PubMed] [Green Version]
  23. Boini, A.; Manfrini, L.; Bortolotti, G.; Corelli-Grappadelli, L.; Morandi, B. Monitoring fruit daily growth indicates the onset of mild drought stress in apple. Sci. Hortic. 2019, 256, 108520. [Google Scholar] [CrossRef]
  24. Jones, H.G. Irrigation scheduling: Advantages and pitfalls of plant-based methods. J. Exp. Bot. 2004, 407, 2427–2436. [Google Scholar] [CrossRef] [Green Version]
  25. Scalisi, A.; Bresilla, K.; Simões Grilo, F. Continuous determination of fruit tree water-status by plant-based sensors. Italus Hortus 2017, 24, 39–50. [Google Scholar] [CrossRef]
  26. Fernandes, R.D.M.; Cuevas, M.V.; Diaz-Espejo, A.; Hernandez-Santana, V. Effects of water stress on fruit growth and water relations between fruits and leaves in a hedgerow olive orchard. Agric. Water Manag. 2018, 210, 32–40. [Google Scholar] [CrossRef]
  27. Khosravi, A.; Zucchini, M.; Giorgi, V.; Mancini, A.; Neri, D. Continuous Monitoring of Olive Fruit Growth by Automatic Extensimeter in Response to Vapor Pressure Deficit from Pit Hardening to Harvest. Horticulturae 2021, 7, 349. [Google Scholar] [CrossRef]
  28. Gucci, R.; Lodolini, E.M.; Rapoport, H.F. Water deficit-induced changes in mesocarp cellular processes and the relationship between mesocarp and endocarp during olive fruit development. Tree Physiol. 2009, 29, 1575–1585. [Google Scholar] [CrossRef]
  29. Giorgi, V.; Neri, D.; Maria Lodolini, E.; Massetani, F. Olive (Olea europaea L.) root growth in soil sectors with olive husks and hay residues. Int. J. Fruit Sci. 2008, 7, 19–32. [Google Scholar] [CrossRef]
  30. Lodolini, E.M.; Falleroni, P.; Polverigiani, S.; Neri, D. Fertigation of young olive trees in Marche region, central Italy: Preliminary study results. Acta Hortic 2011, 888, 289–294. [Google Scholar] [CrossRef]
  31. Polverigiani, S.; Lodolini, E.M.; Neri, D. Olive root growth observed by field rhizotron. Acta Hortic. 2012, 949, 271–278. [Google Scholar] [CrossRef]
  32. Lakso, A.N.; Corelli Grappadelli, L.; Barnard, J.; Goffinet, M.C. An expolinear model of the growth pattern of the apple fruit. J. Hortic. 1995, 70, 389–394. [Google Scholar] [CrossRef]
  33. Morandi, B.; Losciale, P.; Manfrini, L.; Zibordi, M.; Anconelli, S.; Galli, F.; Pierpaoli, E.; Grappadelli, L.C. Increasing water stress negatively affects pear fruit growth by reducing first its xylem and then its phloem inflow. J. Plant Physiol. 2014, 171, 1500–1509. [Google Scholar] [CrossRef]
  34. Brüggenwirth, M.; Winkler, A.; Knoche, M. Xylem, phloem, and transpiration flows in developing sweet cherry fruit. Trees 2016, 30, 1822–1830. [Google Scholar] [CrossRef]
  35. Mancini, A.; Zucchini, M.; Polverigiani, S.; Marcheggiani, E.; Casavecchia, S.; Neri, D. Cherry fruit growth: Monitoring and ‘tweeting’. Acta Hortic. 2021, 1314, 399–408. [Google Scholar] [CrossRef]
  36. Zucchini, M.; Khosravi, A.; Giorgi, V.; Mancini, A.; Neri, D. Is There Daily Growth Hysteresis versus Vapor Pressure Deficit in Cherry Fruit? Horticulturae 2021, 7, 131. [Google Scholar] [CrossRef]
  37. Carella, A.; Gianguzzi, G.; Scalisi, A.; Farina, V.; Inglese, P.; Bianco, R.L. Fruit Growth Stage Transitions in Two Mango Cultivars Grown in a Mediterranean Environment. Plants 2021, 10, 1332. [Google Scholar] [CrossRef]
  38. Grilo, F.S.; Scalisi, A.; Pernice, F.; Morandi, B.; Lo Bianco, R. Recurrent deficit irrigation and fruit harvest affect tree water relations and fruitlet growth in ‘Valencia’orange. Eur. J. Hortic. Sci. 2019, 84, 177–187. [Google Scholar] [CrossRef] [Green Version]
  39. Tuzet, A.; Perrier, A.; Leuning, R. A coupled model of stomatal conductance, photosynthesis and transpiration. Plant Cell Environ. 2003, 26, 1097–1116. [Google Scholar] [CrossRef]
  40. Zhang, Q.; Manzoni, S.; Katul, G.; Porporato, A.; Yang, D. The hysteretic evapotranspiration—Vapor pressure deficit relation. J. Geophys. Res. Biogeosciences 2014, 119, 125–140. [Google Scholar] [CrossRef]
  41. Mayergoyz, I.D. Mathematical Models of Hysteresis and Their Applications, 2nd ed.; Electromagnetism; Academic Press: Cambridge, MA, USA, 2003; ISBN 978-0-12-480873-7. [Google Scholar]
  42. Phillips, J.D. Sources of nonlinearity and complexity in geomorphic systems. Prog. Phys. Geogr. 2003, 27, 1–23. [Google Scholar] [CrossRef]
  43. O’Kane, J.P. Hysteresis in hydrology. Acta Geophys. Pol. 2005, 53, 373–383. [Google Scholar]
  44. Zeppel, M.J.B.; Murray, B.R.; Barton, C.; Eamus, D. Seasonal responses of xylem sap velocity to VPD and solar radiation during drought in a stand of native trees in temperate Australia. Funct. Plant Biol. 2004, 31, 461–470. [Google Scholar] [CrossRef] [PubMed]
  45. O’Brien, J.J.; Oberbauer, S.F.; Clark, D.B. Whole tree xylem sap flow responses to multiple environmental variables in a wet tropical forest. Plant Cell Environ. 2004, 27, 551–567. [Google Scholar] [CrossRef]
  46. Bai, Y.; Li, X.; Liu, S.; Wang, P. Modelling diurnal and seasonal hysteresis phenomena of canopy conductance in an oasis forest ecosystem. Agric. For. Meteorol. 2017, 246, 98–110. [Google Scholar] [CrossRef]
  47. Perez-Martin, A.; Flexas, J.; Ribas-Carbó, M.; Bota, J.; Tomàs, M.; Infante, J.M.; Diaz-Espejo, A. Interactive effects of soil water deficit and air vapour pressure deficit on mesophyll conductance to CO2 in Vitis vinifera and Olea europaea. J. Exp. Bot. 2009, 60, 2391–2405. [Google Scholar] [CrossRef]
  48. Assirelli, A.; Romano, E.; Bisaglia, C.; Lodolini, E.M.; Neri, D.; Brambilla, M. Canopy Index Evaluation for Precision Management in an Intensive Olive Orchard. Sustainability 2021, 13, 8266. [Google Scholar] [CrossRef]
  49. Agenzia Servizi Settore Agroalimentare delle Marche (ASSAM). Available online: http://www.meteo.marche.it/pi/#produzioneintegrata_discliplinare (accessed on 12 September 2022).
  50. COI (International Olive Council). Guide for the Determination of the Characteristics of Oil Olives, COI/OH/Doc. No 1 November 2011. Available online: http://www.internationaloliveoil.org (accessed on 15 September 2021).
  51. Morandi, B.; Manfrini, L.; Zibordi, M.; Noferini, M.; Fiori, G.; Grappadelli, L.C. A Low-cost Device for Accurate and Continuous Measurements of Fruit Diameter. HortScience 2007, 42, 1380–1382. [Google Scholar] [CrossRef] [Green Version]
  52. Kottek, M.; Grieser, J.; Beck, C.; Rudolf, B.; Rubel, F. World map of the Köppen-Geiger climate classification updated. Meteorol. Z. 2006, 15, 259–263. [Google Scholar] [CrossRef]
  53. Monteith, J.; Unsworth, M. Principles of Environmental Physics: Plants, Animals, and the Atmosphere, 4th ed.; Academic Press: Cambridge, MA, USA, 2013. [Google Scholar]
  54. Zhang, R.; Xu, X.; Liu, M.; Zhang, Y.; Xu, C.; Yi, R.; Luo, W.; Soulsby, C. Hysteresis in sap flow and its controlling mechanisms for a deciduous broad-leaved tree species in a humid karst region. Sci. China Earth Sci. 2019, 62, 1744–1755. [Google Scholar] [CrossRef]
  55. Zuecco, G.; Penna, D.; Borga, M.A.R.C.O.; van Meerveld, H.J. A versatile index to characterize hysteresis between hydrological variables at the runoff event timescale. Hydrol. Process. 2016, 30, 1449–1466. [Google Scholar] [CrossRef] [Green Version]
  56. Fishman, S.; Génard, M. A biophysical model of fruit growth: Simulation of seasonal and diurnal dynamics of mass. Plant Cell Environ. 1998, 21, 739–752. [Google Scholar] [CrossRef]
  57. Morandi, B.; Manfrini, L.; Losciale, P.; Zibordi, M.; Corelli Grappadelli, L. Changes in vascular and transpiration flows affect the seasonal and daily growth of kiwifruit (Actinidia deliciosa) berry. Ann. Bot. 2010, 105, 913–923. [Google Scholar] [CrossRef] [PubMed]
  58. Hernandez-Santana, V.; Perez-Arcoiza, A.; Gomez-Jimenez, M.C.; Diaz-Espejo, A. Disentangling the link between leaf photosynthesis and turgor in fruit growth. Plant Sci. J. 2021, 107, 1788–1801. [Google Scholar] [CrossRef]
  59. Morandi, B.; Rieger, M.; Grappadelli, L.C. Vascular flows and transpiration affect peach (Prunus persica Batsch.) fruit daily growth. J. Exp. Bot. 2007, 58, 3941–3947. [Google Scholar] [CrossRef]
Figure 1. Trend of hourly and daily temperature (T), vapor pressure deficit (VPD), reference evapotranspiration (ET0) and rainfall, during the experiment period (from 224 to 276 days of the year (DOY), obtained by MeteoSense 4.0 weather station.
Horticulturae 08 01221 g001
Figure 2. Continuous measurements of diameter of olive fruits during the experiment period (from 224 to 276 days of the year (DOY): (A) fruit 1 and 2 of “Lea” at 10% deficit irrigation (Lea1(DI-10) and Lea2(DI-10), respectively); (B) fruit 1 and 2 of “Arbequina” at 10% deficit irrigation (Arb1(DI-10) and Arb2(DI-10), respectively); (C) fruit 1 and 2 of “Piantone di Falerone” at 20% deficit irrigation (Fal1(DI-20) and Fal2(DI-20), respectively) and fruit 3 and 4 of non-irrigated “Piantone di Falerone” (Fal3(DI-0) and Fal4(DI-0), respectively); (D) fruit 1 and 2 of “Ascolana dura” at 20% deficit irrigation (Asc1(DI-20) and Asc2(DI-20), respectively) and fruit 3 of non-irrigated “Ascolana dura” (Asc3(DI-0)). Missing data From 224 to 249 day of the year (DOY) for Lea2 (DI-10) and Asc1 (DI-20) and from 246 to 249 day of the year (DOY) for panel (A,C,D).
Horticulturae 08 01221 g002
Figure 3. Standardized cumulative fruit growth (CFG). From 227 to 234 day of the year (DOY) (in correspondence with first and second irrigation days) for the olive cultivar Arbequina and Lea (A) and for the olive cultivars Ascolana dura and Piantone di Falerone (B). From 257 to 262 day of the year (DOY) (in correspondence with third irrigation day) for the olive cultivar Arbequina and Lea (C) and for the olive cultivars Ascolana dura and Piantone di Falerone (D). Arb1(DI-10) and Arb2(DI-10) represent fruit 1 and 2 of “Arbequina” at 10% deficit irrigation, respectively. Lea1(DI-10) and Lea2(DI-10) represent fruit 1 and 2 of “Lea” at 10% deficit irrigation, respectively. Asc1(DI-20) and Asc2(DI-20) represent fruit 1 and 2 of “Ascolana dura” at 20% deficit irrigation, respectively. Asc3(DI-0) represents fruit 3 of non-irrigated “Ascolana dura”. Fal1(DI-20) and Fal2(DI-20) represent fruit 1 and 2 of “Piantone di Falerone” at 20% deficit irrigation, respectively. Fal3(DI-0) and Fal4(DI-0) represent fruit 3 and 4 of non-irrigated “Piantone di Falerone”, respectively.
Horticulturae 08 01221 g003
Figure 4. Daily fruit relative growth rate (RGR) from 227 to 234 day of the year (DOY) (in correspondence with first and second irrigation days. The olive cultivar Piantone di Falerone (A,B); the olive cultivar Ascolana dura (C,D); the olive cultivar Arbequina (E); the olive cultivar Lea (F). Fal3(DI-0) represents fruit 3 of non-irrigated “Piantone di Falerone”. Fal1(DI-20) and Fal2(DI-20) represent fruit 1 and 2 of “Piantone di Falerone” at 20% deficit irrigation, respectively. Asc3(DI-0) represents fruit 3 of non-irrigated “Ascolana dura”. Asc2(DI-20) represents fruit 2 of “Ascolana dura” at 20% deficit irrigation. Arb1(DI-10) and Arb2(DI-10) represent fruit 1 and 2 of “Arbequina” at 10% deficit irrigation, respectively. Lea1(DI-10) represents fruit 1 of “Lea” at 10% deficit irrigation.
Horticulturae 08 01221 g004aHorticulturae 08 01221 g004b
Figure 5. Relative growth rate range (RGRrange) from 227 to 234 day of the year (DOY) (in correspondence with first and second irrigation days: (A) fruit 1 and 2 of “Arbequina” at 10% deficit irrigation (Arb1(DI-10) and Arb2(DI-10), respectively) and fruit 1 of “Lea” at 10% deficit irrigation (Lea1(DI-10)); (B) fruit 1 and 2 of “Piantone di Falerone” at 20% deficit irrigation (Fal1(DI-20) and Fal2(DI-20), respectively) and fruit 2 of “Ascolana dura” at 20% deficit irrigation (Asc2(DI-20)); (C) fruit 3 of non-irrigated “Ascolana dura” (Asc3(DI-0)) and fruit 3 of non-irrigated “Piantone di Falerone” (Fal3(DI-0)).
Horticulturae 08 01221 g005
Figure 6. Daily fruit relative growth rate (RGR) from 257 to 262 day of the year (DOY) (in correspondence with the third irrigation day). The olive cultivar Piantone di Falerone (A,B); the olive cultivar Ascolana dura (C,D); the olive cultivar Arbequina (E); the olive cultivar Lea (F). Fal4(DI-0) represents fruit 4 of non-irrigated “Piantone di Falerone”. Fal1(DI-20) and Fal2(DI-20) represent fruit 1 and 2 of “Piantone di Falerone” at 20% deficit irrigation, respectively. Asc3(DI-0) represents fruit 3 of non-irrigated “Ascolana dura”. Asc1(DI-20) and Asc2(DI-20) represent fruit 1 and 2 of “Ascolana dura” at 20% deficit irrigation, respectively. Arb1(DI-10) and Arb2(DI-10) represent fruit 1 and 2 of “Arbequina” at 10% deficit irrigation, respectively. Lea1(DI-10) and Lea2(DI-10) represent fruit 1 and 2 of “Lea” at 10% deficit irrigation, respectively.
Horticulturae 08 01221 g006
Figure 7. Relative growth rate range (RGRrange) from 257 to 262 day of the year (DOY) (in correspondence third irrigation day): (A) fruit 1 and 2 of “Arbequina” at 10% deficit irrigation (Arb1(DI-10) and Arb2(DI-10), respectively) and fruit 1 and 2 of “Lea” at 10% deficit irrigation (Lea1(DI-10) and Lea2(DI-10), respectively); (B) fruit 1 and 2 of “Ascolana dura” at 20% deficit irrigation (Asc1(DI-20) and Asc2(DI-20), respectively) and fruit 1 and 2 of “Piantone di Falerone” at 20% deficit irrigation (Fal1(DI-20) and Fal2(DI-20), respectively); (C) fruit 3 of non-irrigated “Ascolana dura” (Asc3(DI-0)) and fruit 4 of non-irrigated “Piantone di Falerone” (Fal4(DI-0)).
Horticulturae 08 01221 g007
Figure 8. Normalized diameter of example fruits versus normalized vapor pressure deficit (VPD) in 228 day of the year (DOY). The blue box shows daily time lag between VPD and fruit diameter. In the blue box darkness of color shows increasing time lag. To better demonstrate time lag, a negative normalized amount of VPD has been employed. Lea1(DI-10) represents fruit 1 of “Lea” at 10% deficit irrigation. Arb1(DI-10) represents fruit 1 of “Arbequina” at 10% deficit irrigation. Fal1(DI-20) represents fruit 1 of “Piantone di Falerone” at 20% deficit irrigation. Fal3(DI-0) represents fruit 3 of non-irrigated “Piantone di Falerone”. Asc2(DI-20) represents fruit 2 of “Ascolana dura” at 20% deficit irrigation. Asc3(DI-0) represents fruit 3 of non-irrigated “Ascolana dura”.
Horticulturae 08 01221 g008
Figure 9. Hysteresis loops of diameter versus vapor pressure deficit (VPD) in one example day (232 day of the year (DOY)). (A) Complete clockwise hysteresis; (B) incomplete clockwise hysteresis; (C) partial clockwise hysteresis. Dotted black line shows the rotational pattern and starting and ending point of hysteresis loops. Arb1(DI-10) and Arb2(DI-10) represent fruit 1 and 2 of “Arbequina” at 10% deficit irrigation, respectively. Lea1(DI-10) represents fruit 1 of “Lea” at 10% deficit irrigation. Asc2(DI-20) represents fruit 2 of “Ascolana dura” at 20% deficit irrigation. Asc3(DI-0) represents fruit 3 of non-irrigated “Ascolana dura”. Fal1(DI-20) and Fal2(DI-20) represent fruit 1 and 2 of “Piantone di Falerone” at 20% deficit irrigation, respectively. Fal3(DI-0) represents fruit 3 of non-irrigated “Piantone di Falerone”.
Horticulturae 08 01221 g009
Figure 10. Hysteresis loops of diameter versus vapor pressure deficit (VPD) in first (229 day of the year (DOY)) and second (231 day of the year (DOY)) irrigation days. (A) 229 day of the year (DOY) for Ascolana dura; (B) 231 day of the year (DOY) for Ascolana dura; (C) 229 day of the year (DOY) for Piantone di Falerone; (D) 231 day of the year (DOY) for Piantone di Falerone. Asc2(DI-20) represents fruit 2 of “Ascolana dura” at 20% deficit irrigation. Asc3(DI-0) represents fruit 3 of non-irrigated “Ascolana dura”. Fal1(DI-20) and Fal2(DI-20) represent fruit 1 and 2 of “Piantone di Falerone” at 20% deficit irrigation, respectively. Fal3(DI-0) represents fruit3 of non-irrigated “Piantone di Falerone”. Dotted lines show the height of hysteresis curves.
Horticulturae 08 01221 g010
Table 1. Data of ripening index for the fruits, which were mounted on the extensimeters. Data were collected weekly from 262 to 299 days of the year (DOY). Maturation indexes were performed according to the first five (0 to 4) categories of the Jaen index. Arb1(DI-10) and Arb2(DI-10) represent fruit 1 and 2 of “Arbequina” at 10% deficit irrigation, respectively. Lea1(DI-10) and Lea2(DI-10) represent fruit 1 and 2 of “Lea” at 10% deficit irrigation, respectively. Asc1(DI-20) and Asc2(DI-20) represent fruit 1 and 2 of “Ascolana dura” at 20% deficit irrigation, respectively. Asc3(DI-0) represents fruit 3 of non-irrigated “Ascolana dura”. Fal1(DI-20) and Fal2(DI-20) represent fruit 1 and 2 of “Piantone di Falerone” at 20% deficit irrigation, respectively. Fal4(DI-0) represents fruit 4 of non-irrigated “Piantone di Falerone”.
DOYArb1(DI-10)Arb2(DI-10)Lea1(DI-10)Lea2(DI-10)Asc1(DI-20)Asc2(DI-20)Asc3(DI-0)Fal1(DI-20)Fal2(DI-20)Fal4(DI-0)
2620000000000
2690001000002
2760002000212
2840013111322
2911113111333
2991124322433
Table 2. Standardized data of diameter for period of 227 to 234 day of the year (DOY) and 257 to 262 day of the year (DOY). Data of DOY 227 and 257 is related to the starting point of day and for DOY 234 and 262 is related to the ending point of day. Arb1(DI-10) and Arb2(DI-10) represent fruit 1 and 2 of “Arbequina” at 10% deficit irrigation, respectively. Lea1(DI-10) and Lea2(DI-10) represent fruit 1 and 2 of “Lea” at 10% deficit irrigation, respectively. Asc1(DI-20) and Asc2(DI-20) represent fruit 1 and 2 of “Ascolana dura” at 20% deficit irrigation, respectively. Asc3(DI-0) represents fruit 3 of non-irrigated “Ascolana dura”. Fal1(DI-20) and Fal2(DI-20) represent fruit 1 and 2 of “Piantone di Falerone” at 20% deficit irrigation, respectively. Fal3(DI-0) and Fal4(DI-0) represent fruit 3 and 4 of non-irrigated “Piantone di Falerone”, respectively. Fal3 (DI-0) fell down and has been substituted with Fal4 (DI-0) for 257 to 262 day of the year (DOY). Missing data from 227 to 234 day of the year (DOY) for Lea2 (DI-10) and Asc1(DI-20).
DOYArb1(DI-10)Arb2(DI-10)Lea1(DI-10)Lea2(DI-10)Asc1(DI-20)Asc2(DI-20)Asc3(DI-0)Fal1(DI-20)Fal2(DI-20)Fal3(DI-0)Fal4(DI-0)
First and second irrigation treatment (DOYs 229 &231)
2270.40.460.29--0.410.620.340.320.72-
2340.130.150.79--0.910.90.950.950.89-
Third irrigation treatment (DOY 259) -
2570.190.20.230.240.380.950.10.170.08-0.81
2620.950.910.950.830.890.950.950.920.92-0.95
Table 3. Standardized data of daily fruit growth (ΔG) in correspondence with irrigation days. Data was related to the 6 days window (2 days before and 3 days after irrigation day). Arb1(DI-10) and Arb2(DI-10) represent fruit 1 and 2 of “Arbequina” at 10% deficit irrigation, respectively. Lea1(DI-10) and Lea2(DI-10) represent fruit 1 and 2 of “Lea” at 10% deficit irrigation, respectively. Asc1(DI-20) and Asc2(DI-20) represent fruit 1 and 2 of “Ascolana dura” at 20% deficit irrigation, respectively. Asc3(DI-0) represents fruit 3 of non-irrigated “Ascolana dura”. Fal1(DI-20) and Fal2(DI-20) represent fruit 1 and 2 of “Piantone di Falerone” at 20% deficit irrigation, respectively. Fal3(DI-0) and Fal4(DI-0) represent fruit 3 and 4 of non-irrigated “Piantone di Falerone”, respectively. Fal3 (DI-0) fell down and has been substituted with Fal4 (DI-0) for 257 to 262 day of the year (DOY). Missing data from 227 to 234 day of the year (DOY) for Lea2 (DI-10) and Asc1(DI-20).
DOYArb1(DI-10)Arb2(DI-10)Lea1(DI-10)Lea2(DI-10)Asc1(DI-20)Asc2(DI-10)Asc3(DI-0)Fal1(DI-20)Fal2(DI-20)Fal3(DI-0)Fal4(DI-0)
2270.00040.00210.0019--−0.0029−0.0006−0.0029−0.00310.0000-
228−0.00050.00210.0028--0.00000.0013−0.0044−0.00540.0006-
229−0.0050−0.00860.0102--0.00540.00130.01020.0139−0.0013-
230−0.0076−0.00660.0119--0.0063−0.00130.01160.0144−0.0013-
231−0.0034−0.00290.0073--0.0048−0.00060.00860.00970.0000-
2320.01580.01770.0027--0.00340.00060.00640.00740.0006-
2330.01340.0113−0.0018--0.00290.00060.00490.00440.0006-
2340.00290.0029−0.0090--−0.00100.00000.00210.00220.0000-
2570.00430.00590.0000−0.0044−0.00890.0000−0.0011−0.00320.0000-−0.0236
2580.00300.0041−0.00630.0018−0.0045−0.00420.0011−0.0019−0.0007-−0.0170
2590.0008−0.00170.01740.01160.0145−0.00050.00480.00890.0100-−0.0009
260−0.0395−0.04080.01940.01590.0108−0.00240.00580.00630.0072-0.0027
261−0.0177−0.02040.00760.02010.00150.00000.00740.00880.0098-0.0154
262−0.00220.00200.00530.00090.00680.00710.00840.01370.0052-0.0294
Table 4. Data of percentage of appearance of different hysteresis curves. Invalid data were excluded from the table. Arb1(DI-10) and Arb2(DI-10) represent fruit 1 and 2 of “Arbequina” at 10% deficit irrigation, respectively. Lea1(DI-10) and Lea2(DI-10) represent fruit 1 and 2 of “Lea” at 10% deficit irrigation, respectively. Asc1(DI-20) and Asc2(DI-20) represent fruit 1 and 2 of “Ascolana dura” at 20% deficit irrigation, respectively. Asc3(DI-0) represents fruit 3 of non-irrigated “Ascolana dura”. Fal1(DI-20) and Fal2(DI-20) represent fruit 1 and 2 of “Piantone di Falerone” at 20% deficit irrigation, respectively. Fal3(DI-0) and Fal4(DI-0) represent fruit 3 and 4 of non-irrigated “Piantone di Falerone”, respectively.
Type ofhysteresisArb1(DI-10)Arb2(DI-10)Lea1(DI-10)Lea2(DI-10)Asc1(DI-20)Asc2(DI-20)Asc3(DI-0)Fal1(DI-20)Fal2(DI-20)Fal3(DI-0)Fal4(DI-0)
Complete27.4515.6919.0512.5015.0012.8227.666.6710.2635.290.00
Incomplete41.1850.9823.8162.5050.0025.6419.1542.2215.3817.6533.33
Partial23.5325.4942.8616.6715.0030.7734.0426.6748.7223.5350.00
No hysteresis7.847.8414.298.3320.0030.7719.1524.4425.6423.5316.67
Table 5. Data of hysteresis curve types in correspondence with irrigation days. Arb1(DI-10) and Arb2(DI-10) represent fruit 1 and 2 of “Arbequina” at 10% deficit irrigation, respectively. Lea1(DI-10) and Lea2(DI-10) represent fruit 1 and 2 of “Lea” at 10% deficit irrigation, respectively. Asc1(DI-20) and Asc2(DI-20) represent fruit 1 and 2 of “Ascolana dura” at 20% deficit irrigation, respectively. Asc3(DI-0) represents fruit 3 of non-irrigated “Ascolana dura”. Fal1(DI-20) and Fal2(DI-20) represent fruit 1 and 2 of “Piantone di Falerone” at 20% deficit irrigation, respectively. Fal3(DI-0) and Fal4(DI-0) represent fruit 3 and 4 of non-irrigated “Piantone di Falerone”, respectively. From 227 to 234 day of the year (DOY), extensimeters of Lea2 (DI-10) and Asc1 (DI-20) were missing (marked by ”-“ in the table). In the 257 day of the year (DOY), data of extensimeters of Lea1 (DI-10), Asc2 (DI-20), and Fal2 (DI-20), and in 261 day of the year (DOY) data for Asc2 (DI-20) were incorrect and excluded from the table (marked by ” # “ in the table).
DOYArb1(DI-10)Arb2(DI-10)Lea1(DI-10)Lea2(DI-10)Asc1(DI-20)Asc2(DI-20)Asc3(DI-0)Fal1(DI-20)Fal2(DI-20)Fal3(DI-0)Fal4(DI-0)
227CompleteIncompleteComplete--IncompleteCompleteIncompleteIncompleteComplete-
228CompleteIncompleteComplete--CompleteCompleteIncompleteIncompleteComplete-
229PartialPartialPartial--PartialPartialPartialPartialIncomplete-
230PartialPartialPartial--PartialIncompletePartialPartialIncomplete-
231PartialPartialPartial--PartialCompletePartialPartialComplete-
232IncompleteIncompleteComplete--PartialCompletePartialPartialComplete-
233IncompleteIncompleteIncomplete--PartialIncompletePartialPartialPartial-
234IncompleteIncompleteIncomplete--IncompleteCompleteCompleteCompleteComplete-
257IncompleteIncomplete#IncompleteIncomplete#IncompleteIncomplete#-Incomplete
258IncompleteIncompleteIncompleteCompleteIncompleteIncompleteCompleteIncompleteIncomplete-Incomplete
259NoNoNoNoNoNoNoNoNo-No
260PartialPartialNoPartialNoNoPartialNoNo-Complete
261NoNoPartialIncompletePartial#PartialIncompletePartial-Partial
262PartialIncompletePartialChaosPartialPartialPartialPartialPartial-Partial
Table 6. One way repeated measures ANOVA testing hysteresis height (mean) of different cultivar irrigation treatment from 227 to 234 day of the year (DOY). Asc2(DI-20) represents fruit 2 of “Ascolana dura” at 20% deficit irrigation. Asc3(DI-0) represents fruit 3 of non-irrigated “Ascolana dura”. Fal1(DI-20) and Fal2(DI-20) represent fruit 1 and 2 of “Piantone di Falerone” at 20% deficit irrigation, respectively. Fal3(DI-0) represents fruit 3 of non-irrigated “Piantone di Falerone”. Before performing repeated measures ANOVA test, selected data were examined by normality test and equal variance test (for the Fal1 (DI-20), Fal2 (DI-20), and Fal3 (DI-0) normality test (Shapiro–Wilk, passed p = 0.425) and equal variance test (Brown–Forsythe, passed p = 0.185); for the Asc2 (DI-20) and Asc3 (DI-0) normality test (Shapiro–Wilk, passed p = 0.325) and Equal variance test (Brown–Forsythe, passed p = 1.000)).
Treatment Name NMeanStd DevSEMStudent-Newman-Keuls test
Fal1 (DI-20)862.12525.5039.017a
Fal2 (DI-20)87018.836.657a
Fal3 (DI-0)89000b
Asc2 (DI-20)856.12531.69211.205A
Asc3 (DI-0)89000B
Publisher’s Note: MDPI stays neutral with regard to jurisdictional claims in published maps and institutional affiliations.

