Article

An Economic Comparison of High Tunnel and Open-Field Strawberry Production in Southeastern Virginia

by
Jean Claude Mbarushimana
1,
Darrell J. Bosch
1,* and
Jayesh B. Samtani
2
1
Department of Agricultural and Applied Economics, Virginia Tech, Blacksburg, VA 24060, USA
2
Hampton Roads Agricultural Research and Extension Center, School of Plant and Environmental Sciences, Virginia Tech, Virginia Beach, VA 23455, USA
*
Author to whom correspondence should be addressed.
Horticulturae 2022, 8(12), 1139; https://doi.org/10.3390/horticulturae8121139
Submission received: 30 August 2022 / Revised: 17 November 2022 / Accepted: 24 November 2022 / Published: 2 December 2022
(This article belongs to the Special Issue Berry Crops Production: Cultivation, Breeding and Health Benefits)

Abstract

:
High tunnels have been reported to extend the harvest season for fruits and vegetables in several North American regions. This study was conducted to evaluate whether there are additional economic returns from strawberries produced in high tunnel structures compared to open-field in the Commonwealth of Virginia. A total of eight strawberry cultivars were evaluated in a randomized complete block under high tunnel and open-field conditions. Total costs were estimated for all eight cultivars under high tunnel and open-field, and gross and net revenues from all cultivars were estimated over three marketing strategies (pre-pick wholesale, pre-pick retail, and U-pick) for both high tunnel and open-field. The average net revenues per hectare in the high tunnel were −$62,077 (−$25,122 ac−1), −$15,151 (−$6131 ac−1), and −$27,938 (−$11,306 ac−1) for pre-pick wholesale, pre-pick retail, and U-pick, respectively, compared to open-field net revenues of $39,816 ($16,113 ac−1), $112,102 ($45,366 ac−1), and $81,850 ($33,123 ac−1) for wholesale, pre-pick retail, and U-pick, respectively. Net revenues in the high tunnel were lower due to lower yields and higher production costs including overhead cost of the high tunnel structure. Almost all cultivars in the high tunnel generated negative net revenues regardless of the marketing strategy. The exceptions were ‘Camino Real’ which generated positive net revenues with U-pick and pre-pick retail marketing and ‘Merced’ which generated positive net revenues for pre-pick retail marketing. In contrast, net revenues from open-field cultivars were always positive. Results imply that growers should focus on open-field rather than high-tunnel strawberry production. Results are from one season of production. Replication of the study under one or more production seasons would contribute to more robust findings of the economic viability of strawberry production under a high tunnel.

1. Introduction

In 2018, 19,919 hectares (49,220 ac) of strawberries were harvested in the United States of America. California harvested 72.7% of the total area with 14,488 hectares (35,800 ac), followed by Florida (19.9%). Oregon, Washington, North Carolina, and New York accounted for approximately 7.4% of total strawberry production with 1465 hectares (3620 ac) [1]. South Atlantic states (Alabama, Georgia, North Carolina, South Carolina, and Virginia) collectively produce strawberries on 948 hectares (2342 ac) [2]. In the Commonwealth of Virginia, strawberries occupied about 158 hectares (391 ac) in 2017 [3].
Strawberry yield varies depending on the production region. In 2018, the total national utilized yield was 1,295,049 mt (fresh equivalent), which generated approximately $2,670,523,000 revenue. The average strawberry yield was 10.66 mt per hectare (29.03 t ac−1) fresh equivalent, and yields ranged from 90.4 metric tons per hectare (40.3 t ac−1) in California to 5.5 metric tons per hectare (2.5 t ac−1) in New York [1]. The main reason for the yield differences across different states is climate conditions. California weather allows it to produce strawberries all year round, resulting in higher yields. At the same time, other states are limited to short growing seasons with harvest lasting approximately one to five months [3]. The short production season in states with colder climates is associated with lower prices received by growers. The retail price of strawberries is usually higher during the off-season and can even double in December. However, this gap has declined due to improved trade and increased year-round supply [4].
The demand for strawberries has increased drastically in the past decades. Consumption per capita increased from approximately 0.9 kg (2 lbs) per year in 1980 to 3.6 kg (7.9 lbs) per year in 2013. This increase is due to the awareness of strawberries’ health benefits and increased strawberry availability all year round due to increased domestic production and increased imports [5]. In addition to the increase in per capita strawberry consumption, there is an upward trend in consumers’ demand for locally grown food, presenting an opportunity for local producers to receive premium prices. Between 1994 and 2014, farmers’ markets increased from 1755 to 8284 [6].
Most strawberries grown in the mid-south US are sold directly to local markets and contribute to agritourism activities. In a survey conducted by Virginia Cooperative Extension, 79% of strawberry growers stated that they sell their berries through pre-pick retail and U-pick outlets [7]. In the City of Virginia Beach, the highest producer of strawberries in Virginia, an estimated 20% of the yield is sold pre-picked at farmers’ markets, and the remaining portion of the harvest is sold through U-Pick [8].
An increase in local food demand is an opportunity for strawberry producers to adopt technology such as high tunnels that help expand their production and extend their season. High tunnels are unheated, polyethylene-cover, greenhouse-like structures [9]. They offer protection from unfavorable weather conditions such as high wind, frost, hail, and precipitation, and they are reported to extend the harvest season for many crops, allowing the growers to gain early entry into the market when consumers are most excited about berry consumption and picking [9]. A study in Utah reported that high tunnels advanced June-bearing strawberry production by 4 to 5 weeks [10]. The noted benefits from high tunnels, coupled with their low installation costs compared to other protected structures, have stimulated interest among high-value crop growers [11].
Previous analyses of high tunnel vs. open-field production have yielded mixed results. Some studies in North America reported the role of high tunnels in improving the productivity and quality of high-value crops and the possibility of allowing producers to access offseason premium prices [12,13,14,15]. However, a study in Tennessee [16] reported lower net revenue from strawberries produced under a high tunnel compared to open- field production. An Arkansas study of primocane-fruiting blackberries found that open- field production was more profitable than high tunnel production [17]. A Michigan study of high tunnel and open-field raspberry production found higher insect pest pressure under high tunnels compared to open-field [18]. Another study [19] notes that while increased strawberry yield would not justify the cost of a high tunnel, growers point out that the main advantage of a high tunnel is the reliability of production regardless of rain events during harvest. Further research is needed to determine how strawberry net revenues in the southeastern U.S. are affected by high tunnel production and what factors contribute to the change in net revenues. As strawberry producers explore alternatives to conventional open-field production to expand their growing season, little is known as to whether high tunnel benefits observed in other regions can be translated to the southeastern U.S. and whether potentially higher yields and price premiums obtained during the offseason would increase the revenue enough to cover initial installation costs. The effect of different strawberry cultivars on high tunnel versus open-field comparison is also unknown. We conducted this study with the primary objective of learning whether there are additional returns from strawberry cultivars grown in high tunnels compared to those in open-fields in the Southeast and specifically Virginia and what factors contribute to the change in net returns from high tunnel production. Secondly, we were interested in learning and identifying the interaction of strawberry cultivars with the high tunnel versus open-field economic returns. Finally, we were interested in learning the sensitivity of additional returns to the market price.

2. Materials and Methods

2.1. Horticultural Design

The horticultural study was conducted at Virginia Tech’s Hampton Roads Agricultural Research and Extension Center (AREC) in Virginia Beach, Virginia, during the 2019/20 season. The soil was tetotum loam with a non-amended pH of 5.9 and 5.1 for the land with and without strawberry history, respectively. Lime was applied at a rate of 2241 kg ha−1 (2000 lb ac−1) to land with strawberry history and 5043 kg ha−1 (4500 lb ac−1) to land without strawberry history to adjust the pH of both land types to a 6.2 level. Eight strawberry cultivars were evaluated in a randomized complete block. Five cultivars were short-day (June bearing), and three were day-neutral (spring and fall-bearing). The June-bearing cultivars were ‘Rocco’ [20], ‘Ruby June’ [21], ‘Camino Real’ and ‘Merced’ [22], and ‘Chandler’ [23]. The day-neutral cultivars were ‘San Andreas’ [22], ‘Sweet Ann’ (Lassen Canyon Nursery; 2009), and ‘Albion’ [22].
The strawberry plugs of all cultivars were ordered from the same nursery. They were planted in the first week of October 2019 and transplanted in annual hill plasticulture beds with 36 cm (14 in) in-row spacing in a staggered manner. A total of 8 rows 21 m (70 ft) long and 1.8 m (6 ft) center were planted. Four rows were inside a 9 × 45 m (30 × 148 ft) high tunnel, and four others were outside in the open-field. Each cultivar was planted on a 2 m2 (21 ft2) block and replicated four times in both high tunnel and open-field. The total area used for the trials in each environment was 195.1 m2 (2100 ft2). The planted area was 78 m2 (840 ft2), another 78 m2 was for the alley-ways, and the remaining 49 m2 (420 ft2) was the buffer area used to separate cultivars in the trial. We ignored this buffer area in our analysis because it would not be present on a commercial operation. Therefore, we considered the area used for the trials in each environment to be 156 m2 (1680 ft2).
Temperature and plant health were monitored throughout the study. Temperature probes were placed at canopy levels and 15.2 cm (6 in) depth under the soil (root zone) in each bed row. Plant runner counts were recorded monthly for each replicate using a rating from 1 to 5, 1 being for rare runners and 5 for the most runners. Similarly, plant health rating was done on a monthly basis using a rating from 0 to 10, 0 meaning all plants dead in a replicate, and 10 meaning extremely vigorous and healthy appearing plants in a replicate. Strawberry plant development was monitored by measuring plant canopy diameter early in the growing season, mid-season, and toward the end of the growing season. Field plots were harvested two to three times per week by project personnel.

2.2. Economic Analysis

Marketable and nonmarketable yields per block were recorded by harvest date for each cultivar in both high tunnel and open-field environments. We added monthly marketable yield from each of the four blocks of the same cultivar in each environment to obtain the monthly yield per cultivar. Then, we extrapolated the yield to a per hectare basis.
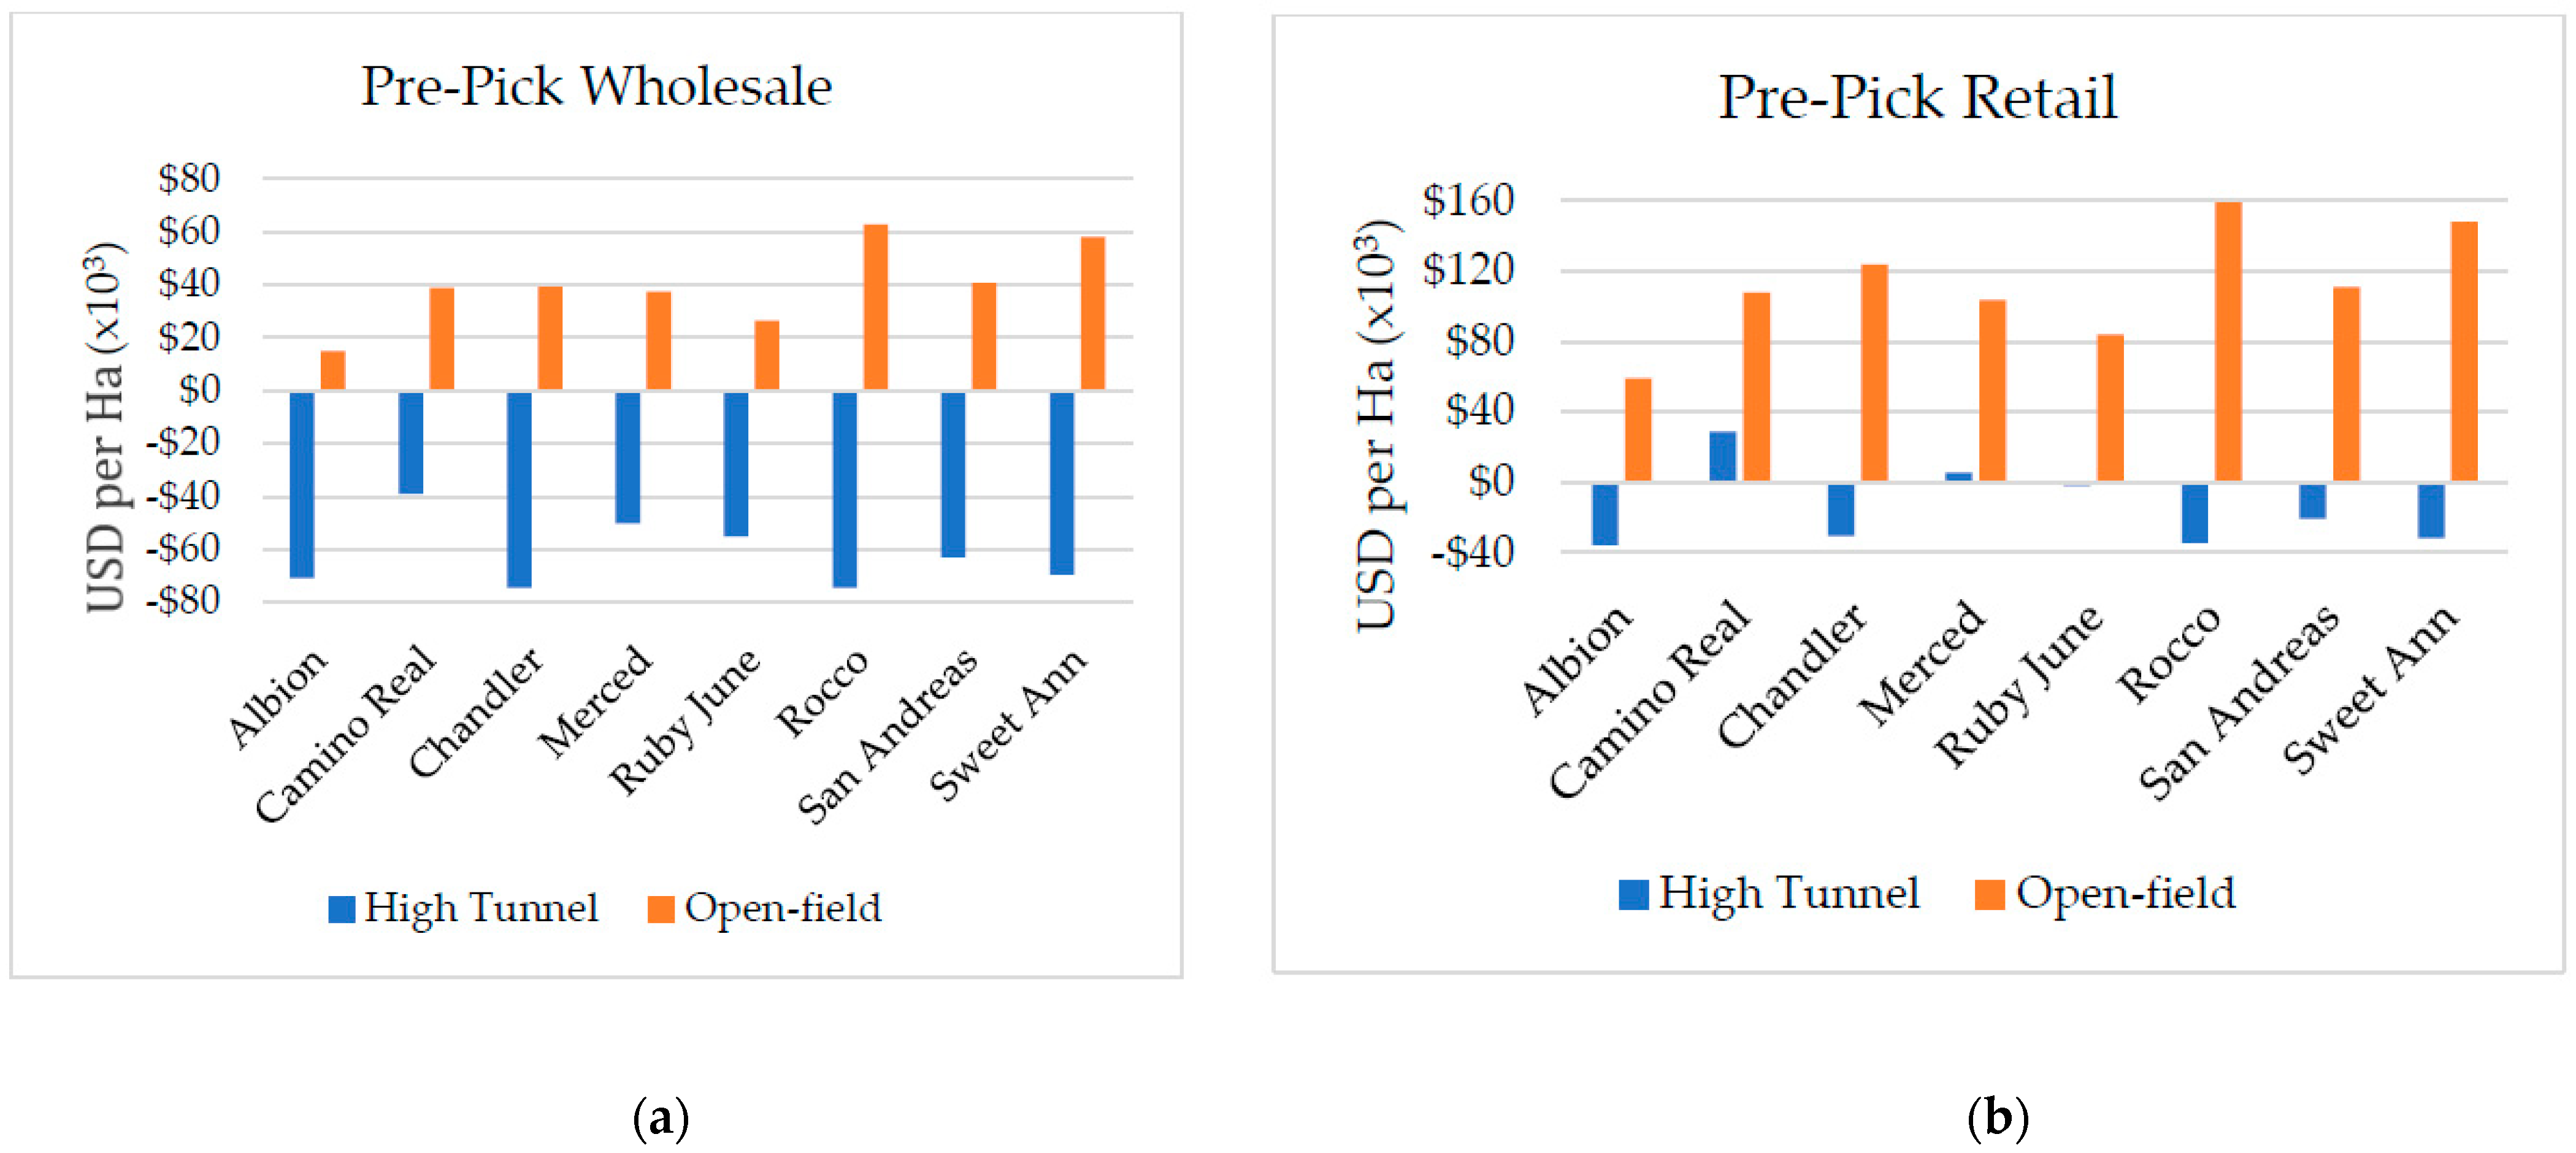
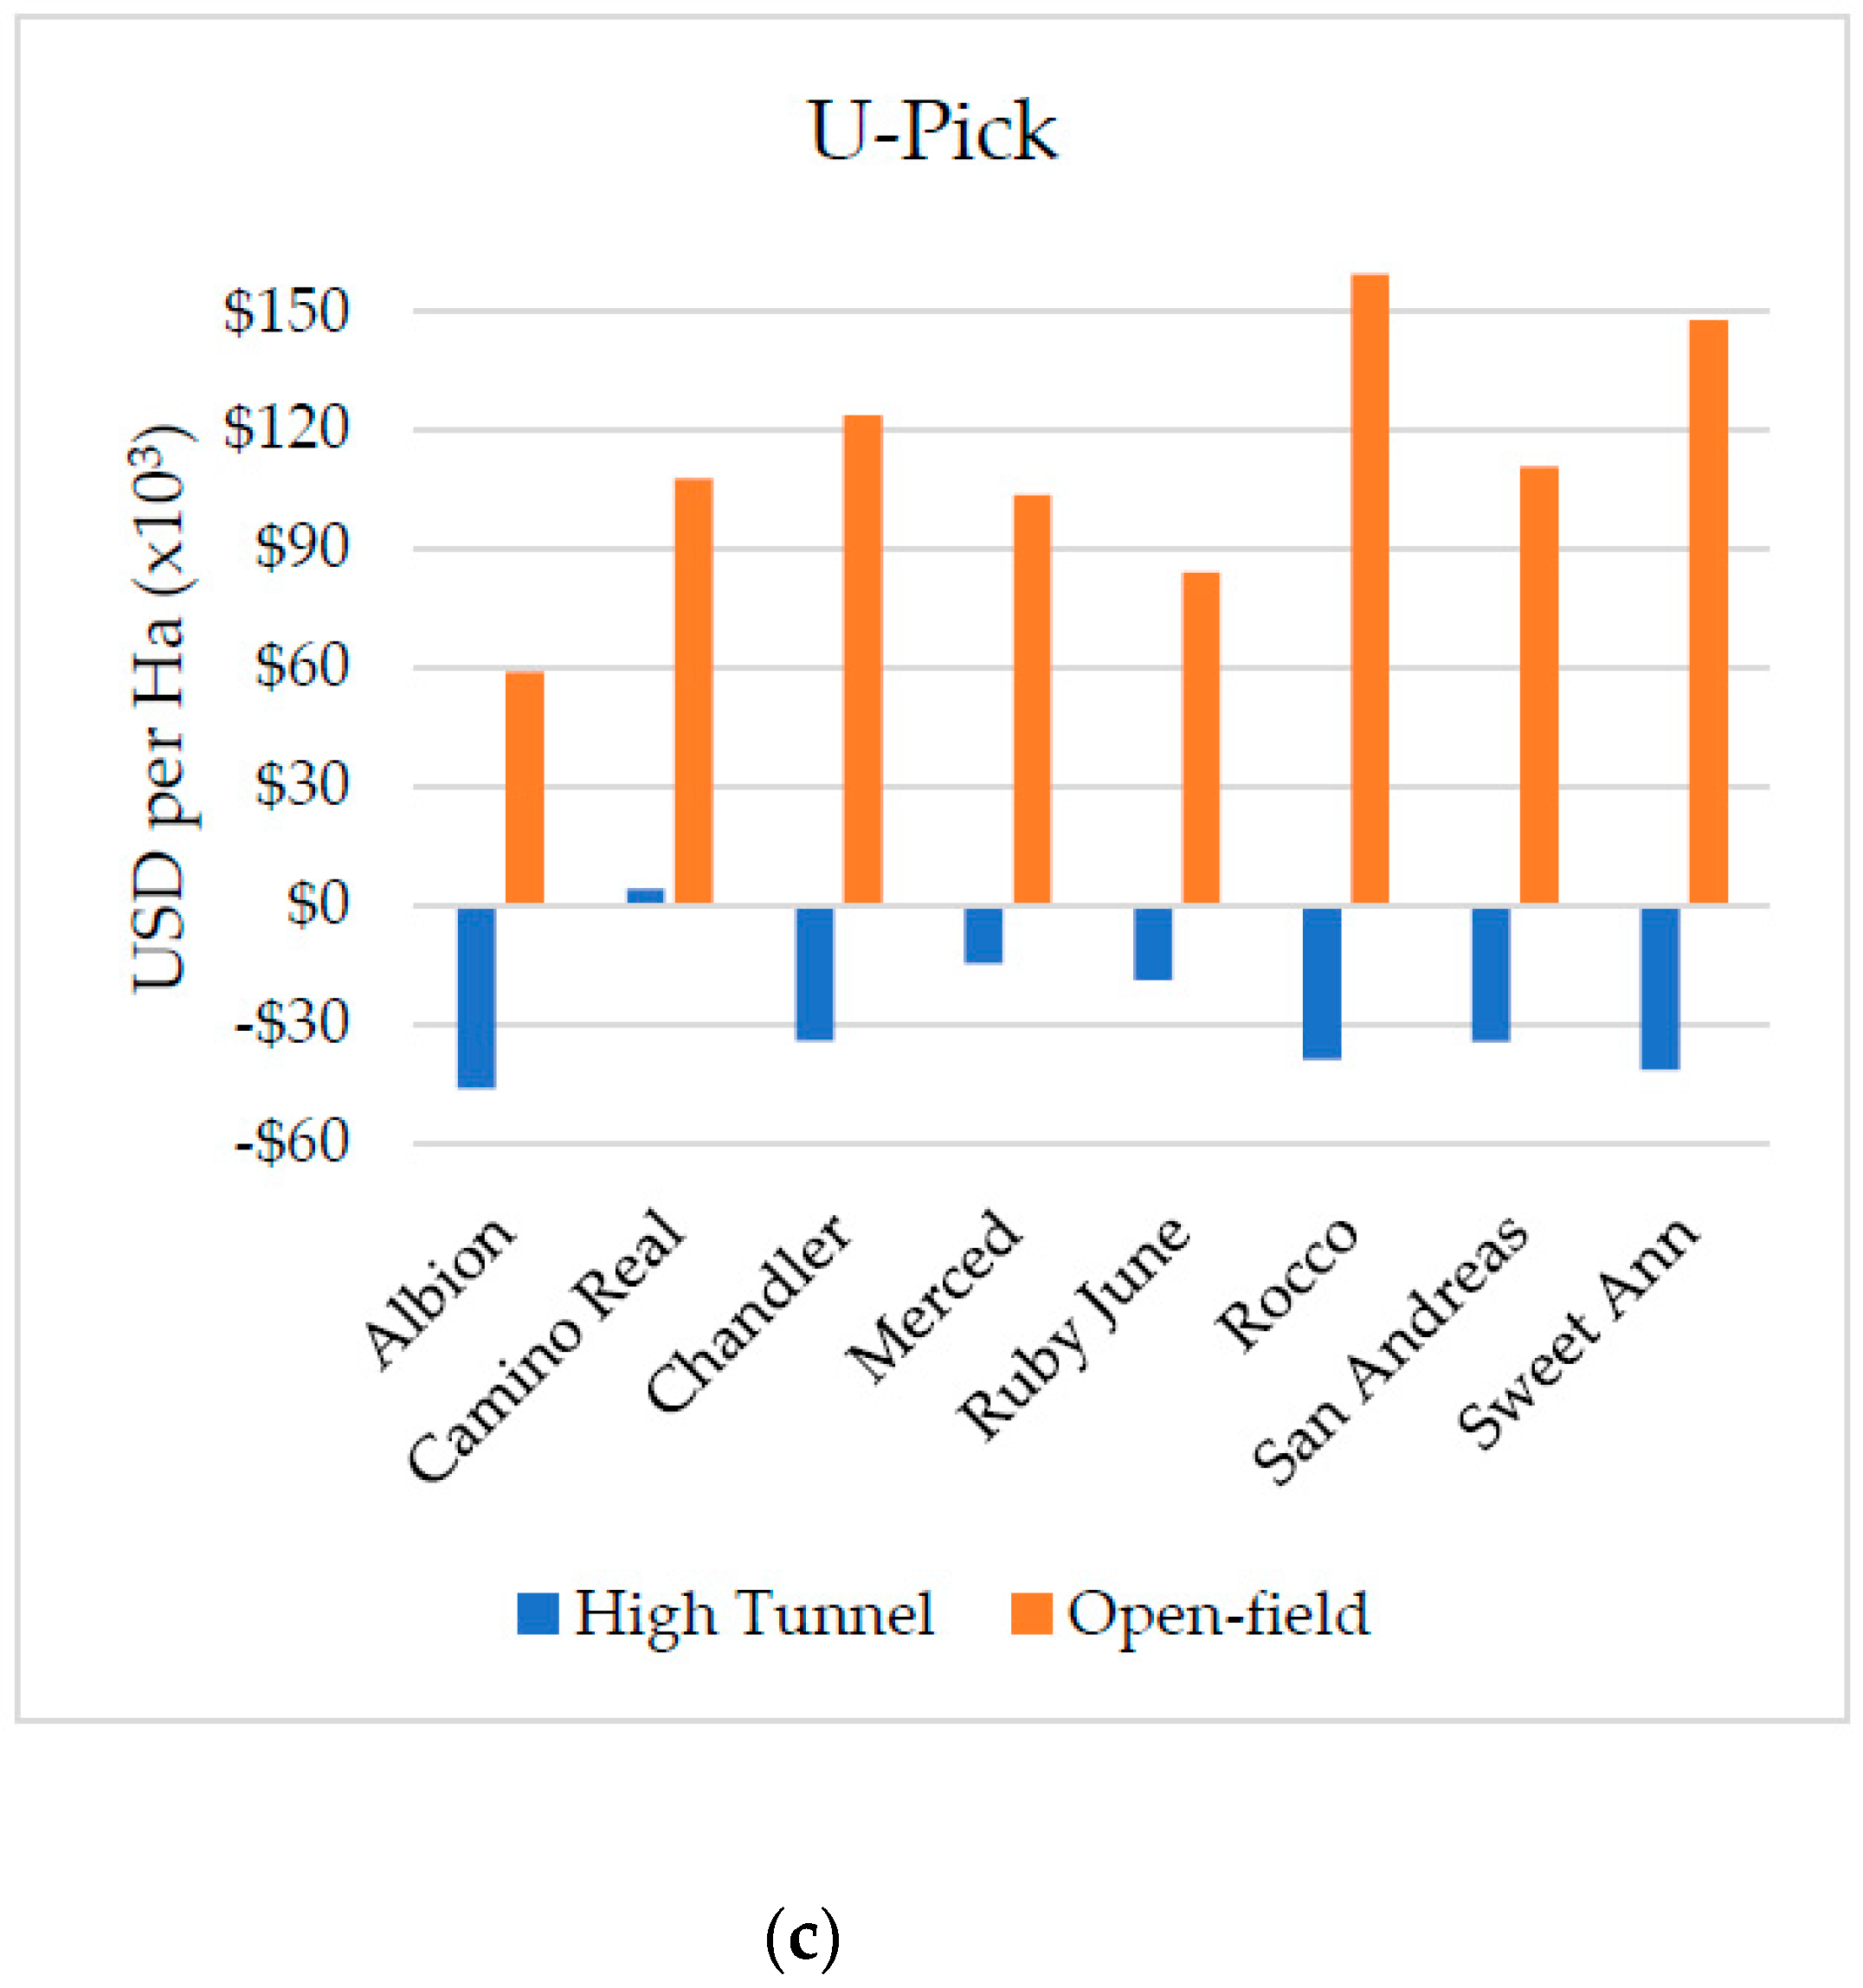
For each cultivar, we calculated total costs, gross revenues, and net returns (revenue generated minus production cost) per hectare for three marketing strategies in both high tunnel and open-field. In the first strategy, producers pre-pick their berries and sell them at a wholesale market (pre-pick-wholesale). In the second, they pre-pick and retail berries (pre-pick-retail); in the third strategy, consumers pick the berries for themselves (U-pick).

2.2.1. Gross Revenue

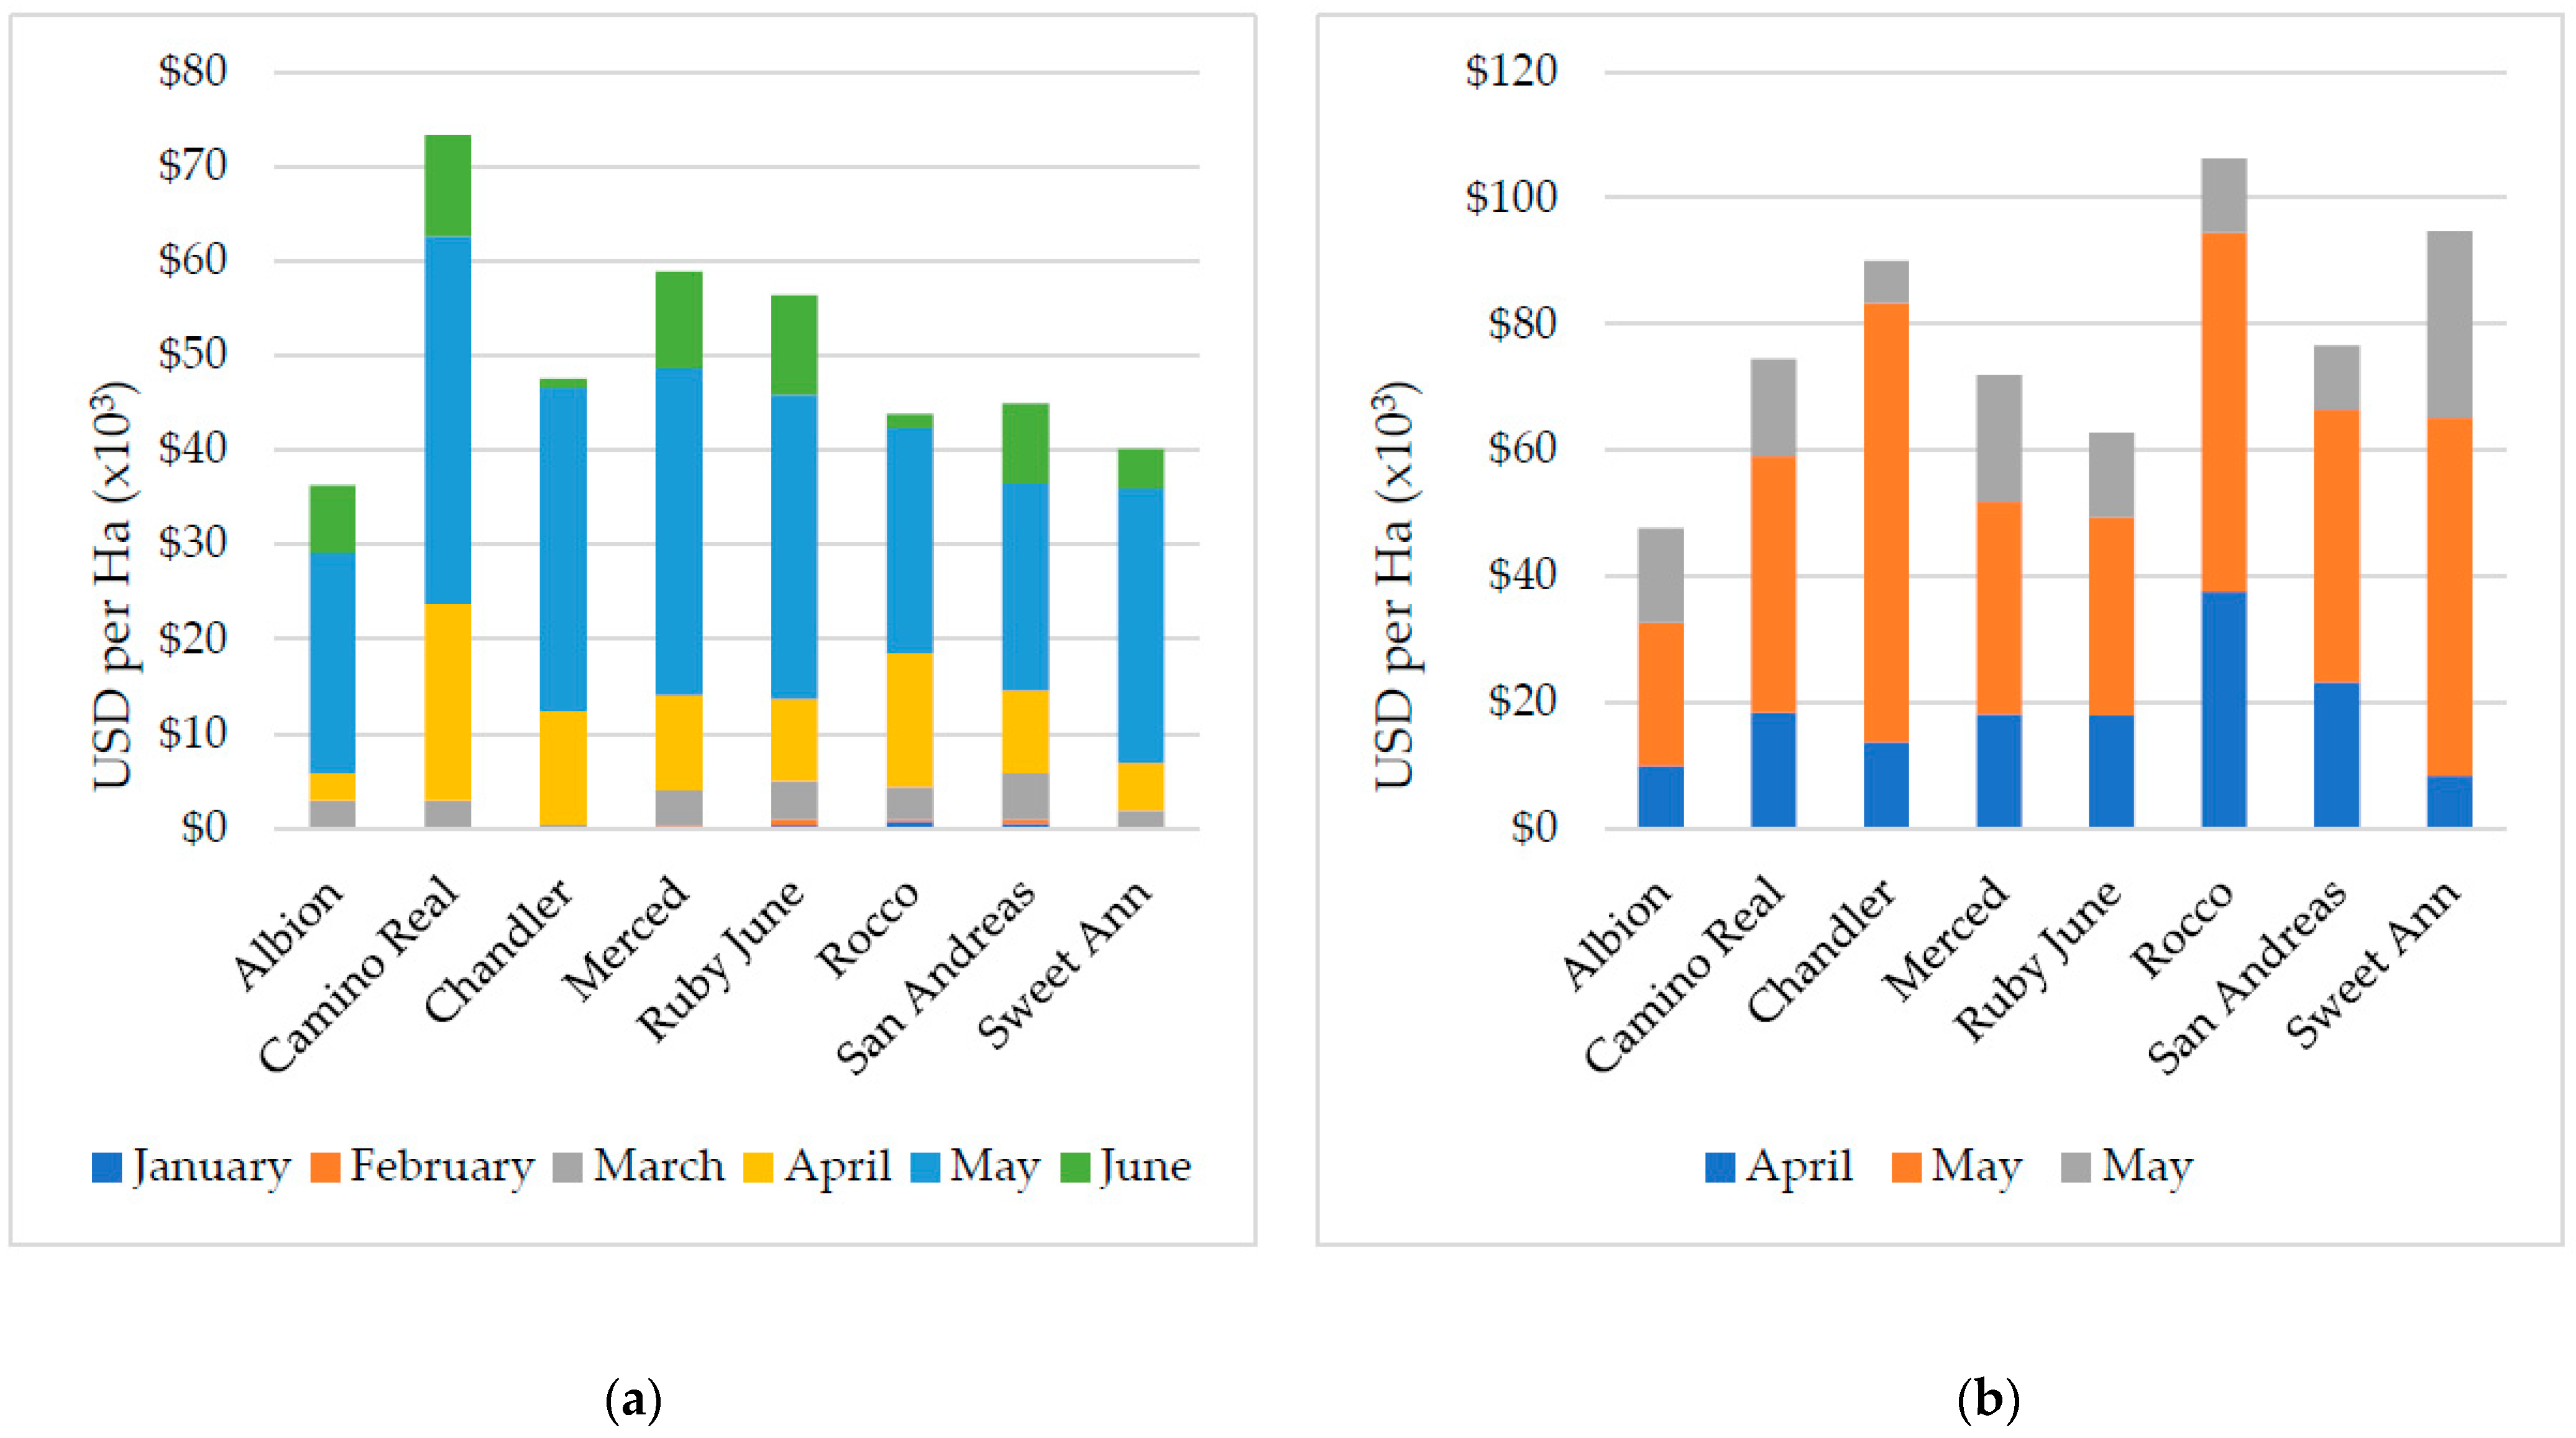
To calculate the seasonal gross revenue, we added the products of monthly marketable yield per cultivar in kilograms and the estimated monthly price per kilogram during the 2019–2020 harvest season. Estimated monthly prices differ by marketing strategy. The same monthly price is used for all cultivars with high tunnel or open-field production, except that January, February, and March monthly prices are not used for open-field production as there are no yields in those months. To account for inflation, all prices were expressed in terms of the purchasing power of money in 2020 (2020 dollars) using U.S. GDP implicit price deflators obtained from the Federal Reserve Bank of St Louis website (https://fred.stlouisfed.org, accessed on 3 March 2021). To convert dollars for a cost or revenue item from a given quarter and year to 2020 dollars, we find the ratio of the deflator for the second quarter of 2020 and the deflator of the quarter in the year under consideration. This ratio is multiplied by a price reported in that year to convert it to 2020 dollars. The result was a set of prices expressed in 2020 dollars.
To estimate the monthly price received by producers in the southeastern US at the wholesale market, we found the 4-year average North Carolina strawberry prices (expressed in 2020 dollars) at the Baltimore Terminal Market (2017–2020). The terminal market price dataset was obtained from the USDA (AMS) website (https://www.marketnews.usda.gov, accessed on 3 March 2021). This dataset reported weekly low, high, mostly low, and mostly high prices per flat 8 0.45 kg (1 lb) container with a lid. We took the average of the mostly high and mostly low prices for each month and converted these average prices to 2020 dollars, as described above. We took the average of the mostly high and mostly low prices in order to capture the range of prices observed without being overly influenced by outliers that might have been introduced with inclusion of the high and low price categories.
The USDA dataset for Baltimore Terminal Market price contained only information on April through June prices. We obtained a dataset of monthly southeastern US retail prices per kilogram for five years (2016–2020) from the USDA website (https://www.marketnews.usda.gov, accessed on 4 March 2021). We converted all prices to 2020 dollars as described above and then used the average price for each month over the five years to estimate wholesale prices for January through March. First, we calculated the average percent retail margin over the terminal market price for April through June. The resulting average percent retail margin was used to estimate the average wholesale terminal market price for January, February, and March based on the retail prices for each month.
Prices for pre-pick retail and U-pick operations were obtained by finding an average of prices reported by local Virginia producers who responded to an online survey administered in 2021. Respondents market their berries via pre-pick retail or U-pick outlets. Survey respondents were asked to report their prices as dollars per pound or dollars per 4-quart basket.

2.2.2. Cost

We used the costs recorded in trials at the AREC in Virginia Beach. Since the trials were conducted on a 156 m2 (1680 ft2) area with eight cultivars under high tunnel and open-field, we extrapolated the costs to a per-hectare basis. Some production labor costs were based on North Carolina State extension budgets, rather than experimental observations, to more accurately reflect production conditions on a commercial operation [24]. In addition, other supplementary cost information was also obtained from the North Carolina extension budgets [24]. All costs were expressed in 2020 dollars using the procedure described above for prices.
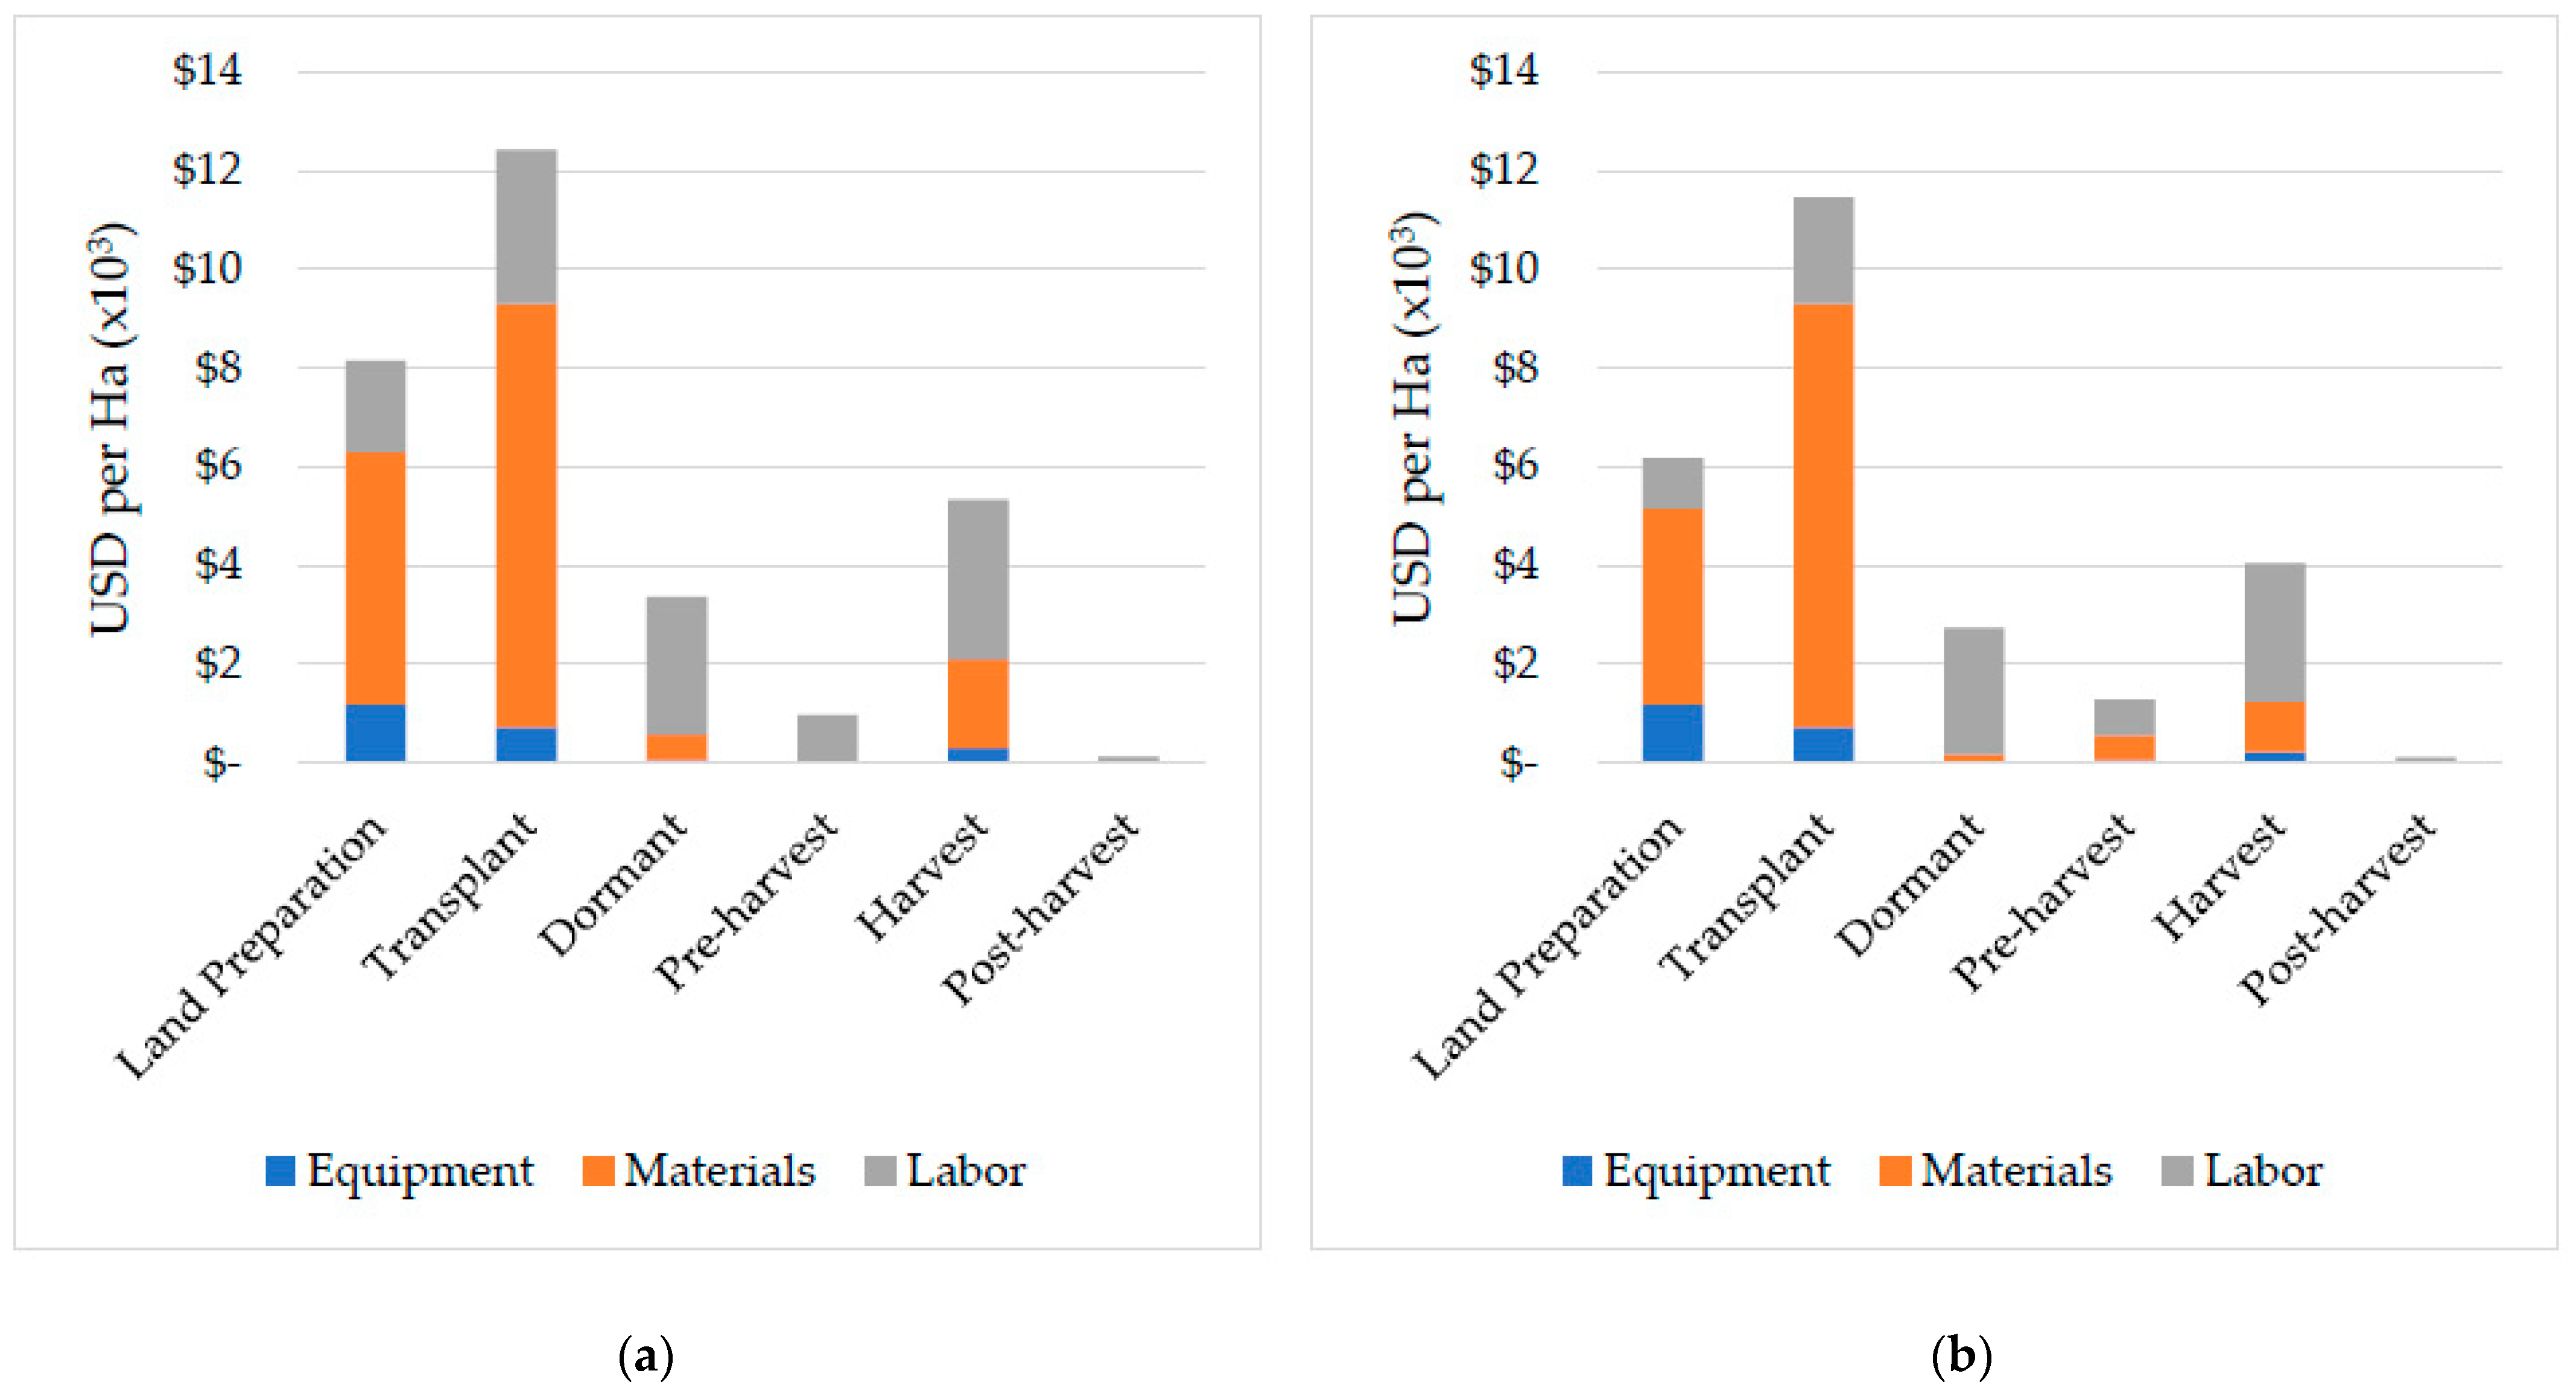
Costs are divided into production and overhead. Production costs were reported by strawberry production stages: land preparation, transplant, dormant, harvest, and post-harvest. Except for the harvest stage, all production stages started and ended around the same time in the open-field and the high tunnel. Costs for all activities that occurred between the first and the last harvest days were classified in the harvest production stage except the labor cost spent for the actual picking of the berries, which was classified in a separate harvest labor category.
For each production stage, reported production costs include labor, materials, and machinery variable costs. Production costs of the high tunnel differ from those of the open-field. Cultivars grown within the open-field (high tunnel) have the same costs with the exception of harvest labor costs, which vary by yield and by the marketing strategy. We used harvest labor reported in the trials for the pre-pick wholesale and retail operations, and we assumed the U-pick harvest labor to be 20% of the pre-pick harvest labor.
Overhead costs include interest, depreciation, and repairs for all irrigation, machinery, and high tunnel infrastructure. Overhead costs differ between the high tunnel and open-field but are the same for all cultivars within the open-field (high tunnel). The high tunnel structure cost was depreciated for ten years based on the Internal Revenue Services’ 2012 Farmers Tax Guide, which states that horticultural structures’ lifetime is ten years [25]. Maintenance and interest costs were, respectively, four and five percent of the average costs of the structure.

2.2.3. Net Revenues

Net revenues per hectare from eight strawberry cultivars under each marketing strategy and under open-field and high tunnel production were estimated by subtracting the total per hectare cost from gross revenues.

3. Results

3.1. Gross Revenues

3.1.1. Budget Analysis

Gross revenues depended on cultivars, production environment, and marketing strategy. Figure 1 shows monthly revenue from each cultivar in the high tunnel (a) and open-field (b) for a pre-pick-wholesale price. ‘Camino Real’ generated the highest revenue in the high tunnel with annual revenue of $73,287 ha−1 ($29,659 ac−1), followed by ‘Merced’ and ‘Ruby June’ with gross revenues of $58,839 ha−1 ($23,812 ac−1) and $56,366 ha−1 ($22,811 ac−1), respectively. ‘Albion’ generated the lowest revenue of $36,578 ha−1 ($14,803 ac−1). In the open-field, ‘Rocco’ generated the highest revenue of $106,243 ha−1 ($42,996 ac−1) followed by ‘Sweet Ann’ and ‘Chandler’ with revenues of $94,715 ha−1 ($38,331 ac−1) and $89,925 ha−1 ($36,392 ac−1), respectively. Similar to the high tunnel result, ‘Albion’ generated the lowest revenue of $47,519 ha−1 ($19,231 ac−1).
Overall, revenues from cultivars grown in the open-field were higher than those from high tunnel regardless of whether producers marketed at a wholesale, retail, or U-pick price (Table A1). Depending on the individual cultivar, per hectare revenues from the open-field were between $1196 and $62,440 ha−1 ($484 and $25,269 ac−1) higher than those from the high tunnel for the pre-pick wholesale marketing strategy. The wholesale price, which was the 5-year average price in southeastern U.S stores, varied between $4.59 and $5.67 kg−1 ($2.08 and $2.57 lb−1), depending on the month. The revenue difference became even wider when strawberries were marketed at a retail ($9.48 kg−1 or $4.30 lb−1) or U-pick ($6.97 kg−1 or $3.16 lb−1) price. The differences ranged between $2430 and $118,803 ha−1 ($983 and $48,078 ac−1) for the pre-pick retail marketing strategy and from $1786–$87,306 ha−1 ($723 to $35,332 ac−1) for U-pick. On average, the revenue was $27,873 ha−1 ($11,280 ac−1), $53,233 ha−1 ($21,543 ac−1), and $39,120 ha−1 ($15,831 ac−1) higher in open-field than in the high tunnel for pre-pick-wholesale, pre-pick-retail, and U-pick marketing strategies, respectively.

3.1.2. Yield Analysis

The high tunnel allowed harvest before the normal harvest season (before April), as harvest for some cultivars started as early as January. However, the yields were generally low compared to the open-field. The total yields for different cultivars ranged between 9676–21,379 kg ha−1) (8634 and 19,078 lb ac−1) in the open-field and from 7550–14,865 kg ha−1 (6737 to 13,265 lb ac−1) in the high tunnel. The average yield per hectare was 1.4 times higher in the open-field compared to the high tunnel. The yields were slightly skewed to the right in the high tunnel (Figure 2a) and normally distributed in the open-field (Figure 2b).
A simple linear regression analysis sheds additional light on the effects of cultivar and production environment, namely open-field and high tunnel, on yield. Table 1 and Table 2 report the estimates from ordinary least square regressions (OLS) with yields as the dependent variable and cultivar as the independent variable. Using ordinary least squares is justified because data were obtained from experiments where other factors, such as weather and soil, were controlled, and endogeneity should not be an issue. Ordinary least squares estimation method assumes that errors have a constant variance, homoskedasicity. To ensure this assumption was met in regression models in Table 1 and Table 2, we conducted the Breusch-pagan heteroskedasticity test. We failed to reject the null hypothesis that homoskedasticity is present in both high tunnel (p = 0.21) and open-field (p = 0.43) models.
The intercepts in Table 1 and Table 2 indicate an estimate of the average yields for the base variety, ‘Chandler’ under high tunnel and open-field conditions, respectively. Estimates for other varieties indicate how much the yield of each variety varies from the estimate for ‘ChandIer’. In the high tunnel, the average yield for ‘Chandler’ was 7725 kg ha−1 (6891 lb ac−1), as indicated by the intercept estimate in Table 1. Only ‘Camino Real’ had a statistically significant higher yield than ‘Chandler’ (p = 0.013). On average, its yield was 4167 kg ha−1 (3717 lb ac−1) more than ‘Chandler’s’. Similarly, the yield for ‘Chandler’ in the open-field was 14,527 kg ha−1 (12,959 lb ac−1), as indicated by the estimate for open-field in Table 2, almost twice the yield reported in the high tunnel. The open-field average yields for ‘Camino Real’ (p < 0.1), ‘Ruby June’ (p < 0.01), ‘Albion’ (p < 0.001), and ‘Merced’ (p < 0.1) were lower than those for ‘Chandler’.

3.2. Cost

3.2.1. Production Cost

Overall, the production cost, excluding harvest labor for picking berries, was higher in the high tunnel than in the open-field across all strawberry production stages except for the pre-harvest stage, as presented in Figure 3a,b. Transplanting was the costliest production stage in both high tunnel and open-field, and the post-harvest stage was the least costly. The transplanting production stage costs $12,414 and $11,458 ha−1 ($5024 and $4637 ac−1) in the high tunnel and open-field, respectively. The least costly stage was post-harvest. It costs $115 ha−1 ($46.50 ac−1) in both high tunnel and open-field. The total per hectare production cost (excluding harvest labor for picking berries) was $30,327 ($12,273 ac−1) in the high tunnel and $25,829 ha−1 ($10,453 ac−1) in the open-field.
Expenses for each production stage were categorized into equipment, materials, and labor. The materials category was the costliest in both high tunnel and open-field. It costs $16,002 and $14,228 ha−1 ($6476 and $5758 ac−1) in the high tunnel and open-field, respectively, equivalent to 52.8% and 55.1% of the production costs in the high tunnel and open-field, respectively. Equipment cost was the least expensive category, $2270 ha−1 ($919 ac−1) and $2241 ha−1 ($907 ac−1) in the high tunnel and open-field, respectively.

3.2.2. Administrative and Cumulative Cost

The annual administrative cost, including real estate taxes, net land rent, and overhead, was $378 ha−1 ($153 ac−1) in both high tunnel and open-field. Adding this cost to the total high tunnel and open-field production cost, we obtained a cumulative cost of $30,705 ha−1 ($12,426 ac−1) and $26,209 ha−1 ($10,606 ac−1), respectively, excluding harvest labor. We added $65,331 ha−1 ($26,439 ac−1) to the high tunnel cumulative cost for annual ownership cost of the structure resulting in a cumulative cost of $96,039 ha−1, ($38,865 ac−1) slightly more than three and a half times the cumulative cost of producing strawberries in the open-field.

3.2.3. Harvest Labor Cost

The costs of growing different cultivars under the same production environment differ by harvest labor costs which, in turn, vary by marketing strategy chosen by producers and by cultivar. Figure 4 compares the harvest labor cost per hectare in the high tunnel and open-field for each individual cultivar and pre-pick marketing strategy. For all cultivars, harvest labor costs were higher in the high tunnel than in the open-field. The largest difference in harvest labor was recorded for ‘Camino Real’. The average harvest labor in the high tunnel was a little over 1.4 times the average in open-field for a pre-pick operation. This was somewhat unexpected based on the fact that high tunnel strawberry cultivars had a lower yield compared to cultivars in the open-field. This higher harvest cost in the high tunnel can be explained by the increased number of harvesting times because harvest started earlier in the high tunnel compared to the open-field. The patterns in the harvest labor for a U-pick operation were similar to those for a pre-pick operation. The only difference is that U-pick harvest labor provided by the grower was assumed to be 20 percent of that in the open-field.
The harvest labor cost differs by strawberry cultivar. Yields partially explain cost differences. Three of the four highest yielding high-tunnel cultivars had the highest harvest labor costs for the high tunnel: ‘Chandler’ ($26,170 ha−1 or $10,591 ac−1), ‘Camino Real’ (16,215 ha−1 or $6562 ac−1), and ‘Ruby June’ ($15,385 ha−1 or $6226 ac−1). ‘Albion’ had the lowest high-tunnel harvest cost ($10,924 ha−1 or $4421 ac−1) and the lowest yield. However, ‘Rocco’ had the second-highest high tunnel labor cost ($22,289 ha−1 or $9020 ac−1) but the sixth-highest yield.
The three highest-yielding open-field cultivars had the highest open-field harvest labor costs: ‘Chandler’ ($24,379 ha−1 or $9867 ac−1), ‘Rocco’ ($17,097 ha−1 or $6919 ac−1), and ‘Sweet Ann’ (10,472 ha−1 or $4238 ac−1). ‘Albion’ had the lowest open-field harvest labor cost of $6538 ha−1 ($2646 ac−1) and the lowest yield. However, ‘Ruby June’ had the fourth highest labor cost ($9987 ha−1 or $4042 ac−1) but the seventh highest open-field yield.
The cumulative cost (including harvest labor) for a pre-pick operation ranged between $106,963 and $122,209 ha−1 ($43,286 and $49,456 ac−1) in the high tunnel, and $32,747 and $50,590 ha−1 ($13,252 and $20,473 ac−1) in the open-field depending on strawberry cultivars. Similarly, for a U-pick operation, total cost ranged between $98,223 and $101,273 ha−1 ($39,750 and $40,984 ac−1) in the high tunnel and $27,516–$31,085 ha−1 ($11,135 and $12,580 ac−1) in the open-field (Table A2).

3.3. Net Revenues

Net revenues depended on the production environment, strawberry cultivars, and market price. Overall, producing strawberries in the high tunnel was not profitable (Table A3). When strawberries were marketed at wholesale price, all cultivars in the high tunnel generated negative net revenues (Figure 5a). In comparison, all cultivars in the open-field generated positive net returns (Figure 5a and Table A3). Net revenues from cultivars produced in the high tunnel ranged between −$74,638 and −$38,965 ha−1 (−$30,205 and −$15,768 ac−1) while those from open-field cultivars ranged between $14,774 and $62,940 ha−1 ($5979 and $25,471 ac−1). On average, open-field cultivars generated $101,893 ha−1 ($41,235 ac−1) higher net revenues compared to the high tunnel.
Similarly, when producers marketed their strawberries at a retail price (pre-pick retail) and when consumers picked the berries from the field (U-pick), all high tunnel cultivars generated a negative net return, except for ‘Camino Real’ and ‘Merced’. The net revenue from ‘Camino Real’ was $28,689 ha−1 ($11,610 ac−1) and $4295 ha−1 ($1738 ac−1) at pre-pick-retail and U-pick prices, respectively, and the net revenue from ‘Merced’ was $5338 ha−1 ($2160 ac−1) at the pre-pick retail price. In contrast, all open-field cultivars generated a positive return (Figure 5b,c and Table A3). In both marketing strategies, the loss from producing strawberries in the high tunnel was smaller than that incurred when berries were marketed at a wholesale price (pre-pick wholesale), but the difference between high tunnel and open-field net revenue became wider. On average, the per hectare net revenue from open-field cultivars exceeded that from the high tunnel by $127,253 ha−1 ($51,498 ac−1) for pre-pick retail and $109,788 ha−1 ($44,430 ac−1) for U-pick.

4. Discussion

Several studies conducted in different regions in North America reported higher net revenues from producing fruits and vegetables in high tunnels compared to the open-field [26]. High tunnels extended the harvest season and increased marketable yields resulting in higher net returns. In contrast, our study finds lower net returns from high tunnel production for all marketing strategies. Lower net returns in the high tunnel compared to the open-field can be attributed to two main reasons. First, the high tunnel production cost was higher than the cost of the open-field cultivars, as discussed in the previous section (
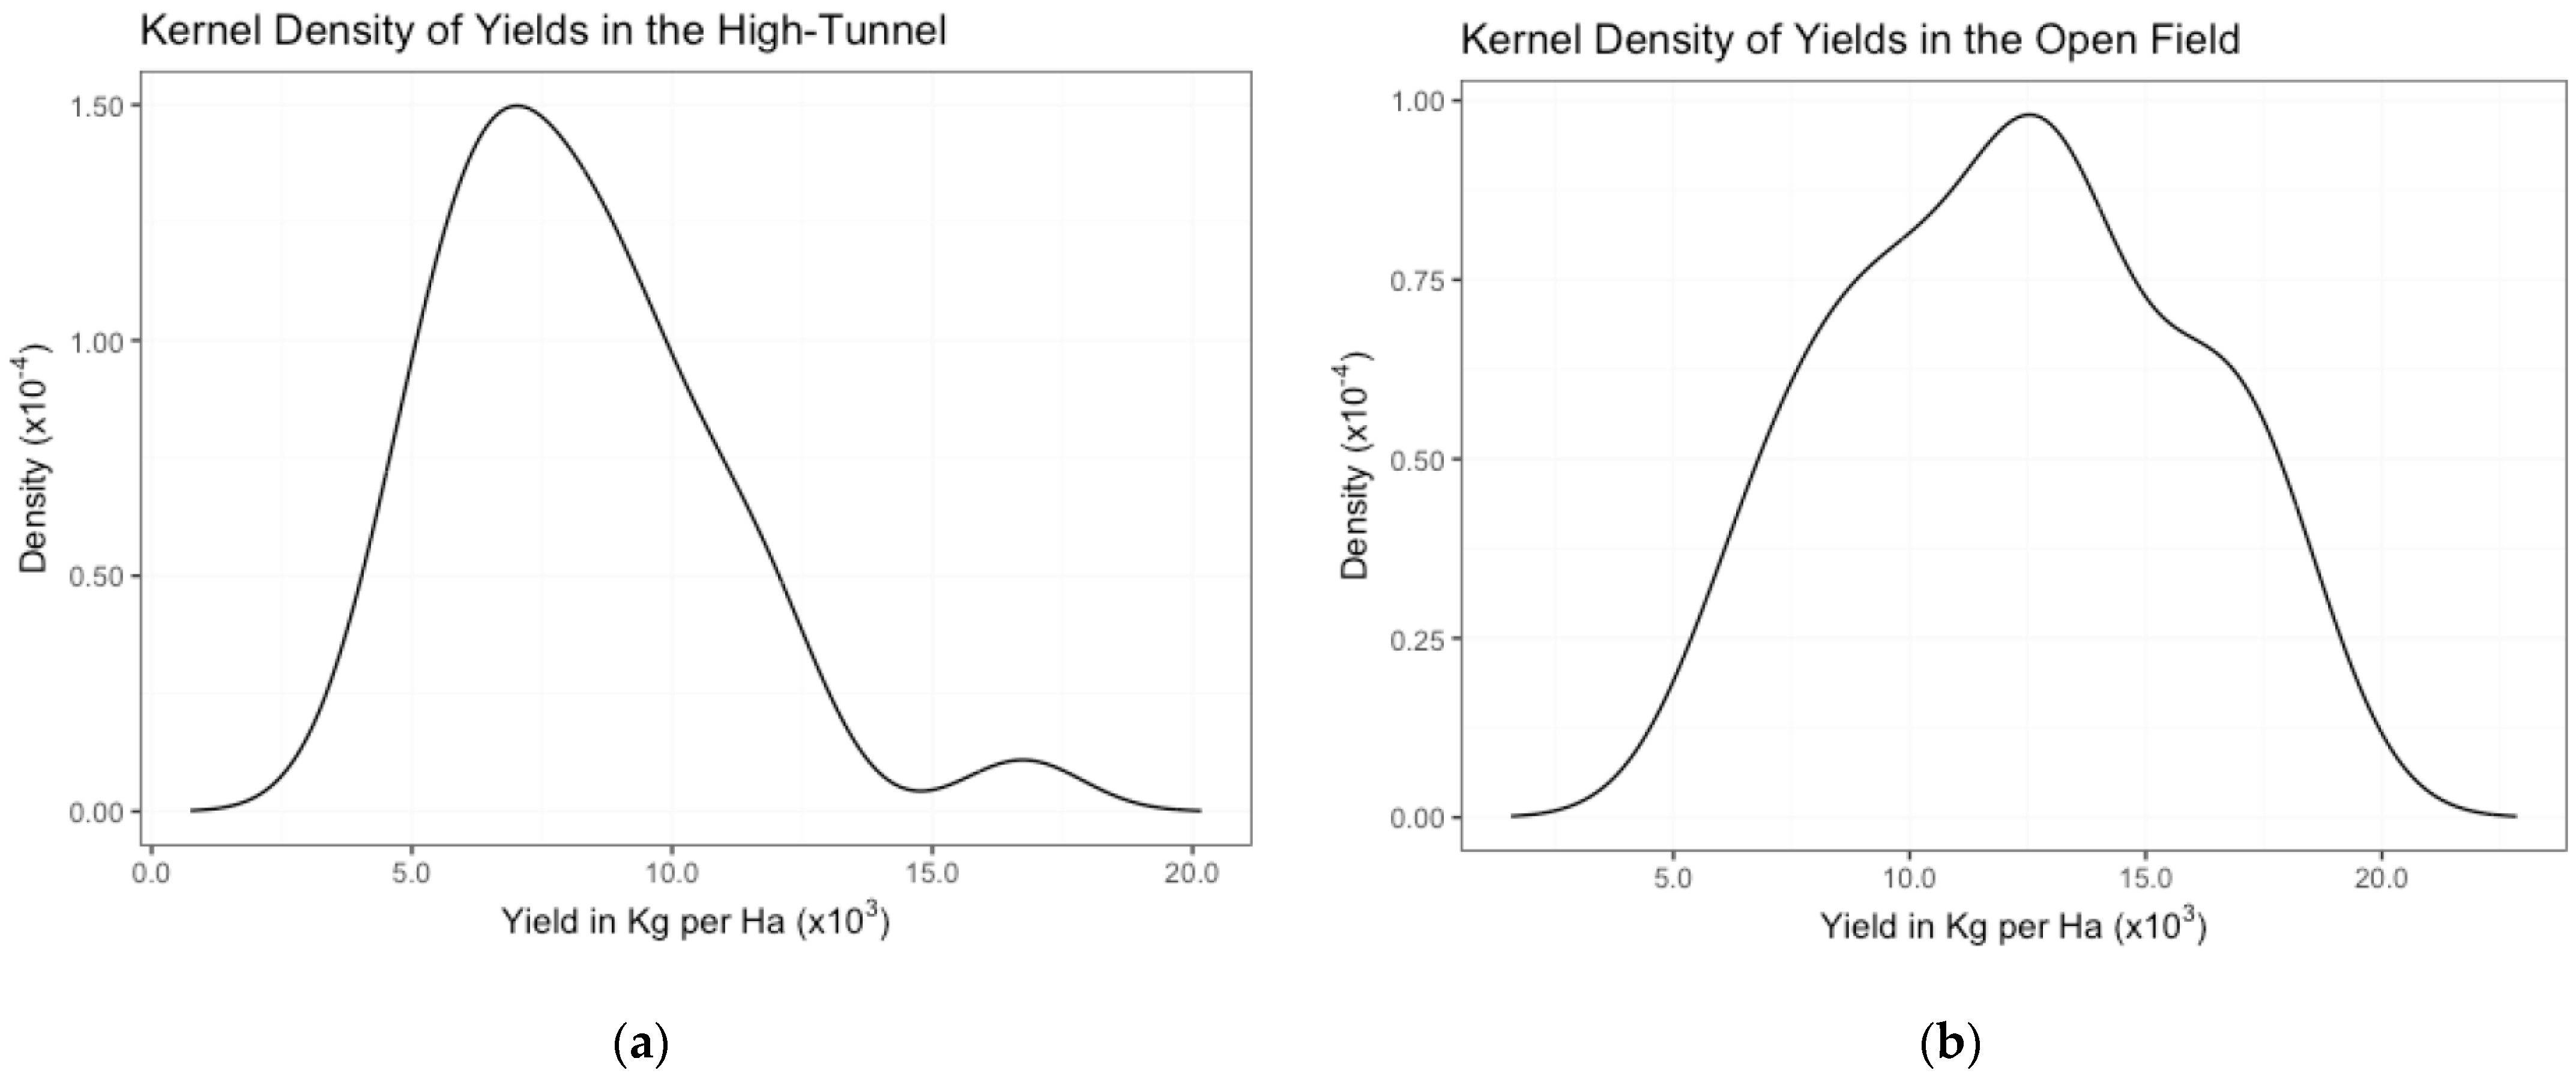
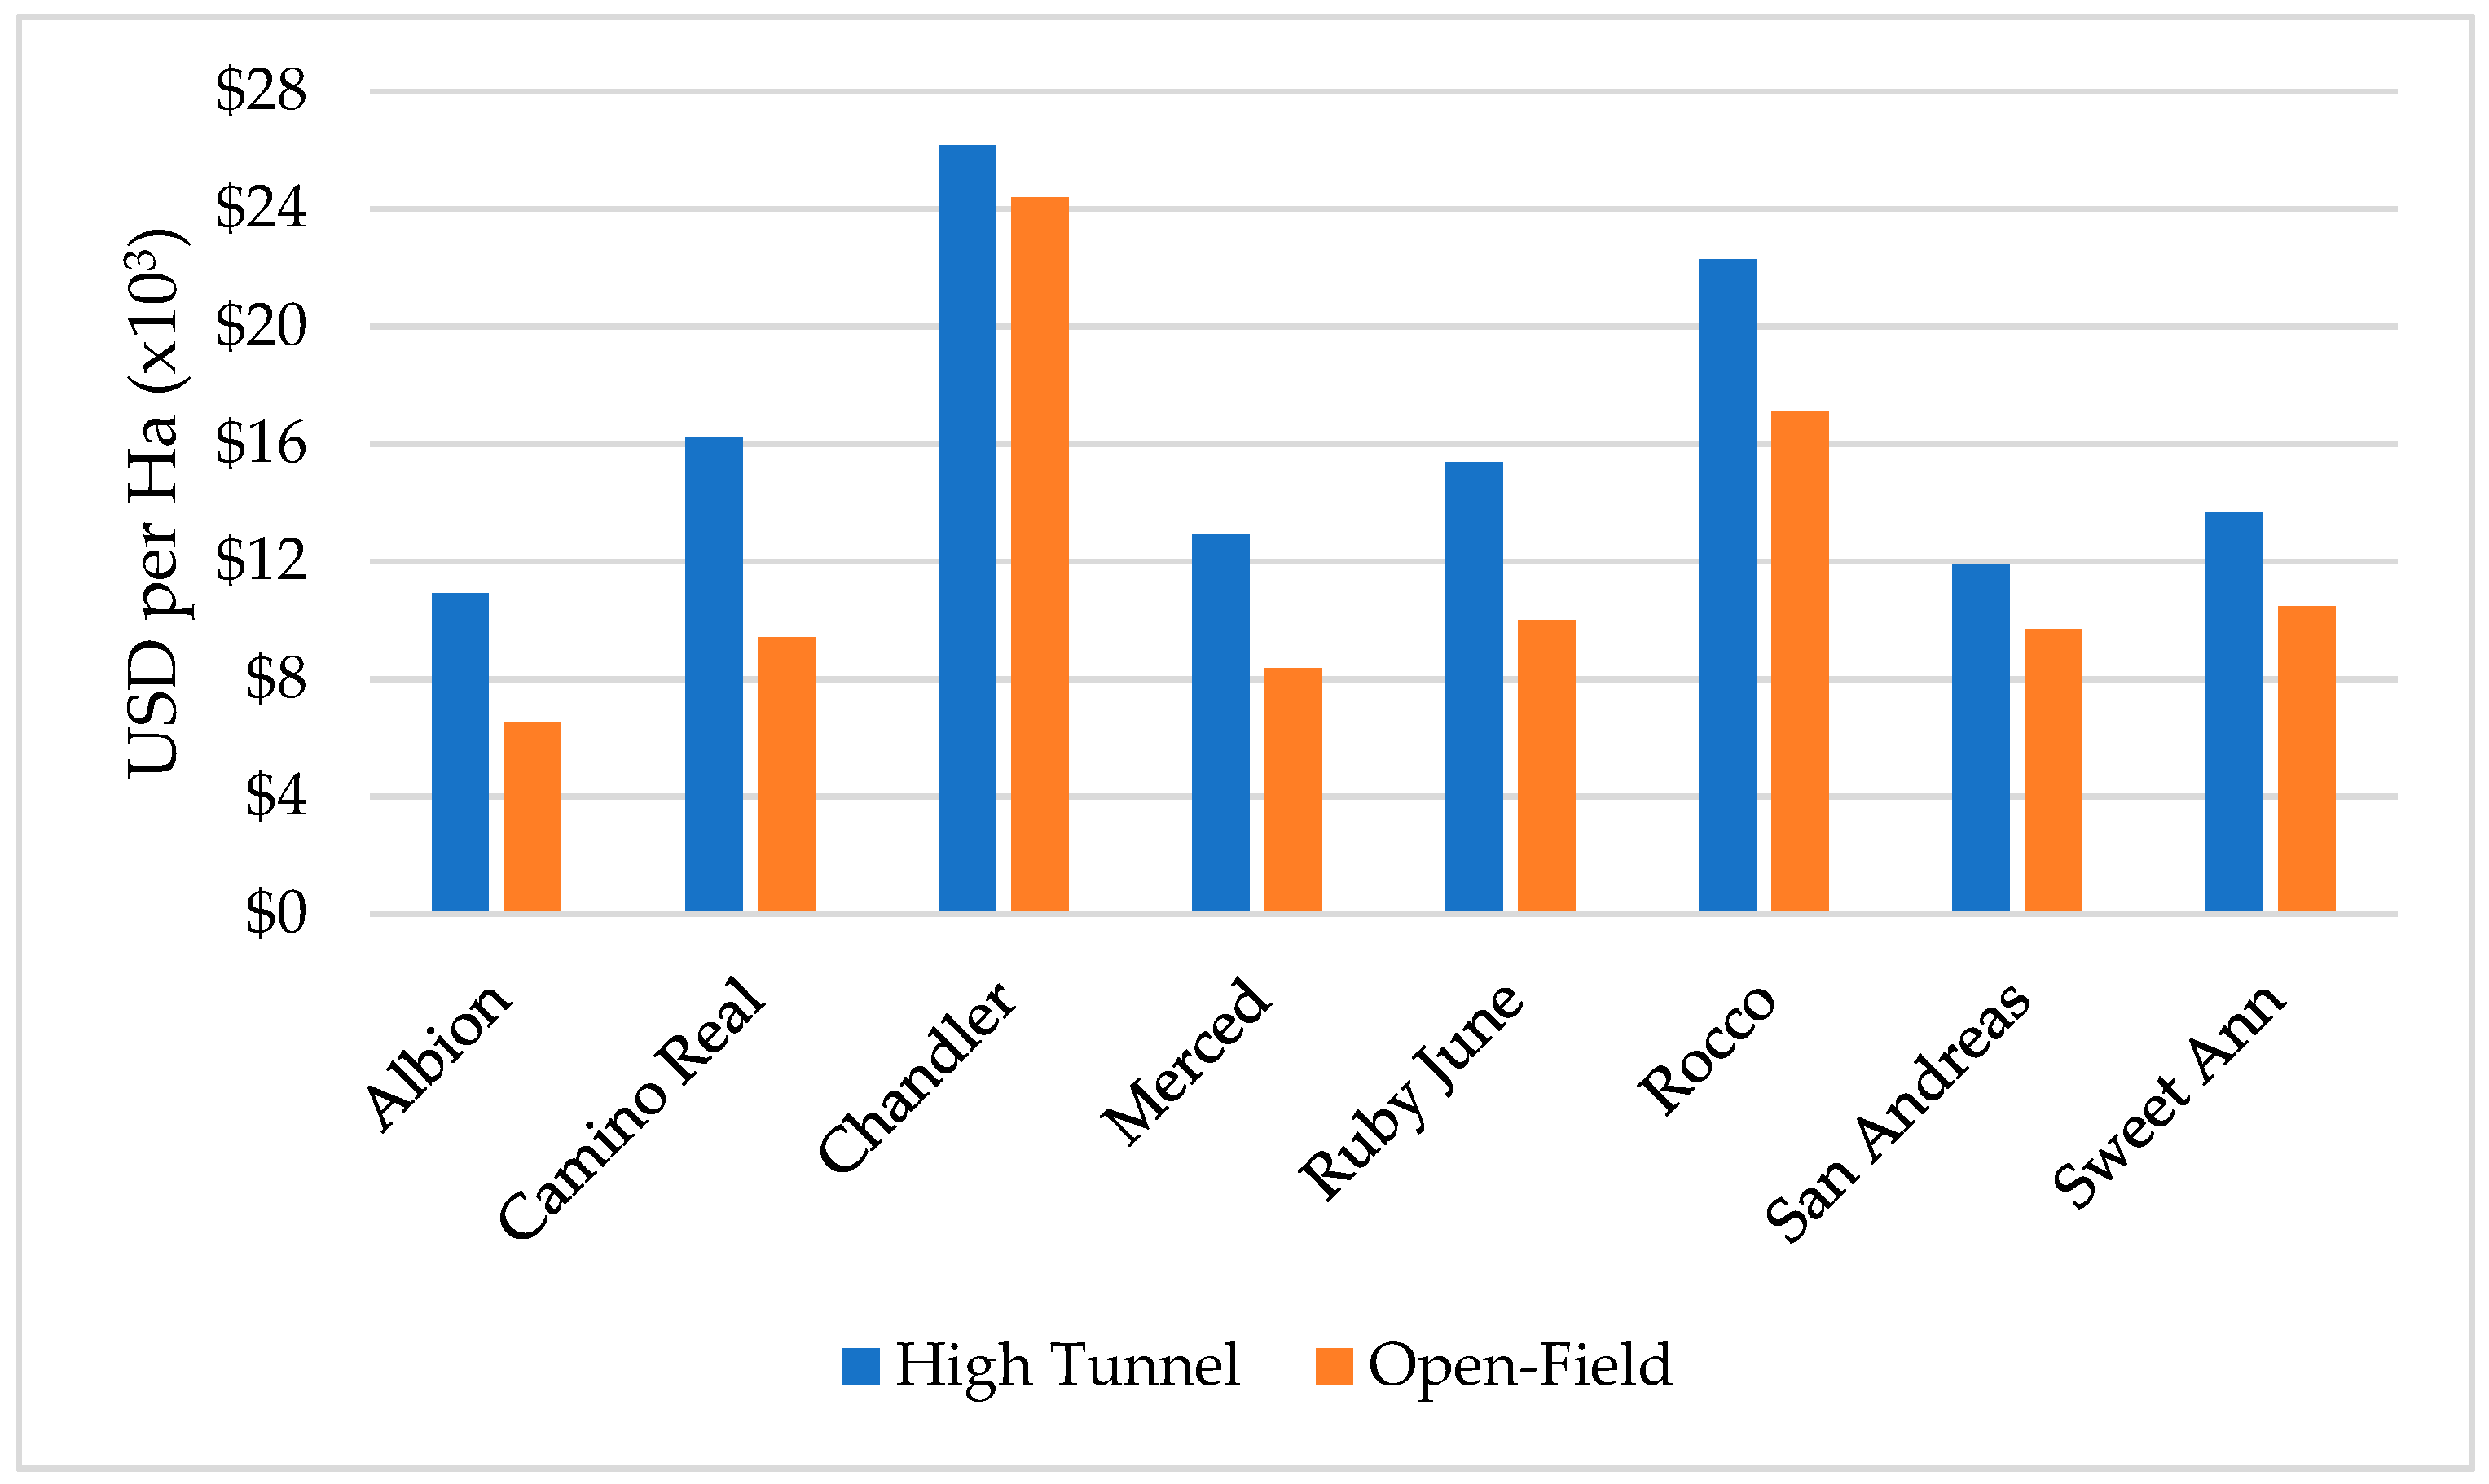
Table A2). A major reason for the higher cost is the overhead cost of the high tunnel structure, which makes up almost half of the total cost of high tunnel production. Second, as a result, the early season strawberry yields and revenues generated from high tunnel production compared to open-field production were not enough to offset the higher cost of owning the high tunnel structure for any of the three marketing prices used in this study. In fact, average yields from the high tunnel were lower than from the open-field (Table 1 and Table 2).
The lower yields in the high tunnel compared to the open-field corroborates the findings from a Tennessee study that spring-bearing open-field strawberries produced higher yields than winter and spring-bearing high-tunnel strawberries [16]. One possible reason for lower high tunnel yields during our trials is herbicide and disease damage resulting from cooler conditions in winter and warmer conditions in spring. Early fruiting in the high tunnel when conditions were cooler favored the development of diseases in the high tunnel at the time when there were no fruits in the open-field. Forcing strawberries to bear fruit during the winter months can be a drawback as yield is reduced compared to traditional spring production [27].
The warm conditions in the high tunnel during the spring compared to the open-field environment favored pests and led to lower yields. This is similar to what Martin reported that warm winter temperatures provided insects an overwintering location in the high tunnel and caused more damage to the berries during winter and spring production [16]. Leach and Isaacs [18] also reported higher pest pressure in high tunnel raspberries compared to open-field production while Ingwell et al. [28] also observed a higher pest prevalence in high tunnels compared to open-field plots in a study of tomatoes, cucumbers, and broccoli. Rodents are also attracted to warm conditions in the high tunnel during winter and feed on high tunnel crops [29]. Overhead irrigation was used in our study to protect the plants from frost, insect damage, and diseases, but it is clear that the yield loss was enlarged compared to open-field production.
Galitano and Miles [11] also reported a lower profit from lettuce produced in the high tunnel than in the open-field. The net revenue from lettuce produced in the high tunnel was 30% less per square meter than the net revenue from producing in the open-field. The higher yield from the high tunnel observed in their study was insufficient to offset the increased costs. This finding suggests that even higher yields in the high tunnel would not have been a sufficient condition to guarantee higher net revenues at a low wholesale price, but it might have at higher prices for other marketing strategies. Results from previous studies as well as this study suggest greater attention needs to be given to managing strawberry production under high tunnels especially with respect to pest management.
Focusing on the open-field, where net-revenues were always positive, ‘Rocco’ and ‘Sweet Ann’ would be the best choices for U-pick and pre-pick retail due to higher net revenues (Figure 5b,c). Their yields are higher than ‘Chandler’ yields although the differences are not statistically significant (Table 1). However, these cultivars are not suitable for shipping making them less suited to pre-pick wholesale operations. Additionally, although data from research and on-farm trials shows that yield from ‘Rocco’ is similar to that of ‘Chandler’, it is still a new cultivar [20]. ‘Sweet Ann’ does not tolerate rain events very well due to its thin fruit skin. It did well in the outdoor environment in our trial because low rain events and intensity were recorded this season. During harvest seasons when there are high rainfall events and intensity, this cultivar may not yield the same amount of marketable yield. ‘Chandler’, which ranked third in open-field net revenues for pre-pick retail and U-pick, has been grown by southeastern growers for a long time, and it has been among the top cultivars with high yields [30] making it favorable for U-pick and pre-pick retail operations. ‘Camino Real’ ranked fifth in open-field net revenues. Previous studies reported that it can yield as well or better than ‘Chandler’ in different regions of Eastern Virginia [31]. The high yield potential, rain resistance, ease of picking, and good shipping ability makes ‘Camino Real’ a favorable cultivar for pre-pick wholesale.

5. Conclusions

In this paper, we study and compare cost, revenues, and net revenues from eight strawberry cultivars produced under a high tunnel and in the open-field in the Commonwealth of Virginia. We find that producing in the high tunnel was not profitable for three marketing strategies: pre-pick with wholesale marketing, pre-pick with retail marketing, and U-pick whereby consumers pick strawberries.
The total production cost (including harvest, ownership, and administrative costs) for the high tunnel averaged $112,223 ($45,415 ac−1) and $99,276 ($40,175 ac−1) for pre-pick and U-pick, respectively, and for the open-field averaged $38,204 ($15,460 ac−1) and $28,608 ($11,577 ac−1) for pre-pick and U-pick, respectively. Revenues from all eight cultivars were lower in the high tunnel than in the open-field, regardless of whether strawberries were sold at a wholesale, retail, or U-pick price. This is a result of lower marketable yields from the high tunnel compared to the open-field. High tunnel net revenues were negative for all cultivars and marketing strategies, except for ‘Camino Real’ and ‘Merced’. The net revenue from ‘Camino Real’ was positive at pre-pick-retail and U-pick prices, and the net revenue from ‘Merced’ was positive at a pre-pick retail price. In contrast, net revenues from open-field were positive for all cultivars and marketing strategies. On average, net revenue was $101,893, $127,253, and $109,788 ha−1 ($41,235, $51,498, and $44,430 ac−1) higher in the open-field than in the high tunnel for pre-pick wholesale, pre-pick retail, and U-pick marketing, respectively.
Study results imply that growers should focus on open-field production of strawberries rather than under a high tunnel. The most promising cultivars in terms of net returns from open-field production are ‘Rocco’, ‘Sweet Ann’, ‘Chandler’, and ‘Camino Real’. However, ‘Rocco’ has limitations for shipping and ‘Sweet Ann’ has limitations due to sensitivity to damage from rain events. A limitation to this study was that the economic data was run on a field trial based on a single growing season, i.e., 2019–2020 growing season. Replicating the study might provide additional insights into the effects of growing season conditions on the differences in yields from high tunnel and open-field production.
Further research is also warranted to develop an improved production system for strawberries under high tunnels. Disease and insect pest management methods need to be adapted to the high tunnel production environment in order to produce the increased yields needed to offset the overhead costs of the high tunnel structure. Harvest costs reported in this study may be higher than those realized by commercial growers because of experimental methods used to record our harvest labor. Labor inputs were reported for small plots, and experiment workers harvested all berries, including non-marketable yields. Harvest workers on a commercial operation may be more efficient, resulting in lower harvest labor costs, which could be corroborated with further research. Additionally, further research is needed to evaluate the relative profitability of the three marketing strategies: U-pick, retail, and wholesale. Such study should consider all marketing costs for each marketing strategy.

Author Contributions

Co-authors were involved in the manuscript preparation as follows: Conceptualization, J.B.S. and D.J.B.; Methodology, J.C.M. and D.J.B.; Software, J.C.M.; Validation, J.C.M., D.J.B. and J.B.S.; Formal Analysis, J.C.M. and D.J.B.; Investigation, J.C.M., D.J.B. and J.B.S.; Resources, D.J.B. and J.B.S.; Data Curation, J.C.M., D.J.B. and J.B.S.; Writing—Original Draft Preparation, J.C.M.; Writing—Review and Editing, J.C.M., D.J.B. and J.B.S.; Visualization, J.C.M.; Supervision, D.J.B. and J.B.S.; Project Administration, J.B.S. and D.J.B.; Funding Acquisition, J.B.S. and D.J.B. All authors have read and agreed to the published version of the manuscript.

Funding

This research was funded in part by the United States Department of Agriculture (USDA), Specialty Crop Grant Block (Grant# 418963). Additional field research support was provided by USDA NIFA Hatch Project VA-160077. Staff and faculty salary and support were provided by the Virginia Agricultural Experiment Station (Blacksburg) and USDA NIFA Hatch Project 1016661.

Institutional Review Board Statement

Not applicable.

Informed Consent Statement

Not applicable.

Data Availability Statement

The data presented in this study are available in https://ext.vt.edu/small-fruit.html (accessed on 17 November 2022).

Acknowledgments

The authors would like to thank Hampton Roads AREC farm: Robert Holtz for field assistance and Danyang Liu and Sophia Gonzales for their contribution in gathering and recording data from strawberry cultivar trials. The authors would also like to thank Barclay Poling, Roy D. Flanagan, and Stephanie Romelczyk for their feedback on the budgets used in this article, and Shamar Stewart and Ford Ramsey for their helpful suggestions on data visualization and the statistical estimations, respectively. The authors are grateful for funding received from the Virginia Tech Open Access Subvention Fund to cover article processing costs.

Conflicts of Interest

The authors declare no conflict of interest. The funders had no role in the design of the study; in the collection, analyses, or interpretation of data; in the writing of the manuscript, or in the decision to publish the results.

Appendix A

Table A1. Strawberry gross revenues (estimated yield ∗ estimated price) in USD per hectare by cultivar and marketing strategy in the high tunnel and open-field environment.
Pre-Pick WholesalePre-Pick RetailU-Pick
CultivarHigh TunnelOpen-FieldDifferenceHigh TunnelOpen-FieldDifferenceHigh TunnelOpen-FieldDifference
Albion36,24847,52111,27371,02791,74320,71552,19767,42015,223
Camino Real73,28974,4841195140,943143,3732430103,577105,3631786
Chandler47,57189,92742,35791,560174,42882,86767,286128,18460,898
Merced58,84071,91413,074114,287138,36724,08183,987101,68417,697
Ruby June56,36862,7316363109,572120,35510,78380,52388,4477924
Rocco43,803106,24562,44283,916202,718118,80361,668148,97587,306
San Andreas44,92776,61331,68687,158146,79359,63564,051107,87643,825
Sweet Ann40,12294,71954,59678,117184,670106,55357,407135,71178,304
Average50,14678,01927,87397,073150,30653,23371,337110,45739,120
Min36,24847,521119571,02791,743243052,19767,4201786
Max73,289106,24562,442140,943202,718118,803103,577148,97587,306
Table A2. Strawberry production costs in USD per hectare (including administrative cost) by cultivar and marketing strategy in the high tunnel and open-field environment.
Pre-PickU-Pick
CultivarHigh TunnelOpen-fieldDifferenceHigh TunnelOpen-fieldDifference
Albion106,96332,74774,21698,22327,51670,707
Camino Real112,25435,63576,61999,28228,09471,188
Chandler122,20950,59071,618101,27331,08570,188
Merced108,94934,57374,37698,62127,88270,739
Ruby June111,42436,19675,22899,11628,20670,909
Rocco118,32743,30575,022100,49629,62870,868
San Andreas107,95335,90272,05198,42128,14770,274
Sweet Ann109,71036,68273,02898,77328,30370,469
Average112,22338,20474,02099,27628,60870,668
Min106,96332,74771,61898,22327,51670,188
Max122,20950,59076,619101,27331,08571,188
Table A3. Strawberry net revenues in USD per hectare (gross revenues—production costs) by cultivar and marketing strategy in the high tunnel and open-field environment.
Pre-Pick WholesalePre-Pick RetailU-Pick
CultivarHigh TunnelOpen-FieldDifferenceHigh TunnelOpen-FieldDifferenceHigh TunnelOpen-FieldDifference
Albion−70,71414,77485,489−35,93558,99694,931−46,02639,90485,930
Camino Real−38,96538,84977,81428,689107,73879,049429577,26872,973
Chandler−74,63839,337113,975−30,648123,837154,486−33,98697,099131,085
Merced−50,10937,34287,4505338103,79598,457−14,63373,80288,436
Ruby June−55,05626,53581,591−185184,16086,011−18,59360,24178,834
Rocco−74,52462,940137,464−34,411159,413193,825−38,828119,347158,174
San Andreas−63,02640,711103,737−20,795110,891131,686−34,37079,728114,099
Sweet Ann−69,58758,037127,624−31,593147,988179,581−41,366107,408148,774
Average−62,07739,816101,893−15,151112,102127,253−27,93881,850109,788
Min−74,63814,77477,814−35,93558,99679,049−46,02639,90472,973
Max−38,96562,940137,46428,689159,413193,8254295119,347158,174

References

  1. National Agricultural Statistics Service, USDA. Noncitrus Fruits and Nuts 2018 Summary 06/18/2019; USDA: Washington, DC, USA, 2019; p. 101.
  2. Samtani, J.B.; Rom, C.R.; Friedrich, H.; Fennimore, S.A.; Finn, C.E.; Petran, A.; Wallace, R.W.; Pritts, M.P.; Fernandez, G.; Chase, C.A.; et al. The Status and Future of the Strawberry Industry in the United States. HortTechnology 2019, 29, 11–24. [Google Scholar] [CrossRef] [Green Version]
  3. Agricultural Marketing Resource Center. Strawberries. Available online: https://www.agmrc.org/commodities-products/fruits/strawberries (accessed on 31 August 2021).
  4. USDA ERS—Charts of Note. Available online: https://www.ers.usda.gov/data-products/charts-of-note/charts-of-note/?page=3&topicId=14849 (accessed on 31 August 2021).
  5. U.S. Strawberry Consumption Continues to Grow. Available online: http://www.ers.usda.gov/data-products/chart-gallery/gallery/chart-detail/?chartId=77884 (accessed on 31 August 2021).
  6. Vogel, S. Number of U.S. Farmers’ Markets Continues to Rise. Available online: http://www.ers.usda.gov/data-products/chart-gallery/gallery/chart-detail/?chartId=77600 (accessed on 14 December 2021).
  7. Christman, J.; Samtani, J.B. A Survey of Strawberry Production Practices in Virginia, 1st ed.; Virginia Cooperative Extension: Blacksburg, VA, USA, 2019. [Google Scholar]
  8. Strawberry Fact Sheet 2020. Available online: https://www.vbgov.com/government/departments/agriculture/Documents/Fact%20Sheets/Strawberry%20Fact%20Sheet%202020.pdf (accessed on 1 September 2021).
  9. Kaiser, C.; Ernst, M. High Tunnel Overview; Cooperative Extension Serivice; College of Agriculture, Food and Environment, University of Kentucky: Lexington, KY, USA, 2021; Available online: https://www.uky.edu/ccd/sites/www.uky.edu.ccd/files/hightunneloverview.pdf (accessed on 10 September 2021).
  10. Rowley, D.; Black, B.L.; Drost, D.; Feuz, D. Early-season Extension Using June-bearing ‘Chandler’ Strawberry in High-elevation High Tunnels. HortScience 2010, 45, 1464–1469. [Google Scholar] [CrossRef] [Green Version]
  11. Galinato, S.P.; Miles, C.A. Economic Profitability of Growing Lettuce and Tomato in Western Washington under High Tunnel and Open-field Production Systems. HortTechnology 2013, 23, 453–461. [Google Scholar] [CrossRef] [Green Version]
  12. Maughan, T.L.; Curtis, K.R.; Black, B.L.; Drost, D.T. Economic Evaluation of Implementing Strawberry Season Extension Production Technologies in the U.S. Intermountain West. HortScience 2015, 50, 395–401. [Google Scholar] [CrossRef]
  13. Hecher, E.A.D.S.; Falk, C.L.; Enfield, J.; Guldan, S.J.; Uchanski, M.E. The Economics of Low-cost High Tunnels for Winter Vegetable Production in the Southwestern United States. HortTechnology 2014, 24, 7–15. [Google Scholar] [CrossRef] [Green Version]
  14. Waterer, D. Yields and Economics of High Tunnels for Production of Warm-season Vegetable Crops. HortTechnology 2003, 13, 339–343. [Google Scholar] [CrossRef] [Green Version]
  15. Lamont, W.J. Overview of the Use of High Tunnels Worldwide. HortTechnology 2009, 19, 25–29. [Google Scholar] [CrossRef] [Green Version]
  16. Martin, J. The Influence of Organically Managed High Tunnel and Open Field Production Systems on Strawberry (Fragaria x ananassa) Quality and Yield, Tomato (Solanum lycopersicum) Yield, and Evaluation of Plastic Mulch Alternatives. Master’s Thesis, University of Tennessee, Knoxville, TN, USA, May 2013. Available online: https://trace.tennessee.edu/utk_gradthes/1642 (accessed on 2 September 2021).
  17. Rodríguez, H.G.; Popp, J.; Thomsen, M.; Friedrich, H.; Rom, C.R. Economic Analysis of Investing in Open-field or High Tunnel Primocane-fruiting Blackberry Production in Northwestern Arkansas. HortTechnology 2012, 22, 245–251. [Google Scholar] [CrossRef] [Green Version]
  18. Leach, H.; Isaacs, R. Seasonal Occurrence of Key Arthropod Pests and Beneficial Insects in Michigan High Tunnel and Field Grown Raspberries. Environ. Entomol. 2018, 47, 567–574. [Google Scholar] [CrossRef] [PubMed]
  19. Demchak, K. Small Fruit Production in High Tunnels. HortTechnology 2009, 19, 44–49. [Google Scholar] [CrossRef]
  20. Fernandez, G.; Pattison, J.; Perkins-Veazie, P.; Ballington, J.R.; Clevinger, E.; Schiavone, R.; Gu, S.; Samtani, J.; Vinson, E.; McWhirt, A.; et al. ‘Liz’ and ‘Rocco’ Strawberries. HortScience 2020, 55, 597–600. [Google Scholar] [CrossRef] [Green Version]
  21. Lassen Canyon Nursery. Ruby June Studies by Barclay Poling. 9 June 2017. Available online: https://www.lassencanyonnursery.com/ruby-june-studies-barclay-poling/ (accessed on 2 September 2021).
  22. Office of Research. The UC Patented Strawberry Cultivars. Available online: https://research.ucdavis.edu/industry/ia/industry/strawberry/cultivars/ (accessed on 2 September 2021).
  23. Anonymous. Strawberry Varieties Released. Plantbreeding, 10 May 2017. Available online: https://plantbreeding.ucdavis.edu/strawberry-varieties-released (accessed on 2 September 2021).
  24. Rysin, O.; Poling, B.; Louws, F. Budgets/Cost Estimates. Available online: https://strawberries.ces.ncsu.edu/strawberries-budgets/ (accessed on 2 September 2021).
  25. Internal Revenue Service. Farmer’s Tax Guide for Use in Preparing 2012 Returns. 23 October 2012. Available online: https://www.irs.gov/pub/irs-prior/p225--2012.pdf (accessed on 14 December 2021).
  26. Kadir, S.; Carey, E.; Ennahli, S. Influence of High Tunnel and Field Conditions on Strawberry Growth and Development. HortScience 2006, 41, 329–335. [Google Scholar] [CrossRef] [Green Version]
  27. Dufault, R.J.; Ward, B.K. Further Attempts to Enhance Forced ‘Sweet Charlie’ Strawberry Yield through Manipulation of Light Quality in High Tunnels. Int. J. Fruit Sci. 2009, 9, 409–418. [Google Scholar] [CrossRef]
  28. Ingwell, L.L.; Thompson, S.L.; Kaplan, I.; Foster, R.E. High tunnels: Protection for rather than from insect pests? Pest Manag. Sci. 2017, 73, 2439–2446. [Google Scholar] [CrossRef] [PubMed]
  29. Maughan, T.; Ernst, T.; Black, B.; Drost, D. Defending the Castle: Integrated Pest Management in High Tunnel Strawberries; Utah State University Extension: Logan, UT, USA, 2012; Available online: https://digitalcommons.usu.edu/extension_curall/1054 (accessed on 2 September 2021).
  30. Flanagan, R.D.I. Strawberry Cultivar Evaluation on Farms Utilizing Conventional Growing Methods in the Coastal Plain of Virginia. May 2017. Available online: https://vtechworks.lib.vt.edu/handle/10919/78317 (accessed on 2 September 2021).
  31. Flanagan, R.D.; Samtani, J.B.; Manchester, M.A.; Romelczyk, S.; Johnson, C.S.; Lawrence, W.; Pattison, J. On-farm Evaluation of Strawberry Cultivars in Coastal Virginia. HortTechnology 2020, 30, 789–796. [Google Scholar] [CrossRef]
Figure 1. High tunnel (a) and open-field (b) gross revenues in USD per hectare for eight strawberry cultivars marketed at a wholesale price.
Horticulturae 08 01139 g001
Figure 2. Kernel density estimates for high tunnel (a) and open-field yields (b).
Horticulturae 08 01139 g002
Figure 3. Estimated production costs in USD per hectare for every strawberry production stage in the high tunnel (a) and open-field (b). Labor for the ‘harvest production stage’ does not include labor for picking berries.
Horticulturae 08 01139 g003
Figure 4. Harvest labor cost in USD per hectare for high tunnel and open-field cultivars and for a pre-pick operation.
Horticulturae 08 01139 g004
Figure 5. Net revenues in USD per hectare from strawberries produced under a high tunnel and in the open-field and marketed at a (a) pre-pick wholesale, (b) pre-pick retail, and (c) U-pick price.
Horticulturae 08 01139 g005aHorticulturae 08 01139 g005b
Table 1. Estimated average yield (kg ha−1) from strawberry cultivars produced in the high tunnel with ‘Chandler’ as the base category.
EstimateStd. Errort ValuePr (>|t|)
Intercept772510987.042.82 × 10−7 ***
Albion−16861552−1.090.288
Camino Real416715522.680.013 *
Merced191715521.240.229
Ruby June152015520.980.337
Rocco−6451552−0.420.681
San Andreas−3711552−0.240.813
Sweet Ann−11491552−0.740.466
Signif. codes: ‘***’ 0.001, ‘*’ 0.05.
Table 2. Estimated average yield (kg ha−1) from strawberry cultivars produced in the open-field with ‘Chandler’ cultivar as the base category.
EstimateStd. Errort ValuePr (>|t|)
Intercept14,527121511.951.36 × 10−11 ***
Albion−68071719−3.960.000582 ***
Camino Real−29631719−1.720.097579
Merced−32521719−1.890.070599
Ruby June−51181719−2.980.006545 **
Rocco135117190.790.439687
San Andreas−25761719−1.500.146967
Sweet Ann91917190.540.597786
Signif. codes: ‘***’ 0.001, ‘**’ 0.01.
Publisher’s Note: MDPI stays neutral with regard to jurisdictional claims in published maps and institutional affiliations.

